Embed Size (px)
Citation preview

.JREPORT:
.--<-.
,",. _.".\)..";: .- -. -..~ ~. ..
·.FO.R··i
~-
~.. . ~ -
. .. .. .
, ,
. -'
H;AWAll GEOTHERMAL:.,
'(3'",. . '.';.'
'. . .,' ....; <. - ~ ,

THE HAWAII GEOTHERMAL PROJECT
SUMMARY REPORT FOR PHASE I
May 1975
SUPPORT FOR PROJECT PROVIDED BY:National Science Foundation
Energy Research and Development AdministrationState of Hawaii
County of Hawaii
************
Management - Coordination
Geophysical Program
Engineering Program
EnvironmentalSocioeconomic Program
Drilling Program
John W. Shupe
Augustine S. Furumoto
Paul C. Yuen
Robert M. Kamins
Agatin T. Abbott
************----- --------
r----NOTlCE--_---,
This report was prepared as an account of worksponsored by the United States Government. Neither theUnited States nor the United States Department ofEnergy, nor any of their employees, nor any of theircontractors, subcontractofl. or their employees, makes~ny. ~arranty I express or implied, or assumes any legalhablhty or responsibility for the accuracy. completenessor usefulness of any information, apparatus, product orprocess disclosed, or represents that its use would notinfringe privately owned rights.
University of HawaiiHolmes Hall 240 2540 Dole Street
Honolulu, Hawaii 96822

. .
HAWAII GEOTHERMAL PROJECT. SUMMARY REPORT FOR PHASE I
TABLE OF CONTENTS
FOREWORD. .
OVERVIEW OF PHASE I
MANAGEMENT - COORDINATIONOverview of Project ManagementHGP Personnel Summary. . . . . .. ...Program Planning and Expenditur~ Schedule.Selection of a Drilling SitePublications.
GEOPHYSICAL PROGRAMIntroduction. . ..A Narrative of the Exploration Program
Introduction .Proposals and Plans . . . . . . . . . .Organization of the Exploration Program.Overview of Field Work. . . . . . . . .. .Chronological Progress of the Exploration ProgramConcluding Thoughts .
Task 2.1 Photogeologic Survey: Imagery from InfraredScanning of the Rift Zones of Kilauea
Introduction : .Flight Paths and Descriptions .
Task 2.2 Geoelectric Surveys on Hawaii: 1973-1975Introduction .Conclusion .Reconnaissance Results .Results from Puna, A Geothermal Anomaly .
Task 2.2A Electrical Resistivity Survey' Conductedby G. V. Ke 11 er . . . . . . . . . . . . . . . . . . .
Task 2.3A Gravity Survey to Determine Dike Complex Size.Task 2.3B Puna Magnetics .Task 2.4 Well Temperature Survey .Task 2.5A Results of the Microearthquake Survey and
. Seismic Studies of the Lower East Rift.Task 2.5B Ground-noise Survey .Task 2.6 Geochemical Studies .Integration of Geophysical Data .
Introduction. . . . . . . . . . . . . ..The Structure of the Dike Complex or Intrusive ZoneThe Hydrothermal Process of the East RiftConcluding Remarks.References. . . . . . . . . . . . . . . . . . . . .
Page
i
1
66
11121415
161616161618192228
2929293232323337
48505459
626668747474768080 ..

o
~Q
o
o
o
o
o
o
o
o~
o
ENGINEERING PROGRAM . . . . . . . . . . . . . .Introduction .Task 3.1 Geothermal Reservoir Engineering
Introduction .Numerical Modelling of Geothermal Reservoirs.
Steady Free Convection in an UnconfinedRectangular Geothermal Reservoir....
The Effects of Vertical Heat Sources on theUpwelling of Water Table .
Free £onvection at High Rayleigh Number inConfined Geothermal Reservoirs ..
Well Testing and Analysis .The Nature of a Geothermal ReservoirWell Measurement and Analysis ..
Physical Modelling .Task 3.1 References .
Task 3.6 Optimal Geothermal Plant Design..Introduction .Vapor Flashing Plants .
Selecting Flashing Pressures ..Optimum Wellhead Pressure .Heat Balance of a Hypothetical Plant ..Using Deep Ocean Water as Cooling Water.
Binary Fluid, Vapor Turbine Cycles .Simultaneous Fresh Water Production and
Electrical Power Generation . .. .Computer Simulation of Binary,Fluid, Vapor
Turbine Cycles .Selection of a Working Fluid .Parametric Study of a Vertical Counterflow
Heat Exchanger..Task 3.6 References ...
ENVIRONMENTAL-SOCIOECONOMIC PROGRAMSummary .Task 4.1 Environmental .
Ground Water Analysis .Checklist of Decision Points, Including
Environmental Controls .Task 4.2 Legal and Regulatory .
Lega 1 Regime for Geothermal ResourcesRegulation of Geothermal Production ..Right-of-Entry for Drilling .
Task 4.4 Economics .Data Gathering: Hawaii Energy Situation. .Data Gathering: Geothermal Production Elsewhere.Annotated Bibliography .Non":'e 1ectri ca1 Uses of Geotherma1 Resources . . .'Input-Output Analysis of New Energy Source Impact
Publications Generated by the Socioeconomic Program.
DRILLING PROGRAM .Resume of Activities of the Site Selection Committee
Page
8181838383
85
86
899898
102108110
. 113113113113114117120123
123
129131
134141
142142142.. 142
143145145146147147147148148148148156
157157

HAWAII GEOTHERMAL PROJECT
SUMMARY REPORT FOR PHASE I
FOREWORD
The Hawaii Geothermal Project (HGP) was established to focus the resourcesof the State and the University of Hawaii on a coordinated research effortleading to the development of geothermal power on the Big Island of Hawaii.
Phase I of the Project was initiated in the summer of 1973 with a $252,000gran.t from NSF-RANN (National Science Foundation-Research Applied to NationalNeeds), supplemented by $100,000 each from the State and the County of Hawaii.This $452,000 budget was organized into a multidisciplinary research effortin the following program areas: (1) Geophysical - exploratory surveys todefine the most favorable areas for geothermal investigations; (2) Engineering- analytical models to assist in interpretation of geophysical results, andstudies on energy recovery from hot brine; and (3) Socioeconomic - legal andregulatory aspects of ownership and administration of geothermal resources,and economic planning studies on the impact of geothermal power.
Two additional grants totaling $336,000 were received from NSF-RANN,which have provided operational support for the Project through April 1975.These funds were used: a) to continue the exploratory surveys and supportprograms in Phase I; b) to begin the establishment of environmental baselines; and c) to initiate planning for Phase II -- the research drillingprogram. During Phase I a total of $39,000 also was received from a varietyof public and private sources, and has provided the necessary flexibility tomeet emergencies and opportunities that arose.
On April 10, 1975, notice was received from ERDA (Energy Research andDevelopment Administration) that an HGP proposal for $1,064,000 had beenapproved, of which $580,000 was earmarked for a research geothermal well.In addition, the State Legislature allocated $500,000 for exploratorygeothermal drilling, and the Hawaiian Electric Company has contributed$20,000 to assist with the drilling program. Plans have been initiated foreffective utilization of these funds, and drilling of a research hole in thePuna Area of the Island of Hawaii will commence in October 1975, with theobjective to obtain intermittent cores and scientific data to a depth of6000 feet.
i

~o
o
o
o
o
o
o
o
May 1, 1975, has been established rather arbitrarily as the beginningof Phase II, the research drilling program. Although the majority of theresearch projects of Phase I will continue into Phase II, and much of thegeophysical data taken during this period remains to be fully analyzed andinterpreted, May 1 represents both a two-year anniversary date and thetransition from NSF to ERDA funding. Therefore, it seems an appropriate timeto prepare this progress report on Phase I of the Hawaii Geothermal Project.
The bulk of this report has been prepared by the program directors andtheir research staffs and, except for minor editing, their statements appearas submitted by:
Geophysical Program -- Augustine S. FurumotoEngineering Program -- Paul C. YuenEnvironmental-Socioeconomic Program -- Robert M. KaminsDrilling Program -- Agatin T. Abbott
These program reports present summaries of results obtained to date ineach of the research areas, and include lists of reference publications wherethese results are reviewed in greater detail. The statements by the programdirectors are quite candid, reflecting some difference of opinion both inoverall program strategy and in the interpretation of data. Although noeffort is made in this report to minimize or to resolve these differences,the Management Section does include the rationale for proceeding with aresearch drilling program and for choosing the selected drilling site.
From the beginning, the Hawaii Geothermal Project has received bothencouragement and financial support from Federal, State, and County governments -- as well as from the business community, the utilities, and publicinterest groups. Although it is still premature to state whether aconventional geothermal field with commerci~l potential will be identified,the Project has and will continue to make definite contributions to thestate-of-the-art for locating, developing, and utilizing geothermal resources.As the Project moves into the research and exploratory drilling program, abetter understanding will result of the possible role of geothermal power inhelping to develop an appropriate level of energy self-sufficiency for Hawaii.
John W. Shupe, DirectorHawaii Geothermal ProjectMay 22, 1975
ii

HAWAII GEOTHERMAL PROJECT
OVERVIEW OF PHASE I
The State of Hawaii, which geographically consists of an island chainstretchin~ across 350 miles of the Central Pacific and separated from themainland United States by over 2,000 miles of that same ocean, is totallydependent for energy on seaborne petroleum. Hawaii has no known fossil fuelreserves; there is no coal coming into the State by rail; no natural gas pipeline; and no regional electric grid to interconnect its electrical systemswith those of other states or even with its separate islands. This completelack of flexibility makes Hawaii particularly vulnerable to dislocations inthe global energy market resulting from real or imagined shortages of petroleum. This is a travesty, since the State is generously endowed with avariety and abundance of natural energy resources: geothermal, solarradiation, ocean temperature differential, wind, waves, and ocean currentsall potential non-polluting power sources.
The candidate from among these natural energy sources which shows thehighest promise for early power generation at commercial levels is geothermal energy. In Hawaii there is an interesting variety of subsurface heatanomalies wihch may exist as: (1) molten magma, (2) hot dense rock, (3) hotporous rock, (4) geothermal steam, and (5) hot water. Any or all of thesesources may occur in the proximity of 40°F deep-ocean water, adding to theflexibility in developing effective energy systems.
The Hawaii Geothermal Project (HGP) was organized to focus the resourcesof the University, the State, and the County of Hawaii on the identification,generation, and utilization of geothermal energy on the Big Island of Hawaii.Figure 1 shows the five volcanoes which form this largest island in theHawaiian chain. Hawaii is also the youngest of the islands and is stillexperiencing growth from recent activity of the' Mauna Loa and Ki 1aueavolcanoes, so represents the island with the greatest amount of heat at ornear the earth's surface. Consequently, the Big Island was selected as thesite for initial geothermal, exploration.
The research program as developed by the HGP involves an interdisciplinary team of researchers from throughout the University system which conductscientific investigations on short-range exploratory and applied technologytasks to assist in the early development of any conventional geothermal
-1-

o
o
o
o
o
o
o
o 10 20 MILESI I I
CONTOUR INTERVAL2000 FEET
19°--+-----~::----+_------_l_---
o
o
o
VOLCANOES a RIFT ZONES. ON THEISLAND OF HAWAII
Figure 1
-2-

resource -- steam or hot water -- that may exist on th.e Big Isl and, as well ..as long-range research studies of a more basic nature. The short-range(within the next ten years) goals and objectives of the HGP, many of whichwill contribute to the technology base for the recovery of energy from sub-surface heat, no matter where it occurs, include:
1. Improvement of geophysical survey techniques for locatingunderground heat sources.
2. Experimentation with deep-drilling techniques for verifyingand exploiting subsurface heat.
3. Development of efficient, environmentally clean systems forconversion of underground heat resources to useful energy.
4. Completion of socioeconomic and legal studies to assist inland use regulations and resource utilization.
5. Establishment of environmental baselines with which to monitorsubsequent geothermal development.
6. Identification of potential geothermal resources, initiallyon the Big Island, but ultimately for the entire island chain.If a conventional geothermal resource suitable for the production of electricity is discovered, then the HGP will assistwith the development of the geothermal production field and aprototype power plant on the Big Island, which could serve. asa National Geothermal Energy Laboratory on technological developments in power production and reservoir management of earth heatresources in a volcanic geological area. If no conventionalgeothermal resource at sufficient temperature and volume forpower generation is identified, then the HGP will: a) Investigate the direct utilization of the geothermal resource inindustry, agriculture, and aquaculture; and b) Look into thepossibility of fracturing, injection, and/or other techniquesfor utilizing the subsurface heat that exists on the Big Island.
A long-range objective of the HGP is to develop techniques, materials,and components for the recovery of useful energy from molten magma. Thenature of ' the basaltic lava flows on the Big Island make this an ideallocation for the study of power generation from magma.
The HGP came into being when the 1972 Hawaii State Legislature allocated ...$200,000 for geothermal research -- $100,000 to be administered through the
-3-

o
County of Hawaii budget. This action was taken prior to the energy crisisand was a progressive step for a state governing body to take. Total supportfor the HGP through April 1975 has been as follows:
o
o
TOTAL PHASE I SUPPORTState of HawaiiCounty of HawaiiNational Science Foundation
Other Public &Private FundsTotal
FY(72)FY(72)FY(73)FY(74)FY(75)
(72-75 )
$100,000100,000252,000217,000119,00039,000
$827,000
o
o
o
o
o
Phase I was organized into four separate programs, encompassing thefollowing research tasks:
Geophysical Program -- Augustine S. FurumotoPhotogeologic (Infrared Scanning) SurveyElectromagnetic SurveyElectrical Resistivity SurveyMicroearthquake and Microseismic SurveysGeochemical SurveyThermal Survey of Wells
Engineering Program -- Paul C. YuenReservoir ModelingWell Test Analysis
Ghyben-Herzberg Lens AnalysisEnergy Extraction From High Temperature Brine
Environmental-Socioeconomic Program -- Robert M. KaminsRegulatory and Legal AspectsLand Use and PlanningEconomic AnalysisEnvironmental Baseline Studies
Research Drilling Program -- Agatin T. Abbott
The major emphasis of Phase I was on the Geophysical Program, since theissue of if and where geothermal resources exist is crucial to the project.However, parallel studies were initiated in all supporting programs, so that
-4-

500,0001,064,000
20,000
$
progress was made in identifying and clarifying the technological, environmental, legal, regulatory, social and economic problems that could impede thedevelopment of geothermal power in Hawaii.
Although the analysis and interpretation of field data are still incomplete, the consensus developed early -- both on the basis of preliminarygeophysical results and from complementary studies conducted on the BigIsland over the past several decades -- that an exploratory drilling programwould be essential to check out the subsurface conditions predicted by thesurveys. Phase II, the research drilling program, was established to verifyinterpretation of scientific data and to assist in the determination ofwhether conventional geothermal resources are present in Hawaii. Dr. Abbottestablished the Site Selection Advisory Committee in April 1974, and thisgroup has played a significant role in program planning for Phase II.
As of May 1, 1975, the following funds have been identified to continuewith Phase I reseatch activity and to initiate Phase II -- the researchdrilling program:
INITIAL PHASE II SUPPORTState of Hawaii (appropriated by the Legislature;
request has been submitted to the Governor forthe release of these funds)
Energy Research &Development AdministrationHawaiian Electric Company
$ 1,584,000
Current plans call for drilling to begin at a site in the Puna Area ofthe Big Island of Hawaii in October 1975. Cores, fluid samples, and otherscientific data will be taken throughout the proposed 6000-foot drilling depth.Subsequent drilling by the HGP is contingent upon results from the initialhole, as well as both long-range strategy and support for developing geothermalresources in Hawaii.
-5-
~G
A.
THE HAWAII GEOTHERMAL PROJECTMANAGEMENT - COORDINATION
OVERVIEW OF PROJECT MANAGEMENT
o
o
o
o
o
!o
o
The Hawaii Geothermal Project involves more than forty researchers andsupport staff from throughout the University of Hawaii system. The two majorcampuses on Oahu and the Big Island are represented, along with over a dozenresearch institutes and academic units. Many of the State and County agenciesand their staffs are directly involved in the HGP, along with numerous mainland consultants, research organizations, engineering and drilling subcontractors. Because of its potential importance, both for the University andthe State, effective coordination among the wide variety of technological,socioeconomic, and political interests at all educational, private, andgovernmental levels is essential. The Management Program was developed withthese diverse interests in mind.
During Phase I of the HGP the Management Program has provided thefollowing: (1) coordination of activities among the research programs; (2)administrative services to assist with implementation of the research; and(3) promotional efforts at the University, State, and Federal levels to helpassure adequate visibility and support for the HGP.
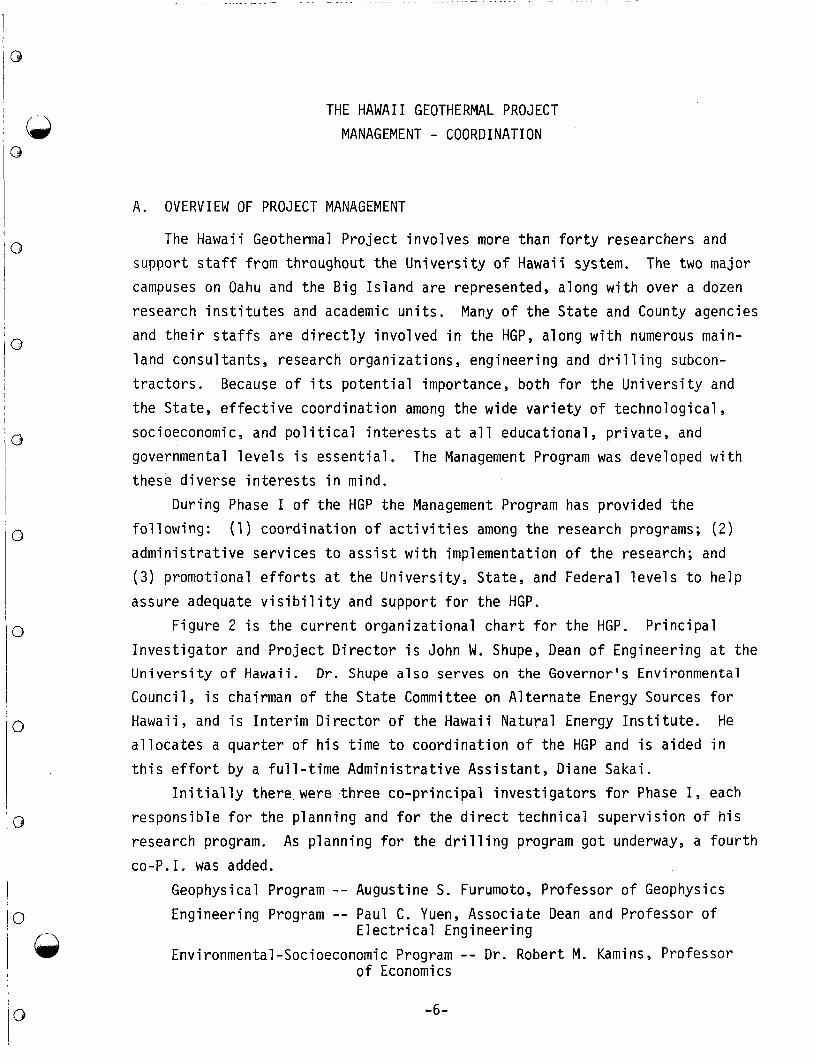
Figure 2 is the current organizational chart for the HGP. PrincipalInvestigator and Project Director is John W. Shupe, Dean of Engineering at theUniversity of Hawaii. Dr. Shupe also serves on the Governor's EnvironmentalCouncil, is chairman of the State Committee on Alternate Energy Sources forHawaii, and is Interim Director of the Hawaii Natural Energy Institute. Heallocates a quarter of his time to coordination of the HGP and is aided inthis effort by a full-time Administrative Assistant, Diane Sakai.
Initially there were ·three co-principal investigators for Phase I, eachresponsible for the planning and for the direct technical supervision of hisresearch program. As planning for the drilling program got underway, a fourthco-P.I. was added.
Geophysical Program -- Augustine S. Furumoto, Professor of GeophysicsEngineering Program -- Paul C. Yuen, Associate Dean and Professor of
Electrical EngineeringEnvironmental-Socioeconomic Program -- Dr. Robert M. Kamins, Professor
of Economics
-6-

I......I
Hawaii AdvisoryCommittee
National LiaisonBoard
HAWAII GEOTHERMAL PROJECT
ORGANIZATIONAL CHART
MANAGEMENT
John W. ShupeProject Director
ExecutiveCommittee
GEOPHYSICAL ENGINEERING ENVIRONMENTAL- DRILLINGPROGRAM PROGRAM SOCIOECONOMIC PROGRAM
PROGRAM Site Selection~ugustine S. Furumoto - CommitteePaul C. Yuen Robert M. Kamins Agatin T. Abbott
Director Director Director Director
Figure 2

Drilling Program -- Agatin T. Abbott, Professor and Chairman of Geologyand Geophysics
Each of these program directors devotes half-time to administration,coordination, and implementation of his respective research program. Aseparate budget was assigned to each program, in order to assist in establishing technical and fiscal authority and accountability.
The HGP Executive Committee consists of the five principal investigators,plus two additional members who assist the Project Director in assuring thenecessary visibility and support throughout the academic community, as well asby the governmental and private sectors: a) Dr. John P. Craven, Dean ofMarine Programs at the University and Director of Marine Affairs for the Stateof Hawaii; and b) Dr. George P. Woollard, Director of the Hawaii Institute ofGeophysics and a member of the Governor's Science and Technology AdvisoryCommittee. The Executive Committee: (1) provides technical input in establishing overall goals and objectives; (2) reviews and approves the researchprogram developed under the leadership of the principal investigators; (3)maintains liaison essential to project support, both on and off campus; and(4) monitors progress of the project.
To assure that the HGP has both local and national relevance, systematicevaluation and advice are provided to the Executive Committee and the P.I.'sfrom numerous sources: a) the NSF and ERDA Program Managers; b) the NationalLiaison Board; and c) the Hawaii Advisory Committee. The National LiaisonBoard (membership list attached) consists of the project leaders of otherfederal-supported geothermal programs, along with a few of the nationalleaders in geothermal research and development. The purpose of the LiaisonBoard is to review program progress, to exchange current information ongeothermal science and technology, and to advise on future planning andimplementation for the HGP. One informative evaluation session of the Boardwas held in February 1974, and a second meeting is tentatively scheduledafter the drilling gets underway.
The Hawaii Advisory Committee (membership list attached) was establishedto provide interaction with key individuals from industry, government, andthe scientific community, whose support is essential to the introduction ofgeothermal power in Hawaii. Serving on this committee are the Directors ofthe State Office of Environmental Quality Control, the Department of Planningand Economic Development, and the Department of Land and Natural Resources;the president of the major electric utility company; Director of the County
-8-

HGP NATIONAL LIAISON BOARD
Mr. David N. Anderson, Geothermal OfficerState of California Resources AgencyDepartment of ConservationDivision of Oil and Gas1416 Ninth Street, Room 1316Sacramento, California 95814
Mr. Ritchi e Coryell, Program ManagerAdvanced Geothermal Energy Research
&TechnologyNational Science Foundation1800 G. Street, N.W.Washington, D.C. 20550
Dr. George V. Keller, ProfessorGeophysics DepartmentColorado School of MinesGolden, Colorado 80401
Dr. George KennedyInstitute.of Geophysics and Planetary
PhysicsUniversity of California, Los AngelesLos Angeles, California 90024
Dr. Paul KrugerDivision of Geothermal Energy ResearchEnergy Research and Development
AdministrationWashington, D.C. 20545
-9-
Dr. James T. KuwadaRogers Engineering Company, Inc.111 Pine Street, Sixth FloorSan Francisco, California 94111
Dr. Henry J. Ramey, Jr.Professor of Petroleum EngineeringSchool of Earth SciencesStanford UniversityStanford, California 94305
Dr. Robert W. RexRepublic Geothermal, Inc.11848 East Washington BoulevardWhittier, California 90606
Dr. Donald H. StewartBattelle Pacific Northwest
LaboratoriesPost Office Box 999Richland, Washington 99352
Dr. Donald E. WhiteGeothermal Research ProgramU.S. Department of the InteriorGeological Survey, Geologic
Division345 Middlefield RoadMenlo Park, California 94025

HGP ADVISORY COMMITTEE
Ms. Sophie Ann AokiLife of the Land (Environmental Program)404 Piikoi Street, Suite 209Honolulu, Hawaii 96814
Mr. David BuchartDepartment of Land and Natural ResourcesState of HawaiiPost Office Box 621Honolulu, Hawaii 96809
Mr. Christopher CobbChairman of the BoardDepartment of Land and Natural ResourcesSta te of Hawa i iPost Office Box 621Honolulu, Hawaii 96809
Mrs. Alma Cooper, PresidentCongress of the Hawaiian People163 Kaiu1ani StreetHi10, Hawaii 96720
Dr. John P. Craven, DeanMarine ProgramsUniversity of HawaiiHolmes Hall 401Honolulu, Hawaii 96822
Mr. Robert F. Ellis, PresidentChamber of Commerce of HawaiiDillingham Tranportation BuildingHonolulu, Hawaii 96813
Mr. Clarence W. Garcia, DirectorDepartment of Research and DevelopmentCounty of Hawa i i25 Aupuni StreetHi10, Hawaii 96720
Dr. Eugene M. Grabbe, ManagerHawaii Geothermal Energy Policy ProjectState Department of Planning and
Economic DevelopmentPost Office Box 2359Honolulu, Hawaii 96804
Mr. Robert H. HughesSenior Vice PresidentC. Brewer and Company, Ltd.Post Office Box 3470Honolulu, Hawaii 96801
-10-
Mr. Hideto Kono, DirectorDepartment of Planning and Economic
DevelopmentState of Hawa i iPost Office Box 2359Honolulu, Hawaii 96804
Dr. Richard Marland, DirectorGovernor's Office of Environmental
Quality Control550 Ha1ekauwi1a Street, Third FloorHonolulu, Hawaii 96813
Mr. Herbert T. MatayoshiMayorCounty of Hawaii25 Aupuni StreetHi10, Hawaii 96720
Dr. Howard P. McKaughanDirector of ResearchUniversity of HawaiiSpalding Hall 360Honolulu, Hawaii 96822
Dr. Pau1M. Miwa, ChancellorUniversity of Hawaii - Hi10 Campus1643 Kilauea Avenue .Hi10, Hawaii 96720
Mr. Herbert M. Richards, Jr.Board of RegentsUniversity of HawaiiBox 837Kamuela, Hawaii 96743
Dr. Robert I. TillingScientist-in-ChargeHawaiian Volcano ObservatoryU.S. Geological SurveyHawaii National Park, Hawaii 96718
Mr. Carl H. Williams, PresidentHawaiian Electric CompanyPost Office Box 2750Honolulu, Hawaii . 96803
Dr. GeorgeP . Woollard, DirectorHawaii Institute of GeophysicsUniversity of Hawaii, HIG 131Honolulu, Hawaii 96822

of Hawaii Office of Research and Development; a cross-section of business andindustrial leaders of the community; and representatives of citizen groups. ..,This committee meets semi-annually and supplements the Executive Committeein providing the necessary visibility for the HGP, both on and off campus,to assure public and private support for geothermal power in Hawaii.
Close liaison has been maintained with all four congressional delegates,who are kept well informed on progress of the HGP. Excellent support, information, and advice is provided by our congressional delegates on any shiftsin organizational structure and funding philosophy of federal agencies.
Local interest in the HGP has been high. Encouragement, endorsement,assistance, and/or interaction has taken place with the following organizations, many of whom are represented on the Advisory Committee:
State Departments and OfficesDepartment of Planning and Economic DevelopmentDepartment of Land and Natural ResourcesDepartment of the Attorney GeneralOffice of Science PolicyOffice of Marine AffairsOffice of Environmental Quality ControlState Task Force on Energy Policy
County of HawaiiThe Mayor's OfficeDepartment of Research and DevelopmentHawaii County Council
Electric UtilitiesHawaiian Electric CompanyHawaii Electric Light Company
Business and Industrial ConcernsBishop EstateCampbell EstateC. Brewer and Company, Ltd.Pacific Resources, Inc.Water Resources InternationalHonolulu Chamber of CommerceHilo Chamber of CommerceGeothermal Exploration and Development Corporation
B. HGP PERSONNEL SUMMARY
Executive CommitteeAgatin T. Abbott, Professor and Chairman of Geology and GeophysicsJohn P. Craven, Dean of Marine ProgramsAugustine S. Furumoto, Professor of Geophysics
-11-

Robert M. Kamins, Professor of EconomicsJohn W. Shupe, Dean of EngineeringGeorge P. Woollard, Director of Hawaii Institute of GeophysicsPaul C. Yuen, Associate Dean of Engineering
Geophysical and Drilling ProgramAgatin T. Abbott, Professor and Chairman of Geology and GeophysicsRobert W. Buddemeier, Associate Professor of ChemistryPow-Foong Fan, Associate Professor of GeologyAugustine S. Furumoto, Professor of GeophysicsRobert Harvey, Research AssociateDouglas P. Klein, Research AssociatePeter M. Kroopnick, Assistant Professor of OceanographyL. Stephen Lau, Director of Water Resources Research CenterGordon A. Macdonald, Senior Professor of GeologyMurli H. Manghnani, Professor of GeophysicsRoger A. Norris, Research AssociateDonald W. Peterson, Geologist, Hawaiian Volcano ObservatoryRamanan Ramanantoandro, Assistant GeophysicistRobert I. Tilling, Chief Scientist, Hawaiian Volcano ObservatoryCharles J. Zablocki, Physicist, Hawaiian Volcano Observatory
Engineering ProgramHi Chang Chai, Professor and Chairman of Mechanical EngineeringBill H. Chen, Assistant Professor of Engineering (Hilo Campus)Ping Cheng, Professor of Mechanical EngineeringJames C. S. Chou, Professor of Mechanical EngineeringDeane H. Kihara, Associate Professor of Mechanical EngineeringKah Hie Lau, Assistant Professor of Engineering (Hilo Campus)L. Stephen Lau, Director of Water Resources Research CenterPatrick K. Takahashi, Assistant Professor of Civil EngineeringPaul C. Yuen, Associate Dean of EngineeringEnvironmental-Socioeconomic ProgramAndrew Berger, Professor of ZoologyMichael J. Chun, Assistant Professor of Public HealthDoak C. Cox, Director, Environmental CenterP. Anders Daniels, Assistant Professor of MeteorologyNabil A. El-Ramly, Associate Professor of Business EconomicsRuth Gay, Instructor, BotanyEugene M. Grabbe, Director, State Center for Science Policy &Technology
AssessmentJerry M. Johnson, Assistant Director of Environmental CenterRobert M. Kamins, Professor of EconomicsJames E. T. Moncur, Assistant Professor of EconomicsRichard E. Peterson, Associate Professor of Business EconomicsKap-Kyung Seo, Professor of Business EconomicsSanford M. Siegel, Professor of Botany
C. PROGRAM PLANNING AND EXPENDITURE SCHEDULE
Table I lists the program and expenditure schedule for each research task.
-12-

TABLE IHAWAI I GEOTHERMAL PROJECT
PROGRAM PLANNING AND EXPENDITURE SCHEDULE
May1973
Nov.1973
May1974
Nov.1974
May1975
TOTAL PHASE IALLOCATIONS
I--'WI
1.0 Management: •••••••Hawaii Advisory CommitteeNational Liaison Board..
2.0 Geophysical Coordination &Support.2.1 Photogeologic Surveys ••••.••2.2 Geoelectric Surveys •••••••••2.3 Theoretical and Numerical Modelling, Computational
Geophysics, Magnetic and Gravity Surveys •.•2.4 Temperature Survey.2.5 Seismic Studies ..2.6 Geochemical Surveys2.7 Hydrology •..•.2.8 Physical Properties of Rocks.
3.0 Engineering Coordination and Support.3.1 Geothermal Reservoir Engineering.3.6 Optimal Geothermal Plant Design •••
4.0 Environmental-Socioeconomic Program Support4.1 Environmental Aspects ••••4.2 Legal and Regulatory Aspects.4.3 Land-Use and Planning Aspects4.4 Economics......••.
5.0 Exploratory Research Drilling Program •.•••••
• • • • ••
•
$ 63,785
93,03823,900
123,424
44,87127,638
109,82224,109
27.34983,73766,298
50.79011,4269,300
10,552
*Inc1udes $100,000 from State of Hawaii and $100,000 from County of Hawaii. $787,600*

This table summarizes the level of activity during the funding period for allof the research tasks, so provides a general overview of funding and programactivity throughout Phase I.
D. SELECTION OF A DRILLING SITE
One of the major management decisions was whether and when to proceed witha drilling program. From the early stages of the HGP, there has been a lackof unanimity on this issue. The proponents for geophysical testing haveadvocated that funds could be used most effectively in conducting geophysicalsurveys for analysis and interpretation. Drilling proponents have counteredthat the volcano area of the Big Island is one of the most extensively studiedgeological areas in the world, and that drilling is essential to prove outtheories and models based upon geophysical-geological-geochemical data.
It was the general consensus at the meeting of the National LiaisonBoard -- which was held in Hilo, Hawaii, in February 1974 -- that the HGPshould move rapidly on planning for a research drilling program. The Boardalso endorsed the concept that a Site Selection Committee be established toadvise on all aspects of the drilling program. Dr. Abbott aggressivelyproceeded to establish this committee and presents a resume of its activitiesin the last section of this report.
The decision to proceed with a drilling program was strongly supportedby the Hawaii Advisory Committee, and assistance was provided by this groupin obtaining an appropriation from the 1974 State Legislature of $500,000 forexploratory geothermal drilling, contingent upon additional federal matchingfunds.
Seven of the eight-man Executive Committee supported an early drillingprogram, with the dissenting opinion coming from Dr. Furumoto, Director of theGeophysical Program. This viewpoint is reflected in that portion of thisreport prepared by Dr. Furumoto.
Initially the drilling program was planned as a series of intermediateand deep holes covering multiple sites. Subsequent negotiations with programmanagers from NSF, and later with ERDA, limited initial support to oneresearch hole. Therefore, the task for the Site Selection Committee took oneven greater importance. As Dr. Abbott discusses in his report, the preferredlocation chosen by the Site Selection Committee had the unanimous support ofthe membership, except for Dr. Furumoto. His interpretation of the data,
-14-

which leads to the favoring of an alternate site, is also presented in hiswrite-up on the Geophysical Program.
The location recommended by Dr. Abbott and his advisory committee hasbeen established as the site for the initial research drill hole, and invitations to bid have been sent to prospective drillers. If negotiations withthe selected driller and ERDA approval of the subcontract move smoothly -as well as the environmental impact statement and the drill ing permit fromthe State -- the tentative schedule calls for drilling to commence inOctober 1975.
E. PUBLICATIONS
Publications generated by the Management Program include:1. The Hawaii Geothermal Project: ~uarterlY Progress Report, numbers
1 through 4, June 1, 1973 throug June 30, 1974.2.· Shupe, John W., Geothermal Power for Hawaii: Phase I, presented at
the U.S.-Italy Cooperative Seminar on Geothermal Energy, Universityof Pisa, November 1973.
3. Shupe, John W., liThe Hawaii Geothermal Project: Year One Overview",Geothermal Energy, July 1974.
Publications prepared by the researchProgramGeophysicalEngineeringEnvironmental-Socioeconomic
-15-
programs are listed as follows:Page19, 25, 47, 59, 8081-82156

HAWAII GEOTHERMAL PROJECTGEOPHYSICAL PROGRAM
Augustine S. Furumoto
The report of the Geophysical Program first presents a narrative of thesequence of events involved in the exploration program. The second part includessummaries of the various tasks carried out as part of the geophysical program.The third part attempts to put together the pieces of the puzzle provided by thetasks to evaluate the geothermal potential on the island of Hawaii.
Although by proclamation Phase I of the geothermal project has ended~ inreality we are far from coming to conclusions. The field work is not completednor are the data satisfactorily interpreted. It is stated categorically herethat the conclusions arrived at are tentative and the conclusions may be alteredas new evidence arrives. It should be noted that the conclusions in the thirdpart of this report are at variance with suggestions for drilling sites presentedin the proposal submitted to the National Science Foundation in November 1974.
A NARRATIVE OF THE EXPLORATION PROGRAMIntroduction
Since May 1973~ about a dozen staff members of the Hawaii Institute ofGeophysics~ University of Hawaii at Manoa~ have been carrying on a coordinatedexploration program for geothermal sources on the island of Hawaii. At thepresent writing (April 1975)~ sufficient results have been obtained from fieldwork and interpretation that a revised drilling program can be proposed to testthe concepts and models derived from the exploration program.
In this article~ a narrative chronicling the various stages of the explorationprogram is given. It is interesting to note the exploration program as it wasplanned and as it was actually carried out. The major reason for the discrepancybetween planning and actual work is the funding level. As only a fraction of whatwas requested was obtained through grants~ only a fraction of what was plannedcould be carried out.
A narrative of this type may have v~lue for future workers who plan to carryout similar exploration programs. Perhaps after reading this~ some may see gaps
and shortcomings in the program and take steps to fill in those gaps.
Proposal and PlansAs originally proposed, the exploration program was to have consisted of 14
tasks grouped in the following general categories.
-16-

Aerial methodsPhotogeology Task 2.1 ~
Magnetic 2.2 ..,
ElectricalResistivity 2.3Electromagnetic 2.4
SeismicMicroearthquake &
microseismic 2.5Offshore ocean bottom
seismographs 2.6Seismic refraction &
reflection 2.8Thermal
Shallow well drilling 2.7Deep drill 2.13
GeochemistrySolids 2.9Fluids 2.10Physical properties 2.11
Hydrology 2.12Model study 2.14
The package requested was $870,000 for the first year and $1,500,000 for thesecond year. The large budget items were the seismic refraction and the drillingprojects .
. Of the $788,000 appropriated for the total project from the National ScienceFoundation, the State and the County of Hawaii for funding of the project fromMay 1973 through the 1974 calendar year, $458,000 was assigned to the GeophysicsProgram.. With this level of funding, the decision was made by the programdirector to allocate funds fully to a few tasks and let other tasks wait. Therefore, the initial exploration program was limited to the following tasks:
Aerial photogeologic surveyElectrical resistivity survey by gipole
bipole methodsElectromagnetic surveysMicroearthquake monitoring &ground noise
surveysThe basis of selection of tasks was the time sequence; those tasks were
funded which could start immediately, while those tasks that needed data fromother tasks before starting were delayed. Among those delayed were seismicrefraction, offshore ocean bottom seismographs, shallow drilling programs andmodel studies.
-17-

Organization of the Exploration ProgramOnce the tasks were selected, the geophysical exploration program was
organized in the following way with task assignments.Coordination -- A. S. FurumotoAerial Photogeology -- A. T. AbbottElectrical &Electromagnetic -- D. P. Klein, R. HarveyMicroseismic -- A. S. Furumoto
For the task of coordinating the program, Mrs. Carol Yasui was recruited asstenographer and administrative assistant. In addition to typing reports, memos,and purchase orders, her responsibility included keeping a detailed account ofthe finances of the geophysics program.
Mr. Carrol Dodd was hired as an electronic technician after consideringmany candidates. His responsibility included designing of some new instruments,as well as assembling component parts to build proven instruments. Especiallyas the electrical resistivity survey was planning to probe deeper depths thanhad been done in other parts of the world, a good electronic technician wasneeded, one versed in field work as well as work in an air conditioned laboratory.
Although the Hawaii Institute of Geophysics since its inception has beenengaged in crustal surveys with emphasis in marine geophysics, and although thestaff members have been using a variety of techniques in surveying, there werea few survey methods for which equipment and experience were lacking at theInstitute. Two of them were infrared scanning surveys and deep probing electricalsurveys. It was decided to subcontract a commercial firm to do the infraredscanning survey. As for the deep probing electrical survey, George V. Keller ofthe Colorado School of Mines was contracted to carry out the initial phase ofthe surveys while equipment for similar surveys were being built and tested atthe Institute.
The organi za t i on of the geophys i ca1 program was en1arged in May 1974 withnew tasks added. The added tasks and person~ responsible for them were:. . . . . .
Geochemi ca1 Surveys -- P.. F. FanTemperature Measurement of Wells -- J. Halunen, D. EppMicroearthquake Monitoring -- W. SuyenagaMagnetic Surveys -- R. Norris.. .... .
Of these men, W. Suyenaga had already been in the program doing field work inground noise surveys. As the seismic task expanded into microearthquake monitoring, he was given charge of the. task.
The magnetic survey task was allotted to R. Norris. In addition to this,the ground noise survey also became his responsibility. The analysis and interpretation of the data taken in the ground noise surveys required a man
-18-

experienced in outdoor surveys and sensitive to various diurnal changes, as wellas one capable of writing computer programs. He was able to fill the manyfaceted requirements.
At the arrival of the data analysis stage in 1975, services of more computerprogrammers were needed. To fill this need, Mrs. Candance Fenander was recruited
. into the program.
Overview of Field WorkField work was carried out through the years of 1973 to 1975 with varying
degrees of intensity. As several staff members have academic responsibilitieswith the Department of Geology and Geophysics of the College of Arts and Sciences,plans were made to dovetail field work with the academic year. Although Hawaiihas a stable climate without the extremes of seasons, nevertheless we do haveperiods of heavy rainfall which preclude outdoor field work. The electricalsurveys in particular cannot be done in the heavy tropical storms.
The chart in Figure 1 shows the periods during which field work was doneby the respective tasks. The chart also shows academic meetings attended andconsulting done by the staff members. There is heavy concentration of fieldwork during the summer months because of release from academic duties and alsobecause the weather is favorable for field work.
Among the traveling done, the geophysics coordinator, A. Furumoto, hasvisited the geothermal fields of Geysers, California, of Otake and Matsukawa inJapan, and Wairakei of New Zealand. From the geophysical and geological pointof view, the most profitable visit was to Wairakei, as the New Zealanders hada deep insight into the geology of their fields. They hypothesized that therewas a thermal source of a "hot plate" about 10 to 15 km deep under a graben andhot water rose upwards to be trapped under impervious layers. At Wairakei, theimpervious layer was made up of mudstones known as the Huka Formation. In thevisits to the Japanese fields, the geophysicists there also pointed out that thegeothermal sources were associated with faults and grabens.
The results of the exploration program have been presented at two academicconferences. The infrared scanning survey was discussed by A. Abbott at theU.S.-Japan Seminar on Volcano Energy held in Hilo, Hawaii, February 4-8, 1974.At the Fall Meeting of the American Geophysical Union in December 1974 at SanFrancisco, A. Furumoto presented the overall results of the exploration programup to that date.
Returning again to the discussion of field work, the schematic diagram ofFigure 2 shows how the exploration program was carried out. The blocks do not
-19-

INoI
1973 1974 1975
J F M A M J J A S 0 N D J F M A r"1 J J A S 0 N D J F M A M
COORDINATION T ~1 M T
LIT. SURVEY
INFRARED XELECTRICAL X(Keller)ELECTRICAL(Klein) X X X X X X
GRAVITY X
MICROSEISMIC " X X X
GROUND NOISE X X X X
GEOCHEMICAL X T X X X T
WELL TEMP. X X
MAGNETIC X
DRILLING T MPREPARATION
X= field workT = travel out of stateM= general meetings
Figure 1 Tabulation of Field Work and Travel Done by the Geophysics Program

Planning &CoordinationFURUMOTO
ILiterature Surveys
+Infrared ElectricalABBOTT KELLER
I+
GravityKLEIN
~Electrical
KLEIN
Self-PotentialZABLOCKI (USGS)
+ +Ground Noise Geochemical
NORRIS, SUYENAGA FAN
+ tMicroearthquake Well Temperature
SUYENAGA HALUNEN, EPP
I I
Data Processingand Evaluation
~ +Magnetic Electrical
NORRIS KLEIN
I
AssessmentTentative Conclusions
Figure 2 Exploration Scheme
-21-
Spring &Summer 1974
Fall 1974
1975

mean that the various tasks were limited in time, but they show how informationfrom one task initiated a subsequent task. For example, from literature surveys,
it was decided to start off the field program with infrared scanning surveys overthe whole island and an electrical survey over the east rift of Kilauea Volcano.
Literature survey continued even as the field work began and influenced all othertasks. The electrical surveys got started in the ~ummer months of 1973 and arestill continuing to gather data. The results of the elect~ica1 surveys narrowed
down the area which seismic surveys were to investigate.
Quite independently of the efforts of the Hawaii Institute of Geophysics,
C. Zablocki of the U.S. Geological Survey had been carrying out an electricalself-potential survey over Kilauea Volcano. In return for assisting him with
field work, his data over the east rift of Kilauea were made available to theexploration program.
As some gaps in data were noticed in April 1975 while assessing the data andinterpretation, a few more weeks of field work are being contemplated for the
electrical and gravity surveys.The above discussion gave an overall view of the field work. The next section
will narrate in chronological order the progress of the exploration program.
Chronological Progress of the Exploration Program
Work during 1973As soon as funds became available in May 1973 to start the exploration
program, equipment and instruments were assembled and mobilized at the Hawaii
Institute of Geophysics to get in some field work during the summer months. Thatperiod of time was characterized unfortunately by a national shortage ofmaterials. For example, bids sent out to manufacturers for seismic amplifiers
returned with quotes asking for three months delivery. When the best offer indelivery time was taken, the instruments were actually delivered five months
after ordering. The electrical survey was also stymied by slow delivery ofcomponents. The Achilles' heel in the electrical survey system turned out to be
the switching mechanism.For the field work, a trailer was purchased in June to serve as a field
office. As trailers are rare things to find on Oahu, a small island, it was avery fortunate chance that an 'automobile dealer happened to have a trailer he
wanted to sell badly. Otherwise, 50% of the purchase price of a trailer is the
shipping cost from California. The trailer was modified and outfitted during
June and July.
-22-

Before we narrate the sequence of the exploration program, a few geologicalnames should be pointed out with the aid of the map in Figure 3. The island ofHawaii is made up of five volcanoes: Kohala, Hualalai, Mauna Kea, Mauna Loa andKilauea. With each volcano are associated rift zones; each rift zone is namedaccording to the direction it radiates. For example, Mauna Loa has four rift zones,southwest, west, north and northeast; Kilauea has two rift zones, southwest andeast rifts. In particular, the area through which the east rift of Kilauea cutsthrough has been called the Puna District, which includes the villages of Kapohoand Ka 1apana.
The first task to be in the field was the electrical survey by G. Keller ofthe Colorado School of Mines. Keller was already in Hawaii to supervise adrilling project in the summit area of Kilauea, a project funded by the NationalScience Foundation, and it was only a matter of days for him to mobilize forfield work.
Since surface manifestations of fumaroles, steam vents and lava flows of1955 and 1961 made it all too evident that the east rift of Kilauea was stillvery hot, it was decided to obtain rapid results about the east rift by contracting Keller to do electrical surveys'. Keller carried out his surveys in June-July1973. From his data, he concluded that in the east rift area, there are patchesof low resistivity rock layers, as low as 5 ohm-m. These anomalous layersexisted at somewhat deep levels, from a depth of 600 m to 2100 m.
As mentioned previously, the infrared scanning survey was subcontracted toa commercial finn, the Daedalus Corporation of Ann Arbor. The flying, done byTowill Corporation of Honolulu, was carried out from July 27 to August 4, 1973and surveyed the rift zones of Kilauea, Mauna Loa and Hualalai. When the resultswere in, what looked like thermal anomalies were seen along the east rift andsouthwest rift of Kilauea and the southwest rift of Mauna Loa. From this surveythen we decided to limit further surveys to the three rifts.
In August 1973, the HIG staff members were able to go out in the field todo electrical surveys and microearthquake monitoring. For the electrical surveys,a 100p-to-100p induction method of survey was carried out over the Puna area.As the 10op-to-1oop method was designed for shallow probing, the surveys weredone over areas where Keller's survey had shown low resistivity anomalies. The100p-to-100p method showed that there was a thin layer of low resistivity atabout sea level in addition to what Keller found. It was concluded after consulting well temperature data that this thin, low resistivity layer was hydrothermal
-23-

20 milesI
10I
oI
Principal Rift Zone
Subordinate Rift Zone
.- Known Fault System (arrowindicotes downthrown side)
Suspected Fault. Systern
/./-. /..... ........ .--.-- ..--- --
.\MALjN"A KEA\.I
II __
"'-. J / . .-. KAPOHg...
Keorokekua-",6MAUNA LOA """" PUNA ./;;Koholo /J (:" KILAUEA .,/. ~".t'
1 \ ,~r>-. /.,\ Fault / ~ '(.r, .-.
ISystern. ~"j ./ •.- ~ "SysICf1\I / t.<.0.:J ... / l'1ilino ou t
, • ~I /. ~"I . /~.;.• 00.' t, ~/ ./
• 0, 1I oQ
:>1
· ~A
J., HONUAPO
Woiahinu. FaultI
I.'. I'., ,
Hl!ALALAl'o,.
Figure 3 Map of the Island of Hawaii with Volcanoes and AssociatedRift Zones
-24-

water coming off'the rift zones. The temperature of this layer ranged from 50°Cto 92°C, not hot enough for geothermal consideration.
For the microearthquake monitoring task, in August an array of three geophonesabout 0.5 to 1 km apart was set up over an area where Keller1s electrical surveyhad indicated low resistivity anomaly. The seismic signals from the geophoneswere telemetered by hardwire to a tape recorder. Recording was done only duringdaylight hours, as there were no provisions for overnight camping in a lava field.(The field office trailer was being used by the electrical team.) The resultsfrom two weeks of recording showed only one earthquake in that area, a disappointing result.
The rest of the year 1973 was spent in building instruments for the anticipated work in 1974. Again slow delivery of components by manufacturers plaguedthe program.
Work during 1974At the beginning of the year, the electrical survey team with Klein as party
chief was again in the field in the Puna area, using line to loop method andSchlumberger galvanic sounding method. The line to loop method confirmed the lowresistivity detected by Keller earlier. The galvanic sounding method determinedthe resistivity values of the dry rocks above the water table. The values variedfrom 6000 to 30,000 ohm-me
In January, a geochemical investigation task was initiated. The initialeffort was of low level activity, merely collecting water samples from existingwells in the Puna area. Some time was used in gathering information on locationof wells from the U.S. Geological Survey offices, files of the Hawaii Departmentof Land and Natural Resources and the offices of the County Board of Water Supply.The water samples were gathered in January with the intention of analyzing themin May at the laboratories of the University of California at Riverside. As theUniversity of Hawaii did not have the type of mass spectrometers necessary forisotope determinations suited to our purpose, it was decided to rely on thekindness of the people at Riverside. The actual analyses were to be performedby graduate students from the University of Hawaii using Riverside equipment.
During the week of February 4-8, the U.S.-Japan Science Seminar on VolcanoEnergy was held in Hilo. The seminar, sponsored by the National Science Foundationand Japan Society for the Promotion of Science, was attended by 60 persons.A. Abbott presented the results of his infrared scanning survey in the first dayof the seminar. Many papers relating to the thermal processes of Kilauea weregiven. The seminar was of particular advantage to the geophysics exploration
-25-

operation, a ground noise survey using
The advantage is that diurnal variation
program as A. Furumoto was a co-chairman of the seminar and in that position hadearly access to the manuscripts and taped recordings of the proceedings.
During the last week of February, Suyenaga and Furumoto carried out a ground
noise survey over the Puna District. The Puna District had an overall high
level of ground noise on account of the surf pounding on the precipitous rockyshore. However, a pocket of noise high in the 4 to 8 hz range above the back
ground level was found. This pocket could not be correlated to any geophysicalanomaly found up to that time, but it was better defined later and was correlated
to resistivity anomalies.
During April, the electrical survey team attempted further loop to loop and
galvanic soundings in the Puna area. The work was often frustrated by torrential
rains. When electrical work was unfeasible, a gravity survey was done over astretch of highway. Data from this gravity profile were valuable later in
determining the dimensions of the dike complex under the east rift.
In May the isotope analyses of water samples from Puna were done by
G. McMurtry, who had traveled to the University of California at Riverside forthat purpose.
The summer months saw a variety of field work. The geochemical survey gotunderway in June to gather more samples. The electrical team carried out surveys
over the southwest rift of Kilauea and the southwest rift of Mauna Loa. Theresults of these surveys showed that the possibility of geothermal sources in
these rifts were much, much smaller than the east rift of Kilauea. Also, a ground
noise survey of these rifts showed that microseisms in these areas are all
attributable to surf beats on the precipitous shoreline. These findings led tothe decision to concentrate on the east rift of Kilauea.
At the request of the Research and Development Department of the County of
Hilo, the Hualalai rifts were surveyed electrically, although infrared scanning
surveys were unpromlslng. The electrical surveys turned in negative results, asfar as low resistivity layers were concerned.
In August, a seven station array of seismographs was set up in the Puna areato monitor microearthquakes. The stations were in operation for three weeks,
night and day. One difficulty was that due to absence of public utility electricity, a gas-line driven generator had to be installed at the base station. The
noise from the generator, although operated only to recharge batteries, interfered
with the monitoring.
While the seismograph array was in,portable seismographs was carried out.
-26-

in ground noise can be checked against the recordings of the seismograph array.The recording was done on a tape recorder as filtering, summing and other typesof operation were planned for the seismic data.
In November the geophysics group met in seclusion at a rented room in a hotelin Waikiki to evaluate the results of the geophysical surveys. Each taskpresented its up-to-date results, but the tasks had not progressed to the stageof definitive conclusions. Only the self potential data from Zablocki couldshow a contour map with recognizable bull's eye. Self potential data requireonly simple processing to show recognizable contours, while other types of data,such as seismic, require weeks and months of processing. But self potentialdata can easily be interpreted erroneously as there are many possible mechanisms,chemical, thermal, mechanical, that can generate electromotive force underground.After much debate, the geophysics group concluded that geophysical evidenceavailable does not justify a drilling program to search for a geothermal source.More time will be needed to sort out the data and to put pieces of the puzzletogether. Plans for more field work were laid.
Although the consensus of the geophysics program was made known to the otherprograms in the Hawaii Geothermal Project, the desire to start drilling in 1975overrode the misgivings of the geophysics program. So· the geophysics coordinatoragreed to go along with an exploratory drill hole to test geophysical data. Thisfine distinction, exploratory hole to test data vs exploratory hole for geothermalsource, was lost in the writing of the renewal proposal which was submitted tothe National Science Foundation in December.
The site selection committee for the drilling program, which is quite independent in organization from the geophysics program, met in November to selecta drilling site for the renewal proposal. As far as the geophysics program wasconcerned, no special site could be recommended for geothermal exploration, buta hole could be recommended to check geophysical data. The committee chose asite based on self potential data and geological formation. The geophysicalprogram agreed to go along as a hole at that site will also have value in checkingout gravity and magnetic data.
A lengthy renewal proposal for 1975 to include drilling funds was submittedby the participants in the geothermal project in the early part of December.
In December, more water samples for geochemical study were gathered to havethem analyzed at Riverside in January 1975.
-27-

Work during 1975The site chosen by the drilling committee was based on self potential data
and on the surface manifestation of an offset in vents along the east rift.Keller's survey seem to indicate that this area was characterized by higherresistivity than background but Keller's data were sparse. To check this out a
dipole-bipole survey was done over the proposed drill site in January. Fortunately a small area, less than 2 km2, of low resistivity was found near the proposeddrill site. Aeromagnetic surveys were done over the entire island of Hawaii in
1965, but the coverage over Puna was not dense. The difficulty is that the
absence of navigational markers made close spaced flights rather meaningless.To augment data coverage a magnetic survey on the ground surface was done witha rented magnetometer in January. The results showed that there were many
magnetic materials near ground surface which tend to obscure deeper sources.However, proper spatial filtering and averaging brought out the deeper anomalies,especially sections of non-magnetic material.
In March, a critique of the proposal submitted by the entire geothermalproject in December was received. The critics singled out the lack of geophysicalevidence to justify a drilling program. The geophysics coordinator was notsurprised at the criticism as such an answer was really expected. The proposalwas submitted prematurely, before geophysical data could be properly analyzed andinterpreted. By March, however, the data collected in 1974 was processed to astage where early attempts at interpretation could be made.
From analyses of gravity, magnetic and microearthquake data, the intrusive
zone or dike complex under the east rift of Kilauea was outlined and determinedas to width and depth. The magnetic data also showed that only the northern halfof the dike complex was hot enough to be above the Curie temperature. As the
Curie temperature for tholeiitic basalt ranges from 100°C to 300°C, water circulating near the dike complex will be hot. Electrical data have located patcheswhere bulk resistivity of rocks is as low as 5 ohm-m, perhaps indicating placeswhere hot water could be circulating. For geothermal purposes, hot water shouldbe ponded or confined in reservoirs. There are hints that, contrary to whatgeologists have thought all along, there may exist impermeable cap rocks to form
hot water reservoirs.
Concluding thoughtsAt the present time, April 1975, the major part of the field work for Puna
has been done. The other parts of the island of Hawaii have also been examined.
-28-

The unpromising results from the other parts of the island encourage us toconcentrate on Puna.
In evaluating the results we find that gravity and magnetic data becamevery significant, more than what was anticipated when the exploration programgot started. The microearthquake monitoring task should have calibrated theinstruments so that source mechanisms could be determined. The electrical datacannot stand by themselves to provide sufficient evidence for drilling siteselection. The salinity of sea water percolating into the island rock mass cancause misinterpretation of data unless gravity and magnetic data are availableto show the original thermal sources.
Task 2.1Photogeo1ogic Survey: Imagery from Infrared Scanning of
the Rift Zo~~s of Kilauea and Mauna Loa
A. T. AbbottIntroduction
From July 31 through August 4, 1973 night time flights for obtaining infraredimagery along the east and southwest rift zones of Kilauea and the southwest riftzone of Mauna Loa were undertaken on the island of Hawaii. Flights were alsomade on Hualalai and Kohala volcanoes, but because of inconclusive results arenot included in this report. Ground control stations had been established duringdaylight hours several days prior to starting the flight program. Studentsstationed at the ground central points guided the aircraft on predeterminedflight paths by the use of directional lights which were visible to the planetsnavigator. Results of the infrared scanning program are considered to be verysuccessful. Events leading up to the final imagery on 8 x 10 color prints willbe discussed below.
A firm specializing in infrared surveys, Daedalus Enterprises of Ann Arbor,Michigan was selected as best equipped and experienced in Hawaiian conditions toaccomplish the infrared imagery survey. Towill Corporation of Honolulu provided
the aircraft, pilot and navigator and submitted a report with maps and blackand white aerial photographic mosaics. These firms earlier the same year had
flown paths for Dr. George Keller of the Colorado School of Mines, who wasengaged in locating a deep drill hole near the summit of Kilauea.
Flight Paths and Descriptions
(1) East Rift Zone of KilaueaTwo long parallel flight paths were flown along the East Rift Zone from points
outside the boundary of Hawaii Volcanoes National Park to Cape Kumakahi. Shorter
-29-

paths crossing the two long parallel lines were flown at the intersection of therift zone with the main highway between Pahoa and Kalapana. Approximately 35line miles of usable record was obtained. From this the following strips wereselected for reproduction in infrared false color imagery:
Three miles of flight paths high on the rift zone at an average groundelevation of 2100 feet provide excellent examples of rift lineation and temperatureaureoles. The DIGICOLOR prints showed a temperature range of 14°C to 20°C.Numerous sites along the rift showed spots of white color indicating the temperature exceeded the highest range on that temperature set. This is. not surprisingin view of the fact that wisps of steam are issuing from some of the ventsprobably as a result of meteoric water coming in contact with residual heat oflavas from the 1966 eruption in this area. Downslope from the steam vents, afairly extensive area shows a slightly higher surface temperature than itssurroundings, by an average of 1°C.
The area for the second set of DIGICOLOR prints in the Kilauea east riftzone was selected from a flight path of approximately two miles in length acrossthe area of intersection of the rift zone and the Pahoa-Kalapana highway at aground elevation of approximately 1000 feet. The temperature range of this pathis 16°C to 25°C or 1.5°C per color. Again numerous sites showing white alongthe rift zone indicate local hot spots and an aureole of decreasing temperaturesare distributed outward from the rift. Fine examples of surface temperature zonesare demonstrated in this imagery.
(2) Southwest Rift Zone of KilaueaA flight path 12 miles long was followed from the point of intersection of
the western boundary of Hawaii Volcanoes National Park and the main highwaybetween Kilauea summit to Pahala to a point on the sea coast approximately 4 mileseast of Punaluu.
The altitude maintained was about 3000 feet above ground level. Throughoutmost of the strip a thermal anomaly was evident along the Great Crack. Thetemperature range on the flight path was 18°C to 2£oC. Of unusual interest onthis path is a thermal anomaly in a target-like pattern near the southern endof the Great Crack approximately 1-1/4 miles from the coast line at an elevationof 300 feet above sea level. The target-like pattern is 1200 feet wide, 1600 feetlong. The roughly circular pattern of thermal anomaly lies 600 feet northwest
of a splinter extension of the Great Crack. The highest temperature within thetarget area reaches the red color or 22°C in two small· spots, and within theGreat Crack extension, small local spots reach white, or off scale.
-30-

by theDirectly
The anomaly appears to be associated with the lower slopes along the southside of Puu Kolekole, a prehistoric cinder cone, and with the extension of theGreat Crack.
This surface thermal anomaly.as registered by infrared scanning imageryshould receive careful attention as a potential area for further geophysicalinvestigation and possibly research drilling.
(3) The Southwest Rift Zone of Mauna LoaA flight path with the total length of approximately 22 miles followed the
southwest rift of Mauna Loa from an elevation of approximately 7000 feet abovesea level to the tip of South Point. Only the lowest five mile section of thispath to the tip of South Point showed any significant thermal anomalies. Thisportion has been reproduced in DIGICOLOR and print~ developed.
The temperature range on one subset is 16°C to 22°C. Thermal anomaliesappear along the cliff face of the Kahuku fault as clusters along the base ofthe cliff and as linear features possibly indicating bedding planes in the lavaflows. Numerous spots along the cliff register red and a few local areas ~how
white, or off scale.The cause of these anomalies is not known at the present time. The Kahuku
fault scarp, which reaches 400 feet in height in this area, faces west. Consideration must be given to the possibility that the anomalies result from residuallate afternoon solar heat. The imagery was taken at 0030 hours in order toreduce the effect of residual heat. The physical distribution of the warmerareas does not appear to show a pattern that might be caused by residual heating,nonetheless, this factor must be kept in mind.
Another, more intriguing possibility lies in the concept that heat may berising from depth along the plane of the Kahuku fault and issuing at the base ofthe cliff and along bedding planes of the lava flows. The Kahuku fault is amajor structural feature of Mauna Loa shield volcano. It extends ten miles inlandfrom the coast and has been followed out to sea for a distance of over 15 miles.Depth recordings made on board the R/V Valdivia in 1973 while steaming past theextension of the fault 4 miles off shore registered a vertical displacement alongthe fault plane of 1900 meters.
Further geophysical and geological work should be concentrated in the sectionof the lower portions of the Kahuku fault. This may have promise as an area inwhich to locate an array of research drill holes.
Also of interest along the South Point shoreline as registeredinfrared imagery is the temperature distribution in the sea water.
-31-

offshore a large patch of water shows as a white area indicating that itstemperature is greater than 22°C. It is not recognized at this time whether thisis a bay of warm surface water brought in by ocean currents or wind or whetherthe warming is caused by some other process.
Task 2.2Geoelectric Surveys on Hawaii: 1973 - 1975
D. P. Klein
Geoelectric surveys have been performed in the areas indicated in Figure 4,chosen largely on the basis of recently active volcanism or known existence ofanomalous thermal conditions (Macdonald, 1973).
The geoelectric methods applied were:1. Dipole-bipole mapping: G. V. Keller (1973).2. Dipole-bipole mapping: Hawaii Institute of Geophysics (H.I.G.)3. Line-loop (time domain) inductive sounding: H.I.G.4. Line-loop (time domain) inductive sounding: C. K. Skokan (1974) of
the Colorado School of Mines5. Self-potential mapping: C. Zablocki of the U.S.G.S.6. Galvanic (Schlumberger) sounding: H.I.G. and C. Zablocki7. Loop-loop (frequency domain) sounding: H.I.G.
The conclusion reached as a result of these surveys is stated below. It isthe crux of our progress to date. The sections following: (II) summarize thereconnaissance data over the island of Hawaii, and (III) summarize the mainpoints regarding detailed surveys in the primary geothermal candidate area.
1. Conclusion
The results of geoelectric surveys on the island of Hawaii provide promlslngevidence of hydrothermal conditions beneath parts of the Kilauea East Rift Zoneon the extreme northeastern side of the island (referred to as Puna or the PunaAnomaly, see Figure 4). Preliminary interpretation of several complimentarydata sets converge to two targets in this area (described in part III), one ofwhich was chosen (note entirely on geoelectric evidence) for a drill site. Thegeoelectric evidence contributing to this selection is summarized in part IIIof this report.
The present state of our interpretation contains many ambiguities, most ofwhich we believe result from the unique situation of Puna. The geothermal targetis probably an unconfined hydrothermal system heated by deep (greater than 500 mdepth) rift zone intrusives. This target is situated in porous, saline-water
-32-

saturated lava. This is not a favorable situation for a precise definitionof the target by geoelectric methods. Furthermore, if the geothermal targetis as postulated above, there is a good chance it will not be economicallyviable. However, these ambiguities cannot be cleared up without drilling. Inthe light of this and the crying need for definite data on geothermal resourceswe do not hesitate to recommend an exploratory hole.
II. Reconnaissance ResultsReconnaissance induction soundings were made in the lower regions of the
southeast rifts of both Kilauea and Mauna Loa voicanoes (areas 3 and 4 respectively,Figure 4). Soundings were also made in the saddle area between the Hualalai andMauna Loa domes (area 5, Figure 4).
Nineteen soundings were made in the regions of the southwest rift of Kilauea,22 in the southwest rift of Mauna Loa, and eight on the Hualalai-Mauna Loa saddle.Maps of the areas are given in Klein and Kauahikaua (1975). The data are stillbeing being processed as reduction priorities rave been biased toward the Kilaueaeast rift data discussed below. Nevertheless, based on field reduction thatgives a minimum apparent resistivity (see Klein and Kauahikaua, 1975) it isfairly certain that ,none of the above areas contain significant geothermalprospects. As Table 1 shows, the apparent resistivities in these regions arehigher than expected for a hot-water-saturated rock which is expected to have aresistivity of less than about 10 ohm-m.
Keller's group (1973) made reconnaissance dipole-bipole galvanic measurementsin the region on the northwest coast of Hawaii (area 2, Figure 4) where waterwells show slightly anomalous temperatures of a few degrees (OC) above normal.These latter measurements also did not provide evidence of low resistivitiesthat could be geothermally generated.
Keller's (1973) main reconnaissance effort was in Area 1 (Figure 4). Here thedipole-bipole survey isolated an anomalous region on the lower part of the riftzone of Kilauea Volcano (the "Puna Anomaly"). Apparent resistivities in thisanomaly range from 5 to 20 ohm-meters (ohm-m) compared to values of greater than
,200 ohm-m measured elsewhere outside the immediate volcanic edifice of Kilauea.
Plots of the generalized apparent resistivity trends against source-receiverseparation for the Puna survey of Keller (1973), are reproduced in Figure 5.These data illustrate the anomalous low apparent resistivities (solid lines) ofthe lower regions of the East Rift Zone in comparison to data in the other partsof Area 1.
-33-

30 kmI
2010
CONTOURS xlOOO
oI
Jl-.-- _
20"-N
19"--
r------------ --,- _J56°W
I~(\~
. KOJAlA)
Figure 4 Areas of Geoelectric Surveys on the Island of HawaiiElevation contours are feet x 1000
-34-

Table 1 Minimum Apparent Resistivities (Pa' in ohm-m), fromReconnaissance Line-Loop Induction Soundings
Area Station - Source Half-SeparationPa(meters)
Kilauea, 1 - 1 1690 18Southwest Rift 2 - 1 2205 53
4 - 1 1190 19
5 - 1 2525 50
6 - 2 1260 14
7 - 2 1990 488 - 2 2275 56
9 - 2 1090 1312 - 3 1565 2815 - 3 1120 1318 - 3 2355 1419 - 3 1600 20
Mauna Loa, 1 - 1 1385 13Southwest Rift 3 - 1 1745 12
4 - 1 2215 175 - 1 2625 197 - 1 2425 17
8 - 1 2210 3315 - 2 1475 13
18 - 2 1775 2919 - 2 2215 2320 ... 2 1280 19
Mauna Loa- 1 - 1 1925 38Hualalai Saddle 2 - 1 1325 13
5 ... 1 1295 196 - 2 2355 40
-35-

101DISTAN C'E (k i10m e te r s )
5L.-_...L----.!.-L-...JL-..L-l-.L-L--~-L--.-d=-:-.L----L---'--..L--...\...-I--I
0.2
1000
\ " \ "\ " ~~ \ II "'\\ " \"\ "\ \ \. \'\. \
\ \ \\" \4\ \ \, \ \
V)
\ 1.... \ '\ \ \(l)- \OJ \6 \ \ \E \• \ t v \E...c \0 \ \\ \ \-- 100 \>- \ \' \ \f- \> \ \' \t- \V) \ \ \12 \V) \w \ \ \ \~ \t- \ \ \ \z \w \ \ \ \~ \« \\ \0- \0-
« t,\7 \
(toNW) \10 "
Figure 5 Generalized Trends of Apparent Resistivity versus Source-ReceiverSeparation of the Dipole-bipole Resistivity Survey. The solidlines are the trends from stations in the Puna Anomaly. The dottedlines are the trends of selected data from stations outside thePuna Anomaly (from G.V. Keller, 1973).
-36-

Based on the above results, we concluded that the most promising candidatefor a geothennal source was the "Puna Anomaly." Subsequent efforts were concentrated in this area.
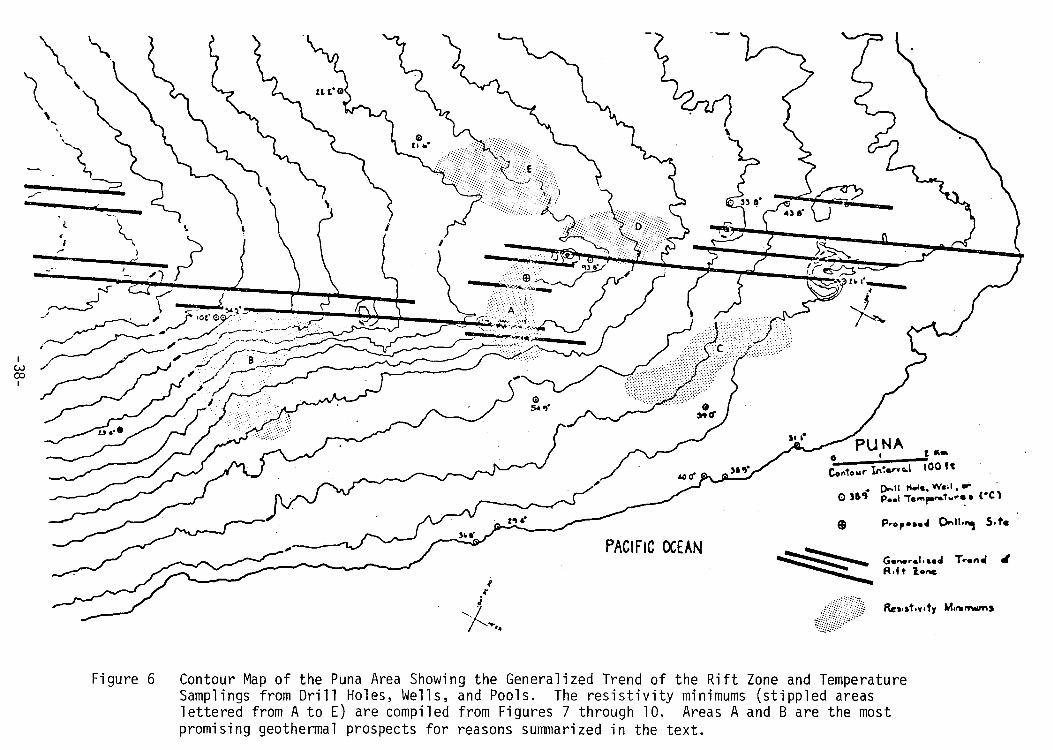
III. Results from Puna, A Geothermal AnomalyA. Basi c DataThe Puna region is shown in Figure 6. Shown on this figure are the general
areas of low resistivity discussed below. This region is traversed by the eastrift of Kilauea Volcano. The "rift" is characterized by numerous thin dikes(extending to an unknown depth in probably a vertical attitude), several eruptivevents (some as recent as 1962), steam seeps and local areas of wann ground. Thetrend of the most recent eruptive loci as well as several known warm to hot waterlocalities which are on or seaward of the rift are shown in Figure 6.
Figure 7 shows the dipole-bipole mapping of Keller's group (1973). Subsequent to this survey, thirty-one line-loop induction soundings were obtained inthis area by H.I.G. Table 2 gives the apparent resistivities calculated in thefield as well as "fonnal" apparent resistivities made as a preliminary step in
"formal" reduction. The final analysis of these data is still underway. Our"formal" apparent resistivities given here were determined by fitting our reduceddata to a homogeneous-earth curve. This gives some indication of the accuracyof our field interpretation.
The induction resistivity values (Table 2) may be considered as an estimateof the average earth resistivity within the zone of induction between the sourceand receiver; the depth of this zone would be about 1/3 to 1/2 of the separationof source-receiver. Compared to the resistivities of Table 1, these Puna valuesagain illustrate the anomalous character of this area. Figure 8 shows thecontours of this induction data (see Klein and Kauahikaua,1975).
Figures 9 and 10 are contours of some recent data; Figure 9 shows contoursfrom data presented by C. Skokan, 1974 and Figure 10 from a limited dipolebipole mapping survey by H.I.G. over a suspected but ambiguous anomaly.
The above listed data plus C. Zablocki's self-potential map of Puna providesthe primary basis for the discussion below. However, secondary interestinginformation regarding the near-surface thermal waters was obtained from severalshallow soundings using the loop-loop induction method and the Schlumberger DCmethod (see Klein and Kauahikaua, 1975).
These data show a very resistive 6000 ohm-m, galvanic resistivity overburdenoverlying a conductive substratum. The top of the conducting material is
-37-
G....r.t.ud T...ntl tilR.ft lone
o 1 K_
Co"to .." It-~.,...L.l 100 ft[)r.11 II••• WolI,"" ..
<:> 3&<to
P••I 'T."'p-.....t ....~. (Oe 1
PACIFIC OCEAN
lI
".-
IW0:>I
Fi gure 6 Contour Map of the Puna Area Showing the Generalized Trend of the Rift Zone and TemperatureSamplings from Drill Holes, Wells, and Pools. The resistivity minimums (stippled areaslettered from A to E) are compiled from Figures 7 through 10. Areas A and B are the mostpromising geothermal prospects for reasons summarized in the text.

-... 7
•.~.-.- 11 Arf--+11[ ;•• f_
s.-.:••••_\-
_S __ Dr
_5---'·%
•PACIfiC OCEAN
,\ \ I
\ ' '*<IIIII
r .....I ,
"!: .............. \
IW~I
Figure 7 Compilation of Apparent Resistivity Data in Puna based on Bipole-dipole Galvanic Mapping,Keller, 1973. The scale of this figure is the same as Figure 6 and their letters showresistivity lows roughly congruent with the areas of Figure 6.

t ..
•PACIfiC OCEAN
. ~ ,~ ,
•
•
.,/------ . ./"."
~"
!~.-
I~aI
Fi gure 8I..4.'r.. "'"4J X (1/1"")
Apparent Resistivity Contours in Puna based on Line-loop (time domain) Inductive Sounding,Klein and Kauahikaua, 1975. Contours are controlled by placing resistivity values midwaybetween source and receiver (see text). The scale is the same as that of Figure 6 and theletters show resistivity lows roughly congruent with the areas of Figure 6.

,
~~.
•
,
"" .. '"'ltI"..
PACI fie OCEAN
It
•
, , ,, ' '
.. '~
Figure 9 Apparent Resistivity Contours in Puna based on (time-domain) Inductive Sounding obtained byC.K. Skokan, 1974. This data is reinterpreted by controlling the contours with resistivityvalues placed midway between source and receiver (see text). The scale is the same as thatof Figure 6 and the letters show resistivity lows roughly congruent with the areas ofFigure 6.

•
~S..... "Ap,.....t
-~It. tt. ...1... t,•• f .....
• s..-•••_!t- L.tte.....
PACIfiC OCEAN
~S~i.!r:;~;~~~
I.j:::oNI
Figure 10 Compilation of Apparent Resistivity Data in Puna from Bipole-dipole Galvanic Mapping.The data is from a survey of the Hawaii Institute of Geophysics (HIG). The scale ofthis figure is the same as Figure 6 and the letters show resistivity lows roughlycongruent with the areas of Figure 6.

Table 2 "Minimum ll and "Formal" Apparent Resistivities(Pa' in ohm-m) from Line-Loop Induction Soundingsin Puna
PaMagnetic Induction R/2Station and Source (meters) Field Formal
Reduction Reduction
1 (I) 839 4.0 11.
3 (I) 1310 8.7 6.7
4 (I) 1765 11.0 -5 (I) 1375 7. 1 10.
6 (1) 1570 12.0 -7 (I) 1250 7.7 13.0
10 (I) 1330 1.3 -12 (1) 1850 6.7 -14 (II ) 1020 3.7 5.
15 (II) 1750 5.0 -16 (II) 1550 4.8 ..18 (II) 1330 3.7 -21 (III) 1495 7.7 7.7
22 (III ) 975 3.6 ..
23 (III) 645 2.8 3.8
24 (III ) 1225 3.5 -25 (IV) 890 5.9 '23
26 (IV) 1040 6.3 15
27 (IV) 1645 6.7 6.2
28 (IV) 1325 9. 1 13
29 (IV) 1595 17.0 48
30 (IV) 2230 10.0 -31 (IV) . 1850 5.6 -
-43-

o
o
o
o
o
o
o
o
o
o~
generally close to sea level and is considered to be a marker between conductivewater-saturated basalts below and dry basalts above.
The inductive resistivity of the second layer ranges from 2 to 10 ohm-m,which is lower than expected for cool-water-saturated rocks and would be moretypical of rocks in brackish to saline water having temperatures of 50 to 100°C.Well-hole temperature profiles (D. Epp and J. Halunen, personal communication)indicate that, below the rift (i.e., seaward), temperatures are indeed encounteredin this range. Commonly however this temperature regime is only a few metersthick and then cools again.
The combined shallow-resistivity and well-hole data show that seaward of therift the area is underlain by a thin zone of hydrotherm"al fluids (probablyheated by rift intrusives during seaward flow through a highly permeable rock).
B. DiscussionThe data will be discussed here primarily in terms of locating a favorable
site for exploratory drilling, in other words in terms of horizontal geoelectricmapping. The possible resistivity structure and temperature pattern with depthis considered by Klein and Kauahikaua, 1975.
The dipole-bipole mapping results are summarized in Figure 7 and Figure 10.The shaded areas are "resistivity minimums where the letters in the zones relategenerally to the areas indicated in Figure 6 by corresponding letters.
The interpretation of dipole-bipole mapping was based essentially onmultiple correlations of data from several source bipoles. Apparent resistivitiescalculated from dipole-bipole data are strongly affected by the source-receiverconfiguration, as well as the true resistivity structure. It is possible to haveartificial resistivity lows and highs in dipo1e-bipo1e mapping that are spatiallyincongrue.nt with the true resistivity high and lows (Lee, 1973; Furgerson andKeller, 1974). These ambiguities can be resolved only by comparing data from twoor more sources with different orientations.
An example of such an ambiguity in the present survey (in Area A), is wellillustrated in Figure 7 where two apparent resistivity trends cross each other,one a relative high, the other a relative low.
On the other hand, the apparent resistivity of some areas is generallyconsistent between data from different sources which indicates that the apparentresistivity is showing some real structure in the earth. For example, the highresistivity region between areas A, Band E, the high resistivity region justnortheast of area E and the low resistivity areas seaward of the rift zone.
-44-

The apparent low resistivity of area B is not certain, based only on the datasummarized in Figure 7; however, further substantive geoelectric evidence isavailable in the original survey report (Keller, 1973).
The consistency of the apparent low resi'stivity in area E or the highresistivity to the north is probably misleading as this area is saturated withcultural features such as pipes and closely spaced groundings of power linesthat may have an unknown effect on the source current distribution in this area.,
The data set in Figure 10 was obtained to clear up some of the ambiguitiesof the data of Figure 7. In particular, the initial interpretation of the data(Figure 1) placed more weight on the apparent high resistivity trend crossingarea A than the conflicting cross trend of low apparent resistivity (Keller, 1973).If this area is highly resistive there is inconsistency between the correlationof SP data and resistivity data. There is an unambiguous positive SP anomalyover area A and previous experience with SP in Hawaii indicates that highs areassociated with hydrothermal activity and should correlate with resistivity lows.(C. Zablocki, personal communication). Such a correlation, for instance, existsover area B and is fairly well established by surveys on the summit of KilaueaVolcano.
The results summarized in Figure 6 show that area A is characterized by anapparent resistivity low. This resistivity low is strong from source A andweaker but indicated from source B. The inconsistency in apparent resistivitythat might be inferred between sources A and 8 is not serious. The receiverdipoles of source 8 are much closer to the near end of the source bipole in theanomalous area than are the receiver sites of source A. This results in aconfiguration effect where the electric fields of source 8 are reflecting thehighly resistive overburden above sea-level.
An'interesting relationship in the contours of source A is the two relativelows symmetric about the east end of the bipole. This pattern is in qualitativeagreement with the pattern expected from a "fault" contact where the discontinuityis normal to the source bipole orientation and the far side of the "fault" is lessresistant than the side of the bipole, (Lee, 1973). The asymmetry in theobserved lows indicates that the "fault", if so interpretated, is askew from anorthogonal orientation to the source. The hypothetical discontinuity could beoriented more toward the orientation of the rift zone and rather than a "fault"the data could be reflecting a "dike" of low resistivity. The rift here can beconsidered as a dike swarm containing considerable remnant heat from recent magmainjections and characterized bya zone of hydrothermal waters in contact withthe dikes at depth.
-45-

o
o
o
o
o
o
The induction data summarized in Figures 8 and 9 comes from large (2-4 km)separation line-loop time-domain soundings. The data is described in detail bySkokan, 1974, and Klein and Kauahikaua, 1975.
The apparent resistivity contours in Figures 7 and 10 were controlled byplacing the calculated resistivities at a point half-way between the source andreceiver. Such a presentation incorporates the assumption that the region of"average" influence (the sampling region) lies between the source and receiver.
The question arises of which region affects the inductive response amplitudesor decay time of a fixed source time-domain system, e.g. the near-source regionor the near-receiver region. A quantitative answer to this question requiresa-priori assumptions about the resistivity structure, in which case, analog ornumerical models of the response can be compared against the data. If thestructure can be assumed to be "reasonably" uniform, it is justified to proceedto analytical interpretations using one-dimensional models. This is clearly notthe case in Puna, though one-dimensional analysis may be qualitatively useful.Strictly speaking by using the concept of apparent resistivity one automatically
assumes the earth to uniformly conducting ~nd in this context it is intuitivelycorrect to take the "apparent" resistivity as an average resistivity in the regionbetween the source and receiver. This is done here but only as a preliminarystep in analysis and the apparent resistivity data is presented in this way withsome reservation.
The depth extent of the inductive sampling is also questionable. Analyticalmodels of induction data for the one-dimensional case indicate that the limiting
..~. '.-
depth of inductive influence for controlled source system seems to be 1/3 to 1/2the source-receiver separation. When there is a highly conductive substratathe depth of penetration is considerably less. In general, however, the presentinductive soundings are probably influenced by deeper zones than the previouslydiscussed galvanic data. This follows from: 1) high-resistivity overburdenwhich negligibly affects the inductive system, 2) the generally larger spreadsobtained when using the inductive systems.
The inductive data in Figures 8 and 9 in general correlates with thegalvanic data of Figures 7 and 10 in those regions of overlapping coverage.
The high resistivity area between A and B agrees with the suggested conceptof geoelectric structure in the following way. If the rift zone is a dike swarm,
hot in localized areas due to recent magma injections, and relatively impermeableto lateral water movement, it could partially trap fresh water on its inland sidecausing a well developed Ghyben-Herzberg lens inland of the rift. If the
-46-

freshwater head was 10 feet above sea level this would cause a low resistivitylens about 400 feet thick. Well data above the rift supports this contention, ..,for instance, the well head at the most inland wells (see the temperatureindications in Figure 7) is 10 to 16 feet. Such a thick relatively low resistivitylens would have a profound effect on the sounding data.
C. ConclusionsBased on two or more sets of complimentary geoelectric data that collaborate
each other and additional supportive evidence listed below, the low resistivityareas A, B are interpreted to reflect hydrothermal conditions at depth. Anexploratory drilling venture in either or both of these areas is appropriate.
Areas A and B are characterized by high SP anomalies which in the Hawaiiregion are a strong indication of hydrothermal conditions.
Area A was known to be astride a significant earthquake swarm in 1961(Don Koyanaga, personal communication through C. Zablocki).
The rift trend is displaced near area A. Considering the voluminous eruptiveactivity (1955) just east of the break, it is conceivable that some sort ofblockage to magma movement downrift is present. This would point toward thepossibility of an unusual concentration of magma at depth. The microearthquakeactivity may be related to a strain release associated with such magma buildup.
The known warm water seeps seaward of area A indicate that this area ispossibly an escape vent for deeper hot waters.
Warm waters are also known seaward of area B. Area B is also known for themost active steaming vents in Puna. Two drill holes near these steam vents in1961 encountered near boiling temperatures before they reached depths equal tosea level. They were abandoned but the steam issu~ng from this area has notabated in 14 years.
ReferencesFurgerson, R.B. and G.V. Keller, 1974, Computed dipole resistivity effects for
an earth model with vertical and lateral contrasts in resistivity. Unpub.report, Colorado School of Mines, ONR Project NR-081-275.
Keller, G.V., 1973, An electrical resistivity survey of the Puna and Kau Districts,Hawaii County, Hawaii. Unpub. report submitted by Group 7 to the ResearchCorporation of the University of Hawaii, July 31.
Klein, D.P. and J. Kauahikaua, 1975, Geothermal-geoelectric exploration on HawaiiIsland, Preliminary Report, Hawaii Institute of Geophysics, HIG 75-6.
Lee, C.Y., 1973, The dipping layer problem in resistivity, Thesis T1610, ColoradoSchool of Mines.
Macdonald, G.A., 1973, Geological prospects for the development of geothermal ..,energy in Hawaii, Pacific Science, 27, p. 209-219, 1973.
Skokan, C.K., 1974, A time-domain electromagnetic survey of the east rift zone,Kilauea Volcano, Hawaii. Thesis T-1700, Colorado School of Mines.
-47-

o
r.,;;G
o
o
o
o
Task 2.2AElectrical Resistivity Survey Conducted by G.V. Keller
A. S. Furumoto
The electrical resistivity surveys by George V. Keller were done in Juneand July 1973 and a report entitled "An Electrical Resistivity Survey of the Punaand Kau Districts s Hawaii County, Hawaii" was submitted by him. The method heused is known as the dipole-bipole mapping method. In short, he caused a largeamount of current to flow into the ground through metallic electrodes driven todepths of 20 feet or deeper, and then with a pair of receiver probes he measuredthe current and voltage coming from the source in the area surrounding the source.With proper allowance made for depth of penetration with respect to distance fromthe source, the average resistivity of the ground between the dipole source andthe receiver probes is determined. The survey in effect gives an integratedpicture of resistivity with respect ~o depth. From data of many soundings,proper analyses can give a rough profile of resistivity variation with depth.As the method is adapted to cover a larger area for a single source that can bedone by galvanic sounding method, it is a good reconnaissance tool.
The map of Figure 11 shows three areas of low resistivity which were obtainedby interpreting the data maps provided by Keller. We shall designate the westernarea as the Opihikao anomaly, the central area as the Pahoa anomaly and theeastern one as the Kapoho anomaly. The three areas had resistivity profiles asgiven in the following table with depths in meters.
o
:0
o
Opihikao
Pahoa
Kapoho
Res i sti vityLayers
o - 600 m600 - 21002100 - (X)
o - 600 m600 - 21002100 - (X)
a - 700m700 - 20002000 - (X)
ProfilesResistivity
20 ohm-m5
very high20 ohm-m
8very hi gh10 ohm-m
3 - 4very high
10
~
o
The low resistivity of the Kapoho was attributed to high salinity fromsalt water intrusions. The anomalies of Opihikao and Pahoa were attributed tothe nna 1 sources.
-48-

PAHOA
,-----,,/ \ )-2.. , ".
..' " )-1 m, ,,' 0 0
I ,,-' PUU HONUAUlA,---,.",.-'
~\)0\\.\)~ PAWAI
tc:Y'O()()~ •• 17-1
17-2o 9-9
o .S 1 1.S 2L-..L-.L-i-J
k'ilom.'",
KEY 10 SYM30lS
S-I • Indud;"" S4unc/~
J 0 Drill HoI.o C~C~ ... c."'HC) Ar.ot ~ low R...ioli,;+,
Mn.cI by GV. r..:I"
Figure 11 Low Resistivity Areas from Keller1s Surveys
-49-

Task 2.3AGravity Survey to Determine Dike Complex Size
A. S. Furumoto and D. Klein
Radius (km)1.61.82.0
Density Contrast0.6 g/cm30.50.4
Ten years ago, a Bouguer gravity map was published by Kinoshita (1965). Themap was not particularly useful to the geothermal project because the gravitystations were confined to the highways and were spaced at 2 km intervals. Asan estimate of the size of the intrusive zone or dike complex under the eastrift was deemed necessary, a gravity survey of close spacing of stations wascarried out in April 1974 over a stretch of Highway 13 in the Puna District(Figure 12). The distances between stations and the elevations were carefullymeasured by surveying technique using transit, chains and rod. Bouguer correctionswere applied to the data and the values were projected against the solid line ofFigure 12. The rationale for the projection was to obtain a Bouguer profileperpendicular to the orientation of the east rift.
The transverse turned out to be too short for proper analysis. To overcomethis deficiency, several values from Kinoshita's (1965) data were -incorporatedto form the gravity profi 1e of Fi gure 13. The va 1ue of 275.3 mi 11 i ga1sin bothFigures 12 and 13 shows where the two surveys had occupied the same station andhence could be tied in.
To interpret the data, we first applied the buried horizontal cylinder modelgiven by Nettleton (1940). The results gave the depth to the axis of the buriedcylinder as 8200 feet or 2.5 km below sea level .. For different density contrasts,
the radius of the buried cylinder varied as shown in Table 3.
Table 3Radius (kilofeet)
5.35.86.4
o
o
o
o
o
o
ioI
~
The Bouguer gravity profile did not go far enough to show the zero level withrespect to the anomaly. But juggling with gradient values and using the buriedcylinder model, we obtained the maximum Bouguer anomaly for this profile as
25.9 mi11igals.We then applied Ske~ls' (1963) method to find the dimensions of a buried
horizontal rectangular prism. For different density contrasts we obtained thewidth, top, bottom and center of the prism anomaly, as shown in Table 4.
10I
-50-

() GRAVITY STATION
+
o 2000 _ 4000I I , I I
HORIZONTAL SCAlE,feET
Figure 12 Survey Area and Gravity Stations
-51-
I_.\

o------------ --~-000
()
-----~. ------
o--_._---
o 0 o--- ---- -_._--.~--
Q <:) 0
C
280 (275.3, Kinoshita)l
c.n 275~ 270- _ _BOUGUER GRAVITYZ
~t:.t:.t:.6 . 11°°3<.:> 265 1000 G3(2-549, Kinoshita) cPt; ELEVATION 66 6 66I ::j 260 6 900 - ~0'1 J. < 00. o~N
-~ 255I 800
250 t 20 12 10 8 6 4 2 0 2 4 6 8 10 12Seashore DISTANCE IN FEET x 1000
Figure 13 Gravity Profile

Table 4Prism Anomaly
Depth toCenter ofAnomaly2.2 km2.22.3
Width ofAnomaly3.2 km3.23.2
an Assumed RectangularDepth toBottom ofAnomaly
3.4 km3.64.0
Results forDepth toTop ofAnomaly
1.0 km0.870.69
DensityContrast0.6 g/cm30.50.4
We have chosen a density contrast of 0.6 g/cm3 as the highest because this iswhat Strange, Woollard and Rose (1965) have chosen for their analysis of volcanicintrusives in the Hawaiian Islands. From Tables 3 and 4, we can conclude thefollowing:
(1) The width of the anoma"lous body which we have identified as the dikecomplex is 3.2 km. This agrees with topographic expression.
(2) The depth to the anomalous body, the dense part of the dike complexis 0.7 km to 1.0 km below sea level, or about 1.0 to 1.3 km belowthe surface near Highway 13.
The bottom of the dike complex is at best 4 km below sea level according tothe analysis. There is a doubt about this because in using Skeels' method weassumed uniform density contrast. We know from seismic data that the density ofneighboring rocks increase with depth. Hence it is very possible that the bottomof the dike complex is deeper than 4 km, but it probably bottoms out at about 5 km.This agrees with the common notion of the growth of a Hawaiian volcano, that itstarts by extruding onto a sea floor. As the average ocean basic depth is 5 km,the dike complex formed by extruding onto an ocean floor is at most 5 km deepat its bottom.
From gravity data, we conclude that the dike complex approximates a horizontalrectangular prism, 3.2 km wide, extending from 1 km depth to 5 km depth, and witha density contrast of 0.6 g/cm3.
ReferencesKinoshita, W.T., 1965, A Gravity Survey of the Island of Hawaii, Pacific Science,
v. 19, 339-340.
Nettleton, L.L., 1940, Geophysical Prospecting for Oil, McGraw Hill, New York, 444 pp.Skeels, D.C., 1963, An Approximate Solution of the Problem of Maximum Depth in
Gravity Interpretation, Geophysics, v. 28, 724-735.
Strange, W.E., G.P. Woollard, and J.C. Rose, 1965, An Analysis of the Gravity Fieldover the Hawaiian Islands in Terms of Crustal Structure, Pac. Sci., v. 19, ~
381-389. ~
-53-

o
o
o
o
o
o
o
o~
,()
I
Task 2.38Puna Magnetics
R. Norris and A. S. Furumoto
Hawaiian rock has no magnetism when its temperature is above its Curie pointand is quite magnetic at lower temperatures. So if there is substantial amountof hot matter beneath the surface in the rift zone it-may be expected to cause amile-long peak-and-trough feature on the magnetic intensity map. The shape ofthe feature, and knowledge of the likely range of susceptibility of the surrounding cooler material, makes it possible to estimate the volume and depth of thehot material.
An airborne magnetic survey map by Malahoff and Woollard (1965) shows theeast rift zone as an intensity plateau with a shallow (lOOy) east-west trough.A ground survey was done to bring out the detail needed for local estimation anddrill site location.
The ground measurements were made 8 feet above the surface with a total-field magnetometer. Exploratory short traverses on foot showed hundred-gammaanomaly roughness at wavelengths of a few paces and thousand-gamma roughnesscommonly found at wavelengths on the order of a tenth of a mile. This shortwavelength roughness may be regarded as noise due to surface and shallow variationswhich are fine-scale but very close to the magnetometer. Deeper features appearas long-wave modulation of the short wavelength background noise.
After gaining familiarity with the nature of the anomaly field the operationwas made mobile by attaching the magnetometer head to the end of a stout 12-footbamboo pole mounted on the front bumper of a small car. The reading errors dueto the presence of the vehicle were calibrated around the compass with theabsolute position of the magnetometer head held constant. The survey traversedthe highways, byways and dirt roads at a speed of 5 miles/hour and a measurementeach 8 seconds--amounting to 90 samples/mile (about every 59 feet). Figure 14shows the pattern of the measured tracks; the rift zone runs east-west throughthe middle of it. The field data were plotted immediately after reading thedigits off the magnetometer. The graphs were later digitized onto cards and themeasured tracks were digitized from a map onto cards. The heading error wasfound to be represented by a 4th-order Fourier series and was incorporated intothe corrections applied to the field data.
As a preliminary analysis to be in time for this report, we attempted ahasty interpretation by fitting curves from the results of Malahoff and Woollard(1965) and by using a few computer programs from the paper by Talwani (1959).
-54-

I0101I
1I
Figure 14 Tracks of Magnetic Measurements in Puna
oI
Miles
3I

We used the aeromagnetic data of Malahoff and Woollard (1965) and the magneticprofile along the highway from Kaimu and Pahoa (see Figure 14). Anotherassumption we used was that the dike complex as defined by gravity data was onthe whole hot enough to be above the Curie temperature.
The structure of the east rift as deduced from these early results of magnetic analysis is shown in Figure 16. The general low intensity over the Punaarea indicates that there are holes of non-magnetic material in a matrix ofmagnetic rock. From Malahoff and Woollard's (1965) data, the non-magnetic prismfrom Mile 3.6 to 5.9 in Figure 16 was outlined. The surface magnetic profile ofFigure 15 shows several peaks and troughs. The peak of Mile 5.1 and trough ofMile 6.8 in Figure 15 can be accounted for by a highly magnetic prism fromMile 5.1 to 6.8 in Figure 16. The trough of Mile 1.2 and the peak of Mile 3.6in Figure 15 can be explained by another non-magnetic hole in Figure 16 fromMil e 1. 2 to 3. 6.
The larger non-magnetic hole from Mile 3.6 to Mile 5.9 is due to the hotmaterial in the dike complex. The hot material is about 1.5 km thick and is ata depth of about 1.2 km below surface.
The smaller non-magnetic material extends from Mile 1.2 to 3.6. It isabout 0.8 km thick and its depth of burial is really not certain, although wehave made it an extension of the larger hole. The smalle~ hole could be muchsha 11 ower.
The non-magnetic property of the smaller hole is not explainable by intrusionsfrom the dike complex. Gravity data does not support dike material extendingthat far.
One possible e~planation is that hot water from the dike complex traveleddownslope to heat rocks in that section to temperatures above the Curie point.This hypothesis is not too far fetched when. Curie temperatures are considered.Unfortunately laboratory determined Curie temperature~ of Hawaiian rocks are notavailable, and hence Curie temperatures must be calculated from mineralogicalcomposition. Macdonald and Katsura (1964) listed the average composition oftholeiites and olivine tholeiites as 2.5% Ti02, 3.03% Fe203 and 8.53% FeO. Whenthese are compared with the titanomagnetite Curie temperature chart (Nagata andOzima, 1967), the Curie temperature comes to about 200°C. However, Macdonaldand Katsura gave the data for a sample (c131) from Puna as 3.65% Ti02, 2.44% Fe203
. and 10.34% FeO. From the chart this sample would have a Curie temperature of70°C. Hence it is not inconceivable that hot water coming off the dike complexcould reduce the magnetic susceptibility of rocks.
-56-
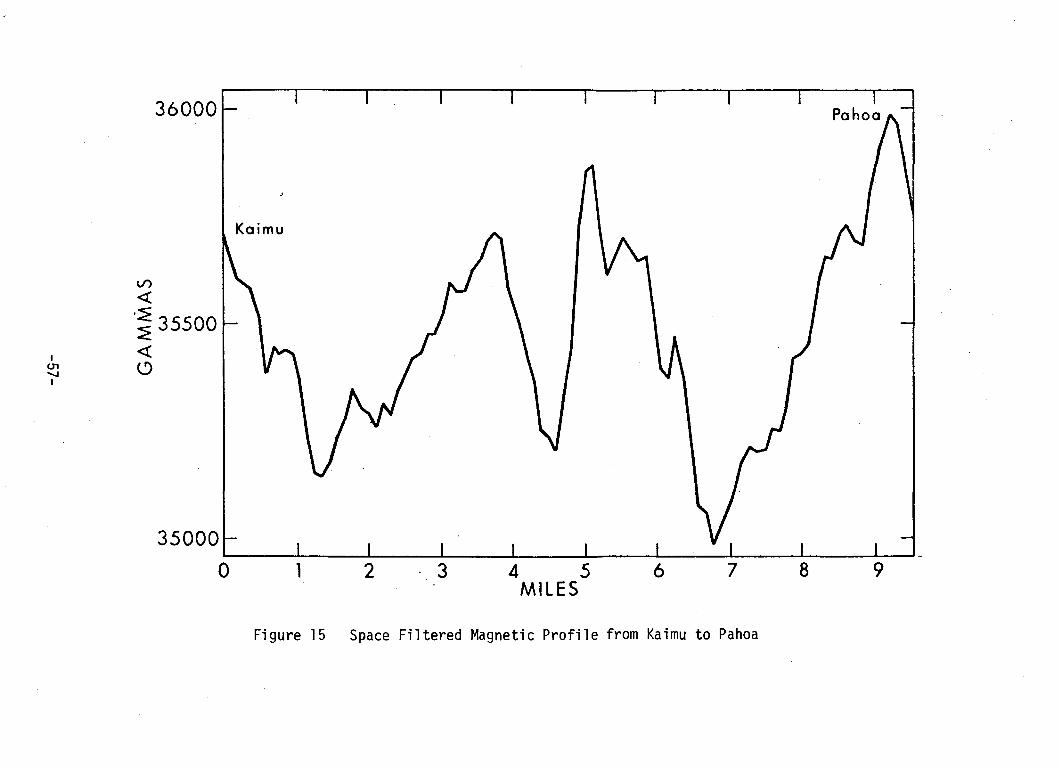
98764 5MILES
321
35000'---__-J-__-.1... L--__...1.-__--I...__---.l_......;.-_...1.-__-..L.__---J_...J
o
36000
V)
«'~ 35500«o
,(J'l"'-JI
Figure 15 Space Filtered Magnetic Profile from Kaimu to Pahoa

PahoaKaimu
2
o 0
IV') 2U1
V')ex:> ~ V')I
UJ LU UJI-
Magnetic Material ~
UJ 2-:E :ES4~
Mil ES
6 2 4 6 84
0 2 4 6 8 10 12 14 16KILOMETERS
Figure 16 Magnetic Anomalies in the East Rift of Kilauea

Up to the present time, only one traverse of our survey has been examinedseriously. The entire data will be examined by representing the magnetic fieldas a function of map coordinates' to be smoothed and contoured by SYMAP (a geographycomputer-plotting package). Suitable cross-sections of the field can then beused with the Talwani 2-D magnetic anomaly program to model whatever linearfeatures are brought out by the mapping.
ReferencesMalahoff, A. and G.P. Woollard, 1965, Magnetic Surveys over the Hawaii Ridge,
Hawaii Institute of Geophysics Report, HIG 65-11.Macdonald, G.A. and T. Katsura, 1964, Chemical Composition of Hawaiian Lavas,
Journal of Geology, v. 5, 82-133.Nagata, T. and M. Ozima, 1967, Paleomagnetism, in Physics of Geomagnetic Phenomena,
v. 1, eds. S. Matsushita and W.H. Campbell, 103-180.Talwani, M., J.L. Worzel and M. Landisman, 1959, Rapid Gravitation Computations
for Two-Dimensional Bodies with Applications to the Mendocino SubmarineFracture Zone, Journ. Geophys. Res., v. 64, 49-59.
Task 2.4Well Temperature SurveyJ. Halunen and D. Epp
During 1974, we measured the variation of temperature with depth in a numberof wells on Hawaii. The wells which have the highest temperatures are located onor near the East Rift of Kilauea in the Puna district. The location of the wellsand the rift zones is shown in Figure 17. Figure 18 is a plot"of temperatureversus elevation above mean sea level for these wells. The highest temperatureswere recorded in "geothermal test" wells 2 and 3. Those wells were drilled in1961 by the Hawaii Thermal Power Company (Stearns, 1966). The elevation of theground surface at Geothermal 2 is about 315 m, and the well does not penetrate tothe water table. Since drilling, the hole was caved in at a depth of about 110 m,60 m above the original bottom. Below 75 m the temperature increases with depth,and at 110 m reaches 97°C. The temperature at the bottom of the hole at the timeof drilling was 102°C, and this suggests that the temperature probably continuesto increase below the lowest depth we were able to reach. How much the temperatureincreases below 110 m cannot be ascertained with the present temperature data.The temperatures measured by Keller (1974) in the exploratory hole drilled justsouth of Kilauea increases to a local maximum (~5°C) just below the water table(~500 m depth), and increases again from ~1000 m to the bottom of the hole. Itcannot be determined whether the temperature increase observed at Geothermal No. 2
-59-

Allis.on.()
", ''/
/' ~1hermol3
","
'"
/"/ .
/ 09-9
9-10o
09-4
Figure 17 Location of Existing Wells in Puna Area
-60-

90
~oS8~~8
. 8••. _. "0-- --0
\'0..(,
8070605040
o Geothermal Te st Well No.2
o Geothermal Test Well NO.3
<> Allison
A 9-6
t;1 9-9
Q,Q,
'0o,o
~obb
~~ 6.., .,z;:;; 0~.' b
Hl' 47+-({ ..y 0-·'--"0_~ .,xy.-¢ ---"-gf :t"? 0-•• ' .
t. <> c-- _g ....0- --------------.0-
........ ""~. "'A --------------0-'A- ,\7.;.' :..""t.O:::-:9••~.-.v -¢> . - - ---. -- - -- - - - - - - - - - - 0- ·;0···················..·······-··..··... ;.\7 ---0
~ ••t;1. 0---- .. c-0------__ - •• O· - - - - -___0-- -
o
20
.LJ>:) 100D~
300-I1.1>JJ.J
:::(.LJ/) 200
IO'l--'I
TEMPERATURE (OC)
Figure 18 Temperature-Depth Profile of Wells

correlates with the upper or lower temperature increase observed in the holesouth of Kilauea.
The other wells shown in the figures penetrate the water table. An increasein temperature at the water table is characteristic of these wells and is mostpronounced at Geothermal test well number 3. This well, and to a lesser extentwell number 9-9 also decreases in temperature near the bottom of the hole.Because these wells are located close to the coast, the fresh water lens is thin.It appears that the high temperatures observed are confined to this lens, thuslending support to the hypothesis that in this area groundwater has passed througha high temperature region as it flows seaward. The high temperatures observedmay, therefore be related to heat source upslope from these wells.
Figure 17 also shows the location of two wells (9-4 and 9-10) that areseveral mi.1es from the rift zone. The temperatures in these wells are less than27°C at all depths. Temperatures in other wells in this area which are not nearthe rift zone are also low.
The temperature data presented here, together with Keller's (1974) data,suggest that exploratory drill holes should be located along the East Rift zone,perhaps somewhere between Kilauea and Geothermal No.2.
ReferencesKeller,"G.V., 1974, Drilling at the Summit of Kilauea Volcano, Report to NSF.Stearns, H.T., 1966, Geology of the State of Hawaii, Pacific Books, Palo Alto,
California.
Task 2.5AResults of the Microearthquake Survey and Seismic Studies
of the Lower East RiftW. Suyenaga
A seven seismometer seismic array was operated in Puna, Hawaii duringAugust 16 to September 9, 1974. Figure 19 shows the location of the seismometers.About 39 earthquakes in the vicinity of the array were recorded and their hypocenters calculated by HYP071, a program developed by members of the U.S. GeologicalSurvey (Lee and Lahr, 1971). The crustal model used in the hypocenter calculationwas the preferred one (Model A) of Ward and Gregerson (1973). Epicenters basedon this model are plotted in Figure 19. Later analysis showed that the rift zone,over which most of the seismometers were placed, most probably consists ofhigher velocity material. Using a revised crustal model with a 6.8 km/sec layerat 4 kilometers, the earthquakes were relocated slightly deeper with large changes
-62-

1540 52'
•
54'
•
•
56'
3D'
1540 58' W32 1,-----.,..-----,....----r-----,----r-----,.----.....N
19 0 261 A'
Figure 19 Epicenters of Observed Microearthquakes
-63-

in some of the epicenters. Thus the epicenters in Figure 19 should be consideredwith this in mind.
Results of the study of microearthquakes occurring near the array are:1) there is no concentration of hypocenters in anyone area or on anyone plane and2) earthquake activity decreased below about five to seven kilometers with thedeepest event occurring at about 14 kilometers. A projection of hypocenters ona plane perpendicular to the rift zone (Figure 20) shows the hypocenters fallinginto an approximately three kilometer wide area vertically beneath the surfaceexpression of the rift zone. The epicenter plot (Figure 19) shows slightly moreactivity near the array with a decrease toward the southwest. This may be due toincreased attenuation due to distance. In the opposite direction, there is adistinct lack of activity in the rift zone toward the northeast. With regard tothe decrease in earthquake activity with depth,attenuation with increased pathlength may be a factor. However, examination of the records of deepest eventsshowed that they were large and well-recorded. Any similar events from deeperdepths would also have been recorded.
In addition to the earthquakes near the array, several earthquakes in theupper east rift and Kilauea summit were recorded. Epicenters calculated by ourarray were compared with those calculated by the Hawai,ian Volcano Observatorynetwork (R. Koyanagi, personal communication, 1975). Four earthquakes locatedby HVO in the upper east rift were located northward by our array. The HVOlocations are more accurate since our array is far off to one side. This misplacement was caused by a relative delay of arrival time at our south station.Since this station was the only one significantly off the rift zone, it is proposedthat the East Rift Zone is comprised of a relatively higher velocity material.Similar observations have been reported by Ward and Gregerson (1973) and Hill (1969).
The seismic network of the 'Hawaiian Volcano Observatory has included atleast one station near Pahoa. A continual public record of their results havebeen published in the HVO Summaries. We have augmented our study with their datain two ways: 1) event count of local earthquakes and 2) location of largerearthquakes in the vicinity of our array.. Event counts show a low level ofseismicity in the lower east'riftwith occasional one to two month swarms.Koyanagi, Swanson anq,Endo (1972) report that these swarms are not associatedwith deflation, with Kilauea summit. Most of the earthquakes located by the HVOfrom 1964 through 1969 were larger events (approximately greater than m=2) of theswarms. Epicenters of these earthquakes were not evenly distributed along therift zone. There was a concentration of activity on the southern edge of the riftzone about four kilometers southwest of our base station. Continuing to the
-64-

•
••
•• •
• Earthquake[] Two Earthquakes
8.2 km Isec
'Z4km/sec
10
A A' •(NW) (SE)
0 b.1.8 km Isec Base Station
3.1 km Isec• •• • • •
• ••• ••• ••
5.1 km/sec •.-5 ••0 •• •
\. )
""'""INTRUSIVE ZONE
6.7 kmIsec BY GRAVITY DATA.~ • •~ •
9876-4 5KM
32115 L.-_"""'--_-'--_-'--_...L-_--'-_--'-_---L._---J._---J
o
Figure 20 Depth of Foci of Earthquakes
-65-

southwest along the rift zone, there is a decrease in activity. As with oursurvey, there is a lack of activity to the northeast along the rift zone.
ReferencesHill, D.P., Crustal structure of the island of Hawaii from seismic-refraction
measurements, Bull. Seism. Soc. Am., 59, 101-130, 1969.Koyanagi, R.Y., D.A. Swanson and E.T. Endo, Distribution of earthquakes related
to mobility of the south flank of Kilauea Volcano, Hawaii, U.S.G.S. Prof.Paper 800-0, 089-097, 1972m
Lee, W.H.K. and J.C. Lahr, HYP071: A computer program for determining hypocenter,magnitude, and first motion of local earthquakes, U.S.G.S. Open File Report,1971.
Ward, P.L. and S. Gregerson, Comparison of earthquake locations determined withdata from a network of stations and small tripartite arrays on KilaueaVolcano, Hawaii, Bull. Seism. Soc. Am., 63, 679-711, 1973.
Task 2.58Ground-noise Survey
R. Norris and W. Suyenaga
A survey of ground noise was made to complement the other kinds of surveysaimed at locating a possible geothermal power source. The survey covered thetriangular area with vertices at the villages of Pahoa, Kapoho, and Kalapana inthe Puna District. The measure of ground noise was taken to be the mean-squarevertical velocity of the ground surface expressed in decibels relative to aconvenient reference. The part of the ground-noise spectrum recorded was thefrequency band 1 hz to 30 hz -- some sites of known geothermal activity have beenfound to have unusually intense ground noise in frequencies below 10 hz. Thesurvey recordings were processed to produce maps of logarithmic intensity at 3 dbcontour intervals. Maps were drawn of the broadband noise (1-30 hz) and ofnarrow bands centered on 2, 4, 8 and 16 hz.
The August 1974 survey accomplished 59 measurement stations distributedabout the 30 to 40 square mile Pahoa-Kapoho-Kalapana triangle. Each measurementwas a 10-minute long magnetic tape recording of a 1 hz low-cut geophone output.The tape-recorded analog voltage was processed in the laboratory to yield themean-square voltage (which is proportional to sound intensity) in decibels. Twoprocessing methods were used: for the lower frequencies (2 hz and 4 hz) anintegration method was used; for the higher frequencies (8 hz and 16 hz) anaverage power-level method was used. The resulting logarithmic intensities wereplotted and contoured on the map of the area. Figure 21 shows the 4 hz intensity
distribution with 3 db contour interval (thus each level of shading represents
-66-

II
•••
IO'l'-lI
Figure 21 3 db Interval Contours of 4 hz noise. The darker area, the higher the amplitude.

double the sound intensity of the level beneath it). This distribution is infair agreement with J.J. Skokan'sresults (given in his Ph.D. Thesis, December1974). There is a well-defined moderate high of 9 db in the vicinity of PuulenaCrater (the high to the east is based on only two measurements) but noisecontrasts of this degree are not enough in themselves to be diagnostic of geothermalactivity at depth. When viewed together with the results of other surveys theevidence accumulated so far makes the Puulena Crater area the likeliest prospectof the East Rift Zone for geothermal activity at depth. Another representationof the data to 160k at is the site-to-site sound spectrum comparison, this maybe more revealing than power-level maps.
The August 1974 survey was preceded by four less extensive reconnaissancesurveys. They were in (a) an area in Puna similar to the August study, (b)around an anomalously high noise level station near Kapoho found during a, (c) anarea south of the town of Pahala and (d) on and around the 1868 lava flow on thedown thrown side of Kahuku Pali at South Point. The first survey took place inFebruary 1974 and.;the latter three during June 1974. The recording procedurewas similar to that of the August survey. Data analysis proceeding alongseveral different lines in an effort to determine the best one. Results ofstudy (a) showed an expected increase of noise as the shoreline was approached.As mentioned, there was one station of anomalously high noise level. Readingsaround this site (survey 6) showed no pattern of noise level. Also, no significantnoise patterns were found in surveys c and d.
ReferenceSkokan, Jacob J., Dec. 1974, Geothermal Exploration: An Evaluation of the Micro
seismic Groundnoise Method, Ph.D. Dissertation, Colorado School of Mines.
Task 2.6Geochemical Studies
P. F. Fan
Stable Isotope" AnalysesThirty-six water samples from the Island of Hawaii have been analyzed for
their 018/016 ratios. The samples represent groundwaters collected from twentywells, two warm-water springs and one steam well. Four samples of local precipitation were also collected at Hilo, Hawaii. The stable isotope ratios arepresented as 0018 values,* along with ~ situ temperature and salinity values,in Table 5. The locations of these samples are presented in Figure 22.
*0018 = [018
/016
samp -1] 1000 in %0 rel. SNOW.018/016 std
-68-

HAWAIIo 10 20
KILOMETER
30
20 0
Figure 22 Location of Wells
-69-
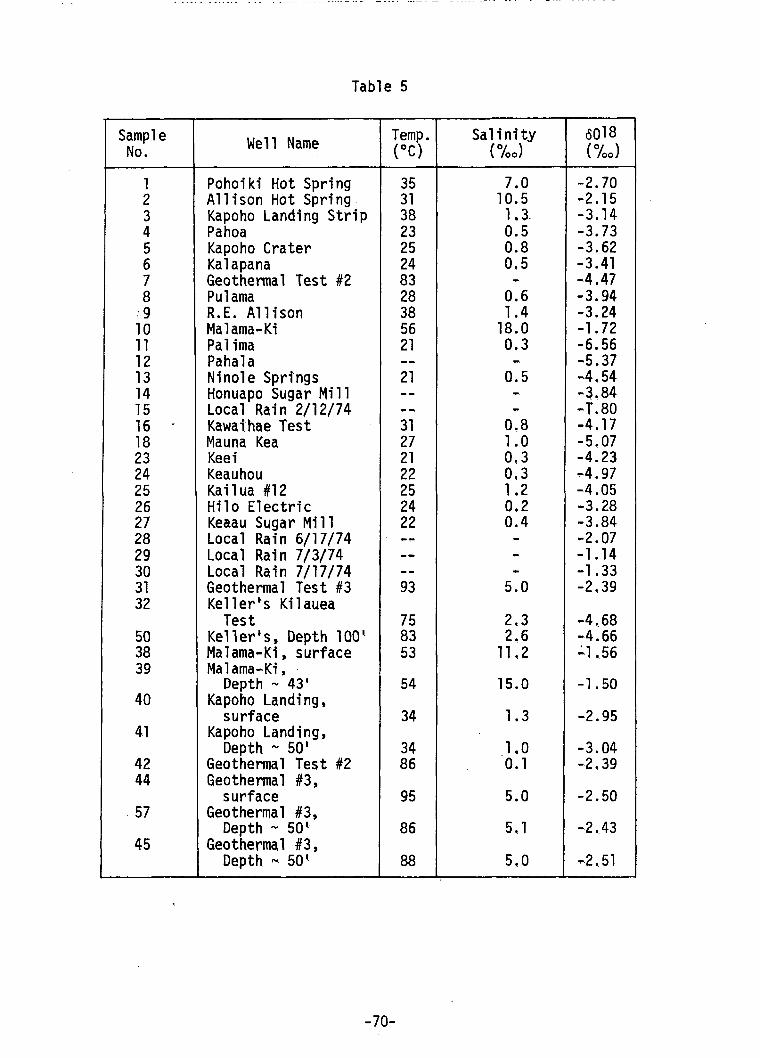
Table 5
Sample Well Name Temp. Salinity 8018No. (OC) (%0) (%0)
1 Pohoiki Hot Spring 35 7.0 -2.702 Allison Hot Spring. 31 10.5 -2.153 Kapoho Landing Strip 38 1.3- -3.144 Pahoa 23 0.5 -3.735 Kapoho Crater 25 0.8 -3.626 Kalapana 24 0.5 -3.417 Geothermal Test #2 83 - -4.478 Pulama 28 0.6 -3.94
!9 R.E. Allison 38 1.4 -3.2410 Malama-Ki 56 18.0 -1.7211 Pa1ima 21 0.3 -6.5612 Pahala -- - -5.3713 Ninol e Springs 21 0.5 -4.5414 Honuapo Sugar Mill -- - -3.8415 Local Rain 2/12/74 -- - -T.8016 . Kawaihae Test 31 0.8 -4.1718 Mauna Kea 27 1.0 -5.0723 Keei 21 0.3 -4.2324 Keauhou 22 0.3 -4.9725 Kailua #12 25 1.2 -4.0526 Hil0 Electric 24 0.2 -3.2827 Keaau Sugar Mill 22 0.4 -3.8428 Local Rain 6/17/74 -- - -2.0729 Local Rain 7/3/74 -.- - -1.1430 Local Rain 7/17/74 -- - -1.3331 Geothermal Test #3 93 5.0 -2.3932 Keller"s Kilauea
Test 75 2.3 -4.6850 Keller's, Depth 100' 83 2.6 -4.6638 Malama-Ki, surface 53 11.2 ~1.56
39 Malama-Ki,Depth'" 43' 54 15.0 -1.50
40 Kapoho Landing,surface 34 1.3 -2.95
41 Kapoho Landing,Depth .., 50' 34 1.0 -3.04
42 Geothermal Test #2 86 0.1 -2.3944 Geothermal #3,
surface 95 5.0 -2.5057 Geothermal #3,
Depth'" 50' 86 5. 1 -2 .. 4345 Geothermal #3,
Depth'" 50' 88 5.0 -2.51
-70-

The 8018 values obtained are somewhat ambi~uous without 80 values(deuterium/hydrogen ratios) since one cannot determine where these waters ploton the meteoric water line of Craig (1961). This line is defined by therelationship:
80 = 8018 + 10
The objective is to see if any of these waters exhibit the "oxygen shift" fromthis line indicative of isotopic exchange between rock and water at elevatedtemperatures (generally greater than 150°C). We are currently awaiting thecompletion of a hydrogen mass spectrometer.
Figures 23 and 24 are plots of 8018 versus ~ situ temperature and salinity,respectively. There appears to be some correlation between 0018 and temperaturealthough the relationship does not hold for the highest temperature wells. Thesalinity versus 0018 plot shows that there may also be some correlation between0018 and salinity for the Malama-Ki and Geothermal Test #3 water springs. Seawater advection may be affecting the isotope values here.
Dissolved Silica AnalysesFifty-four analyses of dissolved silica from the island of Hawaii, plus ten
analyses from the island of Maui have been made using colorimetric techniques.Twenty-one groundwater wells, two warm-water springs and one steam well weresampled from the island of Hawaii. Five groundwater wells were sampled from theisland of Maui. In addition, four samples of local precipitation have beenanalyzed from the island of Hawaii. The,results show an average dissolved silicacontent of 49 ppm for the Maui wells and an average content of 49 ppm for mostof the Hawaii wells. The four samples of local precipitation (collected at Hilo,Hawaii) and the steam samples (collected at geothermal test well no. 2) showextremely low dissolved silica contents of about 1 ppm. Anomalously high concentrations of about 99 ppm are found in two coastal warm-water springs located southof the Puna rift zone near the proposed drill site (see Figure 22). The highestdissolved silica concentrations are found in two groundwater wells: geothermaltest well no. 3, located on the Puna rift zone near the proposed drill site, withan average content of 174 ppm; and Keller's Kilauea test well, located south ofHalemaumaucrater, with an average content of 161 ppm. These wells also havethe highest recorded in situ temperature of 93° and 83°C, respectively.
The dissolved silica content of hot-spring waters has been used as ageothermometer, indicating the last underground rock-water equilibration temperature (White et al., 1956). However, most if not all of these geothermometers
have been calculated for continental acidic rock environments, where quartz
-71-

100
90
•'GEOTHERMAL No.5
•
80
!., I ; Ij
KELLER'S
KILAUEAWELL
-<.)o........
70
GEOTHERMAL No.2STEAM
::JO):!::
:; (f) 60-ce-O)c..E~ 50
40
DMALAMA-KI
•
EAST PUNA
30
•
-6
•••...
•
••• • • ••• •• • • •
-5 -4 -3SOlS (%0)ReI. Smow
-2 -I o
, I ; Fi gure 23 Isotope Content vs Temperature for 018,
-72-

20·0
17·5
15·0 • MALAMA-Kl
12-5-o~o...-
•
~IO'O.-coen·
·7·5
COASTALSPRINGS
•
5·Q El GEOTHERMAL No.3
o-I-2
GEOTHERMAL No.2/' STEAM
KELLER'S.[I] KILAUEAWELL
• • •• •• • •• • • • •• • •
-5 -4 -3
SO's (%0)ReI. Smow
-6
•0·0 I.- ---,- ---:~-------
-7
2·5
Figure 24 Isotope content vs Salinity for 018
-73-

solubility at depth is the major control (Fournier and Rowe, 1966). Therefore,because the Hawaiian groundwaters are exchanging in a basaltic rock environmentwhere free-quartz is rare, these geothermometers cannot be applied. Tholeiiticbasalt glass solubility at depth is probably the local control. Experimentaldata on basalt-water reactions at high temperatures are needed before a localgeothermometer can be applied.
ReferencesCraig, H., 1961, Isotopic Variations in Meteoric Waters, Science, v. 133,1702-1703.Fournier, R.O., and J.J. Rowe, 1966, Estimation of Underground Temperatures from
the Silica Content of Water from Hot Springs and Wet-steam Wells, Am. J. Sci.,no. 264, 685-697.
White, D.E., W.W. Brannock and K.J. Murata, 1956, Silica in Hot-spring Waters,Geochim. Cosmochim. Acta, no. 10, 27-59.
INTEGRATION OF GEOPHYSICAL DATAA. S. Furumoto
Each of the geophysical tasks provided in its own way a part of the structureof the east rift of Kilauea and the hydrothermal processes associated with it.When the parts are pieced together as in a jigsaw puzzle, a composite picture ofthe thermal processes emerge. By outlining the dike complex or intrusive zoneof the rift the size of the thermal sources was determined and the transfer ofenergy from magmatic source to hydrothermal processes can be conceptualized.
The Structure of the Dike Complex or Intrusive ZoneThe shape and size of the dike complex that make up the spine of the east
rift of Kilauea were determined by gravity and seismic .data. The dike complexcan be approximated by a long horizontal rectangular prism with vertical walls,stretching in a direction of N65°E. With the assumption of a density contrastof 0.6 g/cm3, the following dimensions were calculated:
width, 3.2 kmverti)cal extension, about 4 kmdepth to top of dike complex, 0.9 km below sea level
/ .
The location of the, dike complex with respect to the eruptive vents of the easti
rift is shown in Figure 25. In general, the dike complex as outlined by gravitymethods agrees with surface expressions of topography and locations of eruptivevents.
That the bottom of the dike complex is about 5 km below sea level agreeswith current concepts of the origin of the east rift of Kilauea. It is generally
-74-

I-....IU'1I
\,{I....
· 71 j T·HOT ZONE/7 /1=
PAC\F\C OCEAN
; 000}.. _Jr1C~~_._._----_._---
o pU ,14/\ ..J IC....
C:::~o..r1tI'...~\ ,00 f't[)o-.II ~..~. Well • .; .
016; p••\ "T.....,.....,1..r~. t'e ~
-_. _. - . . .. ~
Figure 25 Location of Dike Complex and Hot Section of East Rift of Kilauea

accepted that the magma for Kilauea originates at a depth of about 80 km belowsea level and makes its way upward to the summit area through vertical conduits.The magma is stored in a secondary chamber of reservoir under the summit area;some of the magma erupts through the summit caldera and vent, while some worksits way laterally through cracks and fissures into the rift zones (Eaton andMurata, 1960). At the very beginning of volcano formation, geological ages ago,the lava began to erupt onto the sea floor through a single vent, which laterbecame the central vent. As the volcano increased in size, rift zones began to
form, but these rift zones were formed in the built-up volcano edifice which saton the sea floor. Hence, as the rift zones were emplaced above the originalsea floor, which was about 5 km deep, the bottom of the dike complex would beabout 5 km deep.
By assuming that magnetic data are temperature controlled, an attempt wasmade to determine what part of the dike complex was hot enough to be above theCurie temperature. Although only one magnetic survey traverse has been analyzedso far, the analysis showed that the hot area, about 3.5 km wide, included thesouthern half of the dike complex and the area immediately to the south of thecomplex. Another curious factor was the difference in directions of the gravityand magnetic lineations. While the gravity lineations and the line of eruptivevents along the rift trended in a N65°E direction, the magnetic lineations asshown in the maps by Ma1ahoff and Woollard (1965) trended due east, an azimuthal
discrepancy of 25°. Toward the eastern end of the rift zone, the dike complexand the magnetic low section did not intersect at all. An attempt to reconcilethe offset of magnetic low from the dike complex will be made in the next sectionwhen we discuss the hydrothermal processes of the rift zone.
The Hydrothermal Process of the East RiftThe electrical surveys came up with five areas of anomalously low resistivity,
,shown as areas A, B, C, D and E in Figure 25. Of these the anomaly in area E isattributed to artificial sources, such as water pipes, sewer pipes and cables.The anomalies of areas A and D are probably of.hydroth~rma1 origin; as they areboth located over the dike complex we shall discuss them together. Areas BandC are located south of the dike complex and hence shall be treated together.
Over areas A and B we have the following geophysical data; a self potential
anomaly of about +500 mV (Zablocki, personal communication); low resistivity of5-10 ohm-m; a ground noise level at 4 hz about 9 db above ambient background;a magnetic high; about a dozen microearthquakes during a three week observation
period. Furthermore, gravity data places the dike complex as passing under both
-76-

areas. The water in Geothermal Well III which is located between areas A and Dhad a temperature of 93°C, although confined to a rather thin layer. To thesouth of area A, the water temperature in the Allison Well was 55°C.
The disturbing factor for areas A and D is the rather high magnetic value.Although the dike complex is under these areas, the magnetic data indicate thatit is below the Curie temperature. However, the Curie temperature of tholeiiticbasalts can be as high as 300°C.
A rather simple model is proposed for areas A and D. Water of meteoric originpercolates downward 'through the porous and permeable rock, rising in,temperaturewith dept~. The temperature probably follows the boiling point with pressure.Also with depth, the rocks become less porous, until a depth is reached where therocks become impervious enough to prevent further downward percolation. Fromconsulting Archie's law, a temperature of about 140°C is predicted at about thedeepest penetration. Now as there are numerous tensional cracks, some of thehot water be;~,~~;s moving upward along the cracks to the top of the water table.
,At the water 'table level, the hot water in a thin layer sits on top of the cooler
water and begins to flow downhill to the sea. The temperature is lowered as thewater move~ lat~rally.
The above model accounts for the low resistivity expression, the temperatureprofile of wells, the ground-noise, and the self-potential data, if self-potential
is due to streaming potential. As the rocks are below Curie temperature, we donot see vigorous action such as steaming vents. The microearthquakes as observedare probably due to southward migration or slippingofthe,flank of the east rift,in the manner observed by Swanson, Duffield and Okamura (1971) by means of carefulsurveying. Keller (personal communication) found,that the focal mechanismsolutions in the east rift conform to dip-slip along fault planes dipping to thesouth.
The site selection committee for the drilling committee has selected area Afor its first hole. Although the area has favorable evidence in the form of selfpotential data and the underlying dike complex, nevertheless resistivity datadelineate a rather limited extent of hydrothermal action and magnetic data indicatea temperature below Curie point. Area A is not as favorable as area B which willbe discussed next.
Area B is just to the south of the dike complex but resistivity data indicatea larger extension of low an~maly than area A and magnetic data show rocksbeneath to ~e aboVe Curie temperature. Several small earthquakes have been .-observed, but the ground noise was no different from ambient background level.
-77-

Coincident with resistivity data which says a 5 ohm-m layer exists from700 m depth to 2000 m depth, the seismic refraction survey by Hill (1969) showeda 3.1 km/sec velocity layer to exist at 700 m depth. Hill did not obtain thesurface velocity of the rocks but he presumed it to be low. Now the value of3.1 km/sec cannot be obtained by compressing surface rocks with pressureequivalent to 700 m depth. The velocity must be attained by other means, suchas deposits filling the pores and crevices of the rocks, a very plausibleexplanation.
In our model for area B, we propose that the 3.1 km/sec velocity is due toa pore filled layer, which traps hot water below it. The pore filled layer isnot very thick; it is only thick enough to channel seismic waves to give a velocityof 3.1 km/sec. Below the pore filled layer, the seismic velocity will drop, butthe velocity inversion will not be detected by seismic refraction methods.
Another favorable bit of evidence is that Keller (personal communication)calculated from microearthquake data the Poisson's ratio of rocks in area B tobe about 0.4. The ratio was lower for the dike complex section. An explanationof the high Poisson's ratio is that the rocks are highly fractured.
The magnetic low for this area indicate that the rocks below the depth of1000 m are hot enough to be above Curie temperature. The low electricalresistivity is due to heating by the hot source below.
A model for area B is shown in Figure 26. The heat source is partly in thedike complex and partly in the seepage of hot material from the dikes into thefractured rocks. The seepage of hot material accounts for the magnetic low,while the fractured rocks explains the high Poisson's ratio. A pore filled layertraps hot water in the space below 700 m depth. This accounts for the seismicrefraction data and the low resistivity anomaly. As the process is rather confined,the absence of upward plumes means low ground noise. There is a self potentialanomaly of about 900 mV in the region which can be explained by vents over thedike complex that are 102°C even at the surface. The higher temperature of thisarea as compared to area A agrees well with magnetic data.
We admit that the proposed model is far fetched and the probability of itto exist is small. Especially will the association of the 3.1 km/sec velocitywith a pore filled layer raisemutterings of skepticism. However, we are proposing
this model in spite of many reservations, because this is the only place where wecan find conditions that approach a utilizable geothermal reservoir, an aquiferheated from below and topped by an impervious caprock.
-78-

1.8 km/sec (?)
E~
MN
MODEL B
SURFACE
TE
oo,......
1 x xxxxxxxxxxxxxxxxxx . f"3.1 km /sec POREFILLED LAYER·· .11\\XXXXXXXXX).;XXXXXXXX 11J~
~{~LJr.·J)2 Aflll!/~\~,,- ( HOT WATER /" f', I ,
// / / 1 I .. ··DIKE
.. \"1//////////////7/////// \\.
5.3 km /sec \\\\
Figure 26 Hydrothermal Process of Area B. The model is very conjectural.
-79-

Concluding RemarksAlthough electrical surveys had found five areas of anomalously low resisti
vity, these areas could only be evaluated by considering gravity, magnetic andseismic data. At this point, the value of geochemical data has not been fullyappreciated, but we must remember that the study of geothermal resources inbasaltic areas is still in its infancy with great room for improvement.
Of the various areas considered, the hydrothermal process associated witharea A seems to be rather ephemeral, especially with magnetic data indicatingrelatively cool sources below as compared to area B. Data for area B indicatethat there is a possibility, although a low probability, for a geothermal selfsealing reservoir.
A logical approach to drilling would be to drill in area B to ascertainwhether there is a geothermal reservoir or not. If the answer is positive, theproject can be turned over to a developer. If negative, further surveys can beplanned to locate the best drill site to look for hot rocks or magma.
The geophysical surveys are not completed. Further gravity and magneticsurveys are in the offing to delineate more carefully the dike complex and hotareas; seismic refraction surveys are being planned for examining the 3.1 km/seclayer thoroughly.
ReferencesSwanson, D.A., W.A. Duffield, and R.T. Okamura, 1971, Seaward Displacement of
the South Flank of Kilauea (Abstr.). EOS, Transactions of the AmericanGeophysical Union, 52(4): 372.
Hill, D., 1969, Crustal Structure of the Island of Hawaii from Seismic RefractionMeasurements, Byll. Sejsm. Soc. Am. 50(1): 101-130.
Zablocki, C. (Personal communication), Self-potential map provided for the proposalto the National Science Foundation.
Keller, G.V., (Personal communication), Data presented to drilling site selectioncommittee, May 1, 1975.
Eaton, J.P. and K.J. Murata, 1960, How Volcanoes Grow, Science, 132(3432): 925-938.Malahoff, A. and G.P. Woollard, 1965, Magnetic Surveys over the Hawaiian Ridge,
Hawaii Inst. Geophys. Rept. HIG-65-11, 65 pp.
-80-

HAWAII GEOTHERMAL PROJECTENGINEERING PROGRAM
Paul C. Vuen
The principal objectives of the Engineering Program are 1) to solveimportant problems related to the extraction of energy from geothermalresources (Task 3.1), and 2) to plan and design an environmenta11y-
/
acceptable geothermal power plant suitable for Hawaiian geothermalreservoirs (Task 3.6). Research during the past period has been devotedprimarily to the theoretical and physical modelling of geothermalreservoirs, preparation for the engineering testing of wells to bedrilled on the island of Hawaii, and studies of various methods of converting the heat energy in a geothermal reservoir to electrical energy.Results of the research effort have been reported in five quarterlyprogress reports and the following technical memorandums and reports:
1. . "Mode11 ing of Hawa i ian Geotherma1 Resources, II Technica1Report No.1, by P. Cheng and P. Takahashi, January 1974.
2. "Warm Water Wells on the Island of Hawaii ," TechnicalMemorandum No.1, by S. Shito, January 1974.
3. "Steady Sta~e Free Convection in an Unconfined GeothermalReservoir," Technical Report No.2, by P. Cheng and K.H. Lau,March 15, 1974. Publ i shed in Jouxonal, of Geophysical, Resea1'ch#Vol. 79, No. 29, October 10, 1974.
4. IIGeotherma1 Reservoir Engineering: State-of-the-Art,"Technical Report No.3, by P. Takahashi, B. Chen, K. Mashima,and A. Seki, March 15, 1974. Submitted for publication inAmezoican Society of Civil, Engineez's# pOUJez' Division.
5. IIRegenerative Vapor-Turbine Cycle for Geothermal Power Plant,"by J.C.S. Chou. Published in GeothermaL EnePgy# Vol. 2, No.6,June 1974.
6. IIRegenerative Vapor Cycle with Isobutane as Working Fluid,"Technical Report No.4, by J.C.S. Chou, R. Ahluwalia, andE. Woo, June 10, 1974. Published in Geothermics, Vol. 3,No.3, September 1974.
7. IIGeothermal Reservoir and Well Test Analysis: AliteratureSurvey," Technical Memorandum No.2, by B. Chen, September1974•.
-81-

8. "A Parametric Study of a Vertical Heat Exchanger Designed forGeothermal Power P1a,nt Application," Technical Report No.5,by Go Shimozono, H.C. Chai, and D. Kihara, September 1974.
9. "Characteristics of Vapor Flashing Geothermal Plants,"Technical Report No.6, by R. Ahluwalia and J.C.S. Chou,November 15, 1974. .
10. liThe Effect of Dike Intrusion on Free Convection in GeothermalReservoirs," Technical Report No.7, by K.H. Lau and P. Cheng,December 1,1974. Accepted for publication in InternationaLJournal of Heat and Mass Transfer.
Summaries of the research results follow.
-82-

TASK 3.1 GEOTHERMAL RESERVOIR ENGINEERING
INTRODUCTION
The geothermal reservoir engineering research effort, as shown inFig. 3.1-0, has three subtask groups: computer modelling, physicalmodelling, and geothermal well testing/analysis. All three subtasks havethe ultimate goal of predicting the performance of producing geothermalfields. The computer modelling group will use a mathematical modelapproach, the physical modelling group will scale model a geothermalsystem, and the testing/analysis group will evaluate existing geothermaland petroleum/gas hardware and software techniques. with the aim ofsynthesizing optimal measurement and prediction alternatives.
I. Numerical Modelling of Geothermal ReservoirsInvestigators: P. Cheng,K. H. Lau, & L. S. Lau
The primary objectives of the numerical modelling are to predict theperformance of geothermal wells under different conditions and to studythe environmental impact of the geothermal system, especially the stabilityof the Ghyben-Herzberg lens when perturbed by the extraction of a fluidfrom a well below the lens. The results of these studies will aid in theselection of a viable well-site.
A realistic simulation of Hawaii geothermal reservoirs must take intoconsideration the anisotropic property of rock formation; the irregulargeometry of boundaries; the dynamics of the Ghyben-Herzberg lens; and theeffects of pumping, reinjection, and freshwater recharging. Mathematically,the problem is a very complicated one since it involves the solution of aset of highly non-linear partial differential equations with non-linearboundary conditions at the water table where its position is unknown. Thestrategy adopted by the numerical simulation group has been to studysimplified .situations during the initial phase of the work. These simplified models, which consider different effects one at a time, will aid in aqualitative understanding of the physical processes involved. Furthermore,since the numerical solutions for a more realistic model wi1i probablyinvolve iteration, the results of the simplified models can be used asinput data for the first iteration to guarantee convergence of the
-83-

,- Tasle 3.1 GEOTHERMAL RESERVOIR ENGINEERING
Task Leader: P. Cheng
Well Test/Analysis Physical Modelling' Computer ModellingP. Takahashi. P. Takahashi P. Cheng.
B. Chen & & K. H. Lau &L. S. Lau B. Chen L. S. Lau
Assessment of Preliminary Pre1im; na ryWell Test Design of ComputerHardware Physicil1 Model Model
Selection of Fabricilti on of ComputerHardware andAssessment of Physical Geothermal ModelSoftware for Reservoir Model IIWell Testing
! 1 ! !Purchase of Initiate Testing of.Hardware and Two-Phase Preliminary SimulationTesting of Flow Studies Physical
Software Model
!
[ Design andFabricationof Final
Measurement Physical Modelof Well and !Analysis of
Well Data 14- Development of Incor~orate
Method for Two Ghyben- erzberg ModifiedPhase Flow r.-", Phase of Model Computer
into the ModelAnalysis Testing Program
Preliminary 1Perfonnance FinalPrediction Computer
Model
PredictPerformance of
GeothermalField
FIG. 3.1-0 ORGANIZATIONAL PLAN FOR THE TASK ONGEOTHERMAL RESERVOIR ENGINEERING
-84-
TIMETABLE
May. 1974
Dec•• 1974
May. 1975
Sept•• 1975
Dec•• 1975
May. 1976
Dec•• 1976

iteration process. After maturity and expertise have been developed, more ..realistic models will be considered. The research work will then culminatein the development of a general computer code capable of predicting theperformance of a specific geothermal reservoir. During Phase I of thegrant we have completed the investigation of the following three problems:
A. Steady Free Convection in an·Unconfined·RectangularGeothermalReservoirA parametric study has been completed which investigates the effects
of geothermal heating from below on the movement of seawater, the upwelling of water table, and the pressure and temperature distribution in arectangular two-dimensional geothermal reservoir. The Hawaii geothermalreservoir is idealized as a two-dimensional porous medium bounded on thebottom by a horizontal impermeable wall and on the vertical sides by theocean. The shape of the water table is not known a priori and must bedetermined from the solution. The governing non-linear partial differential equations with non-linear boundary conditions are approximated by aset of linear subproblems on the basis of perturbation method. Theequations for the zero-order and first-order approximations are of theelliptic type that can be solved numerically by the finite differencemethod. It is found that:
1. For a geothermal reservoir one mile in depth with a heat source at800°F and half mile in diameter, hot brine at 400°F can be foundat half a mile below sea level if the drilling site is at the topof the heat source.
2. While the size of the heat source has an important effect on thetemperature distribution in the reser.voir, the location of theheat source has a small effect on the temperature distribution.
3. As a result of geothermal heating, cold seawater moves inland fromthe lower portion of the reservoir and warm water flows into theocean from the upper portion of the reservoir.
4. Heat transfer by convection is important in geothermal reservoirs;thus the prediction of temperature distribution based on heatconduction will be in serious error.
5. Pressure in unconfined geothermal reservoirs can be estimatedbased on hydrostatic pressure.
6. The upwelling of water table as a result of geothermal .heating,which is predicted analytically for the first time, is in theorder of 100 feet for a reservoir of one mile in depth.
-85-

The perturbation method is used in the present analysis. The majoradvantages of the application of the method to the present problem area) the problem becomes linear and the difficulty in the non-convergence ofiteration associated with the numerical solution of non-linear finitedifference equations does not exist, b.) the unknown position of the watertable is explicitly determined from the first-order problem, thus theusual practice of the iteration of position of water table is avoided, andc) a clearer physical pi~ture emerged with regard to the driving forcesand the role played by various parameters in heat transfer and fluid flowcharacteristics in a geothermal reservoir. This work is published in theJournal of Geophysical Research [1].
B. The Effects of Vertical Heat Sources on the Upwelling of Water TableThe perturbation approach discussed earlier was extended to investi
gate the effect of vertical heat sources on the upwelling of water table.The purpose of the analysis is to assess in a qualitative manner whetherthe upwelling of water table of 2000 feet above sea level reported by
\
Keller [private communi~ation] is due to vertical heat sources.Suppose a dike exists in the reservoir as shown in Fig. 3.1-1A with
the idealized situation shown in Fig. 3.1-1B. The parameters for thepresent problem are L the width to height ratio, 0 (0 ~ Kpsgh/a~ where K,Ps' g, h, a, and ~ are the permeability, the density of water in the ocean,g, the gravitational acceleration, h, the depth of the aquifer, the thermaldiffusivity and the viscosity of the fluid), and £ (£ ~ B(Tc-Ts ) where Bis the coefficient of thermal expansion, Tc is the maximum temperature ofthe impermeable surface, Ts is the temperature of the ocean) the perturbation parameter.
Computations were carried out up to the second-order approximationfor 0 = 500 (upper bound for which the perturbation method is valid) withL = 4, E = 0.1, and e = 0.02 for the following three cases with differentaprescribed temperatures of the dike (8d) and the bottom impermeablesurface (8L).
Case A. One vertical heat source. For the problem of geothermalheating due to a hot dike 0.5 unit in height and 2 units in width locatedat the center of the aquifer with a cold impermeable surface at the bottom,the prescribed temperatures are:
-86-

I0:>'-JI
Thermal sourceImpermeable
surface
FIG. 3.1-1A AN UNCONFINED AQUIFER IN A VOLCANIC ISLAND WITH DIKE INTRUSION

,cocoI
P=Pa+Psg(h-y), T=Ts:
y
P=Pa+Psg(h-y)T=Ts
x
FIG. 3.1-18 IDEALIZED MODEL OF AGEOTHERMAL RESERVOIR WITH DIKE INTRUSION

ad = 1 ,
aL(X} = 0 ,
1.9<X<2.l and O<Y<O.5
O<X<1.9 and 2.l<X<4 •
Case B. One horizontal heat source. For comparison, computationswere also carried out for a geothermal reservoir without a dike, but withgeothermal heating from the bottom impermeable surface having thefollowing prescribed temperature
BL(X) = exp [-(~:~f] .Case C. Combined vertical and horizontal heat sources. Heating in
this case is due to the combination of a vertical dike located at thecenter of the reservoir as in Case A, and the hot impermeable surface asin Case B. The prescribed temperatures for the heat sources are
1.9<X<2.1 and O<Y<O.5ad = 1 ,
BL(X) = exp [-(~:~Y] ,. O<X<1.9 and 2.l<X<4.0 •
Fig. 3.1-2 shows the effects of vertical and horizontal heating onthe dimensionless temperature contours [a =(T-Ts}/(Tc-Ts)]. When a hotdike exists in the reservoir, the heat source becomes relatively closeto the water table. This, plus the fact that the dike provides a largerarea for heat transfer, makes it a possibility that hot water can befound at shallow depths. The effects of vertical and horizontal heatingon the amount of upwelling of water table are shown in Fig. 3.l-3--itcan be seen here that upwelling of water table increases if a hot dikeexists. The details of the analysis are described in Technical ReportNo. 7 [2]. Amanuscript based on this work has been submitted forpublication.
C. Free Convection at High Rayleigh Number in Confined GeothermalReservoirsThe perturbation method used in the previous two problems is valid
for small E and for small and moderate values of D. Thus, the method isapplicable for reservoirs with low permeability. In the present study,we shall focus our.attention to reservoirs with high permeability. Forthis purpose it is convenient to express the governing equations in terms
-89-

1.0 r----------:::-;;;::~~~~~:_:_------___,
~y 0.5oI
o
0=500E=O.I
'8=0.1
1.0 2.0
X
3.0
CASE ACASE 8CASE C
4.0
FIG. 3.1-2 EFFECTS OF VERTICAL AND HORIZONTAL HEATING ON TEMPERATURE
CONTOURS IN UNCONFINED GEOTHERMAL RESERVOIRS

1.00 I---~====:-:;:;
,'TJ\0.....I
1.02
0.0
0=500E=O.I
1.0 2.0X
4.0
FIG. 3.1-3 EFFECTS OF HEAT SOURCES ON THE UPWELLING OF WATER TABLE FOR CASES A. B. AND C~

of dimensionless stream function ('1' = . llPhK ' where 11, the viscosity ofpsg
the fluid, Ps' the density of the ,fluid at some reference condition, g,the gravitational acceleratiori, h, the depth of the reservoir, and K, the
T-Tpermeability of the aquifer) and dimensionless temperature 8 =T _~ • The
c sresultant set of non-linear partial differential equations are of elliptictype that can be approximated by a set of non-linear, algebraic equationsby the finite difference method. The parameters in the equations are the
(T -T )aspect ratio L, and the Rayleigh number Ra where Ra =Kp gha c s = £0.
S 11CL
Computations were carried out for L = 4 and for Ra from 0 to 2,000 withthe following two different boundary conditions.
Case 1. Cylindrical and rectangular islandaguifers with caprocktemperature specified. Consider an island aquifer bounded by ocean on thesides, confined by caprock at the top, and heated" by a horizontalimpermeable surface at the bottom. The temperature of the ocean and thecaprock.are given by 8s = 0 and Sa = 0.02, and that of the heated surfaceis given by
a =exp [-(O~5)2J for cylindrical reservoirs,
a = exp [-(O~5)2J. for rectangular reservoirs,
The temperature contours in a cylindrical island aquifer are shownin Fig. 3.1-4. For small values of Ra eRa = 50, for example), thetemperature contours are similar to those by conduction•. As the valueof Ra is increased, temperature contours develop into mushroom shapes.The results have important implications on the, selection of a drillingsite. It indicates that for "a reserv'oir ata large va,lue of Ra and
,_. ,'. ' , '_," " .,' _•• ",,' '_'.' 0 •• •
having a hot heat source, a large:amount of hot water is indeed availableat shallow depths. Fig~ 3.1-5 'sho~i the vertical temperature profiles ina cylindrical island aquifer. At the location directly above the heatsource ( R =0), temperature increases rapidly from" nearly zero at thecaprock to almost unity at a smallverti'cal distance from the caprock.The vertical temperature profile at R = 0 is dramatically different fromthe rest of the profiles which have a temperature reversal at a verticaldistance not too far from the caprock. It is worth mentioning that the
-92-

1.0Ra c 50
o L __.1-__...L-_...L-l-~~~~~::...J..~_--;-__--.l.__~,
2.0 1.0 2.0
R,
e = 0.2
Ra c 300
oL----1..--~-_a..~.:::::-..--+---:~--l,;~---r-n_---..L--__r1 0 0 2.02.0 •
R, RADIUS
1.q--------=======::::::::::::::===::::=-----1
e II 0.2
Ra c 2,000
OL-__-1-__--1. ~~=--_±_--=:~.;;::;:;L_-__;'J.::_--""""'---~2.0 1.0 0 2.0
. R, RADIUS
1.01----========::::::::~~~::::::::========:_--l
FIG. 3.1-4 TEMPERATURE CONTOURS IN A CYLINDRI CAL ISLAND AQUI FER
WITH CAPROCK TEMPERATURE SPECIFIED
-93-

0.4
0.8
I~+:>I
1.0
0.6
i=D.
~.N
0.2
o
\'~\"\\ \\ I~ I
Ra • 2,000,\ I\ \ I
\ \ Ii, \. \ . ,\ Ii I - . _. - Ra • 300\ , ,.
i, \ ,\ J I ----- Ra =50, ,."'- \ \ ,
~ V II I\ \ \ . i\ . I· i\ I I I II\ I I I' I\
II "I"'- \ I'\ , i\ II
• I I\ . I
\ ! I h I I
I , I II,
"
II- \ \ I I
"
I. ,\ ' I I
". I I
\ ~ ! I ,\ , ! I I
f- \ I,, I
\ . \ \ I\ \
\\,
\\ I\. \ ~ I\ I ~ ,I
o 0.4 0.8R. RADIUS
1.2 1.6 2.0
FIG. 3.1-5 VERTICAL TEMPERATURE PROFILES IN A CYLINDRICAL ISLAND AQUIFER WITH CAPROCK TEMPERATURE SPECIFIED

1250
1000
-E-::cto......Q
250
7~0"
5/15-,,I
5116 ~ 7/1,,\
5123,·,,,I,,,
fi30 J,,,,,,613~,,,,,,,,,,61~l, 7,12..' ...,
...............
FIG. 3.1-6 TEMPERATURE PROFILES IN THE KILAUEA DRILL HOLE MEASURED BY KELLER
-95-

()
R = 0.2
Ra = 2,000
0.8
1.0, ==:::::::::===------,",
I/
//
//
/..
()
()
1401201008060
I'I
(l\\
\"'/ Keller's measurements
....................
.................------1---_'
4020
Theory
oo
0.4
0.2
0.6
()
o
o
Temperature °c
oFIG. 3.1-7 COMPARISON OF THEORY AND MEASUREMENTS
G
o -96-

2.0
9 = 0.2,
1.0oR, RADIUS
1.0
Ra = 50
2.0
1.0,....----------~-----~--------.......__,
o
:I:to..wc
2.01.0oR, RADIUS
1.0
Ra = 300
1.0,....----~-----~---.;,----=~------=:--------,
o2.0
:I:to..wc
1.0..--.,.-------.,.----r---~---~------~__,
o2.0
Ra = 2,000
1.0 2.0R,
FIG. 3.1-8 TEMPERATURE CONTOURS IN A CYLINDRI CAL ISLAND AQUI FER WITH ADI ABATI C CAP ROCK
-97-

o
G
o
o
o
o
o
10
I~
o
temperature reversal occurs because of the discharge of warm water towardthe ocean. The behavior of temperature reversal is most pronounced forlarge Ra at a horizontal distance near the heat source. It is interestingto note that temperature vs. depth measurements obtained by G. Keller [3]show also a temperature reversal behavior (Fig. 3.1-6). A comparisonbetween theory and measurements shows a striking similarity (Fig. 3.1-7),although the island of Hawaii is supposed to be an unconfined aquifer.
Case 2. Cylindrical and rectangular island aguiferwith nonheatconducting caprock. The geometry is similar to Case 1 except the thermalboundary condition of the caprock is changed to an adiabatic surface. Thetemperature contours of this case are plotted in Fig. 3.1-8. A comparisonof Fig. 3.1-8 and Fig. 3.1-4 shows that a substantially larger amount ofhot water at shallow depth is available for Case 2 because of the nonheatconducting caprock. A manuscript covering this work is now under preparation for publication.
II. Well Testing and AnalysisInvestigators: P. Takahashi, B. Chen, &L. S. Lau
A. The Nature of a Geothermal ReservoirSpeculations on the nature of geothermal reservoirs can be found in
the literature. Legally, in the United States, the U. S. Geological Surveydefines a geothermal reservoir to be contained in either a known geothermalresource area (KGRA) or a potential geothermal resource area (PGRA).Geothermal reservoirs can be characterized in several other ways:
1. Depletable (self-sealed) or regenerative (recharged),2. Physical state: vapor-steam, liquid-hot-water (normally two
phased at wellhead), solid-hot rock, liquid magma,3. Physical condition: temperature/pressure, size/depth, production
rate,4. Degree of dissolved solid content.In California, vapor-dominated wells are considered to be depletable.
A tax allowance is permitted under this classification. A decision hasnot yet been made on other types of wells. There i$ some reason to believethat all wells are at least partially regenerative because of the meteoric(rainwater) origin of geothermal fluids [5]. Furthermore, reports ofmeasurable pressure drops in steam-dominated geothermal fields seen after
-98-

rainfall lead one to suspect that perhaps fluid recharge could besignificant.
Although vapor-dominated geothermal wells are generally contaminatedwith CO2 (primarily) and H2S, there is little dissolved solid content. Onthe other hand, some of the hot water well samples in the Imperial Valleyhave shown as much as 30% dissolved solids by weight.
There seems to be no clear-cut answer to a universal definition ofa geothermal reservoir. A geothermal reservoir generally requires:heat source (magma or geopressure); to be confined in an aquifer,although nonpermeable hot rocks can be transformed into an aquiferthrough hydro-fracturing/thermal cracking and the addition of water;and caprock--to hold the hot fluid in place ••• although the latterrequirement is controversial. Speculations on geothermal reservoirshave been advanced by White and Muffler [5J, Facca [6J, Elder [7J, andHayashida [8].
For the island of Hawaii, it is generally believed that the system isself-sealed and liquid-dominated. Fig. 3.1-9 is a conceptualization ofthe expected system for Hawaii. It should be noted that magma is generatedat the crust-mantle interface. For the Hawaiian Islands, there is beliefthat the production of magma could be as close as 20 miles from the surfaceof the earth [9, 10].
George Keller, discussing results of his drilling program at KilaueaVolcano [11], concluded that evidence favored the existence of hydrothermalconvection cells and, most importantly, suggested the action of selfsealing within the porous island medium. The supposition advanced,therefore, is that Hawaiian geothermal reservoirs are sealed with the heatsource being magma at depth, which with time either: 1) induced abnormallyhigh circulation rates resulting in flashing or thermal deposition,effectively capping the reservoir, perhaps even above sea level; or 2)intruded above the magma chamber and released energy to the surroundingaquifer, in effect forming a system composed of a cooling, vertical dikesurrounded by hot fluid, which through the physical phenomenon as describedin "1" has been capped into a self-sealed reservoir.
Although it has been reported that hot water reservoirs are twentytimes more prevalent than vapor-dominated ones [12], technical difficultiesin the former have resulted in considerably more production from the
-99-

3
MILES
1 to 12 MI LES
72 MILES DIAMETER'
SHALLOW MAGMA RESERVOIR J
ROUGHLY 3 MILES IN DIAMETER
GHYBEN-HERZBERG ,,;j;"i!i\l{;i~tw~f}:,., ..FRESHWATER LENS : , :..:. VOLCANIC ERUPTION 3 MILES
../~fi~t!(rt!~W~\;{XB,gJ~:M~tf. ~~t~~;.~}.~~:·:.~.. ~.or'----:--:--:-:-T--!-----,r-----r
..:i1t1tJ\yi~!i1~1~~%~V(t~~~~~W!!~[{r.~l. WM1l~I~;~>t.",Mi-~~~SEA ~/ATER
SEA LEVEL
SEA BOTTOM
I--'ooI
PERMEABLE LAYERS OF ROCK 20 to 60 MI LES
l}¥t IMPERMEABLE LAYERS OF ROCK
~ LOW POROSITY MEDIUM CRUST
MANTLE
FOR HAWAII J SURFACE OFEARTH TO MANTLE PROBABLYCLOSER TO 20 MILES
FIG. 3.1-9 SPECULATIVE CROSS-SECTIONAL VIEW OF THE ISLAND OF HAWAII

latter. There are five vapor, eleven hot water, and two binary cycleplants either operating or close to completion. The hot rock concept isundergoing investigation by researchers from the Los Alamos ScientificLaboratory (for New Mexico). A fourth concept, direct utilization ofmagma, was originally advanced by George Kennedy and David Griggs in 1960[13]. A recent conference on volcano energy supported the reasonabilityof this latter scheme [14]. Some preliminary work, mostly in the proposalstage, is being advanced by researchers from Sandia (New Mexico), LawrenceLivermore Laboratory, .and the University of Hawaii.
When calculating the usable energy in a geothermal reservoir, oneshould be aware that only 1% of the total available energy can be convertedto electrical energy from a hot-water reservoir using present proventechnology. The equivalent figure from a vapor-dominated reservoir is2-5% [5]. It should nevertheless be realized that on an absolute energyscale, a self-sealed liquid-dominated reservoir, per cubic foot of reservoir, wi.ll produce more energy than a vapor-dominated one. A quickcomparison of water and steam densities bears this out. Secondly, thethermal conductivity of rock precludes conduction as a mechanism forregenerating a geothermal well. For example, H. Ramey has reported thatthe net heat recharge rate in the Big Geysers is less than 0.6% [15].However, the possibility of extraordinary fluid convection through porousmedia as driven by circulating magma should not be discounted--thermalcracking of the receding, cooled magma can possibly result in highpermeability. Unfortunately, unless the magma chamber is extremely largeor self-sealing occurs, this energy will quickly dissipate with rechargingmeteoric water.
Under present economic and technical conditions a viable geothermalreservoir is generally one which: has a minimum temperature of 356°F(l80°C)--to conform tocurrent steam turbine design, is located within10,000 feet (3,050 m) from the surface, and can produce steam at a minimumrate of 40,000 lb/hr (18,120 kg/hr) with a 9-5/8 inch (24.4 cm) diameterhole. Geothermal wells not quite satisfying the above criteria can nevertheless be used for special applications, as for example, the 158°F (70°C)binary system in the U.S.S.R. Furthermore, there is every reason tobelieve that wells exceeding 10,000 feet (3,050 m) will, with improved
-101-

drilling technology and increasing energy fuel prices, become economicallyfeasi bl e.
The general nature of a geothermal reservoir is contentious. Thequestion of its being self-sealed or regenerative has not been completelyanswered.
B. International QuestionnaireA questionnaire on the nature of geothermal reservoirs and well testing
and analysis was sent to a number of workers in the field. Over twentyreplies were received from companies, institutions, and government agenciesfrom all of the prominent geothermal energy nations. While some of theresponses were received through oral communication, the majority of themwere in the form of personally written correspondence. Many of theindividuals chose to answer the questions by citing published technicalliterature. All responses were evaluated and the most appropriate oneswere tabulated in a matrix arrangement as shown in Table 3.1-1. This tableshould be a convenient guide for quick reference to geothermal reservoirengineering.
C. Geothermal Reservoir Engineering: Well Measurement and AnalysisGeothermal reservoir engineering begins with exploration and
progresses through stages of drilling, well testing, analysis and performance prediction. Investigators in the engineering phase of the programhave worked closely with the geophysical effort in activities that impactengineering. The "well test analysis" team has progressed in two welldefined but closely interrelated sequential areas. Close to completionis a master's thesis on formation evaluation, the interface regionconnecting geophysics and engineering. This initial probe has categorizedthe various techniques utilized in geophysical exploratory programs,especially with respect to engineering relevant data. All activities inthe region of the geothermal well, from speculations into most probablereservoir configurations to fluid flow properties in the well itself, tomeasurement of the necessary parameters, have been considered. Study #2,
~
well test analysis, logically extends the first. Methods used by thepetroleum industry have been studied for adaptation to geothermal fluids.
The purpose of a reservoir engineering study is to collect enoughinformation to reveal the nature of the reservoir and to determine the
-102-

pertinent physical parameters which control the behavior of fluids in thereservoir. Some of the questions that need to be asked are:
What are the temperature and pressure ranges of the fluid?What is the nature of the fluid; i.e., vapor, liquid or a mixtureof both?What is the chemical composition of the fluid?What is the expected production rate and expected life of thereservoir?
After the geologists and geophysicists have decided on the drill siteand drilling has commenced, a reservoir testing program should be outlined.Well tests are performed in two phases. In the first phase tests areperformed during open-hole drilling operations. They consist of fluidtemperature measurement, fluid sampling, core analysis, and formationlogging. After completion, the production well must undergo a secondphase of tests to determine the thermodynamic condition of the fluid andthe adequacy of the reservoir. Measurements are taken both at the wellheadand downhole.
1. HardwareThe following list outlines the hardware to adequately measure
a geothermal reservoir [13, 16-20J.a. Subsurface formation condition
Permeability: resistivity logs, core samping.Porosity: resistivity logs, core sampling, densitylogs, neutron logs, sonic logs. .Water saturation: resistivity logs, porositymeasurements.
b. Evaluation of well casing: inclination for deviationsurvey, wellbore calipering, casing condition.
c. Downhole fluid conditionPressure: Amerada-Kuster RPG-3 gauge, pressuretransducer, gas purge tube with pressure element.Temperature: expansion thermometer, resistancethermometer thermocouple, geothermograph, maximumregistering thermometer, temperature sensitivepaint, metal, and ceramic pellets.Flow rate: mechanical spinner, electronic flowmeter.Fluid sampling: Kuster sampler, Schlumbergersampler, gas purge tube with fluid sampler.
-103-

TABLE 3.1-1 RESPONSES TO INTERNATIONAL QUESTIONNAIRE
NAME ANDAFFILIATION
B. C. McCabeMagma Power CompanyUSA
WHAT IS THE NATURE OFA GEOTHERMAL RESERVOIR
In geothermal reservoir engineering,the theoretical information to determine the size or longevity of a geothermal field is a very inexactscience. For steam and hot waterreservoirs, no one knows what the %of replaceable heat is coming intothe reservoir in proportion to theamount being withdrawn. Probably,the replacement heat is much greaterthan it is generally imagined.
WELL TESTING ANDHARDWARE
No reply
ANALYSISSOFTWARE
No reply
I--'o+:=>I
w. K. SummersNew Mexico Bureauof MinesUSA
Giancarlo E. FaccaRegistered geologistItaly and USA
Geothermal fluids consist of twocomponents: 1) meteoric water and2) gases (H2S and COZ)' rising fromgreat depths. The mlxture of thecomponents occur in fractures. Ifthe fractures are sufficiently closetogether, a well will produceroutinely. Otherwise, onlyoccasional wells will produce.
Geothermal fields are composed of:1) a deep sequence of layers, heatedby an underiying magmatic stock andwhich, in turn, heats the overlyingporous strata, and 2) a verypermeable layer with thickness,porosity and permeability of such anorder as to allow the formation andthe permanence of a system of convection currents in the water fillingthe pores of the rock, and 3) animpermeable layer over the reservoir.
Petroleum or groundwater Computer technology ishydrology equipment can generally adequate, butbe used, as modified to software is dependent onincorporate temperature. adequate sampling of the
flow continuum and theproper incorporation ofthe parameter temperature.
Refer to United Nations Refer to United Nationsand UNESCO publications and UNESCO publications[26, 27, 28, 29, 30]. [26, 27, 30, 31, 32, 33].

W. E. AllenOil and Gas ConservationCommission (Arizona)USA
References 26 - 36.
TABLE 3.1-1 (CONTINUED)
References 26 - 36. For the purpose ofpredicting well performance,there are no marketingcompanies in Arizona.
Robin KingstonKingston, Reynolds,Thom, and Allardice,Ltd., New Zealand
~ Enrico Barbier~ International InstituteI for Geothermal Research
Italy
Refer to United Nations publicationsin References 26 - 36.
Refer to United Nations and UNESCOpublications [35, 36].
Refer to articles- by D.K.Wainwright [34] and A.M.Hunt [27].
Equipment and othe~
hardware are generallynot available.
Prediction of well performance is a composition ofpermeability, temperature,reservoir capacity, andrate of flow. Permeabilityin geothermal terms dependson fracture zones much morethan on porosity. Oilreservoir assessment techniques can in ~ome applications be modified forgeothermal applications.
The evaluation of thequality of a geothermalwell is uncertain. Analogies are generally madewith existing wells.
J. L. Gui zaGeothermal ResourcesCerro PrietoMexico
Geothermal fields are classified intotwo major groups: 1) sedimentaryfields and 2) volcanic fields. In asedimentary field the.productivestrata is a permeable sandstoneinterbedded by impermeable claylayers. The sandstone is saturatedwith meteoric water, and the heatflow is due to the faults andfissures of the granitic basement. Involcanic fields the possible production mechanism is due to the water flowthrough fissures in the volcanic rocksbeing heated by a cooling magmaticbody.
For the determination of The performance in a wellreservoir parameters such can be predicted by meansas permeability index and of a hydrologic modelporosity, the synergetic modified by the temperaturelog named SARABAND is effect and taking intoused. For temperature, account the physical charac-pressure, and flow teristics of the productivemeasurements the sandstone as well as theconventional systems physical-chemical properties(Kuster RPG and KTG of the geothermal fluids.instruments) are For the purpose of optimi-employed. zing well locations,
computer programs are usedto simulate fieldproduction.

d. Surface fluid conditionPressure: aneroid barometer, mercury column, glassmanometer, pressure recorder.Temperature: filled thermal measuring systems,resistance bulbs, thermocouples.Flow rate (and enthalpy): separator, orifices, andweirs for separate vapor and liquid flow, beta ray,gas method, magnesium sulfate injection, criticallip pressure, conductivity, calorimetry.
In fluid measurment the data obtained from one particulardownhole instrument are not always reliable due to its operationalcharacteristics. Combined readings from two or more instrumentsfor a certain parameter are desirable to predict a specificsubsurface condition. Data generated from these measuring devicesare cross-verified to determine the probable downhole condition.2. Analysis
Although the two types of analyses to be described are closelyrelated, they are being separated because part "A" is the classicalmethod used by geologists and petroleum engineers. This techniquehas an empirical foundation and is not conducive to the analytical/computer solutions to be developed in part "B."
a. Formation EvaluationThe proper interpretation of data from well tests will
determine the feasibility of utilizing a geothermal well.Both open-hole nonflowing and cased-hole production tests areused to aid in characterizing a reservoir. The required dataincludes formation thickness, permeability, porosity, watersaturation, viscosity, compressibility, fluid and rockdensity, temperature and formation fluid pressures. Thevalues for these parameters can be obtained in different waysdepending upon the developmental phase of the well. Forpractical purposes, it is important to understand the ways inwhich these values are obtained.
In early logging the previously described analyticalmethods were done manually to obtain the desired subsurfaceinformation. However, with significant advances by well
-106-

., !
service companies, the process is now performed by applyingcomputer programs for specific types of formations. Thetwo common types of complete open-hole interpretation.programs are the SARABAND and the CORIBAND techniques, bothdeveloped by the Schlumberger Company. SARABAND is applicablefor shaley sands while CORIBAND is used primarily for complexlithologies.b. Well Test Analysis
In order to evaluate a geothermal reservoir, whether itbe drilling, development or production, various data oncertain parameters are needed~Pressure is a particularlyimportant parameter for use in materials heat balance calculations of geothermal liquid in place and determination ofreservoir characteristics: compressed liquid, saturatedliquid and steam or superheated steam. Extrapolation intothe future is best made by using the method which relatesfuture production to future average pressure. Tests to beconducted include pressure drawdown and buildup, with specificdetermination of skin effect, interference and other desiredfeatures.
In the general sense, software encompasses both computerprograms and the standard type curve analysis. It appearsthat the methods of analysis used in the petroleum and gasindustries cannot be naively applied to geothermal systems.A geothermal reservoir has temperature as the dominantparameter. Most petroleum reservoir analyses are based onisothermal conditions. Whiting [4J and Ramey [15J havesuccessfully demonstrated that the regular volumetric balancemethod in petroleum engineering does not apply to geothermalreservoirs, but rather a material and energy balance methodis needed. However, in most cases, the principles of petroleumreservoir engineering for single-phase liquid flow can beapplied with certain modifications to hot water reservoirs [21].
-107-

III. Physical ModellingInvestigators: P. Takahashi &B. Chen
The physical model is a necessary balance to the ongoing softwareinvestigations. The physical model will not only serve as a convenientcheck on the math model, but will simulate conditions not easily attemptedby software. The objectives of the initial physical model studies will beto bring together known information about related laboratory studies,analyze the state-of-the-art, design the hardware system required forsimulation, and initiate fabrication and preliminary tests.
Very little physical modelling work has been reported in the literature.The significant studies related to geothermal reservoirs include those ofG. Cady [22J, F.G. Miller [23J, H. Henry and F. Kahout [24J, and theremotely related work of J. Bear [25J. However, none of the reportedinvestigations approached the problem on a total systems basis whileconsidering the high [2012°F (1100°C) for magma, 527°F (275°C) at we11headJtemperatures expected.
In movement of fluid through a geothermal reservoir, the drivingforce is primarily the buoyant force. This fprce is created by heat withinthe geothermal system which decreases the fluid density. The dimensionlessnumber determined to be of prime interest to the study is the RayleighNumber (Ra). The Rayleigh Number is the product of the Grashof (Gr) andPrandt1 (Pr) Numbers, where
Gr = buoyant forceviscous force
To insure similarity between the physical and mathematical models andthe actual reservoir, a modified Rayleigh Number will be used. Thisdimensionless ,number is defined as follows:
mod Ra = Ra .15.L2
where Ra = Rayleigh No.k= permeability (units of length squared)L = characteristic length
3since Ra = f3g~TL
av
mod Ra =mItlTLKav
-108-

where a =coefficient of thermal expansiona = thermal diffusivityv = kinematic viscosityg = gravitational constant
~T =difference in temperature between the reservoir and oceanL = height of aquifer
Convection is initiated at a modified Rayleigh Number of 40; mod Ra'sup to 1,000,000 can be expected for actual conditions in Hawaii. Calculations showed that it is possible to obtain mod Ra's up to 1,000 using thefull scale unpressurized model. This model is tentatively planned to havea seawater capacity of 450 gallons, a variable (in size and temperature)heat source and glass bead permeable medium. As the model will be twodimensional, one face will be used to insert temperature measurementdevices to obtain the temperature profile.
Three glass bead mesh sizes will be used to vary permeability.Various researchers have speculated that macroscopic fractures will resultin aquifer permeabilities in the order of several hundred darcies. It wasfortuitous that glass bead permeabilities were available to strad1e thisrange and yet provide for reasonably high modified Ra numbers. Glass beadshaving mesh size/permeability of 12-14/1490, 20-30/319, and 40-50/80 wereselected. Lower permeabi1ities can be obtained by using higher mesh sizesconsolidation, or artificial dike formation.
A preliminary 50-gallon (1/3 size) model will be initially built.This smaller tank will give an economical means of testing constructionand operational costs. Certain design questions such as to pressurize orunpressurize will also be answered. The heat source and temperaturemeasurement and recording instruments will be the same for both thepreliminary and final models. Materials and equipment for the preliminarymodel have been ordered and fabrication has commenced.
-109-
TASK 3.1 REFERENCES
1. Cheng, P. and Lau, K. H., "Steady State Free Convection in an UnconfinedGeothermal Reservoir," Jou:t'Ylal of Geophysical Research~ Vol. 79, No. 29,1974, pp. 4425-4431.
2. Lau, K. H. and Cheng, P., liThe Effect of Dike Intrusion on FreeConvection in a Geothermal Reservoir," Technical Report 7, HawaiiGeothermal Project, December 1, 1974.
3. Keller, George V., "Drilling at the Sunmit of Kilauea Volcano,"prepared for NSF, Colorado School of Mines, March 1974.
4. Whiting, Robert L., "A Reservoir Engineering Study of the WairakeiGeothermal Steam Field," Private Communication.
5. Muffler, L. J. P., and White~ D. E., "Geothermal Energy," The ScienceTeacher~ Vol. 39, No.3, March 1972.
6. Facca, Giancarlo, "Structure and Behavior of Geothermal Fields,"Geothermal Energy~ UNESCO, 1973, pp. 61-69.
7. Elder, John W., "Physical Processes in Geothermal Areas," TerrestialHeat Flow~ ~oJ. H. K. Lee, Editor, No.8, 1965,ppo 211-239.
8. Hayashida, 1. and Ezima; Y., "Development of Otake Geotherma'l Field,"United Nations Symposium on the Development and utiLization of GeothermalResoUY'ces~ Pi sa, 1970.
9. MacDonald, G.A., Volcanoes~ Prentice-Hall, Englewood Cliffs, 1972.
10. Steinberg, G. S. and Rivosh, L. A., "Geophysical Study of the KamchatkaVolcanoes," JOUY'nal of Geophysical Research~ Vol. 70, 1970, pp. 33413369.
11. Keller, George V., IIDrilling at the Summit of Kilauea Volcano,1I preparedfor the National Science Foundation, March 15, 1974, p. 42.
12. White, D. E., IIGeochemistry Applied to the Discovery Evaluation andExploitation of Geothermal Energy Resource," Raporteur's Report, UnitedNations Symposium on the Development and Utilization of GeothermalResoUY'ces~ Pisa, 1970.
13. Kennedy, George C. and Griggs, David T., Power Recovery from the KilaueaIki Lava Pool, Rm- 2696 - AEC, December 12, 1960.
14. Colp, John L. and Furumoto, A. S., The Utilization of Volcano Energy~
proceedings of a conference held at Hilo, Hawaii, February 4-8, 1974.
15. Ramey, Henry, IIA Reservoir Engineering Study of the Geysers GeothermalField," Private Correspondence, 1973.
-110-

16. Fournier, R. O. and Morgenstern, J. C., A Device for CollectingDownhole Water and Gas Samples in Geothermal Wells, U.S.G.S. Paper750-C, 1971, PC151 - C155.
17. Fournier, R. O. and Truesdell, A. H., A Device for Measuring DownholePressures and Sampling Fluids in Geothermal Wells, U.S.G.S. Paper750-C, 1971, PC146 - C150.
18. Marshall, G. S. and Henderson, R. H., "Recording Temperature in DeepBoreholes," Engineering, October 25, 1963, p. 540.
19. Sch1umberger, Log Interpretation Volume I and V, Schlumberger Ltd.,New York, 1972 and 1974.
20. Schlumberger, Production Log Interpretation, Schlumberger Ltd., NewYork, 1970.
21. Bo1dizsar, T. ,IIGeothenna1 Energy Production from Porous Sediments inHungary,1I Geothermics, U.N. (Pisa), Vol. 2, Pt. 1, pp. 99-109.
22. Cady, G. V., "Model Studies of Geothermal Fluid Production," Thesispresented to Stanford University, 1969, in partial fulfillment of therequirements for the Degree of Doctor of Philosophy.
23. Miller, Frank G., "Steady Flow of Two-Phase Single-Component FluidsThrough Porous Media," Petroleum Transactions, ArME, Vol. 192, 1951,pp. 205-216.
24. Henry, H. and Kahout, F., "Circulation Patterns of Saline GroundwaterEffected by Geothermal Heating--as Related to Waste Disposal,"Underground Wastewater Management and Environmental Implications,Vol. 18, 1973, pp. 202-221.
25. Bear, Jacob, Dynamics of Fludis in Porous Media, American ElsevierPublishing Company, 1972.
26. Banwe11, C. J., Geothermal Drillholes: Physical Investigations,United Nations (Rome), 1961, pp. 60-71.
27. Hunt, A. M., Measurement of Borehole Discharges, Downhole Temperaturesand Pressures, and Surface Heat Flows at Wairakei, United Nations (Rome),1961, pp. 196-207.
28. James, Russell, "Metering of Steam-water Two-phase Flow by Sharp-edgedOrifices," Proceedings: Institution of Mechanical Engineers, Vol. 180,Pt. 1, 1965-66, pp. 549-566.
29. Smith, J. H., "Collection and Transmission of Geothermal Fluids,"Geothermal Energy (Earth Sciences 12), UNESCO, 1973, pp. 97-106.
30. Bolton, R. S., "Computer Analysis for the Wairakei Geothenna1 Field,"New Zealand Engineering, September 15, 1964, p. 348. ,
-111-

31. Bengma, P., The Development and Perfo~ance of a Steam-Water Separatorfor Use on Geothermal Bores, United Nations, (Rome), 1961, pp. 60-77.
32. Mahon, W. A. J., Sampling of Geothermal Drillhole Discharges, UnitedNations (Rome), 1961, pp. 269-277.
33. Armstrong, E. L. and Lundberg, E. A., Geothe~al Resource InvestigationsTest Well Mesa 6-1, February 1973.
34. Wainwright, D.K., "Subsurface and Output Measurements on GeothermalBores in New Zealand," Geothe~ics, U.N. (Pisa), 1970, Vol. 2, Pt. 1,pp. 764-767.
35. James, Russell, Alternative Methods of Dete~ining Enthalpy and MassFlow, United Nations (Rome), 1961, pp. 265-267.
36. Banwell, C. J., "Therma1 Energy from the Earth IS Crust--Parts 1 & 2-The Efficient Extraction of Energy from Heated Rock," New ZealandJournal of Geological Geophysics, Vol. 6 &7, 1964, pp. 52-69 (6),pp. 535-593 (7).
-112-

TASK 3.6 OPTIMAL GEOTHERMAL PLANT DESIGNInvestigators: H. C. Chai, J. Chou &D. Kihara
INTRODUCTION
The efforts of Task 3.6 have been concentrated on studies ofgeothermal power plant configurations which might be considered for usein moderate temperature, low salinity fields. Emphasis has been placed onvapor flashing plants and binary fluid, vapor turbine cycles--focusing onthe major parameters and criteria for selecting the particular configuration once the geothermal source is located and tested.
I. Vapor Flashing Plants
A. Selecting Flashing PressuresIn a vapor flashing system hot water is flashed to steam at a pressure
lower than the wellhead pressure. The vapors thus generated may be usedto drive a mixed pressure turbine~ Flashing may be done in a centrifugalcyclone separator. Bengma [2] discusses the development and selection ofa steam water separator. Chierici [4] draws some important conclusionsabout the feasibilfty of using a condensing plant.
Work output from the turbine is the product of steam flow rate andthe available energy. In a simple flashing system, the lower the flashingpressure, the higher the steam production rate. However, available energyassociated with each pound of steam decreases with the lowering of the.separator pressure. Therefore, there exists an optimum flashing pressurefor obtaining maximum power from the hot water. At a pressure higher thanthe optimum, work output is small due to minimal available energy. At apressure lower than the optimum, low turbine work results because of thediminished steam flow rate.
By employing multi-stage flashing, the temperature of dischargedwater is lowered and thus the work output of the plant can be greatlyincreased. The number of stages of flashing is a matter of economicjustification. Power contribution of an additional stage decreases as thenumber of stages increases, and specific volume of steam increases rapidlyat low pressure to cause high cost of the multi-stage arrangement. Anadvantage of multiple admission of steam to a mixed pressure turbine is to
-113-

improve the quality of the exhaust steam, thereby reducing erosion of theturbine blades. Also, steam flashed from separated water is practicallyfree of gases. The percentage of gas content in the exhaust steam can belowered by blending the flashed steam with the steam directly from thewell. In a mixed~pressure turbine, there are separate inlets for steam atdifferent pressures, and each inlet is equipped with its own control valve.
Hansen [7] stated that for a simple flashing cycle, optimum flashingpressure corresponds to a saturation temperature halfway between the wellwater temperature and saturation temperature of the condensate in thecondenser. For example, for 400°F well water and 120°F condensate, theoptimum flashing temperature should be 260°F. He extended the rule to themulti-stage flashing plant. For well water at 400°F, condensate at 120°F,and three-stage flashing, optimum intermediate pressures should correspondto saturation temperatures of 330°F, 260°F, and 190°F, respectively. Aprocedure, based on mass and heat balances has been worked out to determinethe exact optimum flashing pressure with numerical methods; the resultsconfirm Hansen's rule of approximation. The steepest ascent methodutilizing a digital computer was used to determine the optimum flashingtemperatures.
For saturated well water at 400°F and condensing temperature of 120°F,the total turbine work per pound of well water is tabulated in Table 3.6-1for one- to four~stage plants. With reasonable amounts of heat lossesthrough the flashing tanks, Hansen's rule of approximation yields nearlythe same amount of work as obtained by the exact method. As expected, thepower contribution of an additional stage diminishes as the number ofstages increases. Also, the specific volume of steam increases rapidly tocause difficulty in turbine design. Thus the number of flashing stages islikely to be limited to two. Because of the pressure drops through pipesand the high cost of low pressure equipment, the most economical flashingtemperatures should be slightly higher than the calculated optimumtemperatures.
B. Optimum Wellhead PressureThe wellhead pressure affects the sizes of pipeline and plant
components, the total flow rate of fluid from the well, and the specificsteam consumption for power production. The power output can be enhanced
-114-

TABLE 3.6-1 FLASHING TEMPERATURES AND TOTAL WORK FOR SATURATED WATERAT 400°F AND CONDENSING TEMPERATURE AT 120°F.
Work, Btu Per PoundIndex t of t2° F t3°F t4°F of Well Water1
280 22.377
1 260 23.085+240 22.89220 21. 743
2 307 213 29.33+
330 260 190 32.034+
3 326.6 257.1 186.04 32.068322.91 255.23 183.31 32.084*313.94 248.04 173.94 31. 979
344 288 232 176 33.173+
4 335.24 276.37 216.02 170.93 33.681332.56 275.0 218.71 167.80 33.713*334 168.65 221.46 161.67 33.615
330 260 190 31.193+
5 322.02 253.57 185.33 31.267316.83 247.10 180.75 31.271*304.92 224.22 172.18 30.962
330 260 190 27.035+
6 315.12 247.25 181.36 27.513300 228 169 27.7 *287.6 173.8 132.64 20.563
330 260 190 17.08S+
7 301. 67 253.3 174.09 19.571267 192.29 146.39 20.892*254.62 173.8 132.64 20.562
+ Equal distribution of temperature difference.
* Optimal flashing temperatures.
1 I-stage flashing, no heat loss, zero moisture content offlashing vapor, saturated water leaving tank.
-115-

TABLE 3.6-1 (Continued) FLASHING TEMPERATURES AND TOTAL WORK FORSATURATED WATER AT 400°F AND CONDENSINGTEMPERATURE AT 120°F.
2
3
4
2-stage flashing, no heat loss, zero moisture content offlashing vapor, saturated water leaving tank.
3-stage flashing, no heat loss, zero moisture content offlashing vapor, saturated water leaving tank.
4-stage flashing, no heat loss, zero moisture content offlashing vapor, saturated water leaving tank.
53-stage flashing, no heat loss, 3% moisture content offlashing vapor, superheated water leaving tank (z = 0.015).
6 3-stage flashing, with heat loss (y = 0.97), 3% moisturecontent of flashing vapor, superheated water leaving tank(z = .015).
7 3-stage flashing, with heat loss (y = 0.90), 3% moisturecontent of flashing vapor, superheated water leaving tank(z = 0.015).
Turbine efficiency is assumed to be 75%.
-116-

by employing a multi-stage flashing plant. To evaluate the effect ofwellhead pressure and number of stages on power output, the optimum wellhead pressures have been calculated for four different arrangements. Thetypical flow rates of wells for the purpose of calculations are given inFig. 3.6-1, which shows that the well flow rate decreases as the wellheadpressure increases. The power output is the product of the flow rate andthe work per pound of fluid, whose available energy decreases correspondingly with the decrease in wellhead pressure. There exists an optimumwellhead pressure for the maximum power output of each arrangement. Theoptimum flashing pressures can be determined by using the rule discussedin Section 1.
In,Fig. 3.6-1, the curves near the points of maximum power output areflat. It appears desirable to select a wellhead pressure higher than theoptimum pressure since the sizes of pipes and equipment can be lowered byincreasing the working pressure. However, Usui et ale [13J argued that itis not advisable to select a wellhead pressure higher than the pressurewhich gives the maximum power because 1) such a design is apt to sufferpower decrease by scale deposition on the nozzles and blades of the turbine,and 2) the well flow rate does not remain constant with time. At lowwellhead pressure, the drop of flow rate may be retarded, and the underground paths of water are less likely to be blocked.
C. Heat Balance of a Hypothetical PlantThe heat balance of a two-stage vapor flashing plant is given in this
section. Fig. 3.6-2 shows the flow diagram of the plant, for which thebasic assumptions are as follows:
Power output = 8~
Number of cyclone separators = 2Wellhead pressure = 100 psigNumber of wells = 2Water flow = 106 1b/hrGas flow = 3000 lb/hrEnthalpy of water = 400 Btu/1bPressure drop in main pipeline = 10 psiCondensation loss = 3% of the heat content of waterTurbine-generator efficiency = 73%
-117-

5.5
5.0
6.0
7.0
6.5
3.5~
~..~Pi+'~0
HQJ
>0p.,2.0
1.5
1.0
0.5
300250200150100
1'J.o~"'R
Enthalpy of mixture = 460 Btu/l
Cond~nsation loss ~ 5% of heat conte
Pressure drop between wellhead andturbine = 20 psi
Turbine efficiency = 73%Condensing temperature = 120°F
3 • 5 ......_ ........_...-.__"'-_........._---.1.__...1..-_........._-l'---l__-l
50
4.0
•~ 5.0~4HoC)
i~
E:!
6.0!
III
~ 5In .5ori
Wellhead Pressure, ps;g
FIG. 3.6-1 WELL FLOW RATE AND POWER OUTPUT VERSUSWELLHEAD PRESSURE
-118-

\0 COowo~
-n c.nooo:E:
wo00'100
m:c
.J'
~
........c.naoo~
~
c.no
o"T1
T -11400\;'1I 343 GI IIN~ I\.0 0
' ........ 0 Im:c I
466850 W
7900000 W
wn=0~
:::I: 0..CD. ~
PJVIt:r CDV1-S.
I I ~ I
~g I
I 00 I·-I-gOOW ~
I 2360 G 0'1 ~:c ~·~ g PJ C; 200 W
I 1m :E: g ~ 2657 G •_.J . ~'--.
A-o-.....--I179900 W2360 G~co
..... 00 ........
0\.0-no
aa:E:
104000 W223°F
........\0\0ooo:c
rg;;o-; - -175900W·- - rbi;,;-I 2970 G L..}330 G .I 90 PSIG I ~8~MW~I
Cyclone903000 W Separator
1000000 W3000 G
ProductionWells
I--'--'\0I
W• lb. wat.r and steam per hr•• G = lb. gas per hr.
54150 W
Reinjection
Hot Well8600000 W
CondensatePump
CoolingTower
CirculatingPump
FIG. 3.6-2 FLOW DIAGRAM OF A VAPOR FLASHING PLANT

Pump efficiency = 75%Fan motor efficiency = 90%Ejector efficiency = 5.6%Condensing pressure = 3 in. Hg. abs.Wet bulb temperature = 75°FApproach of cooling tower = 15°F
The process of heat balance involves the selection of the optimum flashingtemperature, the energy and material balances of geothermal water, noncondensable gases and cooling water. The optimum flashing temperature ofthis example is 223°F, as determined by the rule stated in Section 1. Afterthe temperature in the second cyclone separator is selected, the steamproductions of the two separators can be determined. They are 97,000lb/hr and 104,000 lb/hr, respectively.
The wellhead pressure affects the flow rate of fluid from the welland the specific steam consumption for power production. To evaluate theeffect of wellhead pressure on the specific steam consumption, Fig. 3.6-3has been constructed for different enthalpies of well water. The graphshows that the pressure which yields the highest power output per millionpounds of water, i.e., the lowest specific steam consumption, increases asthe enthalpy of well water increases.
D. Using Deep Ocean Water as Cooling WaterIn Hawaii, the average temperature of seawater is 81°F at the surface
and 41°F at a depth of 1,600 ft. For a geothermal plant near the sea, thecost of using sea water as cooling water in a condenser is likely to belower than the cost of recycling the cooling water through a cooling tower.Assuming the back pressure of a steam turbine is 2.0 in. Hg for a plantusing the surface sea water as cooling water, the back pressure could belowered to 0.5 in. Hg with the same condenser design if the cooling wateris taken from the deep ocean. The variation of turbine output with coolingwater temperature is illustrated in Fig. 3.6-4. Since the isobutaneturbines have higher efficiencies than the steam turbines, the gain inpower output of an isobutane plant should be more impressive than that ofa steam plant. It is intended to expand the study on extracting moreenergy from geothermal fluids by taking advantage of deep ocean water.
-120-

14
_ soO ~)tU"b13 Entna1PY -
we1' water
Well flow rate =106 lb/hr12 Gas Flow =3000 lb/hr
Pressure drop in mainpipeline = 10 psi
11 Condensation loss = 3% of the heatcontent of water
Turbine efficiency = 73%
~10 _ 4S0 e,.U!1 b
Well Water Entha1PY -•
+J~C.+J~ 90
s-CI~0Q. .
+J 8CIzWell Water Enthalpy =400 BTU/lb
7
6
Well Water Entha1 y = 350 BTU/1b
150125100754~ -I- ---t. .L..- ---I
50Wellhead Pressure. psig
FIG. 3.6-3 VARIATION OF SPECIFIC POWER OUTPUT WITH WELLHEADPRESSURE FOR ATWO-STAGE VAPOR FLASHING PLANT
-121-

300
200
Turbine Output
20
•+'::sc.+'::soClJs::.,....aS::s....
100____G~a~in in Turbine Output
30
•+'::sc.+'::soClJs::.,...
..0s::st-
10 s::.,...
o160140120100
Inlet Steam at Saturated Conditions
80
0 --.;.. --.,;,...__...;..-. -1
60
Throttle .Pressure. psia
FIG. 3.6-4 EFFECT OF TEMPERATURE OF COOLINGWATER ON TURBINE OUTPUT
-122-

II. Binary Fluid,VaporTurbine Cycles
A. Simultaneous Fresh Water Production and Electrical Power Generationwith a Regenerative Binary Fluid CycleThe expected performances and the advantages of a closed cycle using
isobutane as the working fluid have been discussed in detail by Anderson[lJ and Holt et al. [8]. In a basic cycle described in the literature(Fig. 3.6-5), geothermal fluid from wells is used as the heat source.Holt et al. evaluated the effects of isobutane pressures on the thermalefficiency of the basic cycles and found that the optimal working pressurelargely depends upon the temperature of available geothermal fluid. Theoptimal working pressure increases with the increase of brine temperature,and the isobutane vapor exiting the turbine has to be at highly superheatedconditions in order to achieve high thermal efficiency.
To improve the thermal efficiency of a simple gas turbine cycle, aregenerator may be used to allo~1 the interchange of energy between theturbine exhaust and the compressed air entering the combustion chamber.This principle can be applied profitably to the basic isobutane cycle fora geothermal power plant as shown in Fig. 3.6-6. A sample calculation wasmade to evaluate the advantages of adding a regenerator to the basic cycleunder the following assumed conditions:
1. The efficiency of the isobutane turbine-generator is 85%, andthe efficiency of the feed pump is 80%.
2•. One million 1bs. of hot water flows into the power plant at400°F with heat content of 375 BTU per lb.
3. The minimum temperature difference between the hot water andthe isobutane is taken to be 10°F in a counter-flow heatexchanger.
4. The condensing temperature of isobutane is 120°F.5. The ter~ina1 temperature difference of isobutane in the
regenerator is 10°F. Pressure drops and heat losses of thefluids through pipes and heat exchangers are neglected.
The mass flow rate of isobutane and the throttle temperature at variousoperating pressures are shown as follows:
-123-'

700 psia,0;;. '~ - " .
TURBINE-GENERATOR
o70 F w.b.t.
Water = 1.2Air
COOLINGWATER
MAKE-UP130,000 lb/hr
REINJECTIONWELL
O'iJiSOBUTANE>375 F
HEAT EXCHANGER
PRODUCTIONWELL
WATEg400 F
""-'t'l~~ 106 lb/hr
FIG~ 3.6-5 BASIC ISOBUTANE CYCLE
TURBINE-GENERATOR
{iffi , "··'I'SOBUTANE
HEAT EXCHANGER
WATER400°F
T7T'l~~r777' 106
1b/hr
PRODUCTIONWELL
°70 F w.b.t.
Water = 1.2~ Air
COOLINGWATERMAKE-UP102,000 1b/hr
FRESHWATER497,000 lb/hr
FIG. 3.6-6 REGENERATIVE VAPOR-TURBINE CYCLEAND MULTI-EFFECT EVAPORATOR
-124-

OPERATINGPRESSURE,
PSIA900800700600500400
THROTTLE TEMPERATURE,oF
380375375390380390
. MASS FLOW RATE, 103 LB/HRBasic RegenerativeCycle Cycle1000 1015
998 1006919 933913 925914 916855 856
To illustrate the significance of the results, power production, heatrejection and temperature of water 1eavi.ng the heat exchanger are plottedin Figs. 3.6-7, 3.6-8, and 3.6-9, respectively. The increases in powerproduction by using a regenerator are insignificant; the maximum gain isin the order of 2% of the power produced by the basic cycle at the optimumoperating pressure of 700 psia. However, the rates of heat which must berejected to the environment differ noticeably between the two cycles. At700 psia, the rate of heat rejection of the regenerative cycle is reducedto 72% of the basic cycle. Since the heat rejection equipment is a majorcost item in the geothermal power plant, the application of the regeneratorshould significantly affect the total cost of the plant. The capital costof a regenerator could be offset by the reduction of the size of the mainheat exchanger. and the heating surface of the regenerator is free fromcorrosion and scaling, which may adversely affect the primary heatexchanger. The temperature of water leaving the heat exchanger of theregenerative cycle is much higher than that of the basic cycle, as shownin Fig. 3.6-9. Thus, the heat can be economically extracted from thedischarge of hot water for industrial applications. Many geothermalreservoirs are located in areas where the supply of fresh water isinadequate; if so, the regenerative cycle offers a great potential forsimultaneous production of fresh water and electrical power. As indicatedin Fig. 3.6-6, the discharge of hot water may be led to a multi-effectevaporator to convert part of the water from a geothermal well to distilledwater. The knowledge of designing such an evaporator is very well advancedfrom research sponsored by the Office of Saline Water. Depending upon thedesign of the heat rejection system and weather conditions, the waterevaporated in cooling water is in the order of 102,000 1bs. per hour for a·10 MW regenerative isobutane plant operating at 700 psia. With a six-
-125-
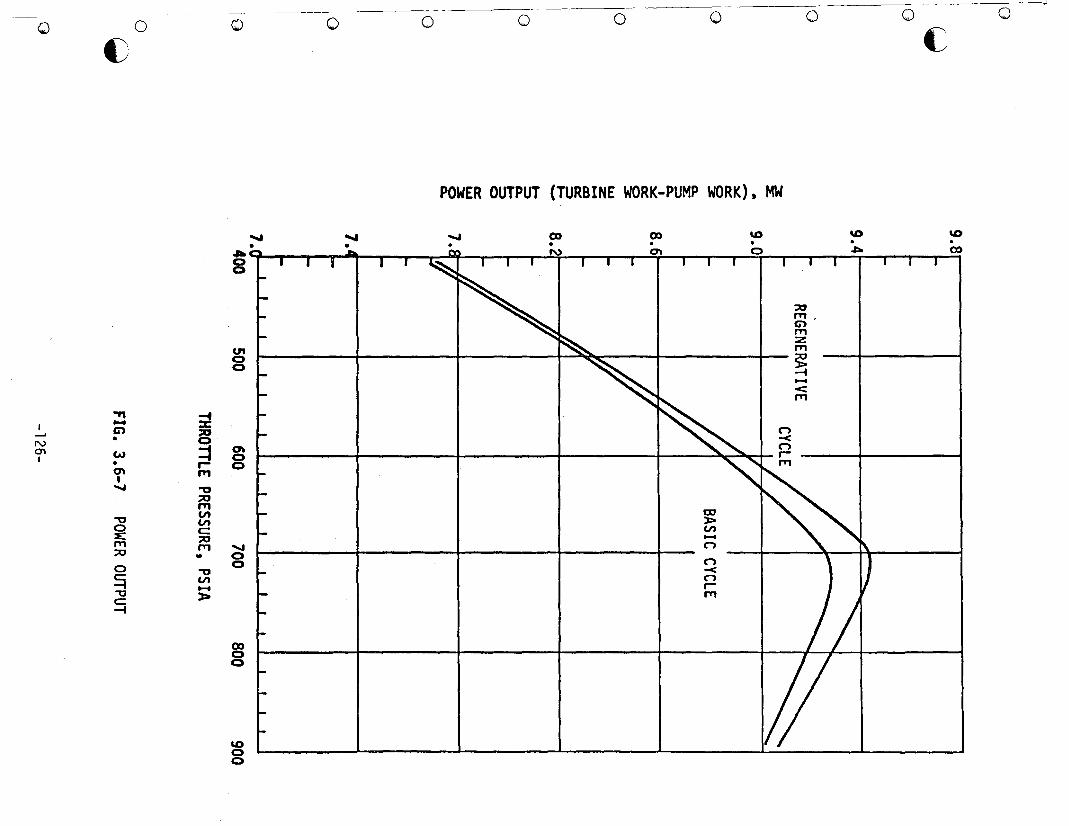
o()
o o o o o o oc
()
POWER OUTPUT (TURBINE WORK-PUMP WORK). MW
\0oo
..... ..... ..... ClO ClO \0
• • . . . .... ClO00
::10FT1 •enFT1:z
U1 FT10 ~0 -4-<:
FT1
." :i!I ---"G) ::10
N • 0O'l w =1 0\I 0• r- 00\ FT1
I...... "'0::10FT1
."Vl IXJVl ~
0 C Vl:E: ::0 -FT1 FT1 ...... n::0 .. 00 0 n
." -<~ Vl n- r-." ~ FT1C-4
ClO00

200 ..._----r-----r----..,----.-------,
BASIC CYCLE
REGENERATIVE CYCLE
120 ~--~I------J-;---__1f------i--------i
190 1----~j.----J-;---__1r__--~------j
180 1-----+----*""---;----+---"""'7"'1
130 1-----+----I-------.,;J-;-~~__1r__----1
•UI
~:z:o-...~ 140r')LIJa::
8:z:
a:::z:......~
to\C
o- 170 1-----.J-----J-;---__1r__---;------j
900800700600500110 L-J--1.~......L_...L.-L.....J.___L.....L_..L-.I__I.__1.........L-..J.-.L._JL.__L............_'__..L_.L.....I---.L._'
400
THROTTLE PRESSURE. PSIA
FIG. 3.6-8 HEAT REJECTION RATE
-127-

~
'-
~~"""--REGENERATIVE CYCLE
~ .......
~ ----~
I-
BASIC CYCLE-/ ~
--
I I I I I I , I I , I I I I I I I I I I
280
260LI..
0
•«LLJC'Z<::z:CJ 240><LLJ
~LLJ::z:C'z-> 220<LLJ....«LLJ
tc3
LI..0 200LLJ«::;)
~LLJQ.:IE:LLJ.... 180
160400 500 600 700 800 900
THROTTLE PRESSURE, PSIA
FIG. 3.6-9 TEMPERATURE OF WATER LEAVINGTHE HEAT EXCHANGER
-128-

effect evaporator, it is possible to export 497,000 lbs/hr of fresh waterfor the arrangement shown in Fig. 3.6-6. Should the seawater or brackishwater be available from nearby sources for cooling, a multi-stage flashingevaporator might be more suitable for desalting water than a multi-effectevaporator.
B. Computer Simulation of Binary Fluid, Vapor Turbine CyclesComputer programs to study the effects of variations of system
parameters were written and prooftested. The specific system consideredis shown in Fig. 3.6-5. A simple Rankine cycle with superheat and heatinput from a high temperature brine was the focus of our efforts.
Since a task objective would be to minimize the cost of net poweroutput, i.e., well production rate per kilowatt electrical power output,primary attention was on the interaction between the heat input through avertical counterflow boiler and superheater and on various parameters ofthe Rankine cycle.
The performance of the heat exchanger components is governed by thetransport equations and can be determined by the use of correlationequations •. The characteristics of the Rankine cycle are determined by the
. laws of thermodynamics and properties of the working fluid. The interfaceof these two systems occurs at the heat transfer surfaces--the temperaturesof the fluids on either side are functions of the fluid system pressure,and relative mass flow rates.
The computer programs modelling the system under consideration havethe following characteristics:
1. Rankine Cycle Computer Programa. Input
1) Table of property values of working fluid2) Turbine inlet conditions, pressure and temperature
(also superheater exit conditions)3) Condenser outlet conditions, pressure and temperature4) Component efficiencies5} Required net power output
b. Output1) Property values of working fluid at all points in the
cycle2) Cycle efficiency
-129-

3) Mass flow rate for required power output4) Heat rejection rate
2. Boiler and Superheater Computer Programa. Input
1) Properties of working fluid2) Properties of brine3) Brine inlet temperature and velocity4) Working fluid inlet temperature5) Pinch point temperature difference6) Tube material~ diameter, spacing7) Fouling factors
b. Output1) Convective heat transfer coefficients on both sides2) Number of tubes3) Length of tubes4) Total heat transfer rate across tube walls5) Ratio of mass flow rates--brine to working fluid
The vertical configuration was first considered primarily because ofthe availability of suitable heat transfer equations for its design.Correlation equations for boiling heat transfer for a single tube areavailable for both vertical and horizontal tubes. However, the effect oftube spacing and number of tube rows on the average heat transfercoefficient for horizontal heat exchangers is not known 0 This wasdiscussed by Palen et ale [10] but no quantitative results were presented.
In the design of these vertical heat exchangers, Chen's [3] correlation equation is used for the boiling section. The equation is not shownhere because it is long and so many terms are included. Chen's correlationequation was used for the boiling section because 1) his experimentalresults seem to be accurate, 2) the equation applies to boiling heattransfer of fluid flowing in vertical tubes with quality ranging fromo to 100%, and 3) his results agree very well with the experimentalresults of other investigators [5, 6, 11, 12]. For the nonboiling region,the equation recommended by Kays [9] is used.
Hot brine is circulated inside the tubes because of cleaning considerations. Use of finned tubes has not been considered because the inside and
-130-

outside convective heat transfer coefficients are approximately the samemagnitude and there is no need to artificially increase one or the other.
Currently no specific input data are available for the completedesign of the heat exchanger equipment. The brine inlet temperature willbe known only after a productioh well is drilled. The inside foulingfactor will be determined by the brine temperature and the contents ofminerals in the brine. Working fluid inlet temperature will be determinedby whether a dry or wet cooling tower is going to be utilized. Because ofthis situation, a general computer program was written, and all the requiredterms are included in the program for the design of the heat exchanger. Assoon as specific information becomes available, these data will be fed intothe program, and the dimensions of the heat exchanger and other informationsuch as mass flow rates, transfer coefficients, number of tubes required,etc., will be computed and printed. The design procedure used to determinespecifications for the boiler-superheater is based on an overall heatbalance of the heat exchanger, and as a first approximation, heat lossesare neglected.
C. Selection of a Working FluidA short list of possible working fluids with a wide range of
properties was initially studied for possible utilization in a simpleRankine cycle. The analysis of the power producing cycle was conductedfor the following set of conditions:
Net power outputCondenser outlet conditionsHeat source
= 10 MW= Saturated liquid at 100°F= Liquid brine at temperature
indicated= 85%= 75%
Turbine efficiencyPump efficiencyPinch point temperaturedifferencePressure losses and heat lossesneglected
If the consumption of hot brine is to be the governing factor,Figs. 3.6-10 and 3.6-11, which show the required brine flow rate as afunction of turbine inlet temperature, are essential. These figures arefor brine temperatures of 325°F and 375°F. There are some interesting
-131-

7.0
______--------- R-113, 150 psia
6.0
5.0.a
:EQIc:-s-ea 4.0
f+-oQI~
lUa:~ 3.0-.....enen~
2.0
1.0
;-R-114, 400 psiaee=::=:=::: cr:::: R-ll, 200 ps~a
;;e:: ~R-113, 75 pSla>P ~R-114, 300 psia
:=====:::========~~~~....---R-l1, 150 ps;a~===:==::=:========;;:~....-R-C318,300 psia::>a::=::========--.....,;.---;;:..:=- R- C318, 350 ps; a-
0.0 ~----t----+----+---+-----fo----+--260 270 ·280 290 300 310
Turbine Inlet Tempera tl) r,e (oF), . ",'. 't- <;' •~ ", •
FIG. 3.6-10 .BRINE FLOW-RATE'S USING VARIOUS WORKING
FLUIDS WITH BRINE AT 325°F
-132-

2.25R-113, 175 psia,
"2.0
: R-ll,300psiaR-113, 100 psia
1.7 -R-C318, 300 psia- R-C318. 350 psia-« R-ll. 200 psia:r:
1.5......:IE:
~R-114, 300 psiaen-'
'C) R-114. 400 psi a0--
.Q 1.25:IE:
cuc::-s-en....1.00
ell+JIG«~0- 0.75.....
'"'"IG:IE:
0.5
0.2
0.0 ----t-----t'---I-----+----fo---280 300 320 340 360
Turbine Inlet Temperature (OF)
FIG. 3.6-11 BRINE FLOW RATES USING VARIOUS WORKINGFLUIDS WITH BRINE AT 375°F
-133-

observations to be made from Figs. 3.6-10 and 3.6-11. In general, allcurves have positive slopes, which indicates that as turbine inlettemperature is increased, a greater flow rate of brine is required. Thistrend becomes more pronounced as the brine temperature increases.
The effect of using system pressures greater than the criticalpressure is shown in Figs. 3.6-12 and 3.6-13. Fig. 3.6-12 shows the effectof system pressure and turbine inlet temperature on the rate of consumptionof the primary resource, brine. In general, higher system pressures leadto a reduced brine mass flow rate, although a minimum does appear to existfor a system pressure of 700 psia and turbine inlet temperature of 300°F(see Fig. 3.6-13).
D. Parametric Study of a Vertical Counterflow Heat ExchangerThe details of a parametric study of a vertical counterflow heat
exchanger just concluded are detailed in Hawaii Geothermal Project Engineering Program Technical Report No.5. However, a summary of some of theresults is presented here. In this parametric study, one parameter wasvaried while all of the others were kept constant. In this fashion significant trends could be more easily detected.
The variation of total length required as a function of turbine inlettemperature is shown in Fig. 3.6-14. This was part of the standard designbut is shown here to give an indication of the lengths to be expected in aheat exchanger of this type. It is interesting that a minimum for therequired tube length exists at a temperature of approximately 290°F. InFig. 3.6-15, the inside tube diameter is the parameter varied. As thediameter is decreased, the total tube length decreases but the number oftubes increases to compensate for the decrease in surface area per tube.
The following conclusions were drawn from the results of the subcritical pressure and supercritical pressure cases:
1. Systems using supercritica1pressures will require significantlymore tube material than systems employing subcritica1 pressures.
2. Pumping requirements will generally be less for supercriticalpressure conditions than for subcritical pressure conditions.
Under subcritical pressure conditions, variations in turbine inlettemperature wilT produce the following effects:
-134-

1.7..----------------.
-\0o-)(
s...r:
)=--cucs..ea....ocu~
lGa::~oL&-
enIoIt 1.2~.
1.1
260 280 300 320
800
900pSla
340Turbine Inlet Temperature (OF)
FIG. 3.6-12 BRINE FLOW RATE REQUIRED AS A FUNCTIONOF TURBINE INLET TEMPERATURE FOR
SUPERCRITICAL PRESSURES
-135-

1.7'-------------,
-\Do---
1000600 800
System Pressure (psia)
1.1 '--..;.....__...&- -.L. --'
400
FIG. 3.• 6-13 BRINE FLOW RATE AS A FUNCTION
OF SYSTEM PRESSURE
-136-

120 --------------------...,
100 Total TubeLength
80
-t:-.s::.+.I 60tnC4U-J
cu.0:::I... Non-Boiling
40 Length
Boiling Length
20SuperheatLength
340320300280O------r------r-_-_,..-~_~
260
Turbine Inlet Temperature (OF)
FIG. 3.6-14 THE EFFECT OF TURBINE INLETTEMPERATURE ON TUBE LENGTHS
-137-

200 y-------------------, 700
600
200100
180
Total TubeLength
160 500-t:- IIIr- GJ+oJ .c0) ::sc .-GJ 140 400-I ~
0ell.c ~::s ell.- .c
E- ::slG z+J0.-
120 300
80 ......----,,-------,_--_-----J. 1000.5 1.0 1.5 ,2.0 2.5
Inside Tube Diameter (IN)
FIG. 3.6-15 THE EFFECT OF TUBE DIAMETER ONTUBE LENGTH AND NUMBER OF TUBES
-138-

1. Tube 1engths change si gnificant1y in the nonboi1 ingand super- .-heating sections, where they respectively decrease and increaseas turbine inlet temperature increases.
2. The total shell side pressure drop will change significantly asturbine inlet temperature is varied.
3. An increase in the turbine inlet temperature will result in adecrease in the required quantity of tube material.
Conclusions concerning the effect of inside tube diameter are asfollows:
1. Increasing the inside tube diameter will bring about nearlyproportional increases in total tube length and total shellside pressure drop.
2. The quantity of tube material necessary will increase if tubediameter is increased.
TDe effect of pitch was considered and the following conclusions were
drawn:1. Total tube length will increase as pitch increases.2. Frictional and ~ravitationa1 pressure drops are simi1a~ in
magnitude, but the relations between frictional pressure dropand pitch is the inverse of that associated with gravitationalpressure drop and pitch.
3. The quantity of tube material required will decrease as pitchincreases.
Consideration of the effect of scaling resulted in the followingobservations:
1. The presence of scale greatly increases the thermal resistancebetween the brine and isobutane.
2. Total tube length ~ridtotal shell side pressure drop increasealmost proportionately with-scale thickness.
3. Since tube number is unaffected by the presence of scale,required tube material quantity is proportional to tube length.
Consideration of the effect of pinch point temperature difference ledto the following conclusions:
1. Brine mass flow rate increases as the pinch point temperaturedifference increases. ..,
-139-

2. An inverse relationship exists with pinch point temperaturedifference for both total tube length and total shell pressuredrop.
3. Since tube number is not a function of pinch point temperaturedifference, tube material quantity is proportional to tubelength, and therefore has an inverse relationship with pinchpoint temperature difference.
REPORTS AND PUBLICATIONS
1. Chou, J. C. S. and Ahluwalia, R. K., "Regenerative Vapor Cycle withIsobutane as Working F1uid," Geothermios3 3rd Issue, 1974 (in press).
2. Shinxnono, G., Chai, H. C., and Kihara, D., "A Parametric Study of aVertical Heat Exchanger Designed for Geothermal Power Plant App1ication," Hawaii Geothermal Project Engine,ering Program Technical ReportNo.5, Sept., 1974.
3. Ahluwalia, R. K. and Chou, J.C. S., "Ciharacteristics of VaporFlashing Geothermal Plants," Hawaii Geothermal Project EngineeringProgram Technical Report No.6, Nov. 1974.
-140-

TASK 3.6 REFERENCES
1. Anderson, J. H., liThe Vapor-Turbine Cycle for Geothermal PowerGeneration," Geothermal Energy, Stanford University Press, 1973,Chapter 8, p. 163.
2. Bengma, P., liThe Development and Performance of Steam-Water Separatorfor Use on Geothermal Bores,1I Proceedings of U.N. Conference on NewSources of Energy (Rome), Vol. 3, 1961, p. 60. .
3. Chen, J. C., IICorrelation for Boiling Heat Transfer to Saturated Fluidsin Convective Flow,1I Industrial and Engineering Chemistry, Pr,ocess,Design and Development, Vol. 5, No.3, July, 1966, p~ 322-329.
4. Chierici, A., "Planning of a Geothermal Power Plant: Technical andEconomic Principles," Proceedings of U.N. Conference on New Sourcesof Energy (Rome), Vol. 3, 1961, p. 229.
5. Dengler, C. E. and Addoms, J. N., IIHeat Transfer Mechanism forVaporization of Water in Vertical Tubes," Chemical Engineering ProgressSymposium Series, Vol. 52, No. 18, 1956, p. 95-105.
6. Guerrieri, S. A•. and Talty, R. D., "A Study of Heat Transfer toOrganic Liquids in Single-Tube, Natural Circulation, Vertical TubeBoil ers, II Chemical Engineering Progress Sumposium Series, Vol. 52,No. 18, 1956, p. 69-77.
7. Hansen, A., "Thermal Cycles for Geothermal Sites and Turbine Installation at the Geysers Power Plant, California," Proceedings of U.N.Conference on New Sources of Energy (Rome), Vol. 3, 1961, p. 365.
8. Holt, B., Hutchinson, A. J. L., and Cortez, D. H., "Advanced BinaryCycles for Geothermal Power Generation,1I Tenth Annual Technical Meeting, American Institute of Chemical Engineers, Southern CaliforniaSection, April 24, 1973.
9. Kays, W. M., Convective Heat Transfer and Mass Transfer, McGraw-HillBook Co., Inc., 1966, p. 173.
10. Palen, J. W., Yarden, V. A., and Taborek, J., IICharacteristics ofBoiling Outside Large Scale Horizontal Multitube Bundles,1I ChemicalEngineering Progress Symposium Series, Vol. 68, No. 118, 1972, p. 50-61.
11. Sani, R. L., IIDownflow Boiling and Nonboiling Heat Transfer in aUniformly Heated Tube,1I University of California Radiation LaboratoryReport UCRL 9023, 1960.
12. Schrock, V. E. and Grossman, L. M., IIForced Convection Boiling inTubes,1I Nuclear Science and Engineering, Vol. 12, 1962, p. 474-481.
13. Usui, T. and Aikawa, K., IIEngineering and Design Features of the OtakeGeothermal Power P1ant,1I Geothermics - Special Issue 2, Vol. 2, Part 2,1970, p. 1533.
"'-141-

HAWAII GEOTHERMAL PROJECTENVIRONMENTAL-SOCIOECONOMIC PROGRAM
Robert M. Kamins
SUMMARY
The objectives of the Socioeconomic Program are: (1) identifying themajor impacts of geothermal development on the economy and society ofHawaii; (2) identifying potential legal, administrative and economic impediments to the development of geothermal resources in Hawaii; (3) identifyingalternative public policies toward geothermal development in Hawaii (as indefining ownership and setting regulation of the resource, in tax policies,subsidies, land use regulation); (4) ascertaining potential impacts ofgeothermal development on the environment, a:nd establishing benchmarksprior to development by which to measure tha,t impact. As concurrentfunctions, the Program: (1) is working with legal officers of the State ofHawaii to obtain a right-of-entry permit for' the drilling on the Island ofHawaii planned by the Project in 1975; (2) maintains liaison with agenciesof the State and County governments particularly concerned with the Project,namely the Office of the Attorney General, the State Department of Land &Natural Resources and the Department of Planning &Economic Development andthe Hawaii County Department of Research &Development.
Work has progressed on the following three tasks which were fundedamong those originally proposed:
Task 4.1 EnvironmentalTask 4.2 Legal and RegulatoryTask 4.4 Economics
Task 4.1Environmental
A. Ground Water AnalysisThe geographical scope of the environmental task -- to ascertain
potential impacts of geothermal development on the environment and toestablish benchmarks by which to measure that impact -- is limited by thedrilling program, which provides the first impact. After a decision wasmade to confine ,exploratory drilling to a site in the Puna District, it waspossible to make an initial appraisal of the environmental factors likelyto be significant and concentrate on them.
-142-

Since the Puna area selected for the drilling site is only sparcelypopulated and in fact largely consists of lava fields overgrown with staghorn fern, grasses, flowering ginger, wild orchids, and occasional trees -none, by initial appraisal, of rare or endangered species, and since onlya limited amount of land disturbance will be made by the drilling -- theconcentration of environmental concern is on the possible impact on theground water supply. While the supply of ground water in this section ofPuna presently developed is limited, and what is there is frequentlyhighly saline, it is important to ensure that the Ghyben-Herzberg lensunderlying the area is not polluted by the drilling.
To establish what the water conditions are, prior to drilling, thedirector of the University's Water Resources Research Center and anassociate are at this writing testing the water of six wells and two springs
'j
within a five-mile radius of the proposed drill site. (The water sources tobe analyzedCare circled on the map which follows this page.) The deep-wellsampling procedures used will yield an analysis of salinity and otherchemical characteristics, pH, temperature, selected nutrients and coliformbacteria. As drilling proceeds, the same water sources will be checked todetermine what changes, if any, occur at these wells and springs.. .
B. Checklist of Decision Points, Including Environmental ControlsLooking beyond the exploratory well to the environmental impact of a
possible geothermal field, in Puna or elsewhere, we are working with theproject IIState Management of Geothermal Energy in Hawaii ll to ascertain thekey decision points which would occur -- from site selection and preparationof an environmental impact statement to power production and utility regulation -- as geothermal development progresses. The checklist now in first,draft will locate the points at which the federal government, State ofHawaii and County of Hawaii will be able to influence the course of development, and its pace,by the administrative, executive and legislative actionsthey take, either on their own initiative or in response to initiatives ofprivate enterprise.
In the present situation of preparing for exploratory drilling, we arekeeping the state Office of Environment Quality Control, Department ofPlanning and E~onomic Development, Office of the Attorney General andDepartment of Land and Natural Resources apprised of the project and itsdrilling program.
-143-

I.......j:::>.j:::>I
'..
ooo10
CAPEKUMUKAHI
• Drilled .811
(I Pumped well
• Shaft
0 Dug .ell or water hole
C\. Spring
0 Geothermal teat hole
0 2 4 6,,'It!tI,,! X Possible drilling ,Ite
Approximate location of water sources in the Puna area. island of Hawaii.

Task 4.2Legal and Regulatory
A. Legal Regime for Geothermal ResourcesAnalysis during the last half of 1973 of the statutory and common law
of Hawaii revealed that the potential geothermal resources of the state werenot defined under existing law, and so it was ~ncertain who would have property rights in any such resource discovered. That uncertainty would remainuntil a definitive finding was made by the courts or unless a legal regimefor geothermal was established by statute.
This finding was stated in a preliminary report, dated February 1974,on Legal and Public Policy Setting for Geothermal Resource Development inHawaii which went, among others, to members of the Hawaii State Legislature.The report noted the manner in which geothermal resources were defined forlegal purposes in the twelve western states other than Hawaii. It alsosummarized the legal issues relating to resource ownership raised by thefederal Geothermal Steam Act of 1970 and by a case (United States v. UnionOil Co., N.C. Cal. 1973) in which the portion of that act reserving mineralrights to the federal government is being litigated. Court decisionsconcerning ownership of ground water in Hawaii were examined as the tlosestanalogous legal problem experienced here. The pros and cons of privateownership and public ownership of geothermal resources in Hawaii were setforth in the report within the framework of a policy of ,encouraging resourcedevelopment in this state. At its 1974 session, the Hawaii Legislaturesubsequently enacted a measure -- Act 241 -- which defined geothermalresources as mineral and thus subject to mineral reservations by the government of Hawaii going back to the original division of lands by the King inthe mid-19th century.
A rationale for determ1ning the degree of state participation ingeothermal development under conditions of near-total dependence on importedfossil fuel, as in Hawaii, was expressed in a paper presented to the conference of geothermal energy projects of the National Science Foundation, heldat the California Institute of Technology in September, 1974. The paperlisted some of the major social benefits which might be achieved by thedevelopment of geothermal energy in Hawaii: (1) insurance against interruptions of fossil fuel shipments from abroad; (2) provision of an economicbase, and jobs, away from the concentration of population in Honolulu;
-145-

lI
'0
c.;(j
o
o
o
o
o
o
o
:0
(3) substitution of less-polluting fuels fOlr oil. It noted that thesebenefits may not be fully reflected in markl~t value calculations whichprivate enterprise might make in determinin9 the feasibility of investmentin geothermal development and stated that optimization of such developmentmight require support by the 'state.
B. Regulation of Geothermal ProductionSince Hawaii is without experience in regulating the production of either
oil or minerals, the project requested David N. Anderson, Geothermal Officerof the California Department of Conservation, to advise it on the manner andscope of regulations which the State of Hawaii would require in the eventthat geothermal resources were used to generate electricity or for othercommercial purposes. Mr. Anderson drafted <l set of regulations, based onthe experience of California, but with Hawa"ii's different circumstances inmind.
The draft regulations cover the following general areas and potentialproblems:
1. Places regulatory authority over gE~otherma1 development withthe State Department of Land and Natural Resources, withresponsibility for encouraging the II grea test ultimate recoveryof geothermal resources", subject to safe and beneficial methodsof production.
2. Establishes a system of control OVE!r drilling to ensure safetyand conservation,utilizing applications and bonds -- generallysimilar to California's system -- ...lith appropriate fees'..
3. Prescribes minimal conditions for \O,el1 spacing (includingdirectional drilling), requirements for casing (with wide discretion to the Department), blowout-prevention gear and Gtherelements of production facilities.
4. Requires logging of production wells and the keeping ofspecified records of drilling and production.
5. Provides for periodic surveillance of equipment and lines tocheck on corrosion and other conditions prejudicial to life,health and property at the geothermal field.
6. Sets conditions for-reinjection wells and other modes ofdisposing of wastewater.
7. Proposes. environmental safeguards for geothermal developmentbeyond the preliminary exploration stage.
8. Provides for appeals from administrative actions under theproposed regulations.
-146-

The draft was made available to the project on "State Management ofGeothermal Energy in Hawai.i '.' , which is administered in the Department ofPl anning and Economi c Development, as wen as to the Department of Land andNatural Resources.
c. Right-of-entry for DrillingIn; the last quarter of 1974, the drilling program within the Hawaii
Geothermal Project identified in the Puna district of the Island of Hawaiithe site it proposes for exploratory drilling. Once the location was made,the Socioeconomic Program served to identify the owners of the land aroundthe target area, to ascertain if the patents of title to the land containeda reservation of minerals (and hence of geothermal resources under the 1974legislation referred to above) -- they do -- and to contact the owners ofthe two large parcels in the immediate vicinity of the site proposed fordrilling to determine if they would be agreeable to permitting entry ontheir lands for this purpose.
We then obtained the services of a University attorney to draft aright-of-entry permit agreement for the property closest to ground zero inthe target area identified by the drilling program, and arranged to have thedraft examined by the Office of the Attorney General for legal correctness.At this writing the document is being considered by one corporate landowner,following conversations with their attorney. The availability of an alternative site is also being checked out, should the first landowner not agreeto drill i ng on its property.
Task 4.4Economics
A. Data Gathering: Hawaii Energy SituationData has been gathered showing the energy consumed in the State of Hawaii
in 1962 and 1972, by source and use, showing that almost 100 per cent of anenergy used in commerce and industry in Hawaii derives from petroleum(against approximately 46% for the entire U.S. in 1972).
Other sets of data, provided by the electric companies operating oneach major is'landwithin the state, show generation capacity and energy salesback to 1960 and projected to 1990~ Source data for the Island of Hawaiishows the amount provided' by hydroelectric generation plus the quantities of
-147-

o
o
o
o
o
o
o
o
electricity purchased by the Hawaii Electric Light Company from sugar plantations derived from the burning of bagasse at the mill. The latter componentof electrical energy supply on the Island of Hawaii will comprise about 3per cent of the island total in 1975, by far the largest contributor of. .
commercial energy other than petroleum in the! state energy network.
B. Data Gathering: Geothermal Production ElsewhereAn inventory of geothermal production centers around the world is being
developed by recording significant data -- on record of flow, number anddepth of wells, well life, costs and income where available, by-productutilization, etc. -- noted in the large and growing literature on geothermalresource utilization. Thus far, there are 65 pages in the inventory, eachrelating to one production center.
C. Annotated BibliographyFrom the literature searched for inventory data, plus others read, an
annotated bibliography on geothermal energy economics has been prepared. Tothis date two volumes have been reproduced and distributed to interestedpersons: Volume I, dated February 1974, includes 192 items with 32 annotations; Volume II, dated September 1974, has 198 items, with 15 annotations.In most instances the "annotations" are lengthy, amounting to summaries.
D. Non-electrical Uses of Geothermal ResourcesData is being gathered on the use of geothermal resources for purposes
other than generating electricity, such as space heating and cooling byutilization of the geothermal water directly; industrial uses of geothermalwaters, as in wood pulp and paper processing; agricultural uses; geothermalwaters in spas. The inventory and annotated bibliographies are useful ingathering this data, as well as materials obtained from the conference onthis subject held at the Oregon Institute of Technology in Klamath Falls,Oregon, in October 1974, attended by a researcher in this program. Thisdata will be esp~cially ~aluable if a geothermal resource is located inHawaii which is' large in quantity but too low in heat to serve as an economicsource~f electri~power generation.
E. Input-output Analysis of New Energy Source ImpactTo ascertain the possible impact of new energy supplies on the economy
of Hawaii County, should a viable input for the generation of electricitybe found on the Big Island, the industries now in existence there are being
-148-

analyzed to determine which are the most energy, or rather electricity,intensive. An industry ranking high on this list is a likely candidate forpossible utilization of significant amounts of new energy.
Since production activities use energy either by direct purchase or bypurchasing inputs which incorporate some amount of energy, the secondary,tertiary and subsequent impacts of any single activity are relevant to thisquestion. Even though a given industry uses relatively modest 'amounts ofenergy directly, it may, through its raw materials and intermediate inputs,be a significant contributor to aggregate energy demand in the region.
Input-output analysis emphasizes the structural interdependence of aneconomy and in the process accounts for such indirect effects as justmentioned. Total sales of any given industry are classified according towhere its sales go: to anyone of the other producing sectors of the localeconomy, or to final purchasers -- consumers, government, foreign countriesor to net capital formation. Since each sale to another producing sector isalso a purchase, the tables also show the distribution of each sector's
purchases from other producing sectors, and its expenditures for "primary"inputs -- labor and capital -- and for imp.orts. We thus have distributionsof both sales and purchases -- outputs and inputs. Treating this system ofinterconnections as a set of linear equations allows derivation of varioussummary measures of not only the direct impact of a change in demand for anyone sector's product, but the secondary and subsequent impacts as well. Thelatter impacts are measured not only by the absolute values of estimatedenergy use, but through multipliers. One set of multipliers compares directto-total energy use in each sector; another compares value added (income)generated per unit of energy use.
The Hawaii County I/O ModelThe recently completed input-output model for the County of Hawaii is
an adaptation of a statewide model, which in turn is derived from thenational I/O tables. The many differences in interindustry trade patternsbetween the state and national economies were accounted for in the statestudy by surveying 22 local industries and adjusting the appropriate coefficients from survey results. The most important of these adjustments are forthe two sugar sectors (growing and milling), pineapple growing, canning,bakery products, textiles and apparel, petroleum and fabricated metalproducts. Similar ,though less extensive surveys were undertaken to adapt
-149-

1
~o
o
o
o
the state model to the county level. The published state model is based on1967 data. A revision (as yet unpublished) provides a 1970 edition. TheHawaii County model uses the later edition for its origin.
The state model deletes all but 54 of more than 400 sectors definedin the most extensive of the national I/O tables. While in principle thesame 54 sectors remain in the Hawaii County version, seven* have zero outputin the county and thus fall out before inverting and solving the model.Thus 47 interindustry sectors enter the county analysis. Sector definitionsare slightly a.ltered, however, in three agricultural industries: "otherfield crops·1 are included with sugar in sector 1; fruits, nuts and vegetablesenter into sector 2 (which retains the "pineapple" label although no pineapple is grown on the Big Island); and sector 3 incorporates canned sea foodswith fruits and vegetables.
Data; ComputationElectrical energy usage is brought into the analysis through attaching
electricity demand coefficients to the matrix of direct + indirect energyrequirements. Each coefficient represents the number of kwh used by a givensector, per dollar of that sector's output. Industry-by-industry data on
energy usage consistent with published estimates of output is not readilyavailable, but three data sources have been exploited for the tentativefigures used in this report:
1. With the cooperation of Hawaiian Electric Company and HawaiiElectric Light Company, electricity use figures for hotels and possiblyconstruction are being developed.
2. A study by John W. Wilson (American Economic Association Meeting1973) presenting estimates constructed from the Census of Manufacturers formanufacturing sectors only.
3. The i967 edition of the 367-se~to~ nationa.l I/O table. One row of(' . . ,. . . .
this table is d~voted excl~siyely to electric utilities, showing the valueof electrici,ty purchased'by each of the 367 sectors per dollar output..Aggregating these figures to conform with the sector definitions of the state. . ~.' .
*Paper and paper products (#19); petroleum refining (#22); rubber, misc.plastic and leather products (#23); primary metals (#25); electricalmachinery, equipment and supply (#28); transport equipment (#29); andinstruments (#30).
-150-

and county I/O models, and applying Hawaii electricity prtces, yields anestimate -- admittedly rough -- of the physical quantity of energy used perdollar output for each sector.
The third source provides tentative estimates for all sectors of ourmodel until the other figures are completed.
Computer programming was much simplified by the existence of a set ofroutines designed to produce all the standard input-output r~su1ts plusfigures for water analogous to those we are after here for electricity.With minor adaptations, these routines produce the desired electricityinteractions table as well as the multipliers.
Energy-related results of the input-output model solution are containedin three tables of the computer printout. One table lists the requirementof each industry for electricity via its purchases from other industriesper dollar of output of the purchasing industry's product, incorporatingboth direct and indirect demand. The sum of these elements is the totalrequirement, direct and indirect, for electricity per dollar of output.
A second table displays three electric energy coefficients. The firstcoefficient shows a given sector's direct requirement for electricity perdollar of output. The direct + indirect requirements coefficient is next.The ratio of these two coefficients appears in the third column. The electricity use multiplier can be taken as a measure of the degree of interrelatedness, with respect to energy consumption, of the given industry with therest of the economy. If one were to seek to identify those industries whichwould be stimulated by more abundant energy supplies, one might concentrateon those with high multipliers.
The third table shows measures of the beneficial economic impacts of agiven amount of energy used in each sector: data indicates the amount ofII va1ue added ll or income per unit electricity purchased by each industry,showing indirect energy use (by suppliers) as well as that used directly byeach sector.
Although not derived in the current version of computer programs,measures relating energy use to employment, rather than income, can also bedevised.
Further applicationFrom the electrical energy coefficients, and electricity-use multipliers
derived from them, we will be able to identify existing industries in Hawaii
-151-

1o
County which would be particularly stimulated by the addition of new electricenergy supplies.
To estimate the degree of such stimulation, assumptions will have to bemade as to how the price of electricity may be affected by a new energysource and consideration made of the increase, at the margin, of productionin energy-intensive sectors which would be stimulated. Further, researchwould be needed into industries identified in the Hawaii State model or innational input-output models as having particularly high energy coefficients,and which are potential industries for the Island of Hawaii though not yetdeveloped. Two examples are wood products ._- since the island has acapabil ity for 1umber and wood products frl~quently noted in economic surveys
and refinement of metals from the manganese nodules reported as aboundingon the ocean bottom off Hawaii.
Technical Outline for Input-Output AnalysisTechnically speaking, the procedure is as follows. The basic input
output relation for "se lling" sector i is
o
nL aijXj + f; = Xij=l
i=1,2, ... ,n(1)
For ease of exposition, the Leontief inverse matrix will be denotedB = (I - A)-l with elements bij expressing direct + indirect requirementsfor output of sector i per dollar increase in deliveries by sector j tofinal demand.
If we now multiply eachbij by an energy use coefficient, sayei,denominated in, say, kWhj~ j~ ~e have the direct + indirect requirement for
. '.
energy used by sector j via sector i in delivering one dollar output j tofinal demand. To generalize, if lis an identity matrix and e a columnvector of energy use coefficients (electrical energy, in particular), thematrix
o
IQI
o
where aij is the direct coefficient for pur'chases byis final demand for sector i and Xi is total output.as usual and solving for total output yields
X = (I - A) -1 f
Ie(I - A)-l
-152-
industry j from i; f;Substituting matrices
(2)
(3 )

{4}
shows direct + indirect energy requirements of each purchasing industry viaeach selling industry, and
nI: eibij
i=l
represents the total energy required by the jth industry, directly andindir~ct1y, to deliver one additional dollar of output j to final demand.
Attaching units of measure to {4} is instructive. ei is in kwh {orsome such quantity measure} energy per dollar of sector i output; bij ispurchases directly and indirectly, of commodity i for use in producingcommodity j. Thus
'b .. - kwh· . $ i_kwh v,·a sector '...e, 'J - n $I - nConsider for example the sugar growing sector, denoted by j = 1. Expression{3} would yie1d*
kwhelb11 = $ sugar
$ sugar =$ sugar
kwh$ sugar
kwh= $ pineapple$ ~ineapp1e = kwh
sugar $ sugar
kwh= $ util ities$ utilities =
$ sugarkwh
$ sugar
and so on through the list of sectors. Thus expression {4}, when i denotesthe sugar sector of the Hawaii model, is the sum of numbers whose units ofmeasure were just outlined and is denominated entirely in terms of kwh/$sugar. Similar expressions exist for all other industries of I/O model.
Note that if j is the index of an electrical energy sector, each of theterms eibij represents merely the inverse of the price of electricity:
*Subscripts here refer to sectors of the State of Hawaii I/O model.
-153-

l,o
kwh$ sector i '
$ sector i =l e.l ectri city
kwh =$ e1ectri city. price
o
In addition'to the energy flows matrix ofeq'uation (3), an energy"mu ltiplier" and several value added coefficients can be calculated:
an energ,}/use mult'iplierfor each sector, the ratio of direct +
indirect to direct use alone. This figure essentially demonstratesthe degree of interconnection between energy use in the given sectorand in the rest of the economy;value added directly by any given sector per unit of energy use;value added directly as well as indirectly by the given sector perunit energy use.
The first of these measures is usefu'l in identifying industries whichthemselves exercise relatively light energy demand, but which use inputswith relatively heavy electrical energy content. The other two measureswill bring to light those sectors with thE~ greatest beneficial (in terms ofcreating value added, that is, income) economic impact per unit of energyuse.
(5)j=1,2, ... !,n
The multipliers are calculated as follows. Again letting ej designatethe direct use coefficient, the multiplier for sector j is the ratio ofdirect + indirect energy use per dollar output to direct use alone:
nE eibij
m' = i=lJ -'--'----e'J
o
oThe first value added coefficient is simply the ratio of direct value added*Vj, to energy use in sector j:
o u'J j=1,2, ... ,n (6)
The second coefficient may be calculated as
T·J j=1,2, ... ,n (7)
or.,;;;
*Determined in conjunction with the data }'equired for equation (1).
o -154-

where Xi is total output for the i th sector. The numerator representsdirect + indirect value added per dollar output from sector j; while thedenominator is direct + indirect energy use by sector j. Hence Tj isdefined as direct + indirect value added per unit of energy by the sectorin question.
-155-

]o
~()
o
Pub1icati ons generated" by:<the Socioeconomi'c Program:
1. El-Ramly, Peter$on,:s~oi."GEOTHERMAL:ENERGY ECONOMICS: AN ANNOTATEDBIBLIOGRAPHYi'fVolume1,February.J974.t 7.9 pp.
~i --,; J'" • . . '" '.- . ,.- . - ' •. -~. - ..•:'
2. Grabbe and Kamins, STATE· POLICY CONSIDERATIONS FOR GEOTHERMAL DEVELOPMENT IN HAWAIl,April1975, 19 pp.
o
o
o
o
o
o
o
o
3. Kamins, Kornreich, Sheets. LEGAL AND PUBLIC POLICY SETTING FORGEOTHERMAL RESOURCE DEVELOPMENT INHA~~AII, 1974, 42 pp. (beingrevi sed).
4. Peterson and Seo, GEOTHERMAL ENERGY' ECONOMICS: AN ANNOTATED BIBLIOGRAPHY, Volume II, September 1974, 66 pp.
5. Peterson, R.L, ECONOMIC FACTORS IN THE LONGEVITY OF RESOURCES, December1974, 19 pp. Published in Geothermal Energy, March 1975 issue.
6. Peterson, R.E., ECONOMIC FACTORS IN THE OPTIMAL DEPLETION OF RESOURCES,March 1975, 19 pp.
7. Peterson',."Rl E'~~ '·:THE REICH CASE:' ECONOMIC ;IMPLICATIONS OF DEPLETIONALLOWANCES, January 1975, 35 pp. rin draft, being revised).
. ','.1.
-156-

HAWAII GEOTHERMAL PROJECTDRILLING PROGRAM
AgatinT. Abbott
Resume of Activities of the Site Selection Committee
The Site Selection Committee was formed in the spring of 1974 to adviseon the proposed exploratory drilling program on the island of Hawaii. TheCommittee consists of the following members, with area of interest noted:
Agatin T. Abbott -- Committee Chairman -- GeologyProfessor and Chairman of the Department of Geologyand Geophysics, University of Hawaii (U.H.)
Pow F. Fan -- GeochemistryProfessor of Geology, U.H.
Augustine Furumoto -- GeophysicsProfessor of Geophysics, U.H.
Gordon A. Macdonald -- GeologySenior Professor of Geology, U.H.
Donald Peterson -- GeologyFormerly Chief Scientist at the u.s. GeologicalSurvey (U.S.G.S.) Volcano Observatory
Charles Zablocki -- GeophysicsGeophysicist, U.S.G.S. Volcano Observatory
Recently Dr. Robert Tilling, Chief Scientist at the U.S.G.S. VolcanoObservatory, with interest in both Geology and Geochemistry, was added to theCommittee. Drs. Peterson and Zablocki will be leaving Hawaii in the summerof 1975.
In its early stages the drilling program was envisioned as 10 or 12exploratory holes at three selected sites on the island. Because of fundingrestraints, this type of program had to be abandoned. The decision wasreached to concentrate attention in the Puna district of Hawaii, which showedthe greatest promise based on work completed up to that time. It was alsodecided by the Site Selection Committee to use the available funds for thedrilling of one deep hole, rather ~han expending the money for two or moresha 11 ow holes.
The first official meeting of the committee was held on April 15, 1974,at the U.S.G.S. Volcano Observatory on the island of Hawaii. An exploratorydrilling schedule proposed by the chairman in three areas of the Big Island
-157-
o~
was reviewed, and places for further exploration were made. The feasibilityof employing a drilling management team, such as that provided by RogersEngineering of San Francisco, was discussed and the idea approved.
The next meeting was in late May 1974 at the Volcano Observatory. Mr.James Kuwada of Rogers Engineering Company of San Francisco was in attendanceto discuss the role of a drilling manager and to make on-site visits to thethree potential areas. These areas were the SW rift of Mauna Loa, the SW riftof Kilauea, and the East rift of Kilauea (Puna). At that time the Puna areafor numerous reasons was appearing to be a good deal more favorable than theother two areas.
In early September Dr. Paul Kruger and Ritchie Coryell visited the campusand indicated that NSF was not planning to fund an exploratory drillingprogram, and that $500,000 would probably be a maximum we could expect forresearch drilling.
The Site Selection Committee next met at the University of Hawaii inOctober 1974 and made several important decisions:
1) With the reduced level of funding it would be necessary to reduce thedrilling program drastically -- it was the consensus that all the funds shouldbe concentrated in the drilling of one deep hole, rather than dissipate the
funds in shallow drilling.2) It was decided that we could not afford to employ a firm as drilling
manager because the usual 10% commission charge would seriously reduce ouralready curtailed drilling plan. It was agreed that the money would be betterspent in drilling as deep as possible, although this decision may prove tohave been questionable as the need for a drilling manager becomes more
apparent.3) The location of the hole based on several lines of geophysical,
geological, and geochemical evidence was spotted fifteen hundred feet northof PuulenaCrater, in a general area that has since been designated as Area A.The preferred site was later moved about 1600 feet northeast of that pointbecause of land ownership d{fficulties.
Location of the drill site in Area A was questioned as additional geophysical data came in during the fall, and over the holiday season. In orderto reasSeSS the whole site selection under the new sets-of data on this andother locations in the Puna district, the Site Selection Committee was assembled again in late January 1975 for a thorough review of the data as it was
-158-

known up to that time. Again the opinion of the Site Selection Committee wasthat the initial site selection was sound.
This decision was reached in full cognizance of a letter dated December3, 1974, from Dr. George Keller to Dean John Shupe that he (Keller) did notfeel that Area A was a favorable location because of possible dike concentrations and reliance on self-potential anomalies in the area. The generalopinion of the committee was that other factors of geology and geochemistry,as well as an extension of a resistivity low into Area A, still made it themore promising of the two areas.
During the week of January 20, 1975, Mr. Paul English was sent by NSFto Hawaii to confer and advise on the procedures of preparing invitation tobid by drilling contractors. Land arrangements were continued with theLyman estate and plans to submit the Bid Sheet and Well Specifications totwenty five potential drilling contractors were well underway.
At a meeting of the HGP executive committee on April 21, Dr. Furumotofirst indicated that he had doubts that Area A was indeed the best drill site.This ultimately led to a third meeting of the Site Selection Committee onMay 1, 1975, to which Dr. George Keller was invited to present his views ofthe geophysical data of each of the two areas. Dr. Furumoto also presentedhis data, as did all the other members of the committee. Also representedwere a number of interested geologists, geophysicists and geochemists --many of them members of the HGP Geophysical Program -- who took an activerole in the review. After a full afternoon of discussion, which has beentranscribed from the tapes but not included in this summary, it was decidedby all committee members except Dr. Furumoto, as well as by those observersmentioned above, that the weight of all evidence -- geophysical, geological,geochemical, and thermal tests on neighboring wells -- indicated that Area Astill appeared to hold the most promise. It was felt that an exploratoryhole in Area A would provide more meaningful research data than one in AreaB, and that the likelihood of encountering a geothermal anomaly was at leastas great at A as it was at B. This evaluation is consistent with Jhe statement by geophysicist Douglas Klein in his report of Task 2.2 in the sectionon the Geophysical Program.
In conclusion, it should be reiterated that the chairman and most of themembers of the Site Selection Committee maintain a position of cautious.optimism for either area. It should also be emphasized that one drill hole
-159-

o
~o
o
o
o
o
o
o
o
o
does not suffice to prove or disprove a potential geothermal resource in thePuna area. A multiple hole drilling program is essential to verify thepresence or absence of a commercial geothermal field.
At the present moment, invitation to bid and copies of a tentative contract are being prepared by the University of Hawaii Procurement Office andwill be mailed to potential contractors very shortly.
-160-