Embed Size (px)
Citation preview

APPROVED: Barbara Stein-Martin, Major Professor Yunfei Du, Major Professor David Loertscher, Committee Member Herman Totten, Committee Member and Dean of
the School of Information, Library Science, and Technologies
Linda Schamber, Program Coordinator Sandra L. Terrell, Dean of the Robert B. Toulouse
School of Graduate Studies
HAVES, HALVES, AND HAVE-NOTS: SCHOOL LIBRARIES AND
STUDENT ACHIEVEMENT IN CALIFORNIA
Douglas L. Achterman
Dissertation Prepared for the Degree of
DOCTOR OF PHILOSOPHY
UNIVERSITY OF NORTH TEXAS
December 2008

Achterman, Douglas L., Haves, Halves, and Have-Nots: School Libraries
and Student Achievement in California. Doctor of Philosophy (Information Science), December
2008, 225 pp., 71 tables, 5 figures, references, 196 titles.
This descriptive, non-experimental study examines the strength of the relationship
between California school library media programs and student achievement, using data from
California criterion-referenced state-wide tests, publically available school and community
demographic data, and a state survey of school library programs. Results indicate a substantial
discrepancy in library staffing levels from the elementary grades through the high schools.
Nevertheless, statistically significant correlations were found between certificated staffing levels
and student achievement at each grade. Significant correlations persisted at the elementary and
middle school when controlling for five of six school and community variables, and at the high
school when controlling for all six of those variables. Bivariate correlations between total
staffing and student achievement were significant at both the middle school and high school level
when controlling for all school and community variables. Generally, the strength of the
correlations between both certificated and total staffing tended to increase with grade level; at the
high school level, correlations were among the strongest reported in any statewide study to date.
There was a significant positive relationship between a majority of the 21 library services
regularly provided and student achievement at all levels. Total library services were significantly
related to student achievement at all levels when controlling for all school and community
variables. In multiple regression analyses, there was an increasingly stronger relationship
between total library programs and student achievement by grade level when controlling for all
school and community variables. At every level, certificated and total staffing levels were
associated with the strength of library program elements.

The findings from this study confirm a host of prior research on the relationship between
school libraries and student achievement and point to inequitable access to school library
services in California. Results from this study might also provide a baseline of data for
qualitative research that more deeply explores ways school library programs contribute to student
achievement beyond ways measured by current standardized tests.

ii
Copyright 2008
by
Douglas L. Achterman

iii
ACKNOWLEDGMENTS
Many people were instrumental in the completion of this project. I wish to thank my
committee chairs, Dr. Barbara Stein-Martin and Dr. Yunfei Du, as well as the other members of
my committee, for their support and timely assistance.
I also wish to acknowledge several people who offered specific input along the way,
including Dr. Keith Lance, Dr. Ross Todd, Dr. Geoffrey Liu, Dr. Dan Fuller, Connie Williams,
and Mary Ann Harlan. In addition, I would like to thank the members of my cohort for their
empathy, support, and constant good cheer, and for challenging me through their own examples
to do my best.
I am indebted to Barbara Jeffus and John McGinnis for helping me with so much of the
back story around the California school library survey and library funding; Barbara’s willingness
to help at every turn was an inspiration.
Two people have mentored me from the time I first entered library school. I wish to thank
Dr. Blanche Woolls, who has been unfailing in her encouragement and sage in her advice. I
would also like to thank Dr. David Loertscher for his enthusiastic vision, his critical perspective,
and his generous gift of time.
Finally, I would like to thank my wife, Edie, without whose love and support this project
would not have been possible.

iv
TABLE OF CONTENTS
Page ACKNOWLEDGMENTS ............................................................................................................. iii LIST OF TABLES ....................................................................................................................... viii LIST OF FIGURES ...................................................................................................................... xii Chapters
1. INTRODUCTION 1
Statement of the Problem ............................................................................ 1
Research Questions ..................................................................................... 3
Significance of the Problem ........................................................................ 4
Assumptions and Limitations ..................................................................... 5
Definitions................................................................................................... 6
Description of this Dissertation .................................................................. 7 2. LITERATURE REVIEW ....................................................................................... 9
Evolution of School Library Programs ....................................................... 9
Information Access and Delivery ............................................................. 26
Hours Open ................................................................................... 27
Library Visits ................................................................................ 29
Collection Size .............................................................................. 30
Technology ................................................................................... 37
Staffing ...................................................................................................... 41
Access to Staff .............................................................................. 42
Staffing and Reading Achievement .............................................. 44
Staffing and Other Measures of Student Achievement................. 50
Library Media Specialist Instructional Roles and Student Achievement ................................................................................. 52
Collaboration between Library Media Specialists and Classroom Teachers ........................................................................................ 54
Staffing and Its Impact on Learning and Teaching ....................... 58
Program Administration: Staffing Levels, Administrative Support, and Scheduling .............................................................................. 66

v
Budget ....................................................................................................... 67
Relationship between Library Expenditures and Student Achievement ................................................................................. 69
Leadership ..................................................................................... 71
Total Library Program and Student Achievement ........................ 74
Recent History of California School Libraries ............................. 79
Previous California Study ............................................................. 84
Theoretical Foundation ................................................................. 88
Conclusion .................................................................................... 94 3. METHODOLOGY ............................................................................................... 95
Research Questions ................................................................................... 95
Null Hypotheses ........................................................................................ 96
Sources of Data ......................................................................................... 96
Data Collection and Human Subjects Considerations ............................ 102
Data Analysis .......................................................................................... 103
Assumptions and Limitations ................................................................. 106 4. RESULTS ........................................................................................................... 107
Purpose .................................................................................................... 107
Populations .............................................................................................. 108
Grade 4 ........................................................................................ 108
Grade 8 ........................................................................................ 109
Grade 11 ...................................................................................... 111
H01: Student Achievement and Certificated Staffing ........................... 113
Grade 4 ........................................................................................ 113
Grade 8 ........................................................................................ 114
Grade 11 ...................................................................................... 115
Summary and Discussion for Research Question 1 .................... 117
H02: Student Achievement and Combined Staffing Levels .................. 118
Grade 4 ........................................................................................ 118
Grade 8 ........................................................................................ 119
Grade 11 ...................................................................................... 120
Summary and Discussion for Research Question 2 .................... 122

vi
H03: Student Achievement and Library Staff Services Offered ........... 124
Grade 4 ........................................................................................ 126
Grade 8 ........................................................................................ 128
Grade 11 ...................................................................................... 132
Summary and Discussion of Response to Research Question 3 . 136
H04: Student Achievement and Other Library Program Elements. ....... 139
Grade 4 ........................................................................................ 140
Grade 8 ........................................................................................ 141
Grade 11 ...................................................................................... 142
Summary and Discussion of Response to Research Question 4 . 144
H05: Student Achievement, Staffing Levels and Other Library Program Elements .................................................................................................. 147
Grade 4 ........................................................................................ 147
Grade 8 English Language Arts .................................................. 150
Grade 8 Social Studies ................................................................ 153
Grade 11 English Language Arts ................................................ 156
Grade 11 U.S. History ................................................................. 159
Summary and Discussion of Results for Research Question 5 ... 161
H06 and H07: School Library Services, Certificated Staffing and Total Staffing .................................................................................................... 163
Grade 4 ........................................................................................ 163
Grade 8 ........................................................................................ 164
Grade 11 ...................................................................................... 167
Summary and Discussion of Responses to Research Questions 6 and 7 ............................................................................................ 169
Summary of Chapter 4 ............................................................................ 173 5. SUMMARY AND CONCLUSIONS ................................................................. 175
Summary of Results ................................................................................ 177
Research Question 1 ................................................................... 177
Research Question 2 ................................................................... 178
Research Question 3 ................................................................... 179
Research Question 4 ................................................................... 181
Research Question 5 ................................................................... 182

vii
Research Questions 6 and 7 ........................................................ 182
Key Findings ........................................................................................... 184
Staffing Levels ............................................................................ 184
Library Services .......................................................................... 186
Library Program Elements .......................................................... 187
Total Library Program ................................................................ 187
Library Services and Staffing ..................................................... 188
Assumptions and Limitations ................................................................. 188
Conclusions ............................................................................................. 190
Implications............................................................................................. 191
Recommendations for Further Research ................................................. 196 Appendices
A. SCHOOL LIBRARY SURVEY 2006-2007 ....................................................... 198 B. LETTER FROM CALIFORNIA DEPARTMENT OF EDUCATION .............. 204 C. ELEMENTS OF LOERTSCHER’S TAXONOMY OF SCHOOL LIBRARIES
AND BIVARIATE CORRELATIONS, LIBRARY SERVICES AND U.S. HISTORY SCORES, GRADE 11. ..................................................................... 206
D. ELEMENTS OF TODD & KULTHAU’S MODEL OF THE SCHOOL
LIBRARY AS DYNAMIC AGENT OF LEARNING AND BIVARIATE CORRELATIONS, LIBRARY SERVICES AND U.S. HISTORY SCORES, GRADE 11 .......................................................................................................... 208
REFERENCES ........................................................................................................................... 210

viii
LIST OF TABLES Page
1. State Test Scores and Hours Library Open: Bivariate Correlations ....................................... 28
2. State Test Scores and Library Visits per Student: Bivariate Correlations .............................. 29
3. Wisconsin State Test Scores and Library Visits per Student: Partial …..Correlations (Smith, 2006)...................................................................................................... 30
4. State Test Scores and Total Print Collection: Bivariate Correlations ..................................... 34
5. Wisconsin State Test Scores and Total Print Collection: Partial Correlations ….. (Smith, 2006) ......................................................................................................................... 36
6. State Test Scores and Library Computers: Bivariate Correlations ........................................ 39
7. Wisconsin State Test Scores and Library Computers: Partial Correlations (Smith, 2006) ... 40
8. State Test Scores and LMS Staffing Levels: Bivariate Correlations ...................................... 47
9. State Test Scores and LMS to Pupil Ratio: Multiple regression analysis ............................... 50
10. State Test Scores and Collaboration: Bivariate Correlations ................................................ 56
11. Wisconsin State Test Scores and Collaboration: Partial Correlations (Smith, 2006) ........... 57
12. State Test Scores and Total Library Media Center Staffing Levels: Bivariate ……Correlations ........................................................................................................................... 64
13. State Test Scores and Total Library Expenditures: Bivariate Correlations .......................... 70
14. Wisconsin State Test Scores and Total Library Expenditures: Partial ……Correlations (Smith, 2006).................................................................................................... 71
15. State test scores and Total Library Media Center Factors, School and Community Variables: ……Multiple Regression .............................................................................................................. 76
16. California Elementary School Libraries with Responses to Library Survey ...................... 109
17. Certificated Library Staff Hours, Grade 4 .......................................................................... 109
18. California Middle School Libraries with Responses to Library Survey ............................. 110
19. Certificated Library Staff Hours, Grade 8 .......................................................................... 111
20. California High School Libraries Responding to Library Survey ...................................... 112

ix
21. Certificated Library Staff Hours, Grade 11 ........................................................................ 112
22. Partial Correlation, Certificated Staff Hours, English Language Arts CST Scores, and ……School and Community Variables, Grade 4 ....................................................................... 113
23. Partial Correlation, Certificated Staff Hours, English Language Arts CST Scores, and ……School and Community Variables, Grade 8 ....................................................................... 114
24. Partial Correlation, Certificated Staff Hours, Social Studies CST Scores, and School and ……Community Variables, Grade 8 .......................................................................................... 115
25. Partial Correlation, Certificated Staff Hours, English Language Arts CST Scores, and ……School and Community Variables, Grade 11 ..................................................................... 116
26. Partial Correlation, Certificated Staff Hours, U.S. History CST Scores, and School and ……Community Variables, Grade 11 ........................................................................................ 116
27. Summary of Bivariate Correlations, CST Scores and LMS Staffing ................................. 117
28. Partial Correlation, Total Staff Hours, English Language Arts CST Scores, and School and ……Community Variables, Grade 4 .......................................................................................... 118
29. Partial Correlation, Total Staff Hours, English Language Arts CST Scores, and School and ……Community Variables, Grade 8 .......................................................................................... 119
30. Partial Correlation, Total Staff Hours, Social Studies CST Scores, and School and ……Community Variables, Grade 8 .......................................................................................... 120
31. Partial Correlation, Total Staff Hours, English Language Arts CST Scores, and School and ……Community Variables, Grade 11 ........................................................................................ 121
32. Partial Correlation, Total Staff Hours, U.S. History CST Scores, and School and ……Community Variables, Grade 11 ........................................................................................ 121
33. Bivariate Correlations, LMS Staffing and Total Staffing, Grades 4, 8 and 11 ................... 123
34. Bivariate Correlation, English Language Arts CST and Library Services, Grade 4 .......... 129
35. Partial Correlation, Total Library Services, English Language Arts CST Scores, and School ……and Community Variables, Grade 4 .................................................................................... 128
36. Bivariate Correlation, English Language Arts CST and Library Services, Grade 8 .......... 129
37. Partial Correlation, Total Library Services, English Language Arts CST Scores, and School ……and Community Variables, Grade 8 .................................................................................... 130

x
38. Partial Correlation, Total Library Services, Social Studies CST Scores, and School and ……Community Variables, Grade 8 .......................................................................................... 131
39. Partial Correlation, Total Library Services, Social Studies CST Scores, and School and ……Community Variables, Grade 8 .......................................................................................... 132
40. Bivariate Correlation, English Language Arts CST and Library Services, Grade 11 ........ 133
41. Partial Correlation, Total Library Services, English Language Arts CST Scores, and School ……and Community Variables, Grade 11 .................................................................................. 134
42. Bivariate Correlation, U.S. History CST Scores and Library Services, Grade 11 ............. 135
43. Partial Correlation, Total Library Services, U.S. History CST Scores, and School and ……Community Variables, Grade 11 ........................................................................................ 136
44. Bivariate and Partial Correlations, Library Program Elements and English Language Arts ……CST Scores, Grade 4 ........................................................................................................... 140
45. Bivariate and Partial Correlations, Library Program Elements and English Language Arts ……CST Scores, Grade 8 ........................................................................................................... 140
46. Bivariate and Partial Correlations, Library Program Elements and Social Studies CST ……Scores, Grade 8 ................................................................................................................... 142
47. Bivariate and Partial Correlations, Library Program Elements and English Language Arts ……CST Scores, Grade 11 ......................................................................................................... 143
48. Bivariate and Partial Correlations, Library Program Elements and U.S. History CST Scores, ……Grade 11 .............................................................................................................................. 144
49. Component Matrix for Factor Analysis of School and Community Variables, Grade 4 .... 148
50. Component Matrix for Factor Analysis of Library Variables, Grade 4 .............................. 149
51. Summary of Hierarchical Regression Analysis for Variables Predicting English Language ……Arts CST Scores, Grade 4 ................................................................................................... 150
52. Component Matrix for Factor Analysis of Library Variables, Grade 8 .............................. 151
53. Rotated Component Matrix for Factor Analysis of School and ……Community Variables, Grade 8 .......................................................................................... 152
54. Summary of Hierarchical Regression Analysis for Variables Predicting English Language ……Arts CST Scores, Grade 8 ................................................................................................... 153

xi
55. Rotated Component Matrix for Factor Analysis of School and Community Variables, ……Grade 8 English Language Arts .......................................................................................... 154
56. Component Matrix for Factor Analysis of Library Variables, Grade 8 Social Studies ...... 155
57. Summary of Hierarchical Regression Analysis for Variables Predicting Social Studies CST ……Scores, Grade 8 ................................................................................................................... 156
58. Rotated Component Matrix for Factor Analysis of School and Community Variables, ……Grade 11 .............................................................................................................................. 157
59. Component Matrix for Factor Analysis of Library Variables, Grade 11 ............................ 157
60. Summary of Hierarchical Regression Analysis for Variables Predicting English Language ……Arts CST Scores, Grade 11 ................................................................................................. 158
61. Rotated Component Matrix for Factor Analysis of School and Community Variables, Grade ……11 U.S. History ................................................................................................................... 159
62. Component Matrix for Factor Analysis of Library Variables, Grade 11 U.S. History....... 160
63. Summary of Hierarchical Regression Analysis for Variables Predicting U.S. History CST ……Scores, Grade 11 ................................................................................................................. 161
64. ∆R2 Produced by Addition of Library Factor in Multiple Regressions ............................. 162
65. Comparison of Bivariate Correlations, Certificated Staffing Levels and Total Staffing ……Levels with Regularly Provided Library Services, Grade 4. .............................................. 164
66. Comparison of Bivariate Correlations, Certificated Staffing Levels and Total Staffing ……Levels with Regularly Provided Library Services, Grade 8 ............................................... 167
67. Comparison of Bivariate Correlations, Certificated Staffing Levels and Total Staffing ……Levels with Regularly Provided Library Services, Grade 11 ............................................. 169
68. Comparison of Bivariate Correlations, Certificated Staffing Levels and Total Staffing ……Levels with Regularly Provided Library Services, Grade 4 ............................................... 172
69. Bivariate and Partial Correlations, Total Staffing and Student Achievement, ……Grades 4, 8, 11 .................................................................................................................... 186
70. Elements of Loertscher’s Taxonomy of School Libraries and Bivariate Correlations, Library ……Services and U.S. History Scores, Grade 11. ...................................................................... 207
71. Elements of Todd & Kulthau’s Model of the School Library as Dynamic Agent of Learning ……and Bivariate Correlations, Library Services and U.S. History Scores, Grade 11 ............. 209

xii
LIST OF FIGURES Page
1. Loertscher’s Model of the School Library Media Program ...............................................89
2. Loertscher’s Library Media Specialist’s Taxonomy ..........................................................91
3. Todd & Kuhlthau’s (2004) Model of the School Library as Dynamic Agent of Learning ............................................................................................................................................93
4. Alignment of the CDE Library Survey and Theoretical Models……………………… .100
5. California Department of Education School Library Question 18…………………… ..125

CHAPTER 1
INTRODUCTION
Statement of the Problem
California has the worst ratio of school library media specialists to students in the United
States—so poor, in fact, that the gap between California and the 49th state is greater than the gap
between the 49th state and the 1st (Everhart, 2003). With just one library media specialist (LMS)
for every 5,965 students, staffing ratios are almost 7 times below the national average (“Statistics
about California School Libraries,” 2007). After a 4-year period of unprecedented state funding
for school library collections ended in 2001, collection budgets and per pupil expenditures on
library programs in California are again among the lowest in the country (National Center for
Education Statistics [NCES], 2007).
Ironically, during an era in which school officials scramble for ways to increase student
achievement, funding for school library media programs has not gained favor (NCES, 2007), in
spite of dozens of studies in the past two decades that have documented correlations between
school library media programs and student achievement. Among these, the first Colorado study
(Lance, Welborn & Hamilton-Pennell, 1993) established a methodology that has been replicated
or adapted in at least 16 states (National Commission on Libraries and Information Science,
2006). While correlations vary from state to state, taken as a whole, these studies make a strong
case for the positive influence of school library media programs on student achievement at the
elementary, middle school and high school levels (Lance & Loertscher, 2005).
In California, Sinclair-Tarr and Tarr (2004) conducted a study that departed from this
methodology in substantial ways and found few significant correlations between school library
media programs and student achievement. In some cases, the researchers actually found
1

2
significant negative correlations between the level of services offered by the school library media
program and student achievement (Sinclair-Tarr & Tarr, 2004). In other words, the more services
offered through a school library, the lower that school’s scores were likely to be. The authors
concluded that either the factors identified as contributing to successful school library media
programs were inaccurate, or that “there are few if any successful library programs in
California”(p. 156).
There are, however, some important limitations to the Sinclair-Tarr and Tarr (2004)
study. The first limitation is the choice of the key independent variable measured against student
achievement: the presence or absence of certificated library staffing. This dichotomy does not
account for the possibility, as research suggests, that there is a correlation between student
achievement and levels of certificated staffing, that a positive correlation may depend on a
combination of clerical and certificated staffing, or that positive correlations with student
achievement may require threshold levels of both clerical and certificated staffing (Baumbach,
2003; Baxter & Smalley, 2003; Brandes, 1987; Burgin, Bracy & Brown, 2003; Callison, 2004;
Hall-Ellis & Berry, 1995; Jenkins, 2000; Lance et al., 1993; Lance, Hamilton-Pennell &
Rodney,2005; Lance, Hamilton-Pennell, Rodney, Petersen, & Sitter, 1999; Lance, Rodney &
Hamilton-Pennell, 2000a, 2000b, 2001; Loertscher, Ho & Bowie, 1987; Loertscher & Land,
1975; Loertscher, 1973; Martin, 1996; Ontario Library Association, 2006; Rodney, Lance &
Hamilton-Pennell, 2002; Smith, 2001).
A second limitation to the Sinclair-Tarr and Tarr study (2004) is that the control variable
used, an index based upon an aggregate of school-wide indicators, does not adequately account
for variances among the grade level and subject-specific test scores analyzed. This makes it
difficult to draw conclusions about the correlations found when using this control. Finally, the

3
overall methodology of the Sinclair-Tarr and Tarr study (2004) deviates enough from other state-
wide studies to make comparisons to those studies difficult. These limitations create the need for
another California study that can establish a reliable baseline for examining the relationship
between student achievement and elements of a school library program in California.
Research Questions
This descriptive, non-experimental study examines the correlations between California
school library media programs and student achievement using a methodology that allows for
easy comparisons to other state-wide studies. It provides an overview of the role of the LMS and
the school library media program as articulated in the standards and guidelines of professional
organizations and academic literature, followed by a review of the research that explores the
relationships among the LMS, the school library media program, and student achievement.
Specifically, this study uses data from California criterion-referenced state-wide tests, a state
survey of school library programs, and publically available data on school and community
factors to answer the following question: How does student achievement vary in relationship to
the elements of a school library media program? This global question is addressed through a
number of other questions that examine relationships between student achievement and specific
school library media program elements:
1. How does student achievement vary, if at all, in relationship to the levels of
certificated staffing in school library media programs?
2. How does student achievement vary, if at all, in relationship to the levels of
combined certificated and clerical staffing in school library media programs?
3. How does student achievement vary, if at all, in relationship to library staff
services provided, either independently or in combination?

4
4. How does student achievement vary, if at all, in relationship to other elements of
the school library program?
5. What combination of school library media program factors, if any, contributes to
a positive significant correlation with student achievement?
6. If student achievement significantly correlates with school library staff services,
how does the level of these services vary, if at all, in relationship to certificated
library staffing levels?
7. If student achievement significantly correlates with school library staff services,
how does the level of these services vary, if at all, in relationship to overall library
staffing levels?
These questions are explored at grades four, eight and eleven-- one grade each from elementary,
middle school and high school, consistent with other studies of this type. Student achievement is
measured through school-level mean scaled scores from California’s Standardized Testing and
Reporting (STAR) tests.
Significance of the Problem
Results from this study may be used by school districts, library media specialists and
school library education programs in California as a baseline for examining the complex
relationship between school library programs and student achievement and may provide some
indications about the impact staffing levels have on the quality of school library programs and on
student achievement. Such a baseline may provide researchers and library media specialists
useful information about where to focus future research, whether in terms of best practice or
areas for improvement related to school library media programs. Results from this study may
also prove valuable to school and district officials in deciding how to allocate resources to school

5
library programs. Similar groups outside California may draw on the results in support or
refutation of several previous studies using a similar methodology.
Assumptions and Limitations
This study uses publically available data from the criterion-referenced California
Standards Tests (CST), school and community information from the state Academic
Performance Index, and responses to the California Department of Education School Library
Survey. Although schools are required to submit this survey, there are no consequences for
noncompliance. According to Ed-Data (2008), there are 8,215 comprehensive public schools in
California. It was anticipated that over 60% of these will have had data available that could be
used in this study, which constitutes a sample size large enough—and diverse enough-- to
counteract sample bias created by the self-selection of participants. Additionally, respondents to
the survey do not identify themselves or their job titles. This study acknowledges that there may
be some discrepancy in answers according to the positions of the people actually responding to
the survey and the data available to them in providing their answers.
This study is conducted with the assumption, too, that the standardized tests to be used
do, in fact, constitute some valid measure of student achievement. The criterion-referenced tests
used in this study—English Language Arts and social studies-- assess mastery of specific
standards in content areas that are commonly associated with library use at each grade level. It is
also acknowledged, nevertheless, that such assessments describe a very narrow band of student
achievement and so provide a similarly narrow view of the relationship between student
achievement and school library media programs. It is hoped that the results of this study will
provide promising avenues of research to pursue using other metrics for student achievement.

6
Definitions
For the purposes of this study, the terms “school librarian,” “library media specialist”
(LMS) and the title now used in California, “teacher librarian,” shall be synonymous.
According to the Commission on Teacher Credentialing (2007), in California, certification for
the Teacher Librarian Services Credential requires an undergraduate degree, a valid teaching
credential, a passing score on the California Test of Basic Skills, and completion of a
Commission-approved library media teacher services program or a similar program in other
states, also approved by the appropriate state agency. This credential authorizes the holder to
perform duties that include
• Instructing pupils in the choice and use of library materials
• Planning and coordinating school library programs with the instructional programs of
a school district
• Selecting materials for school and district libraries
• Coordinating or supervising library programs at the school district or county level
• Planning and conducting a course of instruction for those pupils who assist in the
operation of school libraries
• Supervising classified personnel assigned school library duties
• Developing procedures for and management of the school and district libraries
As library media specialists require special certification as described above, they may also be
referred to in this study as “certificated staffing.” “Clerical staffing” includes paraprofessionals
and others paid to assist in the day to day operations of a school library who hold neither
teaching credentials nor LMS credentials. “Total staffing” and “total library staff” refer to the
total number of hours of certificated and clerical staffing of the school library.

7
The California Education Code defines a school library as “a library that is established to
support the curriculum-related research and instructional reading needs of pupils and teachers
and provides the collections, related equipment, and instructional services of a staff for an
elementary or secondary school” (Section 18810(U), 2007). Further, a school library is “an
organized collection of printed and audiovisual materials” that is “administered as a unit…is
located in a designated place…(and)makes printed, audiovisual, and other materials as well as
necessary equipment and services of a staff accessible to elementary and secondary school
pupils and teachers” (California Education Code, Section 18710(M), 2007). A school library
program is defined as all the resources available through the school library, as well as all the
elements that are required to maintain and administer those resources in service to the school
community of which it is a part.
Description of this Dissertation
This dissertation is based upon a history of school library program elements whose
practice can be traced back to the early 20th century. Chapter 2 traces the evolution of the school
library and the LMS, including the expanding conceptions of the school library program’s role in
student achievement. Research on the growing instructional role of the LMS is reviewed, as are
studies that specifically examine relationships between school library elements and student
achievement. Chapter 2 concludes with the theoretical framework for this study, which derives
from models of the school library program that account for both instructional and informational
roles of the LMS. Chapter 3 presents the methodology of this study, including descriptions of
the standardized tests to be used to measure student achievement, the school library survey
instrument, and the statistical operations used in analyzing the data. The fourth chapter presents
the results of the study, including statistical analysis of bivariate and partial correlations, as well

8
as multiple regression analysis, that address the central question of the relationship between
library program variables and student achievement. This is followed by a discussion of those
results. The final chapter provides a summary of the study’s key findings, conclusions,
implications, and recommendations for further research.

9
CHAPTER 2
LITERATURE REVIEW
The purpose of this study was to examine the relationship between school library
programs and student achievement. This chapter explores the evolution of school library
programs in the United States from their beginnings and reviews the research that has both
informed and responded to that evolution. A separate section of this chapter looks specifically at
research on school libraries in California. An analysis of major studies that examine correlations
between school library programs and student achievement is presented, and a theoretical model
of school library programs is offered as a means of interpreting the results of this study.
Evolution of School Library Programs
A cornerstone for this study is the American Association of School Librarians’ (AASL)
and the Association for Educational Communications and Technology’s (AECT) Information
Power: Building Partnerships for Learning (AASL & AECT, 1998), which articulates standards
for library media specialists based on input from school library leaders and informed by decades
of research. The importance of this document was reinforced in California by the publication of
Standards and Guidelines for Strong School Libraries (California School Library Association,
2004), which uses the guiding principles of Information Power in recommending standards for
all aspects of a school library media program, including the library media specialists, clerical
support, library media resources, technology, and district and county support. Information
Power: Building Partnerships for Learning (AASL & AECT 1998) establishes a set of nine
information literacy standards for students, to be used in guiding library media specialists in
implementation of three key facets of a school library program: information access, learning and
teaching, and program administration.

10
Since the beginning of the twentieth century, school library leaders have articulated the
goals of school library programs in instructional terms and in relation to student achievement.
Although secondary school libraries did not begin to proliferate systematically until the mid-
1920s (Woolls, 2005) this connection is reflected in the professional and academic literature
much earlier. Of the school library program’s contribution to developing lifelong readers, Ahern
said, “Beyond and more important than the assistance which reading gives to the work of the
school is the formation here of the reading habit. If the child leaves school acquainted with a
number of good books and a love for good books, he has a precious possession worth more to
him than any study in the curriculum; something that will not only help him in his daily work,
but will throw a safeguard about his leisure” (1905, p.280). In the same year, Miner expressed
her desire for large-scale funding of school libraries, saying, “We need a public school Carnegie.
A book in the hand is worth two in the stack. A school library may increase tenfold the influence
of the school upon the pupils' reading-a library with many duplicate copies, a loan library, with a
librarian, and with easy reading in foreign languages, as well as our own” (p. 183).
Keyes (1914) recognized that the strength of a school library begins with its librarian in
describing the scene at her school:
At the desk a dozen are waiting in line for the librarian to help them in their reference work or to charge books for home use. We hear her say, "You read Howells' Heroines of Fiction and enjoyed it. Why not read Pride and Prejudice now to see whether you agree with Mr. Howells?” We wonder how she remembers the individuals in such a throng, but that she does is one of the secrets of the success of our library (p. 87).
Keyes’ comments reflect an appreciation of the librarian’s instructional role as well as her
knowledge of the curriculum. Keyes called the library the “meeting-place of all currents of
school thought” (p. 87) and likened the library to a laboratory in which students “perform

11
experiments under the eye of a trained teacher (p. 88)”—the librarian. About information access,
Keyes made this point:
Perhaps there was a time when nearly every high-school girl had access in her own home to a fairly well-selected library where she might browse; but today not only is it true that the high school reaches a class who cannot afford such a luxury, but even the homes of the well-to-do are less often stocked with books than formerly… The best means that I know for cultivating in our young people a desire for a private library is to surround them for four years with something approaching thereto-a place where they feel thoroughly at home, where they may wander from shelf to shelf, taking down a book here and there, freely consulting the librarians as to the meaning and value of this or that volume, and taking home any but those in greatest demand (p. 91).
And Breck (1916) had this to say about the importance of information access:
Our books should be in the school building, not in a branch of the city library, no matter how conveniently located, not even if only across the street or next door. No fact is better established in high-school work today than that a well-equipped, well-administered library within the school building will be steadily and increasingly patronized. I myself can bear testimony as to the difficulty with which young people are driven to the city library, even when near at hand (p. 11).
About workload and staffing, Fletcher (1915), an Illinois high school librarian, remarked,
The librarian has, of necessity, long hours. She begins work about eight o'clock, and has to evict tenants to get away by five. She has, in all probability, no vacant hour, and her forty-five-minute period for luncheon is often cut short by seekers for fact…With such handicaps, plus the large amount of routine clerical work she must perform, if there is no assistant-and even if there is-the average librarian cannot be the inspirational force she should be (p. 357).
Fletcher discussed the skill with which the librarian must work with teachers, guiding them in
their use of instructional materials and strategies, and she predicted that as school leaders, they
would “equal—or surpass—our best supervisors of today” (p. 361). Certain (1924) noted that
the elementary school librarian gives instruction “in the use of the dictionary and the
encyclopedia. She teaches the children how to read, how to skim, how to take notes, and how to

12
use the library catalogue or a table of contents. She directs the choice of books for pupils eager
for sympathetic guidance and attention” (p. 362).
While American school libraries first materialized in the 1800s, most notably in New
England (McCarthy, 2006), but also in New York and Michigan (Cecil & Heaps, 1940), growth
of school libraries gained speed with the 1918 publication of Standard Library Organization and
Equipment for Secondary Schools of Different Sizes, written by a committee chaired by Certain
and subsequently endorsed and published by the American Library Association (ALA) in 1920
(Gann, 1998). While these standards are largely concerned with physical requirements and
resources for school libraries, including collections, physical space and equipment, budgets, and
oversight, this document also describes the instructional role of the librarian. The standards state
emphatically that the librarian is not a clerk but a professional who “should have the ability to
work for and with teachers (American Library Association [ALA], 1920, p.12). This document
envisions the library as “the very heart of the high school” (p.4) in the achievement of both
academic and social goals. Standards for staffing include a librarian with an undergraduate
degree and at least one year of graduate work in library science, a year’s work with young adults,
and experience as a high school teacher desirable, although not required, with salary equal to that
of a department chairperson (ALA, 1920, p. 18). From very early on, then, the school library
community has stressed the importance of the school library program’s role in academic
achievement and insisted upon professional qualifications of staff in pursuit of that achievement.
Shortly after publication of the secondary school standards, regional accreditation bodies
began to require that secondary schools have libraries with trained librarians in order to be
accredited, which prompted further growth of school libraries in the nation’s secondary schools
(Woolls, 2005). A similar set of standards was developed for elementary schools. Certain again

13
chaired this committee, which was comprised of school principals from the National Education
Association and members of the ALA’s school library section (McCarthy, 2006). Notably
included is the recommendation that the collection should include not only reference material,
but recreational reading, duplicate copies of popular titles, books for teachers, and multi-media
materials such as film, pictures, stereographs, and audio recordings (ALA, 1925).
The elementary standards, known together with the secondary standards as the Certain
Reports after their chairman, took note of the evolving progressive philosophy in education and
identified the school library program’s role in that process, saying, “significant changes in
methods of teaching require that the school library supplement the single textbook course of
instruction and provide for the enrichment of the school curriculum” (ALA, 1925, p.1;
McCarthy, 2006, p. 280). The strategy of moving away from the textbook as the sole source of
information and the rise of the school library are inextricably linked (Cecil & Heaps, 1940;
Davies, 1969; Roscello, 2004; Callison & Preddy, 2006). In 1915, Johnson (as cited in Davies,
1969) said, “a conviction has developed, especially during the last twenty years (1895-1915) that
the textbook should be supplemented by collateral reading”(p. 323). In the same year, Bostwick
said, “A library, used for teaching purposes in a school, is indeed a ‘composite book.’ It insures
contact with a composite instead of a single mind” (1915, p. 403).
The implications of an educational system in which no single source is considered the
final authority are clear. Says Bostwick, “This means a library at the very beginning, and at high
school age it means a large library” (p. 404). Two years after the elementary standards were
published, National Education Association president Morgan said in the preface to School
Library Yearbook—Number 1, “The School Library lies at the very root of the new pedagogy of
individual differences. It is the very heart of any program of socialized effort and individual

14
responsibility” (ALA Education Committee, 1927, p. 3). The importance of librarian as teacher
in this pedagogy was articulated by Wilson (1928) in his review of Logasa’s 1928 book, The
High School Library: Its Function in Education: “The outstanding merit of the book is not that it
presents a guide to effective library practice but that it attempts to correlate library practice with
the underlying philosophy of education itself. The book is valuable because it reveals the
librarian as a teacher, a vital member of the school staff. In this respect the book is a pioneer in
its field” (p. 795).
Then as now, the publication and promotion of standards do not always translate into
support. In fact, most elementary school libraries were generally either non-existent, haphazardly
constructed and operated, or poorly funded up until at least the 1950s (Woolls, 2005).
Nevertheless, the concept of the school library and the role of the school librarian made great
strides between 1925 and the next published standards in 1945. The ALA Education Committee
in 1928 published School Library Yearbook-Number Two, and in consideration of training for
school library professionals, the committee states that a key part of the school librarian’s
background must be “an understanding of educational theory and practice, at present only to be
obtained through the usual courses in education designed to prepare teachers, not librarians” (p.
81). The school library community would do much in the coming years to solidify the school
librarian’s role as both teacher and librarian.
As Lester and Latrobe (1999) point out, School Library Yearbook-Number Two raises the
complexity of the dual role in a school setting and identified teachers’ colleges and library
schools that offer school library courses for public school administrators. “Where principal and
superintendent are alertly aware of the possibilities in professional library service, there is no
question of correct school library direction” (ALA, 1928, 82). This recognition of the need to

15
educate administrators to ensure their support is seen in recent guidelines for school library
media programs today (AASL & AECT 1998).
In California, school library advocates expressed similar ideas about the importance of
the school librarian to the overall activities of the school and of the need for the librarian to have
a teaching background. In a 1933 reflection on the growing importance of the librarian in Los
Angeles City schools, Dorsey says, “In time it became apparent that the status of the school
librarian could be improved and stabilized by requiring a more extended preparation which
should include some teacher training as well as that for library work and which should culminate
in teacher-librarian certification” (Los Angeles City School District Librarians, 1933, p. 27). The
superintendent of Los Angeles City schools expands on this idea in his own appreciation of the
demanding nature of a school librarian’s role:
If one could secure his ideal for such a position she (the school librarian) would be worth more salary than any school system can afford to pay. The librarian contacts everybody in school, both in the student body and in the faculty. She has to be adaptable to all types of dispositions and all ages…Not only on the personal side are the demands upon the librarian very heavy. The demands in the way of training and continual self-development are equally exacting. In order to meet the demands which the continually changing and expanding curriculum of a modern secondary school puts upon the library, the librarian herself must be widely informed. This means that in the way of basic general education she needs more than does any other person in the school. ..Coupled with even the best of training there must be, first, a distinct understanding that the library is not a place where books are kept but where those who need help receive it and receive it promptly…No novice, either in library work or in teaching, can expect to come into the library of a large city school and start off with complete success. Undoubtedly, it would be better if the prospective librarian could have as much as four or five years’ experience as a teacher in a high school or junior high before beginning her library work (Los Angeles City School District Librarians, 1933, p. 51).
In 1933, in fact, the California state education code reflected an understanding of the necessity
of an education background for school librarians in its credentialing requirements for a school
librarian, which included a four year undergraduate degree; twenty-four hours of training from

16
an ALA accredited library school; sixteen hours of work in English, science, social science and
physical education; and fifteen semester hours of work in education, including the theory and
practice for elementary and secondary school and “other courses in education organized for the
training of public school teachers” (Los Angeles City School District Librarians, 1933, 59).
Beginning in the late 1930s, ALA published a series called Experimenting Together, with
titles including The Librarian and the Teacher of English (Heller & Labrant, 1938), The
Librarian and the Teacher of Science (Siebens & Bartlett, 1942), The Librarian and the Teacher
of Music (Bowman & Dillon, 1942), The Librarian and the Teacher of Home Economics (Henne
& Pritchard, 1945). Each of these was a reflection on the relationship between classroom
teacher and school librarian, and the role of the school library in the total school program. Each
of these, too, explores librarianship in a way that presages current philosophy about school
library media programs. As an example, The Librarian and the Teacher of English (Heller &
Labrant, 1938) examines access to information, teacher-librarian collaboration, the librarian’s
instructional role, leadership, and integration of library skills into the curriculum.
About access to information, for example, Heller and Labrant (1938) say, “When a
school library has a large supply of books for its users and as good a collection as any available
to them, these books, convenient to use, are the ones which are for the greater part read by the
pupils” (p. 33). The authors describe a free voluntary reading program guided by both English
teacher and librarian and advocate for the superiority of the school library over public libraries in
providing materials to students at the point of need (Heller & Labrant, 1938). To provide the
kind of integrated services the authors propose, the librarian needs to understand the educational
philosophy and curriculum of the school and needs to play a leadership role, continually seeking
professional development and serving on curriculum committees. Beyond that, she needs to be

17
“present in English classes when plans are developed” (p. 19) and be a “frequent visitor to the
office of the English department” (p. 18). Heller and Labrant introduce a level of collaboration
that suggests a different instructional role for the librarian. By being present not only in the
library, but also in classrooms, and by helping to plan lessons, the librarian becomes an
instructional partner. In this setting, “the library becomes at once, not a place where people are
sent, but a means to a desired goal; the librarian is not the vendor of more-or-less superimposed
books, but an individual who aids in the solution of a difficulty” (p. 19). As students progress
through projects, they confer regularly with both teacher and librarian on all aspects of the
project, not just about resources.
To Heller and Labrant (1938), the librarian’s instructional role extends all the way to
evaluation, helping students recognize ways to improve product and process, and working with
the teacher to evaluate their own roles in the progress of the unit. In this model, “librarian and
teacher participate in pupil planning of a unit and continue with the pupils throughout their study
until the work is completed and evaluation is made” (Heller & Labrant, 1938, p. 26). Closely tied
with this model of teacher-librarian collaboration is the philosophy of integrating information
skills instruction seamlessly into the curriculum. In the case study presented in The Librarian
and the Teacher of English (Heller & Labrant 1938), “pupils learn how to use the library, not
through formal instruction but by actual experience” (p. 22). The authors argue against the
library lesson disconnected from the content of the curriculum, saying such a lesson often “fails
to carry over since there is no spark” (p. 23). The “spark” here is the motivation gained from
engaging in actual course content, using new skills for a purpose. Significantly, the teacher and
librarian share instructional responsibility for research and library skills. “Since the librarian is
regarded as a good teacher and the teacher is recognized as an expert in the knowledge and use

18
of books, great value to pupils accrues from a combination of teacher-librarian efforts” (p. 24).
Even before the publication in 1945 of the ALA sponsored School Libraries for Today and
Tomorrow (Committees on Post-War Planning), the seeds of current approaches to school library
programs had been planted, particularly in terms of access to information, collaboration,
professional training, integration of information literacy into the curriculum, and leadership.
The 1945 standards actually do not reflect current positions on school library programs as
strongly as did The Librarian and the Teacher of English (Heller & Labrant 1938).
Nevertheless, they advanced the case for school library programs in several key ways. The
purpose of the school library is “identical with the basic purpose of the school itself” (ALA
Committees on Post-war Planning, 1945, p. 9), and as such, is placed under the responsibility of
the local board of education, instead of under the domain of the public libraries. Consistent with
this shift, the standards articulated functions of school librarians that were distinctly different
from those of a public librarian, including providing support for guidance counselors’ goals and
working on curriculum development with teachers (Pond, 1998). The standards also affirmed the
importance of cooperation among the superintendent, principals, classroom teachers and the
school librarian in implementing library and school-wide goals (Committees on Post-War
Planning, 1945). In addition to qualitative standards, this document provided quantitative
standards for size of library, size of collection, and per-pupil certificated and clerical support,
noting that student population growth should come with corresponding growth in the size of the
collection and the amount of staffing to best meet student needs. The guiding principles and
standards of a school library program, finally, were inclusive of both elementary and secondary
schools.

19
Despite the evolving standards that reflect the profession’s call for a more expansive
instructional role for the school librarian, the school library was far from a firmly established,
integral part of schools across the United States. In fact, as late as 1959, just over half the
country’s public schools with enrollment over 150 had libraries (Pender, 1984). Spurred by the
Soviet Union’s successful launch of the Sputnik in 1957 and widespread concern for the nation’s
ability to keep pace with its cold war rival, the U.S. congress passed the National Defense
Education Act (NDEA) of 1959, which funded purchase of educational materials in science,
math and foreign languages, and funded professional development and special programs for
teachers (Woolls, 2005; Pender, 1984). Even though the NDEA reimbursed schools at 51 cents
to the dollar, most of the materials purchased under this act were housed neither in secondary
school libraries, which were often undersized, nor in elementary school libraries, which largely
did not exist (Woolls, 2005).
A confluence of factors, though, led to unprecedented growth of school libraries in the
1960s: creation of influential new standards; a strengthening of the professional association and
its corresponding efforts to promote and improve school libraries; and unprecedented public and
private funding. At the start of the decade, The American Association of School Librarians
(AASL) published its 1960 Standards for School Library Programs, which has been called the
most influential standards document published up to that time (Gann, 1998; Jones, 1997; Pender,
1984; Saunders, 1975; Woolls, 2005). The standards asserted the library as the center for
instructional materials of all types, broadening the school librarian’s role as a multimedia
specialist and describe the school librarian as a teacher who is jointly responsible, along with the
classroom teacher, for integrating library skills into classroom instruction (AASL and AECT,
1988). Grazier (1979) also points out that this document recommended school librarians assume

20
leadership positions, including serving on curriculum committees and site and district
committees involving policy-making.
Shortly after the 1960 standards were published, the School Library Development Project
of the AASL was established “to promote wide knowledge and understanding of the national
standards; demonstrate a team approach by librarians, other educations and citizens in
implementing the standards; develop plans and techniques for use in school library development;
and promote the adoption, in each state, of sound state standards for school libraries” (Kennon &
Doyle, 1962). A $100,000 grant funded this push to develop quality school libraries nation-wide
(Kennon & Doyle, 1962). The advisory board chairman of this group was M. Gaver, whose
early research on the impact of school libraries on student achievement helped build support for
school libraries throughout the decade.
While the standards and associated promotion of them helped “clarify the thinking of
administrators, teachers and library/media personnel about their common goals and the best
means of achieving these goals through the use of expanded library/media services” (Saunders,
1975, p. 2), substantial private and public funding became available to this end. In 1963, the
Knapp Foundation financed a $1,130,000 demonstration grant that sought to illustrate the
educational value of school library programs, promote understanding of school library programs
to the broader educational community, and increase public and school support for school
libraries in the process (Saunders, 1975). In 1965, the Elementary and Secondary Education Act
(ESEA) targeted $100,000,000 for the purchase of library resources to raise the level of school
library services described in the 1960 standards (Pender, 1984). During the first three years of
ESEA, 12 % of all public schools—over 11,000 schools—established a school library (NCES,
2005). Standards emphasizing a greater instructional role for the librarian, then, were reinforced

21
by private and government-funded initiatives that helped expand the presence and awareness of
school libraries nationwide.
The 1969 publication of Standards for School Media Programs (AASL & Department of
Audiovisual Instruction of the National Education Association [DAVI]) reflected the
increasingly important role multimedia resources began to play in education. In this document,
all media were considered equally important sources of information, and the terms media
specialist, media center, and media program were used to indicate the broadened focus of the
library program beyond print materials in an attempt to unify school library and audiovisual
programs (AASL and AECT, 1988). The instructional role of the librarian, now called a “media
specialist” (AASL and AECT, 1988), was further developed in these standards, too. The media
specialist works with teachers in curriculum planning, provides assistance with resources in
classrooms, provides teachers with relevant information about students’ progress as observed in
the media center, and even serves as a full-time member on teaching teams where possible
(AASL & DAVI 1969). The media specialist additionally provides in-service training on the full
spectrum of media and their uses and acts as instructional consultant to teachers, keeping
teachers apprised of recent educational trends and providing help with the analysis and design of
the instructional program and activities (Gann 1998).
The 1975 standards expanded the instructional role of the media specialist even further,
stressing the media specialist’s involvement with classroom teachers in instructional design,
moving the media program “from a support service to an integral part of the total instructional
program of the school (AASL & AECT, 1988, p. 3).
Despite widespread funding and support for school libraries in the preceding decade, in
the 1980s, the education community as a whole faced much criticism, perhaps no more strongly

22
than from the National Commission on Excellence in Education. This commission’s report, A
Nation at Risk: The Imperative for Educational Reform (1983), states, “If an unfriendly foreign
power had attempted to impose on America the mediocre educational performance that exists
today, we might well have viewed it as an act of war. As it stands, we have allowed this to
happen to ourselves. We have even squandered the gains in student achievement made in the
wake of the Sputnik challenge.” The report describes the failures of American education
entering the information age and calls for educational reform at all levels.
At the same time, the ESEA funding that fueled much expansion of school library
programs was shifted into a block grant giving local districts more discretionary control over the
money. By 1985, just 29 % of this money was going toward school libraries (NCES, 2005).
Hopkins and Butler (as cited in NCES, 2005, p.6) say that the competition for funding at the
local level “ended the consistent growth of library media programs throughout the nation. What
has resulted is a ‘haves’ and ‘have-nots’ existence of programs.”
In response to A Nation at Risk and the decline in federal support, the library community
published Alliance for Excellence: Librarians Respond to A Nation at Risk (Libraries and the
Learning Society Advisory Board, 1984). In their call for a new “Learning Society” (p. 4), the
authors say that “school library media programs of the best quality directly help students take
their place in the Learning Society” (p. 9). The authors caution that this can only happen “if
students know how to find, evaluate and use the information stored there. This is a basic skill
which all must acquire to function responsibly in a democratic society where more and more
information is being harvested each year” (p. 9). The call in this document to respond to the
information age in part through integrated information skills instruction in schools, with school
library media specialists taking the lead, is a precursor to Information Power: Guidelines for

23
School Library Media Programs (AASL & AECT 1988), and contains the beginnings of a
definition of information literacy that is more fully articulated in Information Power: Building
Partnerships for Learning (AASL & AECT 1998), the last two major standards and guidelines
documents produced for school library media programs.
The purpose for Information Power: Guidelines for School Library Media Programs
(AASL & AECT 1988) is stated in its introduction:
During the past decade, the proliferation of information resources and the development of new technologies have broadened and redefined the mission of the school library media program and the role of the library media specialist. AASL and AECT have worked together to prepare new guidelines that provide a sound philosophical basis for the continued development of school library media programs to meet the needs of students in the twenty-first century” (ix).
Information Power: Guidelines for School Library Media Programs (AASL & AECT, 1988)
represented a departure from the previous standards in several important ways. As articulated in
the mission statement, the library media program was to provide “intellectual and physical access
to materials in all formats (AASL & AECT 1988, p. 1). While provision of physical access to
materials is a traditional function of school library programs, intellectual access added the need
for “systematic learning activities which develop cognitive strategies for selecting, retrieving,
analyzing, evaluating, synthesizing and creating information at all age levels and in all
curriculum areas” (p. 9). This additional focus on using information meant that the library media
specialist’s role in creating learning activities had expanded (Gann 1998). Another shift from the
earlier standards was the forcefulness of the call for collaboration. A guiding principle of
Power: Guidelines for School Library Media Programs is that teachers, principals and library
media specialist must work as a team to design and implement the program that best meets the
instructional needs of the school (Cleaver & Taylor, 1989). Separate sections describe the role of

24
principal, teacher and student in working with the library media specialist (AASL & AECT,
1988).
The library media specialist’s role as teacher was more clearly defined than ever, as was
his responsibility as instructional leader (Gann, 1998). With new technologies being introduced
so frequently, it was now the library media specialist’s responsibility to provide “leadership in
assessing, evaluating, and following informational and instructional technologies" (AASL &
AECT 1988, p. 26).
While there was a pronounced shift away from quantitative standards toward qualitative
guidelines—a response to the rapid pace of change and a shifting philosophy about the role of
the library media specialist (Gann, 1998)— quantitative recommendations were offered for high
service school library programs regarding staffing, collection, technology, and budget (AASL &
AECT, 1988, 113-139), suggesting that even as conceptions of school library programs evolved,
some of the more traditional standards of quality still held sway.
Information Power: Building Partnerships for Learning (AASL & AECT, 1998) extends
the basic principles of the 1988 version with the addition of the nine information literacy
standards for student learning, organized around information literacy, independent learning and
social responsibility. The focus on standards for the student is a significant change that reflects
the nationwide trend toward student standards. Absent are the quantitative measures of earlier
standards in favor of qualitative descriptions of the roles library media specialists play in
supporting the student standards. Collaboration, leadership and technology underlie the vision of
library media programs in this document (AASL & AECT, 1998), furnishing the “theoretical and
practical grounding both for the program and for all the activities of the library media specialist;
which include serving as an instructional partner in learning and teaching, providing information

25
access and delivery, and administering and managing the program” (AASL & AECT 1998, p.
49).
Some of the responsibilities of the library media specialist and the library media program
are traditional and have been documented from the earliest standards. These include acting as
information specialist, conducting readers’ advisory, and maintaining and developing the
collection and budget. Some responsibilities, such as collaborating with classroom teachers in
instructional planning, teaching and evaluation; integrating new technologies and information
literacy skills into the instructional program; and providing school leadership through staff
training and participation on curriculum and leadership committees, have evolved in a
progression since the beginning. In Information Power: Building Partnerships for Learning
(AASL & AECT, 1998), each of these responsibilities is viewed through the lens of building
students’ information literacy skills as articulated in the standards above. Since work on this
study began, AASL has published a new document, “Standards for the 21st Century Learner”
(AASL, 2007), which focuses specifically on standards for skills, dispositions, responsibilities,
and self-assessment strategies of students. Since the data from this study pre-date this latest
AASL document, detailed discussion of those new standards is beyond the scope of this study.
As school libraries have adopted new standards in response to educational goals and
technological advancements, federal support of school library programs has dwindled. The most
recent data available for school library funding nationally shows that between 1994 and 2000,
the percent of public schools with library media centers has fallen, the number of students in
schools with library media centers has not kept pace with enrollment, the number of books per
student has fallen, and library expenditures per student have remained flat, in spite of increased
costs for books and periodicals (Michie & Holton, 2005). In 2001 Senators J. Reed and T.

26
Cochran authored a bill passed by the House and Senate allocating $500 million for school
libraries. About this legislation, Reed (as cited in NCES, 2005) said,
Too many books on school library shelves across the country contain harmful stereotypes and inaccurate material. The reason for this horrible state of affairs is the loss of targeted national funding for libraries—20 years ago dedicated school library funding was rolled into a block grant. By block granting funds to the states we abandoned a national commitment to improving school libraries (p.6).
It should be noted, though, that in 2002, the first year of the program, just $12.5 million was
available for awards. If all of the over 76,000 school libraries divided that money equally, it
would amount to about $164 per library.
Of the many elements that comprise a school library program, three are so fundamental
that their status affects the success of virtually all other elements of the program: information
access and delivery, staffing, and budget. The following sections will review the research on
these three elements in terms of their relationships to learning and teaching elements such as
information literacy instruction, integration of curriculum, and collaboration; to program
administration elements such as scheduling and administrative support; and ultimately, to
relationship of all these factors to student achievement.
Information Access and Delivery
For the purposes of this study, the idea of information access and delivery encompasses not only
information resources, but the means by which those resources can come into the possession of
students. Access includes the availability of print, audio, video, and digital materials to students
and teachers; the amount of hours and the conditions under which the library is open and
available to students; the availability of technology for student use, and the availability of staff to
help in both retrieving and understanding information.

27
Historically, school libraries have been seen as a key to fostering the beneficial
connection between access to print materials and the amount students read (Ahern,1905; Miner,
1905; Keyes, 1914; ALA, 1925; Heller & Labrant, 1938; Cecil & Heaps, 1940). Gaver (1962)
found that elementary school children who have ongoing access to good school library
collections and adequate, qualified library staff generally read two to three times as many items
of all formats and genres as those children with access only to classroom collections or
centralized collections with no professional personnel. Gaver also found that among sixth
graders, this result was not affected by socioeconomic status (1963). Squire, Applebee and
Lucas (1967) noted the increasing complexity of high school curriculum and suggested that
expanding the hours school libraries were open was a logical response to students’ need for more
and better information. Rutler, et al. (1979, as cited in Bowie, 1984) found in their study of
inner-city London schools that when school libraries stayed open after school, students used the
library more, and that when students used the library more, they did better in school.
Hours Open
Statewide studies in Minnesota (Baxter & Smalley, 2003), Michigan (Rodney, Lance &
Hamilton-Pennell, 2003), and North Carolina (Burgin, Bracy & Brown, 2003) reveal statistically
significant correlations between the number of hours school libraries are open and achievement
on standardized tests in reading and language arts. Michigan exhibited the strongest correlation,
r = .368, at the seventh grade, and this state also showed persistent significant correlations
across elementary, middle school and high school levels. The New Mexico (Lance, Rodney &
Hamilton-Pennell, 2002) and Missouri (Miller, Want & Whitacre, 2003) studies did not yield
statistically significant results at p = .05. Table 1 summarizes these results by grade level and
state.

28
Table 1
State Test Scores and Hours Library Open: Bivariate Correlations State Grade State Test r p
Minnesota (Baxter & Smalley, 2003)
3
Reading
.111**
.005
Wisconsin (Smith, 2006) 4 Reading .114* .016
Michigan (Rodney et al., 2003) 4 Reading .257* <.05
Minnesota (Baxter & Smalley, 2003) 5 Reading .08* .034
Michigan (Rodney et al., 2003) 7 Reading .368** <.01
New Mexico (Lance et al., 2002)
8 Language Arts .196 .052
Wisconsin (Smith, 2006) 8 Reading .268** <.001
Wisconsin (Smith, 2006) 8 Language Arts .302** <.001
Michigan (Rodney et al., 2003) 11 Reading .188** <.01
North Carolinaa (Burgin et al., 2003) K-12 Language Arts/ Reading
.196** .008
Missouri (Miller et al., 2003) K-12 Weighted Average Map
Indexb
-.079 .219
a. Reading test for elementary and middle schools, language arts test for high school. Used z scores to standardize measure. b. A formula that combines reading and non-reading test scores, weighted by the number of students eligible to take the test. * p <.05, ** p <.01.
In Wisconsin (Smith, 2006), partial correlations were calculated; there was a positive
correlation at the fourth grade between library hours and test scores when controlling for
teacher/pupil ratio, with an r value of .115, (p = .014).

29
Library Visits
If there is a positive relationship between student achievement and the hours a library
opens, one might expect a corresponding relationship between student achievement and the
frequency of student visits to the library. Bivariate correlations from several studies, including
Iowa (Rodney, Lance & Hamilton-Pennell, 2002), Michigan (Rodney, Lance & Hamilton-
Pennell, 2003), Wisconsin (Smith, 206) and New Mexico (Lance, Rodney & Hamilton-Pennell,
2002), bear this out. Results from the Missouri (Miller, Want & Whitacre, 2003) study also
show a positive but not statistically significant correlation. See Table 2 for a summary of results.
Table 2
State Test Scores and Library Visits per Student: Bivariate Correlations State Grade State Test r p Iowa (Rodney et al., 2002)
4
Reading
.188*
.018
Wisconsin (Smith, 2006) 4 Reading .132** .005
Michigan (Rodney et al., 2003) 7 Reading .176 † <.05
Iowa (Rodney et al., 2002) 8 Reading .142† .043
Wisconsin (Smith, 2006) 8 Reading .182** .006
New Mexico 10 Language Arts .229 .058
Wisconsin (Smith, 2006) 10 Reading .144* .024
Wisconsin (Smith, 2006) 10 ACT English .153* .017
Michigan (Rodney et al., 2003) 11 Reading .158† <.05
Missouri (Miller et al., 2003) K-12 Weighted Average Map
Indexa
.091 .159
a. A formula that combines reading and non-reading test scores, weighted by the number of students eligible to take the test. * p <.05, two-tailed. ** p <.01, two-tailed † p <.05, one-tailed.

30
In Illinois (Lance, Hamilton-Pennell & Rodney, 2005), the researchers found significant
positive correlations between library visits and writing scores at the middle school, and between
visits and reading and ACT scores at the high school level. These correlations were significant
in partial correlations controlling for four separate school and community variables, although no
numerical data were reported. In Wisconsin, though, Smith (2006) found significant positive
correlations at the fourth grade when controlling for limited English proficient (LEP) students
and at the 10th grade when controlling for LEP students, teacher/pupil ratio, and percent minority
students. See Table 3 for a summary of results.
Table 3
Wisconsin State Test Scores and Library Visits per Student: Partial Correlations (Smith, 2006) Grade State Test Correlation p Covariable
4 Reading .109* .021 LEP students
10 Reading .142* .027 percent minority students
10 Reading .141* .028 teacher/pupil ratio
10 Reading .153* .017 LEP students
* p <.05
The Florida (Baumbach, 2003) study included library visits as a discrete independent
variable in multiple regression analysis. Baumbach (2003) found significant correlations at the
10th grade level with both the state reading test (R2 change = .020, standardized beta
coefficient=.146) and ACT scores (R2 change =.059, standardized beta coefficient = .222), using
school factors as the other independent variables.
Collection Size
Other early studies reveal correlations between student achievement and both access to
the library itself and to sizable collections. Flanagan (1962, as cited in Minor, 1985), gathered

31
data on a variety of elements of American high schools, with the goal of discovering those
qualities that may contribute to the stimulation and development of young people’s aptitudes and
talents. The researchers found that the quality of the library correlated with students’
achievement in English, and that the number of books in the school library was one of the top
four strongest correlations with students’ staying in school, going to college, and overall
achievement. Squire et al. (1967) reported a comparison between the 10 school libraries with the
lowest per capita book collections and the 10 highest, and noted that student visits to the library
increased proportionally with the size of the collection. Access begets access, which results in
higher student achievement.
Since the early 1990s, Krashen has written extensively on the connections among
availability of print, how much students read, and ultimately, on student achievement. In The
Power of Reading, Krashen (2004) documents the positive effects of free volunteer reading on
literacy development. Krashen’s research supports the idea that the more print resources
available, the more students will read, and the more students read, the higher their academic
achievement. “The most obvious step” toward successful implementation of free volunteer
reading, says Krashen (2004), is “to provide access to books” (p. 57). A key to providing access,
says Krashen, is the strength of the school library, including the size of the collection, the
circulation policies, and the availability of the library resources and facilities for student use. In a
study using National Assessment of Educational Progress (NAEP) reading comprehension test
scores of fourth graders from 41 states, Krashen (1995) found that both the collection size of the
school library and public library use were significant predictors of reading achievement,
controlling for whole-school per pupil spending. McQuillan (1998) similarly found correlations

32
between NAEP reading scores and print access; these correlations remained strong when
controlling for socioeconomic factors.
Krashen notes that California’s scores on the 1992 NAEP reading test were among the
nation’s lowest, and lays the blame in part on the state’s school libraries, which the author calls
“among the worst in the United States, both in terms of books and staffing” (2004, p. 66). Today,
the situation is unimproved. The 2005 NAEP scores show California outscoring only one other
state and the District of Columbia on the reading portion of the test (Perie, Grigg, & Donahue,
2005), and library media specialist staffing ratios—the number of students per library media
specialist—are so impoverished that the gap between the 49th state and California is greater than
the gap between the 49th and 1st states (Everhart, 2003).
Krashen (2004) also notes the inequity in the levels of resources available to students
from high and low socio-economic backgrounds, and points out that while students from
wealthier parents generally have access to a print-rich environment at home and book stores,
students from poorer backgrounds have no such access, making the role of the school library all
the more crucial. Two studies of access to books in Los Angeles area communities of differing
income levels support this position, finding statistically significant differences between high and
low socioeconomic status for access to home, classroom and school library books. (Constantino,
2005; Smith, Constantino & Krashen, 1997). These studies are consistent with the findings of
Neuman and Celano (2001), who found when comparing poor and middle-class neighborhoods
in Philadelphia that poor neighborhoods were significantly less print-rich, and that the children in
those neighborhoods therefore had many fewer opportunities to engage with text.
Not surprisingly, school libraries in poor neighborhoods often don’t provide access to
nearly as many resources as do those in wealthier areas. Neuman and Celano’s (2001) analysis

33
included data on school libraries, revealing that elementary school children in the poorer
neighborhoods had access to half as many books in their school libraries, had no school
librarians, and had much more limited physical access to their school libraries when compared to
those children in middle class neighborhoods. Duke (2000) investigated differences in print
environments to children in 20 first grade classrooms from both high and low socioeconomic
status and found that there are substantial differences in the amount, type and uses of print in
those classrooms. One important difference in the descriptions of two typical classrooms was
that the classroom from a high socioeconomic background took advantage of a rotating
collection of books that children selected from the school library to be used in their own
classroom each week.
McQuillan (1998) asserts that while socioeconomic status is a strong indicator of print
access, it is not socioeconomic status that is the barrier to literacy development, since children in
low socioeconomic areas who do have access to print materials and like to read are successful in
school. Given students’ propensity to use the school library over the public library (Clabo, 2002;
Krashen, 2004), attention is drawn to the importance of access to the school library and its
resources in addressing educational equity. DeSouza’s study (2006) of academic achievement
among Mexican-origin English learners bears out this point. DeSouza discovered that the library
played an important role in his subjects’ lives when several students mentioned that library books
were the only reading materials available to them at home, and that access to a variety of books
in English and Spanish helped them continue to develop literacy in both languages. Based on his
own literature review, Bowie (1984) asserts the value of increased access to school libraries and
library materials in helping minority students bridge the achievement gap, noting that the school

34
library media center is “often the only source to which these students can turn for a rich and
varied learning experience” (p. 20).
In statewide studies, there is considerable evidence that the size of the collection may be
related to student achievement. The Florida (Baumbach, 2003), Iowa (Rodney et al., 2002), and
New Mexico (Lance et al., 2002) studies indicate a positive significant correlation at the
elementary level; Wisconsin (Smith, 2006) study shows a significant correlation at both
elementary and middle school levels, and the Michigan (Rodney et al., 2003) study shows a
significant positive correlation at all three levels. The strongest correlations were found in the
fourth grade in Michigan, weakening through the middle school and high school. A similar
pattern of strongest correlation in the elementary school to weakest in the high school can be
seen in the New Mexico (Lance et al, 2002) study. See Table 4.
Table 4
State Test Scores and Total Print Collection: Bivariate Correlations State Grade State Test r p
Florida (Baumbach, 2003)
3
Reading
.098*
<.05
Iowa (Rodney et al., 2002) 4 Reading .154* .049
Michigan (Rodney et al., 2003) 4 Reading .491* <.05
New Mexico (Lance et al., 2002) 4 Language Arts .332** <.001
Wisconsin (Smith, 2006) 4 Language Arts .126** .007
Michigan (Rodney et al., 2003) 7 Reading .321** <.01
(table continues)
Table 4 (continued)

35
State Grade State Test r p New Mexico (Lance et al., 2002) 8 Language Arts .298** .006
Wisconsin (Smith, 2006) 8 Reading .242** <.001
New Mexico (Lance et al., 2002) 10 Language Arts .214 .092
Michigan (Rodney et al., 2003) 11 Reading .132* <.05 *p <.05, **p <.01.
In Wisconsin, Smith (2006) found significant correlations from elementary school to high
school using a variety of community and school inputs as control variables. See Table 5 for a
summary of these results. In the Illinois (Lance et al., 2005) study, actual numbers were not
reported, but in partial correlations, size of the collection was significant at the high school level
when controlling for household income, per pupil expenditures, teacher-pupil ratio, and student
ethnicity; size of the collection was significant at the elementary and middle school levels for
three of these four variables. While both bivariate and partial correlations show a positive
relationship between the size of a library’s collection and student achievement, there is no clear
pattern in terms of the strength of that relationship vis-à-vis grade level.
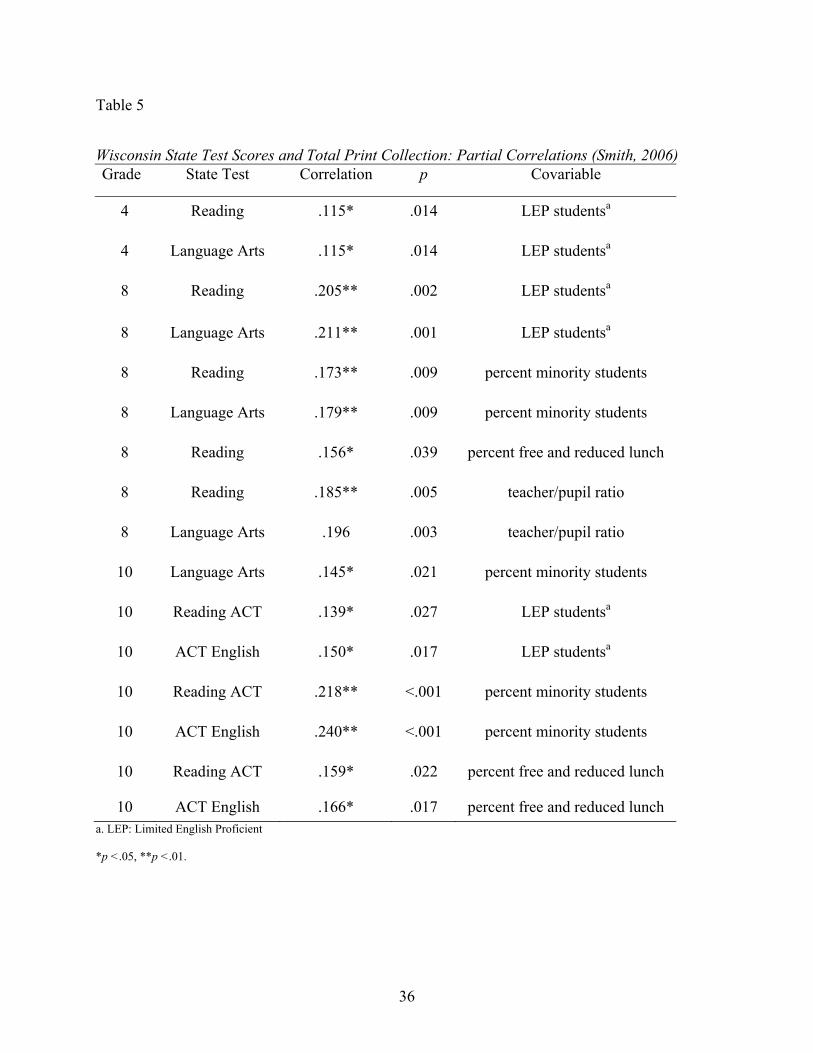
36
Table 5
Wisconsin State Test Scores and Total Print Collection: Partial Correlations (Smith, 2006) Grade State Test Correlation p Covariable
4 Reading .115* .014 LEP studentsa
4 Language Arts .115* .014 LEP studentsa
8 Reading .205** .002 LEP studentsa
8 Language Arts .211** .001 LEP studentsa
8 Reading .173** .009 percent minority students
8 Language Arts .179** .009 percent minority students
8 Reading .156* .039 percent free and reduced lunch
8 Reading .185** .005 teacher/pupil ratio
8 Language Arts .196 .003 teacher/pupil ratio
10 Language Arts .145* .021 percent minority students
10 Reading ACT .139* .027 LEP studentsa
10 ACT English .150* .017 LEP studentsa
10 Reading ACT .218** <.001 percent minority students
10 ACT English .240** <.001 percent minority students
10 Reading ACT .159* .022 percent free and reduced lunch
10 ACT English .166* .017 percent free and reduced lunch a. LEP: Limited English Proficient *p <.05, **p <.01.

37
Technology
An increasingly important consideration about the role of a library media center is the
technology to which it provides access and assistance in use. Clifton (2006) found that while the
socio-economic gap in students’ physical access to technology was shrinking, there was a
persistent gap in students’ ability to exploit technology for academic gain (See also Warschauer,
2000; Warschauer, Knobel, & Stone, 2004; Wenglinsky, 1998). One of Clifton’s conclusions is
that it is in our schools where this digital divide may be most effectively addressed.
Valenza (2007) details the active, critical role library media specialists play in mediating
students’ experiences in the virtual world. While the focus of her study is on the information-
seeking behaviors of high school students, the successes students in this study experience may be
attributed to the thoughtful construction of an information portal by an experienced library media
specialist. As R. Todd says, “Improved learning outcomes through information technology do
not happen by chance (1999, p. 4). Expanding on the part library media specialists play in
improved outcomes, Warnken (2004) says, “Librarians will continue to adapt to new
technologies and integrate them into instruction, recognizing that technology concepts and skills
are critical to educating information literate students—a role that has always been the purview of
the librarian” (p. 154).
There is some research to suggest school library media programs play an important role
in the effective use of technology. In a comparative study of two elementary schools, one in a
wealthy neighborhood and one in a poor neighborhood, Ryan (2006) reported that children’s
access to technology was directly affected by the condition of the library program. In the school
with an library media specialist, students used computers more frequently, and used them to
complete more academically rigorous tasks, including research, writing, and homework. Ryan

38
views the school library program as an effective means of addressing technology-related
educational inequity.
Baule (1997) found that Illinois schools with exemplary instructional technology
programs were more likely than other schools to have high quality school library media
programs which helped integrate technology into the curriculum. Baule attributes this partly to
teachers who are used to collaborating with the library media specialist being more willing to
work on new projects than teachers without such experience. In a study of eight high school
library media specialists’ collaborations with classroom teachers to integrate computer
technology into the school curriculum, Oliver (2003) found that it was generally the library
media specialist who initiated efforts with the teacher to integrate technology, and that the
assistance provided teachers included training about electronic resources available and
introductions to software for creating and presenting student work, all within the context of the
school curriculum. In each case, classroom teachers regarded the library media specialist as a
leader and expert in technology use.
There is also evidence in statewide studies that student access to technology through the
library media center may increase achievement. Several such studies have reported correlations
between student achievement and access to computers in the library, whether stand-alone,
networked, or Internet accessible. While most of these studies indicate significant correlations at
one or two levels, the Michigan (Rodney et al., 2003) study indicates statistically significant
correlations at the elementary, middle school and high school levels. See Table 6.

39
Table 6
State Test Scores and Library Computers: Bivariate Correlations State Grade State Test r p
Michigana (Rodney et al., 2003)
4
Reading
.280*
<.05
Michigana (Rodney et al., 2003) 7 Reading .230** <.01
Floridaa (Baumbach, 2003) 8 Reading .113* <.05
Wisconsin (Smith, 2006) 8 Reading .127* .05
Floridaa (Baumbach, 2003) 10 Reading .159* <.05
Floridab (Baumbach, 2003) 10 Reading .157* <.05
New Mexicoa (Lance et al., 2002) 10 Language Arts .318** .007
Wisconsin (Smith, 2006) 10 Language Arts .124* .049
Wisconsin (Smith, 2006) 10 Reading ACT .176** .005
Wisconsin (Smith, 2006) 10 ACT English .149* .018
Michigana (Rodney et al., 2003) 11 Reading .193** <.01
a. Library computers with Internet access.
b. Library computers connected to a network.
*p <.05, **p <.01.
Partial correlations from the Wisconsin (Smith, 2006) study indicate significant positive
correlations at all three levels using a variety of community and school control variables (see
Table 7). In the Illinois study (Lance et al., 2005), again, actual numbers were not reported, but
in partial correlations that included school and community variables, size of the collection was
significant at the high school level with two of four of the control variables, and significant in
grades 5 and 8 with three of the four control variables.

40
Table 7
Wisconsin State Test Scores and Library Computers: Partial Correlations (Smith, 2006) Grade State Test Correlation p Covariable
4 Reading .133** .005 LEP studentsa
4 Language Arts .13** .006 LEP studentsa
10 Language Arts .155* .014 LEP studentsa
10 Language Arts .148* .019 percent minority students
10 Language Arts .154* .014 teacher/pupil ratio
10 Reading ACT .188* .003 LEP studentsa
10 ACT English .163 .1 LEP studentsa
10 Reading ACT .187** .003 percent minority students
10 ACT English .159* .011 percent minority students
10 Reading ACT .169** .007 teacher/pupil ratio
10 ACT English .145* .022 teacher/pupil ratio a. Limited English Proficient
*p <.05, **p <.01.
While most of the reported correlations involving access, collection size and technology
are statistically significant, just a handful of the individual correlations from any of the studies
mentioned is as strong as r =.3. The Michigan (Rodney et al., 2003) and Wisconsin (Smith,
2006) studies report stronger than .30 correlations involving hours open; the Michigan (Rodney
et al., 2003) and New Mexico (Lance et al., 2002) studies report correlations over r = .30

41
involving size of print collection; and the New Mexico study indicates a correlation involving
computers at r = .32.
Staffing
Although Information Power: Building Partnerships for Learning (AASL & AECT
1998) discusses facets of the school library program as separate components, information access,
learning and teaching, and program administration are tightly interrelated. Budgets affect
collection size and quality; flexible or scheduled visits affect collaboration; principal support
affects budget. Staffing is arguably the facet that has the most far-reaching impact on the overall
quality of the program. The first ALA school library standards called for a librarian with an
undergraduate degree and at least one year of graduate work in library science, a year’s work
with young adults, and experience as a high school teacher desirable, although not required, with
salary equal to that of a department chairperson. Even these first standards differentiated
between the work of a school librarian and that of a clerk, noting that without clerical support,
the school librarian cannot fill the educational roles demanded of the job (ALA, 1920, 18-19).
Every subsequent set of standards and guidelines produced by ALA and affiliates has stressed
the critical role professional library staff plays in educating students. Each set of standards and
guidelines similarly suggests that library professionals can only fulfill their potential if clerical
support is present (ALA, 1920; ALA, 1925; ALA Education Committee, 1928; ALA
Committees on Post-war Planning, 1945; AASL 1960, AASL & DAVI 1969; AASL & AECT,
1975; AASL & AECT, 1988; ALA & AECT 1998). The current position statement on
appropriate staffing for school library media centers states, “The success of any school library
media program, no matter how well designed, depends ultimately on the quality and number of
the personnel responsible for the program. A well-educated and highly motivated professional

42
staff, adequately supported by technical and clerical staff, is critical to the endeavor” (AASL
2006).
Access to Staff
One of the most fundamental effects of staffing levels is the amount of access students
have to the library media center and its services. Gaver (1962) found that compared to
elementary students in a school without a centralized library and a library media specialist,
elementary students in a school with a library and a library media specialist are exposed to more
library-related activities from both the library media specialist and the classroom teacher. In
addition, these students have more access to materials and services within the classroom—an
indication of the far-reaching impact of professional staff. In a study of 94 school districts in
Michigan, Didier (1984) examined survey data from a statewide survey and found that at both
the fourth and seventh grade levels, a significant positive correlation existed between student
access to the library media center and the presence of library media specialists.
Loertscher and Land (1975) surveyed library media staff and principals from 199
Indiana elementary schools and followed up with visits to 32 of the schools to interview students
and teachers and determined that full-time library media specialists have the most liberal policies
in how many and what types of materials can be loaned to students. Furthermore, students with a
full-time media specialist receive “more assistance at a more constant rate than those with other
types of staff” (Loertscher & Land, 1975, 12), and “the full time media specialist does more to
promote reading through displays and exhibits than other media center personnel and these
efforts are noticed by teachers”(p.12). Nearly thirty years later, a state-wide study in Indiana
reported full-time library media specialists involve over twice as many students and teachers in
major reading promotion activities than do part-time certificated staff or clerical library staff

43
(Callison, 2004). The same study indicated that school libraries with full-time library media
specialists and full-time clerical support were more likely than other school libraries to offer
electronic connections to resources, maintain Websites with curricular links, and provide access
to collections that are more current and relevant to the school’s curriculum than are school
libraries with lesser staffing (Callison, 2004).
In a statewide Minnesota study (Baxter & Smalley, 2003) that included survey responses
from nearly 1,200 schools and site visits to 131 elementary and secondary schools, evaluators of
library media centers without full-time library media specialists or adequate support staff noted
poor collection development—including out-dated and poorly weeded collections-- lack of
flexible and equitable access to the library media center, and a lack of access to technology and
technology-based information resources. “Non-licensed staff may not know where to turn for
information or how to evaluate materials for selection,” say Baxter and Smalley (2003). “The
result can be a collection that does not support the school curriculum or provide the resources
students need for academic success” (p. 67).
In California as nowhere else in the United States, there is a tremendous disparity among
schools simply regarding access to library media specialists and the programs they run (Everhart,
2003). In a survey of curriculum leaders from the largest 25 public school districts in California,
Simonitus (2002) reported that inadequate staffing—with the resultant lack of access to library
resources, including library media teachers-- was the library media center issue of highest
priority. There is some indication that this lack of access to library programs is related to student
achievement. Smalley (2004) followed the success of incoming freshman in an introductory
library course at a community college in Santa Cruz county, sorting progress among students
who had gone to the three school districts surrounding the college, only one of which provided

44
library media specialists at its schools. The author found that 66 % of students who had benefited
from a library media specialist in high school earned an A in the course, while between 37 and
43 % of students from the two districts without library media specialists earned A’s. Smalley
concludes that students coming from high schools with library media specialists are “more
familiar with basic library use concepts, fundamental ideas about how information is organized
and made accessible, and how to use online catalogs to advantage…than are students from high
schools without librarians” (p. 196).
Staffing and Reading Achievement
Many of the findings about school library staffing are related to students’ reading. While
some of these are partly a function of students’ access to reading materials, others involve the
connections between staffing and effective promotion of reading activities, students’ attitudes
toward reading, and reading achievement. Masterton’s 1953 study (as cited in Gaver, 1963) of a
Chicago elementary school found that students’ improvement in reading scores is more
pronounced when a full-time librarian supervises an active library program. In 1956, Monahan
(as cited in Ireland, 2001) found in a comparison of two Indian elementary schools that in the
elementary school with the professionally staffed central library, students read more books and
of a greater variety than at the school without a professionally staffed library. The Harvard
Report on Reading in Elementary Schools (Austin & Morrison, 1963) found that one of the
greatest obstacles to effective school library programs in the promotion of reading was the
pervasive lack of available trained librarians. In her landmark study, Effectiveness of Centralized
Library Services in Elementary Schools, Gaver (1963) examined three levels of school library
service: classroom collections without a librarian, centralized collections administered by a
teacher who has teaching duties beyond the library or by a parent volunteer, and school libraries

45
with an organized central collection under the direction of a librarian. Gaver found that students
with access to a school library read twice as many books as those with access to a centralized
collection and nearly three times more than those with access only to a classroom collection.
McMillen (as cited in Didier, 1984) studied selected Ohio elementary schools in 1965
and found that where there was a full-time, professional librarian, students’ reading scores and
knowledge and use of reference materials was greater than in those libraries with lower levels of
service. In 1965, Wilson (as cited in Haycock, 1992) looked at urban elementary school libraries
in Detroit and found that in schools with centralized libraries and certified librarians, students
grades four through six scored higher in general education gain, reading achievement, and
reference skills on the Iowa Test of Basic Skills. Two longitudinal studies in the late 1960s by
Thorne (1967, as cited in Marchant, Broadway, Robinson & Shields, 1984) and Yarling (1968,
as cited in Aaron, 1972) noted the progress of students from Knapp Project schools in contrast to
comparison schools with few library services and found that students exposed to the full library
services of a professional staff scored higher in reading comprehension and library skills, and
that those higher scores were statistically significant.
Didier (1982, 1984) found that seventh grade reading scores on a state objective-
referenced test were significantly greater at schools with professional library media personnel
than at those without such staff. While Lowe (1984) did not find significant correlations between
professional school library staffing and achievement on standardized reading tests, the author did
find that students at schools with centralized libraries and professional library staff, students read
more books, read more books for school work, and read more books for general information and
recreationally than did students at schools without centralized libraries and professional staff.

46
Voelker (2006) examined the way fourth graders experience and understand literacy
events in a quality school library program. In a series of six case studies, Voelker looked at the
nature of literacy events, the way children use texts during those events, the artifacts produced,
and the role of social interaction in children’s interpretations of those events. Although Voelker
was generally critical of library media specialists’ approach to literacy, the author nevertheless
reaffirmed the importance of a high quality collection, both professional and clerical staff, and
ample technology to fourth graders' literacy development.
Internationally, two studies in the past 10 years have noted statistically significant
correlations between professional library staffing and students’ reading. Using data from a
representative sample of 9 and 14 year-old students from schools that took part in an
international literacy study, Novljan (1998) found that Slovenian students at schools with a
librarian scored significantly higher on a literacy test than students without a school librarian.
An Ontario, Canada (Ontario Library Association 2006) study of third and sixth grade students
from 880 schools, including schools from every district in the province, included reading
assessment scores, responses to a questionnaire about attitudes toward reading, and survey data
about staffing, hours open, budget, and collections from the province’s school libraries. The
researchers found that professional library staff was the strongest predictor of reading enjoyment
at both grade levels. Library staffing was associated with an increase in grade 3 reading
performance, and trained library staff was associated with higher reading scores for sixth graders
(Ontario Library Association, 2006).
Support for the positive effects of adequate library staffing can be found in many
statewide studies. Overall library media specialist staffing, including ratio of librarians to pupils,
total hours, or numbers of librarians, represents one of the measures that has most frequently

47
demonstrated a significant correlation with standardized test scores—most commonly reading
scores-- in statewide studies. Eight statewide studies include such correlations. The Florida
(Baumbach, 2003), Iowa (Rodney et al., 2002) and Michigan (Rodney et al., 2003)studies
included significant positive correlations between reading scores and library media specialist
staffing at the elementary, middle school and high school levels. The Alaska (Lance, Hamilton-
Pennell, Rodney, Peterson & Sitter, 1999) study reported significant positive correlations at the
elementary and secondary levels, while data from North Carolina (Burgin et al., 2003) was
reported cumulatively for grades K-12.
Again, no clear pattern emerged in terms of the strength of the association and grade
level. Nevertheless, along with size of the print collection, LMS staffing was one of the library
program variables that correlated most strongly with student achievement in the statewide
studies. In three of the eight studies reporting significant correlations, those correlations were
stronger than .30, and in two, Florida and Michigan, correlations were stronger that .40. See
Table 8 for a summary of results.
Table 8
State Test Scores and LMS Staffing Levels: Bivariate Correlations State Grade Library Measure State Test r p Florida (Baumbach, 2003)
3
Number of LMS
Reading
.221*
<.05
Minnesota (Baxter & Smalley, 2003)
3 LMS Total Hours
Reading .115* .018
Alaska (Lance et al., 1999) 4 LMS/Pupil Ratio CAT5a .310** <.001
Iowa (Rodney et al., 2002)
4 LMS/Pupil Ratio Reading .178* .021
(table continues)

48
Table 8 (continued)
State Grade Library Measure State Test r p Michigan (Rodney et al., 2003)
4 LMS Total Hours
Reading .350* <.05
Michigan (Rodney et al., 2003)
4 Number of LMS Reading .401* <.05
Minnesota (Baxter & Smalley, 2003)
5 LMS Total Hours
Reading .092* .018
Michigan (Rodney et al., 2003) 7 LMS Total Hours
Reading .341** <.01
Michigan (Rodney et al., 2003)
7 Number of LMS Reading .344** <.01
Florida (Baumbach, 2003) 8 LMS Total Hours
Reading .109* <.05
Florida (Baumbach, 2003)
8 Number of LMS Reading .354** <.01
Iowa (Rodney et al., 2002)
8 LMS/Pupil Ratio Reading .130* <.05
Wisconsin (Smith, 2006) 8 LMS/Pupil Ratio Reading .245** <.001
Wisconsin (Smith, 2006) 8 LMS/Pupil Ratio Language Arts
.278** <.001
Wisconsin (Smith, 2006) 8 LMS Total Hours
Reading .205** .002
Wisconsin (Smith, 2006) 8 LMS Total Hours
Language Arts
.251** <.001
Wisconsin (Smith, 2006) 8 Number of LMS Reading .191** .004
Wisconsin (Smith, 2006) 8 Number of LMS Language Arts
.179** .007
Florida (Baumbach, 2003) 10 LMS Total Hours
Reading .139* <.05
Florida (Baumbach, 2003)
10 Number of LMS Reading .422** <.01
(table continues)
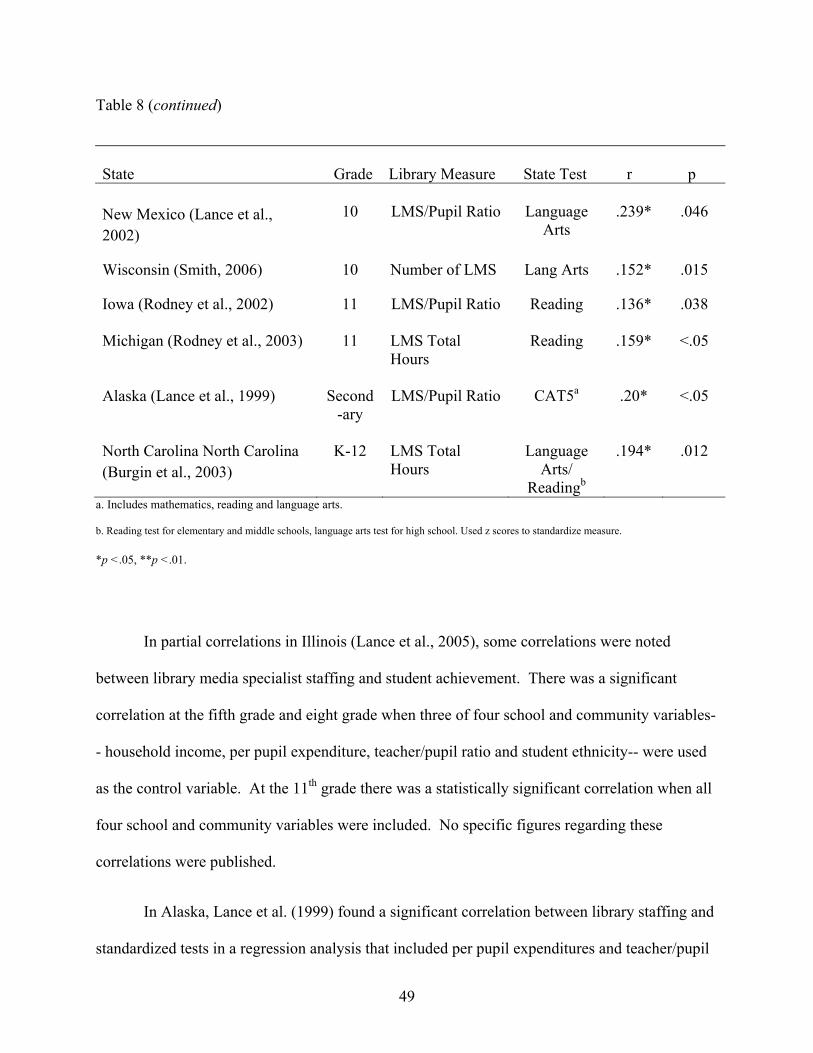
49
Table 8 (continued)
State Grade Library Measure State Test r p New Mexico (Lance et al., 2002)
10
LMS/Pupil Ratio
Language
Arts
.239*
.046
Wisconsin (Smith, 2006) 10 Number of LMS Lang Arts .152* .015
Iowa (Rodney et al., 2002)
11 LMS/Pupil Ratio Reading .136* .038
Michigan (Rodney et al., 2003) 11 LMS Total Hours
Reading .159* <.05
Alaska (Lance et al., 1999)
Second-ary
LMS/Pupil Ratio CAT5a .20* <.05
North Carolina North Carolina (Burgin et al., 2003)
K-12 LMS Total Hours
Language Arts/
Readingb
.194* .012
a. Includes mathematics, reading and language arts.
b. Reading test for elementary and middle schools, language arts test for high school. Used z scores to standardize measure. *p <.05, **p <.01.
In partial correlations in Illinois (Lance et al., 2005), some correlations were noted
between library media specialist staffing and student achievement. There was a significant
correlation at the fifth grade and eight grade when three of four school and community variables-
- household income, per pupil expenditure, teacher/pupil ratio and student ethnicity-- were used
as the control variable. At the 11th grade there was a statistically significant correlation when all
four school and community variables were included. No specific figures regarding these
correlations were published.
In Alaska, Lance et al. (1999) found a significant correlation between library staffing and
standardized tests in a regression analysis that included per pupil expenditures and teacher/pupil

50
ratio. In Michigan, Rodney et al. (2005) noted a statistically significant correlation between
reading scores and library media specialist staffing at the 7th and 11th grade when including the
percent eligible for free and reduced lunch, per pupil school expenditures, and the percent of
minority students in the regression. In both studies, other school and community variables were
excluded from the regression as part of factor analysis. See Table 9 for a summary of the data
from Alaska and Michigan.
Table 9
State Test Scores and LMS to Pupil Ratio: Multiple regression analysis
State Grade State Test ∆R2 Beta p Co-variables Alaska (Lance et al., 1999)
4
CAT5a
.089
---b
.001
Pupil expenditures, teacher/pupil ratio
Michigan (Rodney et al., 2003)
7 Reading .008 .095 .001 percent eligible for free & reduced lunch, per pupil school expenditures, percent minority students
Michigan (Rodney et al., 2003)
11 Reading .027 .166 .001 percent eligible for free & reduced lunch, per pupil school expenditures, percent minority students
a. Includes mathematics, reading and language arts. b. Not reported.
Staffing and Other Measures of Student Achievement
Several studies demonstrate correlations between staffing and other measures of student of
achievement beyond reading. Mancall’s (1985) analysis of research from the previous 30 years
led her to report that the presence of a library media program can be related to better library
skills, overall achievement, and specific content area subjects. Haycock (1992) similarly reported
a positive relationship between the level of service offered through a library program and overall
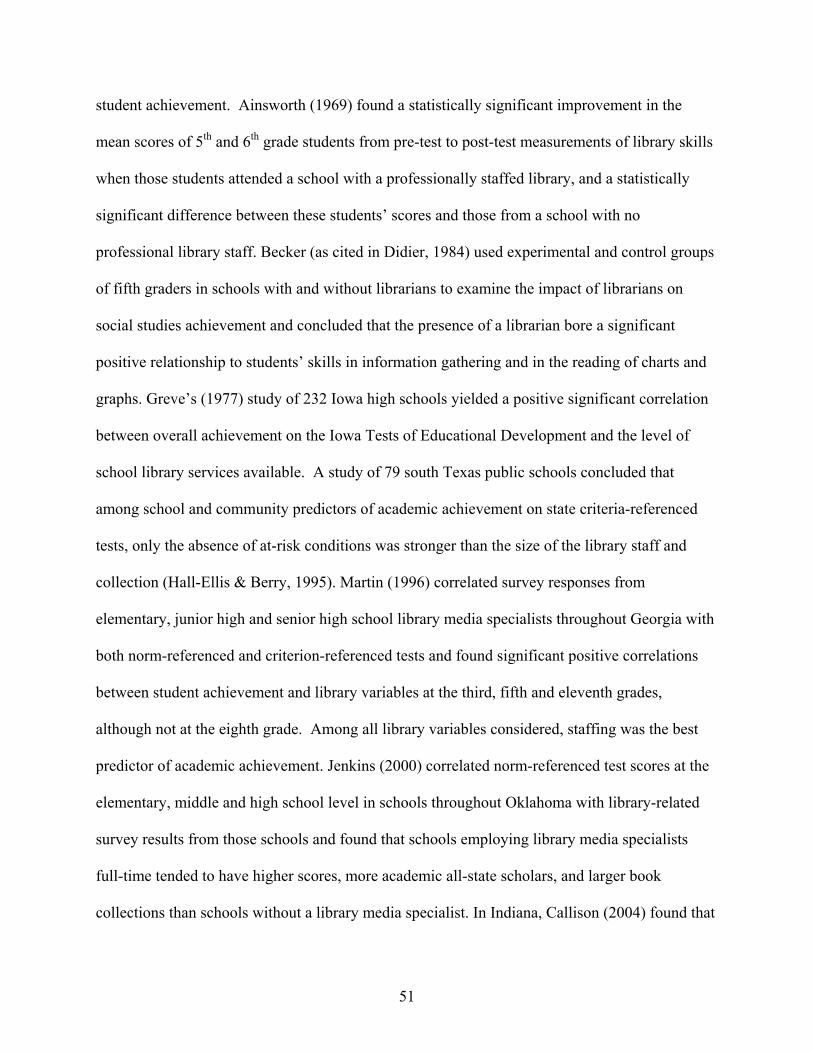
51
student achievement. Ainsworth (1969) found a statistically significant improvement in the
mean scores of 5th and 6th grade students from pre-test to post-test measurements of library skills
when those students attended a school with a professionally staffed library, and a statistically
significant difference between these students’ scores and those from a school with no
professional library staff. Becker (as cited in Didier, 1984) used experimental and control groups
of fifth graders in schools with and without librarians to examine the impact of librarians on
social studies achievement and concluded that the presence of a librarian bore a significant
positive relationship to students’ skills in information gathering and in the reading of charts and
graphs. Greve’s (1977) study of 232 Iowa high schools yielded a positive significant correlation
between overall achievement on the Iowa Tests of Educational Development and the level of
school library services available. A study of 79 south Texas public schools concluded that
among school and community predictors of academic achievement on state criteria-referenced
tests, only the absence of at-risk conditions was stronger than the size of the library staff and
collection (Hall-Ellis & Berry, 1995). Martin (1996) correlated survey responses from
elementary, junior high and senior high school library media specialists throughout Georgia with
both norm-referenced and criterion-referenced tests and found significant positive correlations
between student achievement and library variables at the third, fifth and eleventh grades,
although not at the eighth grade. Among all library variables considered, staffing was the best
predictor of academic achievement. Jenkins (2000) correlated norm-referenced test scores at the
elementary, middle and high school level in schools throughout Oklahoma with library-related
survey results from those schools and found that schools employing library media specialists
full-time tended to have higher scores, more academic all-state scholars, and larger book
collections than schools without a library media specialist. In Indiana, Callison (2004) found that

52
“a higher achieving full-time school library media specialist and a larger than average group of
high achieving students are likely to be found in the same elementary school.”
Library Media Specialist Instructional Roles and Student Achievement
More available professional staffing suggests more time to carry out instructional roles
that may have an impact on student achievement. The most obvious instructional role of the
library media specialist is the direct instruction provided to students. In a mixed-methods study
of the role of the library media program at three nationally recognized South Carolina Blue
Ribbon schools, researchers analyzed data from site visits and interviews, questionnaires, and
surveys of principals, teachers, and library media specialists and found that, according to
students, the single most important service provided by the library program was help from the
library media specialist (Gehlkin, 1994). Students at all three schools identified as either mostly
or definitely true just three statements about the library program. Two of them involve the direct
instructional role of the library media specialist: “The media specialist helps me evaluate the
quality of information sources” (p. 81) and, “The media specialist helps me with difficult
questions such as, ‘I need to write a major paper on an American poet, and I have no idea where
to begin. Will you help me get started?’” (p. 81). The third statement also involves both
instruction and collaboration: “When my class goes to the library, the media specialist works
with my teacher to help us” (81).
Faculty and students grades 3 through 10 from 39 schools identified by an international
advisory panel as having effective school library programs participated in an Ohio study that
articulates the multifaceted instructional role library media specialists perform with students
(Todd & Kuhlthau, 2004). Two Web-based Likert-type surveys, one for students and a similar
one for faculty, were used to collect data about “helps”—the aids used to help bridge information

53
gaps leading to new knowledge or sense-making—provided by the library program. 48
questions corresponded to seven different categories of helps provided, including location and
access of information; use of information to complete school work; completion of school work
in general; use of computers; reading and writing; influence of the school library program
outside of school; and overall academic achievement. The number one ranked help by students
was, “The school library has helped me know the different steps in finding and using
information,” an outcome related to information literacy. “Underpinning the students’ value of
instructional intervention in information literacy development,” the authors concluded, “are
school librarians who have a clearly defined role in information-centered pedagogy as
information-learning specialists” (Todd & Kuhlthau, p. 22).
In a subsequent study that used the survey tool developed by Todd and Kuhlthau in the
Ohio study (2004), Wisconsin students and teachers reported that library media specialists
helped students gain skills they did not learn in the classroom, including how to search, review
and synthesize information (Smith, 2006). This study also included case studies of five
outstanding library programs, in which the researcher noted that the library media specialists in
all five programs spent the majority of their time on instructional activities, including teaching
collaboratively, teaching information literacy and technology literacy skills, and assisting
students with their projects (Smith, 2006).
Much of the research conducted about the library media specialist’s direct instruction of
students involves library skills and, later, information literacy. Early research compared non-
integrated library program instruction to a lack of instruction and supported the position that
students who receive such instruction outperform those who do not (Didier, 1984; Haycock,
1992; Marchant et al., 1984). As the instructional role of the library media specialist finally

54
gained traction (see Cleaver & Taylor, 1989; Craver, 1986; Grazier, 1979), subsequent studies
examined the effect of information skills instruction integrated into content area curriculum and
found such integration to boost student achievement (Bingham, 1994; Broadway & Baldridge,
1988; DeBlauw, 1973; Farwell, 1998; Hara, 1996; Kirkland, 1993; Kreiser, 1991; Loertscher, Ho
& Bowie, 1987; Rojtas-Milliner, 2006; Todd, 1999). Statewide studies showing significant
positive correlations between information literacy instruction and standardized achievement
scores include Alaska (Lance et al., 2000), Pennsylvania (Lance, Rodney & Hamilton-Pennell,
2000b), Massachusetts, (Baughman, 2000), New Mexico (Lance et al., 2002), Indiana (Callison,
2004), Illinois (Lance et al., 2005), and Wisconsin (Smith, 2006).
Collaboration between Library Media Specialists and Classroom Teachers
More broadly, successful integration of information literacy instruction requires
collaboration with classroom teachers to plan and teach curriculum (AASL & AECT, 1998, 64).
Professional and academic literature points to the benefits of such collaboration in terms of
student achievement. Bell (1990) and Bell and Totten (1992) found that in academically
effective schools, classroom teachers were more likely to choose school library media specialists
to collaborate on instructional problems. Haycock (1992) concluded from his review of doctoral
dissertations that students gain more competence in research and study skills when these skills
are integrated into collaborative lesson plans created by classroom teachers and library media
specialists. In a qualitative study of collaboration between classroom teachers and library media
specialists at two elementary schools that used literature-based instruction, Jones (1994)
observed that “purposeful partnerships”—deliberate curricular planning and team teaching
between classroom teacher and library media specialist—resulted in a greater quantity of
literature being read to students and a strengthened effort at literature-based instruction. Farwell

55
(1998) examined implementation of collaborative planning and teaching models as part of the
Library Power Project in ten elementary and middle school schools and reported that students
had more learning opportunities, and staff from successful schools attributed some of the
increase in student achievement to the collaborative planning between library media specialists
and classroom teachers. In a qualitative study examining the role of the library media specialist
in the integration of technology into the curriculum, Oliver (2003) concluded, “Collaborative
enterprises between the school library media specialists and teachers create opportunities to
provide quality learning experiences for students” (p. 133). Rojtas-Milliner (2006), in a case
study of a school implementing an integrated information literacy program, noted that one result
of collaborative planning between the library media specialist and classroom teachers is that
more students are engaged in critical thinking activities and authentic learning.
Several studies reveal correlations between LMS/classroom teacher collaboration and
achievement on standardized tests. Farmer’s (2006) study of Southern California schools
revealed that collaborative planning and instruction accounted for over 17% of the variance in
principles correlated with academic achievement. Hall-Ellis and Berry’s (1995) south Texas
public school study showed that higher criteria-referenced test scores tests correlated positively
with collaborative planning between the library media specialist and classroom teachers. Among
state studies examining bivariate correlations between collaboration and state reading test scores,
Lance, Rodney & Hamilton-Pennell (2000a) found significant positive correlations between
collaboration and student achievement at all grade levels tested. Significant positive correlations
at the elementary level were found in Iowa (Rodney et al., 2002) and Minnesota (Baxter &
Smalley, 2003), while there was a significant positive relationship at the middle school level in
Wisconsin (Smith, 2006). In Michigan (Rodney et al., 2003), significant positive correlations

56
were found at the elementary and middle school levels, and the middle school and high school
levels in New Mexico (Lance et al., 2002) . Table 10 summarizes the results.
Table 10
State Test Scores and Collaboration: Bivariate Correlations State Grade Correlation r p Colorado (Lance, et al., 2000a)
3
Collaboration
.198†
.015
Minnesota (Baxter & Smalley, 2003) 5 Planning w/Teachers .078* .039
Colorado (Lance, et al., 2000a) 4 Collaboration .176 *,a .025
Iowa (Rodney et al., 2002) 4 Co-Teaching .129 † .049
Iowa (Rodney et al., 2002) 4 Planning w/Teachers .144 † .032
Michigan (Rodney et al., 2003) 4 Planning w/Teachers .153 † <.05
Minnesota (Baxter & Smalley, 2003) 5 Planning w/Teachers .078* .039
Colorado (Lance, et al., 2000a) 7 Collaboration .205† .039
Michigan (Rodney et al., 2003) 7 Co-Teaching .170 † <.05
Michigan (Rodney et al., 2003) 7 Planning w/Teachers .158 †† <.01
New Mexicoa (Lance et al., 2002) 8 Planning w/Teachers .295* .023
Wisconsin (Smith, 2006) 8 Planning w/Teachers .146* .027
Wisconsina (Smith, 2006) 8 Planning w/Teachers .210** .001
New Mexicoa (Lance et al., 2002) 10 Co-Teaching .265* .032 Note: Dependent variable for each correlation was state reading test scores unless otherwise indicated.
a. Dependent variable was the state language arts test.
* p <.05, two-tailed. ** p <.01, two-tailed † p <.05, one-tailed. ††p <.01, one-tailed.
In Illinois (2005), Lance et al., found some statistically significant correlations between
collaboration and test scores when controlling for school and community variables in partial

57
correlations. At the elementary level and middle school levels, library staff’s identifying
materials for teachers significantly correlated with reading scores when controlling for three of
four school and community variables. No other significant correlations were reported related to
teacher/LMS collaboration at the elementary or middle school levels. At the high school level, a
statistically significant correlation was found between LMS/teacher co-teaching and reading
scores when accounting for four school and community control variables. No specific data were
reported for any of these findings.
In Wisconsin, Smith (2006) found significant correlations between collaboration and
state test results only at the middle school when examined without intervening variables
(r =.171, p =.01). Significant correlations were found at both middle school and high school
when controlling for free and reduced lunch, limited English proficient students, and ethnicity,
the strongest correlation at the eighth grade when controlling for ethnicity at r =.214, p =.002.
See Table 11 for results.
Table 11
Wisconsin State Test Scores and Collaboration: Partial Correlations (Smith, 2006) Grade State Test Correlation p Covariable 8
Reading
.134*
.043
LEP studentsa
8 Language Arts .202** .002 LEP studentsa
8 Reading .138* .037 percent minority students
8 Language Arts .214** .002 percent minority students
(table continues)

58
Table 11 (continued)
Grade State Test Correlation p Covariable 8 Language Arts .169* .025 percent free and reduced lunch
10 Language Arts .171 .057 LEP studentsa
10 Language Arts .146* .027 percent minority students
10 Reading ACT .124* .049 LEP studentsa
10 ACT English .151* .017 LEP studentsa
10 Reading ACT .148* .01 percent minority students
10 ACT English .181** .004 percent minority students a. Limited English Proficient
*p <.05, **p <.01.
Staffing and Its Impact on Learning and Teaching
If, as the literature just reviewed suggests, the learning and teaching responsibilities of
the library media specialist have an impact on student achievement, then it must also be
established that the quality and amount of staffing, both certificated and clerical, have a direct
impact on the ability of the library media specialist to carry out those responsibilities. Gaver
(1963) found that students in a school with a centralized library and a certificated librarian have
more access to the library, its resources, and its services than are students in a school lacking a
certificated librarian or a centralized collection. Based on the results from interviews and surveys
with elementary, middle and high school library media specialists, school principals and district
superintendents, The Millbrook Report (1990) concluded that the amount and quality of
curricular and instructional involvement by library media specialists may be directly related to
their educational training in library science. This report also noted the clear division of labor

59
between library media specialists and clerical staff: professionals spend more time on curricular
planning and implementation, materials selection, and acting directly as a student resource, while
clerical staff spend the majority of their time on library management tasks, such as checking out
and renewing books, issuing overdue notices, and other warehousing functions. In studies of
Indiana elementary schools measuring the perceptions of library media staff, teachers and
students regarding the services provided by the library media center, Loertscher and his
colleagues (Loertscher, 1973; Loertscher & Land, 1975) concluded that full-time library media
specialists provide a significantly greater number of services, both traditional and “cutting-edge”
(Loertscher & Land, 1975, p.16), than do either part-time professionals or full-time clerical staff.
In a later study of 146 of the 209 exemplary elementary schools identified by the U.S.
Department of Education during 1986, Loertscher, Ho & Bowie (1987) added evidence to the
contributions made by library media specialists and to the impact staffing levels have on this
contribution. Library media specialists responded to 19 Likert-scale statements about activities
they engaged in regarding instructional development, services to teachers and students, and
maintenance of the collection and answered three open-ended questions about their programs.
The researchers also gathered data on the size and composition of the library staff, including
number of full-time professionals, clerks and volunteers. This study confirmed earlier work
which showed that the total full-time equivalency (FTE) of all staff and volunteers predicts the
number and frequency of library services; and the FTE total of library media specialists predicts
the frequency of “cutting-edge” services (Loertscher et al., 1987, p.152). The authors also noted
that while integration of library media center materials into the curriculum was a prominent
feature of fully staffed library media programs, those services declined as staff was reduced.
Full-time library media specialists with adequate clerical support were able to integrate

60
instruction with library media center materials by taking advantage of flexible schedules that
allowed individuals, small groups and whole classes to have access to the library all day long,
but in schools with inadequate staffing, such integration of instruction was a remote possibility,
not a reality. The authors offer this critical conclusion about staffing levels:
There seems to be a threshold at which the library media program begins to pay the kinds of dividends expected from the investment made in it. This threshold is a staff consisting of a full-time professional and a full-time clerical person. This finding was not only statistically significant but was the single most important variable in an excellent library media program. Having a fine facility stocked with ample materials and equipment is essential, but without the critical staffing component, services suffer and the impact on education is drastically lowered (Loertscher et al., 1987, p.152). Other studies support the conclusion that the library media specialist’s involvement with
learning and teaching is dependent on adequate staffing. In California, a survey study of library
media programs throughout the state reported that the frequency and number of instructional
services in school libraries were directly associated with the presence of certificated staff.
(Brandes, 1987). 72 % of school libraries with certificated staff, for example, routinely offered a
sequential program of library skills instruction, compared to 34 % of libraries without
certificated staff; 65 % with certificated staff routinely coordinated library skills instruction with
classroom instruction, while 30 % without certificated staff did so (Brandes, 1987). Based on
her own dissertation work on staffing patterns for school librarians and her review of the relevant
research, Aaron (1981) concluded, “The frequency with which the school library media special
assumes an active role in curriculum and instruction is directly related to the size of the media
staff” (p.281). Zweizig’s 1999 review of Library Power schools includes the finding that
elementary school libraries with fixed scheduling of classes, which restricts the library media
specialist’s instructional role and ability to respond to a range of demands (see Donham van

61
Deusen & Tallman, 1994), had significantly less support staff than did libraries with flexible
scheduling.
In a self-sampling study in which eight elementary, middle and high school library media
specialists collected data about their activities, McIntosh (1994) found that among study
participants, the three who did not have clerical help showed a “marked decrease in the
percentage of time spent in either the role of teacher or instructional consultant” (p. 107).
Similarly, Farwell (1998) noted in a study of collaboration practices at elementary and middle
schools that teachers, principals, and library media specialists all acknowledged collaborative
planning can only happen in the presence of adequate clerical staff in the library media center.
In Indiana (Callison, 2004), full-time library media specialists at all grade levels K-12 were more
likely to participate in instructional planning than were part-time library media specialists. In a
case study focusing on the leadership role of four library media specialists, Underwood (2004)
observed that collaboration between library media specialists and classroom teachers often
comes on top of all other roles and responsibilities, and that “without paraprofessional staffing,
the collaborative programs are doomed to failure” (p.46). Beaird’s (1999) study on collaboration
practices of library media specialists included reflections from library media specialists about
inhibitors to collaboration, including this representative comment: “For collaboration to work…I
now believe an aide is necessary to maintain library services” (p. 92). McCracken (2001)
reported from a survey of over 500 school library media specialists that they believe they are not
able to fully implement their roles, and that one of the most frequent barriers to fully
implementing their roles was the lack of clerical staff, resulting in professional staff having less
time for activities such as partnering with classroom teachers to plan lessons and teaching
information literacy skills. In a case study of the change process involved in one high school’s

62
implementation of an integrated information literacy program, Rojtas-Milliner (2006) concluded
that at schools like this one, with a population of just over 1,000 students, one full-time
professional librarian and one full-time clerk may be inadequate for an integrated information
literacy program.
The statewide studies below indicate statistically significant correlations between total
staff hours and hours the library media specialist spends
• Planning instructional units with teachers and identifying materials for instructional units
developed by teachers
o Colorado (Lance, Welborn & Hamilton-Pennell, 1993)
o Alaska (Lance et al., 1999)
o Pennsylvania (Lance et al., 2000b)
o Iowa (Rodney et al., 2002)
• Delivering information literacy
o Alaska (Lance et al., 1999)
o Pennsylvania (Lance et al., 2000b)
• Providing in-service training to teachers
o Alaska (Lance et al., 1999)
o Pennsylvania (Lance et al., 2000b)
o Iowa (Rodney et al., 2002)
• Meeting with curriculum or standards committees
o Pennsylvania (Lance et al., 2000b)
o Iowa (Rodney et al., 2002)
• Managing information technology

63
o Pennsylvania (Lance et al., 2000b)
o Iowa (Rodney et al., 2002)
• Providing student access to the library media center
o Alaska (Lance et al., 1999)
o Pennsylvania (Lance et al., 2000b)
o Iowa (Rodney et al., 2002)
• Teaching cooperatively with classroom teachers
o Iowa (Rodney et al., 2002)
• Offering reading incentive activities (Lance et al., 2002)
o Iowa (Rodney et al., 2002)
• Meeting with principal or other administrators (Lance et al., 2002)
o Iowa (Rodney et al., 2002)
There is ample support in the literature that staffing correlates positively with reading
achievement and other norm- and criterion-referenced measures of student achievement.
Research cited here additionally indicates that staffing levels directly affect library media
specialists’ abilities to perform many of their instructional roles. The presence or absence of
these instructional roles performed by the library media specialist has also been shown to
correlate with student achievement.
It is not surprising, then, that total library staffing levels offer an indicator of student
achievement in so many of the statewide studies. In bivariate correlations, four of six state
studies-- Michigan (Rodney et al., 2003), North Carolina (Burgin et al., 2003), Pennsylvania
(Lance et al., 2000b) and Wisconsin (Smith, 2006)—indicate positive significant correlations
between total staffing and student achievement across all sampled grade levels. In New Mexico,

64
Lance, et al., (2002) found a significant positive correlation only at the elementary level, while
in Florida, Baumbach (2003) found positive correlations at elementary and high school levels.
Total staffing, LMS staffing, and print collections represent the strongest correlations between
individual library program variables and student achievement in statewide studies. See Table 12
for a summary of these states’ results.
Table 12
State Test Scores and Total Library Media Center Staffing Levels: Bivariate Correlations State
Grade
Correlation
State Test
r
Florida (Baumbach, 2003)
3
Total No. Staff
Reading
.129**
Florida (Baumbach, 2003) 3 Total Staffing Hrs. Reading .130**
Michigan (Rodney et al., 2003) 4 Total No. Staff Reading .342*
Michigan (Rodney et al., 2003) 4 Total Staffing Hrs. Reading .298*
New Mexico (Lance et al., 2002) 4 Total No. Staff Language Arts .167*
Wisconsin (Smith, 2006) 4 Total No. Staff Reading .144**
Wisconsin (Smith, 2006) 4 Total No. Staff Language Arts .116*
Pennsylvania (Lance et al., 2000b) 5 Total Staffing Hrs. Reading .215*
Michigan (Rodney et al., 2003) 7 Total No. Staff Reading .324**
Michigan (Rodney et al., 2003) 7 Total Staffing Hrs. Reading .333**
Pennsylvania (Lance et al., 2000b) 8 Total Staffing Hrs. Reading .252*
Wisconsin (Smith, 2006) 8 Total No. Staff Reading .190**
Wisconsin (Smith, 2006) 8 Total No. Staff Language Arts .211**
(table continues)

65
Table 12 (continued)
State
Grade
Correlation
State Test
r
Wisconsin (Smith, 2006)
8
Total Staffing Hrs.
Reading
.226**
Florida (Baumbach, 2003) 10 Total No. Staff Reading .344**
Florida (Baumbach, 2003) 10 Total Staffing Hrs. Reading .265**
Wisconsin (Smith, 2006) 10 Total No. Staff ACT English .257**
Wisconsin (Smith, 2006) 10 Total No. Staff ACT Reading .255**
Michigan (Rodney et al., 2003) 11 Total No. Staff Reading .263**
Michigan (Rodney et al., 2003) 11 Total Staffing Hrs. Reading .275**
Pennsylvania (Lance et al., 2000b) 11 Total Staffing Hrs. Reading .274*
North Carolina (Burgin et al., 2003) K-12 Total Staffing Hrs. Language Arts and Readinga
.272**
a. Reading test for elementary and middle schools, language arts test for high school. Used z scores to standardize measure.
*p <.05, **p <.01.
Numerical data for partial correlation calculations were only reported in one study—
Pennsylvania (Lance, Rodney & Hamilton-Pennell, 2000b)—and positive significant
correlations remained at all sampled grade levels when controlling for community variables
including income, education and ethnicity. In partial correlations between library staffing levels
and reading scores using four school and community variables as controls, the authors of the
Illinois (Lance et al., 2005) study reported a positive significant relationship between total
staffing and student test scores in elementary, middle school and high school, although that
relationship remained statistically significant with all four school and community variables in
those correlations only at the high school level.

66
Program Administration: Staffing Levels, Administrative Support, and Scheduling
Three factors may explain some of the inconsistency in findings across grade levels:
staffing levels, scheduling, and administrative support. First, there is evidence that both
certificated and clerical staffing hours must be adequate for collaboration to take place (Beaird,
1999; Farwell, 1998; Lance et al., 1993; Lance, et al., 1999; Lance et al., 2000b; Lance et al.,
2002; McCracken, 2001; Underwood, 2004).
Second, as Bell and Totten (1991) suggest in their study of school climate factors related
to collaboration between classroom teachers and library media specialists at 39 elementary Texas
elementary schools, the level of collaboration may be influenced by organizational and
institutional characteristics that require the attention of the principal and other site and district
level administrators and school board members. Since the early 1980s there have been several
studies offering evidence that principals, in particular, exert a strong influence over the extent
and quality of planning and teaching collaborations between classroom teachers and library
media specialists (Aaron, 1981; Farwell, 1998; Gehlken, 1994; Hartzell, 2003; Haycock, 1995;
Mocek, 2002; Slygh, 2000; Tallman & Donham van Deusen, 1994; Underwood, 2004; Yetter,
1994).
Finally, scheduling of library visits significantly affects the amount of collaboration.
Flexible scheduling allows for scheduling of class visits to the library as the need arises, as
opposed to fixed scheduling, in which the schedule is unvarying and regular, often once a week,
or mixed scheduling, a combination that allows for some levels of both fixed and flexible
scheduling (Holton, Bae, Baldridge, Brown & Heffron, 2004). The work of Donham van
Deusen (1993; see also Donham van Deusen & Tallman, 1994; Putnam, 1996), which examined
the relationship between the type of library scheduling employed and the activities of library

67
media specialists, provides significant evidence that fixed scheduling discourages classroom
teacher/library media specialist collaboration in planning and teaching, whereas flexible or
mixed schedules are more likely to result in these kinds of collaborations. In response to
McCracken’s (2001) survey, elementary library media specialists identified fixed scheduling as
one of the major barriers to expanding their role of instructional partner. Over a decade after
Tallman and Donham van Deusen’s study (1994), McGregor (2006) notes that the number of
elementary schools with flexible scheduling is still small, and that there has not been much
movement from fixed to flexible scheduling in the past few years. Consistent with studies about
the principal’s support of teacher/library media specialist collaboration, McGregor also found
that the principal’s support is essential for flexible scheduling to be successful.
In Illinois (Lance et al., 2005), flexible scheduling correlated significantly with
standardized test scores at the elementary, middle and high school levels; in Colorado (Lance et
al., 2000b), this correlation held for middle school but not elementary; and in Michigan (Rodney
et al., 2003), flexible scheduling positively correlated with test scores at the middle and high
school levels.
Budget
Like staffing levels, budget affects all other areas of the library program. Quite simply,
library programs cannot operate without money. Several studies link library expenditures to the
overall quality of library programs or to overall quality of schools. Haycock (1992) found in his
literature review that per student library expenditure affected size of the staff, the collection, and
the services offered through the library media center. Loertscher et al. (1987) found in their
examination of over 200 exemplary elementary schools that 87% of those schools maintained or
increased library materials budgets in the year leading up to the study, and over half of those

68
schools reported increases in library materials spending. Yetter (1994), in a qualitative study of
resource-based learning in Washington state, found that a baseline requirement for success using
this educational strategy was adequate funding for library materials and technology. Callison
(1990) reviewed data from a 1987 U.S. Department of Education report of 571 public schools
(Williams, 1987) providing high service library media programs and noted that such programs
also typically spent more than twice as much per student on library materials, facility and staff
than did programs not offering high levels of service. Conversely, in a survey of over 500
library media specialists nationwide, McCracken (2001) reported that one of the most frequently
cited barriers to library media specialists expanding their roles was a lack of funding for
materials and equipment. The consequence of this funding shortfall was a lack of resources in all
formats to adequately support curriculum.
In the late 1990s and early 2000s, California’s public school libraries enjoyed
unprecedented state funding that vaulted per pupil expenditures close to the national mean
(Archon, 2003). Archon sought to determine the effect of that funding on school library
programs in Fresno County. The author found this funding “substantially impacted” (p. 119) the
quality and size of the collection, integration of library media center technology into the school
site’s technology plan, the library media specialist’s ability to provide regular technology
training to other teachers, and the library media specialist’s ability to collaborate with classroom
teachers in planning, teaching and evaluating lessons. Archon concluded, too, that while such
funding helped move library media teachers “towards a more collaborative and partnership role
with classroom teachers,” paraprofessionals, many of whom work without professional staff,
“have remained in the role of keeper of the books” (121).

69
Relationship between Library Expenditures and Student Achievement
Correlations between library expenditures and student achievement on state norm- and
criterion-referenced tests abound. Greve’s (1977) study found positive correlations between
achievement on the Iowa Tests of Educational Development and library services, which included
size of collection and per capita spending on the local public library, as well as size of the school
library collection and per pupil expenditures for school library materials. A study of 79 south
Texas study schools showed that student achievement on criterion-referenced tests tended to
come from schools that spent more money on their school library media programs. (Hall-Ellis &
Berry, 1995). In a study of 100 Ohio schools, half with the highest per pupil expenditures and
half with the lowest, Bruning (1994) investigated the relationship among three variables: per
pupil expenditure, library collection expenditures, and passing rates from each of the four parts
of the state’s ninth grade proficiency test. Bruning found weak to moderate significant
relationships between library collection expenditures and three of the four portions of the
proficiency test.
Bivariate correlations in five statewide studies show significant relationships between
library expenditures and test scores. In Minnesota (Baxter & Smalley, 2003), significant
correlations were found only at the elementary level; conversely, in New Mexico (Lance et al.,
2002), significant correlations were only found at the high school level. In Michigan (Rodney et
al., 2003), North Carolina (Burgin et al., 2003) and Wisconsin (Smith, 2006), those correlations
were significant across the grade levels examined at elementary, middle school and high school.
See Table 13 for specific data. Partial correlations from the Wisconsin (Smith, 2006) study are
significant at all three levels with a variety of school and community variables as controls, as
indicated in Table 14.

70
Table 13
State Test Scores and Total Library Expenditures: Bivariate Correlations State Grade State Test r p Minnesota (Baxter & Smalley, 2003)
3
Reading
.119**
.005
Michigan (Rodney et al., 2003) 4 Reading .282** <.01
Wisconsin (Smith, 2006) 4 Reading .134** .004
Wisconsin (Smith, 2006) 4 Language Arts .126** .007
Wisconsin (Smith, 2006) 4 Reading .134** .004
Minnesota (Baxter & Smalley, 2003) 5 Reading .177** <.001
Michigan (Rodney et al., 2003) 7 Reading .258** <.01
Wisconsin (Smith, 2006) 8 Reading .215** .001
Wisconsin (Smith, 2006) 8 Language Arts .218** .001
New Mexico (Lance et al., 2002) 10 Language Arts .232 .057
Wisconsin (Smith, 2006) 10 ACT English .148* .018
Wisconsin (Smith, 2006) 10 ACT Reading .154* .014
Michigan (Rodney et al., 2003) 11 Reading .273** <.01
North Carolinaa (Burgin et al., 2003) K-12 Language Arts
and Readingb
.196** .008
North Carolinac (Burgin et al., 2003) K-12 Language Arts and Readingb
.405* .029
a. Spending on books and other print materials only.
b. Reading test for elementary and middle schools, language arts test for high school. Used z scores to
standardize measure.
c. Expenditures on electronic access to information only
*p <.05, **p <.01.

71
Table 14
Wisconsin State Test Scores and Total Library Expenditures: Partial Correlations (Smith, 2006) Grade State Test r p Control Variable 4
Language Arts
.135
.10
percent free and reduced lunch
4 Reading .128* .015 percent free and reduced lunch
4 Language Arts .135* .010 percent free and reduced lunch
4 Language Arts .116* .013 teacher/pupil ratio
10 Language Arts .147 .09 percent LEP studentsa
10 Reading .129* .041 percent minority students
10 Language Arts .170** .007 percent minority students
10 Reading ACT .200** .001 percent LEP studentsa
10 ACT English .203** .001 percent LEP studentsa
10 Reading ACT .234** <.001 percent minority students
10 ACT English .242** <.001 percent minority students
10 Reading ACT .173* .013 percent free and reduced lunch
10 ACT English .164* .018 percent free and reduced lunch
10 Reading ACT .137* .029 teacher/pupil ratio
10 ACT English .138* .029 teacher/pupil ratio a. Limited English Proficient *p <.05, **p <.01
Leadership
The studies mentioned in the previous section suggest the importance of adequate
funding for a successful school library program. Lance et al. (2002) suggest that the correlation
between funding and professional staffing runs from staff to budget, not the other way around.
These researchers reason that the correlations between staffing and funding exist because
professional staff raise the profile of the library program and take a more active role in seeking
out funding sources than does clerical staff (Lance et al., 2002).

72
One way library media specialists raise the profile of the school library program is
through active leadership roles. School library research connects effective school library
programs to library media specialists’ active leadership in the school community, often in terms
of facilitating change. In Yetter’s (1994) case study of library media specialists’ participation in
the implementation of resource-based learning programs in Washington middle schools,
effective library media specialists considered themselves to be instructional leaders in their
schools, a view generally shared by administrative and teaching staff. Interviews from Yetter’s
study revealed agreement among these three groups that an important role of the library media
specialist was as a teacher of teachers and a teacher of principals; they also viewed successful
library media specialists as creators of vision and agents of change (1994).
In an examination of leadership in a case study of four Louisiana library media teachers,
Underwood (2004) similarly reported that superintendents, principals, classroom teachers and
library supervisors saw library media specialists as innovators, motivators, and agents of change.
In Farwell’s (1998) study of the collaborative process between library media specialists and
elementary and middle school classroom teachers, classroom teachers identified training of
classroom teachers as a critical role of the library media specialist; principals in the same study
identified instructional leadership as one of the library media specialist’s important roles as
successful collaborators. Farwell (1998) concluded from this study that successful library media
specialists not only needed background knowledge in the library science, pedagogy, and a
school’s curriculum, but also need to act as leaders and agents of change.
Other studies document leadership in terms of library media specialists’ offers of training
and expertise. Mosqueda (1999) reported in her study of school library programs at National
Blue Ribbon schools in Florida that almost 90% of principals and library media specialists

73
believed the library media specialist was a leader and expert in terms of information issues,
resources and technology. In McIntosh’s (1994) self-sampling study of Kentucky library media
specialists at the elementary, middle school and high school levels, the researcher noted
numerous examples of expanded leadership roles in both instruction and technology use, and
asserted that this leadership enabled more and better collaboration.
Some studies have drawn indirect or direct correlations between library media specialist
leadership and student achievement. In the second Colorado study, which examined library
program correlations with fourth and seventh grade state reading test scores, Lance et al. (2000a)
found that there was a positive, statistically significant correlation between teacher/library media
specialist collaboration and test scores, and that as the library media specialist’s participation in
leadership roles grew, so did the amount of collaboration with classroom teachers. While
leadership roles did not correlate with test scores, they did significantly correlate with levels of
collaboration. In an interview for School Library Journal, Lance expanded on the connection
between leadership and collaboration, suggesting that activities such as meeting regularly with
the principal, participating on curriculum committees, and conducting faculty in-services—all
indicators of a leadership role—are precursors to collaboration. Said Lance, “You have to step
into those leadership shoes first and establish yourself as a leader that somebody would want to
collaborate with” (Achterman, 2007, p. 51).
Cross-tabulations in the Alaska study (Lance et al., 1999) revealed that over 80 % of the
secondary level library media programs providing greater than average amounts of faculty in-
service were at schools which scored above the mean on state reading tests. Similar comparisons
in Pennsylvania between highest and lowest scoring schools showed that library media
specialists in higher scoring schools spent more time providing in-service training to teachers

74
and serving on key school or district leadership committees (Lance et al., 2000b). In Illinois, the
amount of time library media specialists devoted to serving on school committees positively
correlated with high school students’ performance on the ACT (Lance et al., 2005). In Oregon,
eighth grade students tended to score higher on their state reading tests when their library media
specialist provided in-service training to teachers (Lance, Rodney & Hamilton-Pennell, 2001). In
Texas, leadership activities correlated with student achievement scores at the elementary, middle
school, and most strongly, at the high school level (Smith, 2001).
The studies reviewed here suggest that leadership from library media specialists may be
related to student achievement, and that the level of leadership may be influenced by a variety of
factors, including staffing levels, library program budget, and support of the principal and school
culture.
Total Library Program and Student Achievement
The variations within and across statewide studies in terms of the strength of correlations
between school library program elements and test scores suggest the complexity of school library
programs’ influence on student achievement. If a program has a large budget for new materials
but inadequate staff, the quality of the collection may suffer and so may not contribute to greater
student achievement; if there is full-time professional staffing without adequate clerical support,
the quality of collaborations with teachers may fall short, and consequently, so may student
achievement. Studies in seven states include multiple regressions that combine staffing and
other library media center variables into a single factor and are compared either to individual or
grouped school and community variables. These statistics are difficult to compare, as the factor
analysis in each study produced unique variables, and the multiple regression process leaves
some school or community variables out of final regressions. In some states, there was too little

75
variation in staffing levels to produce statistically significant results when staffing levels were
part of the overall library variable. In Missouri, for example, Miller et al. (2003) found no
significant correlation between staffing levels and test scores in their regression analysis, but
found that a combination of all LMC services accounted for over ten % of the variance in test
scores. In any case, the overall library program variable in most of these studies accounted for
anywhere between 1 and 21 % of the variance in student test scores, with five of the seven
reporting changes in R2 of 7.3% or higher. As these analyses generally account for the major
school and community variables, they provide perhaps the strongest evidence of a link between
student achievement and library programs. See Table 15 for a summary of these multiple
regression analyses.

76
Table 15 State test scores and Total Library Media Center Factors, School and Community Variables: Multiple Regression State
Grade
Library Measure
∆R2
p
Beta
Co-variables
Colorado (Lance, Welborn & Hamilton-Pennell, 1993)
1
LMC size: includes total staff hours/week, number of books, periodical subscriptions, videos.
.050*
<.05
.23
At Risk: a factor including free & reduced lunch, percent minority, percent parents high school graduates. LMC size
Colorado (Lance et al., 1993)
2 LMC size: includes total staff hours/week, number of books, periodical subscriptions, videos.
.150** <.01 .39 At Risk: a factor including free & reduced lunch, percent minority, percent parents high school graduates.
Colorado (Lance et al., 1993)
4 LMC size: includes total staff hours/week, number of books, periodical subscriptions, videos.
.120** <.01 .35 At Risk: a factor including free & reduced lunch, percent minority, percent parents high school graduates.
Colorado (Lance, et al., 2000a)
4 Staffing, collections and funding
.075* <.05 .238 Percent students eligible for free and reduced lunch; percent minority students
Iowa (Rodney et al., 2002)
4 LM program development .026** <.001 .167 Percent students eligible for free and reduced lunch; percent minority student; percent adult high school graduate
Iowa (Rodney et al., 2002)
4 LM program development
.028** <.001 .169 Per pupil expenditures
(table continues)

77
Table 15 (continued) State
Grade
Library Measure
∆R2
p
Beta
Co-variables
Colorado (Lance et al., 1993)
5
LMC size: includes total staff hours/week, number of books, periodical subscriptions, videos.
.09**
<.01
.3
At Risk: a factor including free & reduced lunch, percent minority, percent parents high school graduates.
Massachusetts (Baughman, 2000) a
elem-entary
LM program development Includes books per pupil, full-time librarian, automation.
.073** <.001 --- e Percent students eligible for free and reduced lunch
Colorado (Lance et al., 1993)
7 LMC size: includes total staff hours/week, number of books, periodical subscriptions, videos.
.210** <.01 .47 At Risk: a factor including free & reduced lunch, percent minority, percent parents high school graduates.
Colorado (Lance, et al., 2000a)
7 Staffing, Collections and Funding
.016* <.05 .131 Percent students eligible for free and reduced lunch; percent minority students
Iowa (Rodney et al., 2002)
8 LM program development .028** <.001 .169 District expenditures per pupil
Massachusetts (Baughman, 2000) a
middle school
LM program development: includes books per pupil, full-time librarian
.045** <.001 --- e Percent students eligible for free and reduced lunch
Colorado (Lance et al., 1993)
10 LMC size: includes total staff hours/week, number of books, periodical subscriptions, videos.
.070* <.05 .27 At Risk: a factor including free & reduced lunch, percent minority, percent parents high school graduates.
(table continues)

78
Table 15 (continued) State
Grade
Library Measure
∆R2
p
Beta
Co-variables
New Mexico (Lance et al., 2002)b
10 School library development .079* .025 .281 Percent in poverty; percent minority, percent parents high school graduates
Texas (Smith, 2001) 10 Library staffing and print Resources
.048** .001 .218 Student Ethnic and Economic Composition; Student Ethnic and Economic Composition
Iowa (Rodney et al., 2002)
11 LM program development ---d --- e --- e --- e
Massachusetts (Baughman, 2000) a
high school
LM program development: Includes books per pupil, full-time librarian, hours of paid support staff
.015** <.001 --- e Percent students eligible for free and reduced lunch
Missouri (Miller et al., 2003)c
k-12 All LMC services .106** .003 --- e 10 school variables and eight community variables.
Missouri (Miller et al., 2003)c
k-12 Total staffing hours .000 .568 ---c 10 school variables and eight community variables.
Note: Dependent variable is state reading test scores, unless otherwise indicated.
a. Dependent variable: state reading and math test scores.
b. Dependent variable: state English Language Arts test scores.
c. Dependent variable: Weighted average map index, a formula combining reading and non-reading state test scores, weighted by the number of students eligible to take the test.
d. Researchers reported there was too little variation in LMS staffing at high school level to demonstrate a significant correlation.
e. Not reported.

79
When examining data across studies, few patterns emerged in terms of the strength of
correlations at specific grade levels. That is, with some library variables, an individual study
might yield its strongest correlations at the elementary level, while the strongest correlations for
other library variables in the same study might be found at the high school level. This lack of a
pattern was exhibited both within and across studies. This may be due to the complex
interrelationships among elements of a school library program, as well as the interaction between
the library program and school and community variables.
On the other hand, analysis of these statewide studies collectively indicates persistent, if not
strong, bivariate correlations between student achievement and school library program variables,
most notably in size of print collections, library media specialist staffing levels, and total staffing
levels. In the Wisconsin (Smith, 2006), Pennsylvania (Lance et al., 2000b) and Illinois (Lance
et al., 2005) studies, when controlling for school and community variables in partial correlations,
those correlations generally remained statistically significant. Similarly, multiple regressions
that included factor analysis to combine LMC staffing with other program elements such as
budget and collection size resulted in significant relationships between these factors and student
achievement when school and community variables were included.
Recent History of California School Libraries
Of all states, California has fared worst in maintaining quality school library programs.
Although earlier studies exist, the first comprehensive survey of the state’s school libraries,
published in 1968, reported that just 38% of elementary schools had a library, and just under
19% of those that had libraries were staffed with certificated librarians (Howell, 1968). Overall,
just under 11% of elementary schools were staffed with certificated librarians, compared to over
50% nationally (Howell, 1968). And while 98% of secondary schools had libraries, just 64% of

80
those had certificated librarians, compared with 93% of all high schools nationally with
certificated librarians (Howell, 1968). The report noted the challenges of keeping pace with the
rapid population growth of that era but nevertheless included a host of recommendations about
required staffing and budget levels to provide adequate library services to all public schools.
“The results of this study make it apparent,” wrote Superintendent of Public Instruction Max
Rafferty in the foreword of the report, “that far too little has been done for the schools to have
the library facilities, stock of library materials, and quality of library services they need and must
have to maintain the quality of modern education programs that are required” (Howell, iii).
In spite of robust federal funding from ESEA, the California legislature did not mandate
staffing or minimum per pupil expenditures. The California Media and Library Educators
Association, though, did produce Guidelines for California Library Media Programs: School,
District, County, State, which adapted the national standards of 1975 to California and
articulated qualitative and quantitative guidelines to be used by schools and districts throughout
the state in developing and maintaining quality school library programs (Guidelines for
California Media Programs, 1977).
Just as the ESEA money was folded into an education block grant, Section 18100 of the
California education code was passed, requiring school districts to maintain school libraries or
enter into contracts with other agencies to do this, and directing the State Board of Education to
adopt standards, rules and regulations for library services (Brandes, 1987). The State Board even
made strong recommendations that districts assign certificated librarians to provide services to
students in well-stocked school libraries. Unfortunately, because these recommendations and
regulations carried no funding mechanisms or sanctions for enforcement, districts were free to
carry out the Board’s instructions to any degree they chose (Brandes, 1987).

81
In spite of the attention drawn to the need for improvement of essential school library
services, funding in California was further squeezed by the passage in 1978 of Proposition 13,
which limited the property taxes through which public education was funded. The drop in
funding caused districts to cut discretionary spending, which, because there were no state
mandates, included school library programs (“School Libraries Struggle,” 1993). In the ten years
prior to 1993, half the library media specialists in California were laid off (“School Libraries
Struggle,” 1993). Not surprisingly, during that same time period, California had had the worst
funding for school libraries among the 50 states (Manzo, 1999).
Publication in 1987 of The Crisis in California School Libraries (Brandes) again focused
attention on the poor condition of the state’s school libraries, especially in comparison to those in
the rest of the country, based on a national study using the same survey instrument. This study
found that California school library staff performed significantly fewer services than did staff in
schools nationally, had lower per student expenditures, and had the lowest certificated staffing
ratios in the country. In the five years preceding the study, there was a decline of 23 % in
certificated librarians employed in the state; at the elementary level, there was a decline of 36 %.
Consistent with research already presented (See Aaron 1981; Callison, 2004; Farwell, 1998;
Lance et al., 1999; Lance et al., 2000b; Lance et al., 2002; Lance et al., 1993; Loertscher, 1973;
Loertscher & Land, 1975; Loertscher et al., 1987; McCracken, 2001; McIntosh, 1994) more
than twice the number of certificated staff coordinated library skills instruction with classroom
instruction than did non-certificated staff, and overall, the level of library services was directly
linked to the presence of a certificated librarian on staff (Brandes, 1987).
In the 1990s, a concerted lobbying effort was led by, among others, state library
consultant Barbara Jeffus and State assemblywoman Delaine Eastin—later to become the state’s

82
superintendent of schools-- to secure steady funding for school libraries. Eastin would lobby for
funding by carrying with her a copy of a book recently pulled from a school library’s shelves
which proclaimed, “Someday man will walk on the moon” (Jeffus, 2002). After a line-item
donation on the state income tax form met with success, at a time of economic upswing, the
California Public School Library Act was passed in 1998, allocating $158 million per year to
school libraries, which averaged just over $28 per student.
During that time, long-neglected collections were weeded and average copyright dates
climbed steadily upward, from 1972 in 1995 to 1991 by 2003 (“School Libraries,” 2007). Not
surprisingly, a principle finding from a study conducted on the effects of this funding on a
central California school district was that adequate funding substantially enhanced both the
availability of resources to students and the services provided to them (Archon, 2003). Archon
also concluded from his study that in schools with library media specialists, the additional
funding was more likely to result in the library media center playing a more significant role in
the school’s technology plan and with the provision by library staff of staff development and
training. Archon found that more than three times as many library media specialists than
classified staff reported that increased funding had a “substantial impact on their ability to meet
with teachers to plan and teach lessons” (p.119).
The infusion of money revitalized school library programs across the state, and library
leaders decided the time was right to develop a new set of standards and guidelines to help
people at the county, district and site level in developing effective school library programs
(California School Library Association [CSLA], 2004). Standards and Guidelines for Strong
School Libraries (CSLA, 2004) is based upon the key tenets of Information Power: Building
Partnerships for Learning (AASL & AECT, 1998) but is also aligned with the state’s curriculum

83
frameworks and academic standards. It provides standards for library media specialists, district
and county school library media supervisors, and guidelines for paraprofessionals. Unlike
Information Power: Building Partnerships for Learning (AASL & AECT, 1998), it includes both
qualitative and quantitative standards for these groups as well as for facilities, resources and
technology, offering numerous indicators for each standard and overall indicators of school
library programs that are exemplary, making progress, or at risk.
Unfortunately, at the same time that Standards and Guidelines for Strong School
Libraries (CSLA, 2004) was being developed, the state faced budget shortfalls and consequently
reduced appropriations from the California Public School Library Act to negligible levels. A
typical district saw its appropriation fall from over twenty-eight dollars to just seventy-one cents
per student (Mayer, 2006), and in 2005 state legislators folded funding for school libraries into
an instructional materials block grant, which remains the primary source of funding for over half
of California schools (“Statistics about California School Libraries,” 2007). As part of a block
grant, school library materials must compete with funding for textbooks, the need for which
typically exceeds available allocations from the state (Jeffus, 2002). As is the case at the national
level, block grant funding represents a retreat from the state’s commitment to improving school
libraries.
Nevertheless, Standards and Guidelines for Strong School Libraries (CSLA, 2004)
remains an influential document for library media specialists in California, providing specific
targets for staffing and provisioning school libraries and reiterating the fundamental principles of
Information Power: Building Partnerships for Learning (AASL & AECT, 1998), both in the
standards for student learning and in the library media specialist’s attention to the elements of the
school library program that may help students advance in those standards.

84
Previous California Study
There has been one state-wide California study examining the correlations between
student achievement and school library media programs, but the results generally contradict the
findings of the other state studies discussed in previous sections. Sinclair-Tarr and Tarr (2004)
examined the correlations between school library programs and student achievement in
California and found that there were significant positive correlations between the presence of a
school library and student achievement at some levels. At the fourth grade, the researchers
reported positive correlations on mathematics and English/language arts assessments and found
the following elements of the library program to yield positive significant correlations: collection
size, variety of technology resources, the presence of a video collection, library hours, access to
the library at a variety of times, and skills-integrated instruction. However, the researchers also
found statistically significant negative correlations between student achievement and the
planning or conducting of workshops for teachers, providing information about new resources,
and the level of classified staffing. There was an overall negative statistical relationship between
level of services offered and student achievement.
At the middle school, Sinclair-Tarr and Tarr (2004) found a statistically significant
positive correlation between the presence of a school library program and student achievement in
mathematics but found no individual element or combination of elements within the school
library program that produced a positive significant correlation. Again, contrary to expectation,
video collections, access to the library in the afternoon, and reference services provided to
students and teachers produced a significant negative correlation. In English/language arts, the
researchers found no significant positive correlations with the presences of a library program,

85
and in fact found negative correlations between those scores and the presence of a school library,
video collections, reference assistance, and access to libraries in the afternoons.
At the high school level, Sinclair-Tarr and Tarr (2004) found no statistically significant
relationships between school library programs and student achievement in either mathematics or
language arts.
There are a series of significant limitations to the Sinclair-Tarr and Tarr (2004) study that
merit a second California study. Sinclair-Tarr and Tarr (2004) use the California education code
section 188810(u) to define a school library as “any library that is established to support the
curriculum-related research and instructional reading needs of pupils and teachers and provides
the collections, related equipment, and instructional services of a staff for an elementary or
secondary school.” Sinclair-Tarr and Tarr (2004) add to their operational definition the presence
of a certificated library media teacher. But as the literature suggests, it may not be merely the
presence of certificated staff, but the level of that staffing which is the critical factor in a school
library program’s ability to offer meaningful services and create a positive significant correlation
between that program and student achievement (Baumbach, 2003; Baxter & Smalley, 2003;
Brandes, 1987; Burgin et al., 2003; Callison, 2004; Hall-Ellis & Berry, 1995; Jenkins, 2000;
Lance et al., 1999; Lance, Hamilton-Pennell, & Rodney, 2005; Lance, Rodney, & Hamilton-
Pennell, 2000a, 2000b, 2001; Lance, Welborn, & Hamilton-Pennell, 1993; ; Loertscher, 1972;
Loertscher & Land, 1975; Loertscher et al., 1987; Martin, 1996; Ontario Library Association,
2006; Rodney et al., 2002; Smith, 2001).
Second, the Sinclair-Tarr and Tarr (2004) study does not account for interaction effects
among the elements of a school library program that may need to be present for a positive
statistical relationship between school libraries and student achievement to exist. Most notably,

86
previous studies suggest that the level of combined staffing—both classified and certificated—
may be related to the level of services available and to student achievement (Aaron, 1981;
Beaird, 1999; Farwell, 1998; Lance et al., 1999; Lance, Rodney, & Hamilton-Pennell, 2000b;
Lance, Rodney, & Hamilton-Pennell, 2001; Lance, Rodney, & Hamilton-Pennell, 2002; Lance,
Welborn, & Hamilton-Pennell, 1993; Loertscher et al., 1987; McCracken, 2001; McIntosh,
1994; Rojtas-Milliner, 2006; Underwood, 2004).
The third limitation to the Sinclair-Tarr and Tarr (2004) study is its use of the School
Characteristics Index (SCI) as the variable to control for school and community factors. The SCI
is based on a regression model derived not from the individual test scores used in the Sinclair-
Tarr and Tarr study (2004), but on the base Academic Progress Index (API) score for the
previous year, a weighted combination of overall school performance scores that include test
results across all grade levels in English/language arts, mathematics, science, social science, and
the California High School Exit Examination (CAHSEE) (California Department of Education,
2007; see also Technical Design Group, 2000); in several instances, the percentage of eligible
students taking the test influences the overall score, as students not taking the test are assigned a
minimal score. In a paper critical of the API and the ranking system derived from it, Russell
(2002) points out that “aggregating scores at the school level masks the successes and failures at
the grade and classroom levels” (ix). Russell concludes that aggregation of scores at the grade or
classroom level might “promote a closer examination of practices and issues within these smaller
operational units” (x), precisely because whole-school scores such as the API do not account for
variances in scores within an individual test. In a paper about the reliability of overall school
scores, Hill and DePascale (2002) additionally found that the average variance of student scores
“were substantially different for different grade levels” (2002, p.4). While the merits of the SCI

87
in ranking schools might be debated, the problem with using it as the control variable in the
Sinclair-Tarr and Tarr study (2004) is that, because it is based on the total API score, it cannot
account for the variances in scores on the individual tests—CST Reading, English Language
Arts, and Mathematics—which these researchers used as measures of student achievement.
A fourth limitation is that in examining performance on criterion-referenced tests,
Sinclair-Tarr and Tarr (2004) looked for correlations between the presence of a school library—
already a problematic measure—and the percentage of students at a school scoring proficient or
above on a given test. The percentage of schools scoring proficient or above may have limited
value when examining the overall effect of school library programs in California. In 2004-2005,
an average of just 26% of students statewide scored proficient or above on the 11th grade ELA
test, for example (Ed-Data, 2008). Looked at another way, over half of California’s high schools
had fewer than 25% of its students score advanced or proficient on this test, and 85% of the
schools had fewer than half its students score advanced or proficient. At the eighth grade in
2004-2005, the school mean for students scoring proficient or advanced on all of the criterion-
referenced tests was just over 27% (Ed-Data, 2008). Given these realities, this may not be the
metric that best measures the effect of a school library program on all of California’s students.
The mean scaled score for each school, for each grade and content level test, provides a better
measure of comparison, as results are not grouped into arbitrarily labeled proficiency ratings.
Finally, the limitations mentioned here all represent departures from a methodology that
has been used and refined over the past fifteen years in no fewer than fourteen state studies
(National Commission on Libraries and Information Science, 2006). A new California study
would address the limitations of the Sinclair-Tarr and Tarr study and adopt a methodology
consistent with these other studies, making the results easier to compare with those of other

88
states and providing a more nuanced picture of the correlations between school library programs
and student achievement.
Theoretical Foundation
The theoretical foundation of this study derives from two models of the school library
program that reflect the increasingly instructional role of the library media specialist, as reviewed
earlier in this chapter. Loertscher’s Taxonomies of the School Library Media Program (2000)
describes a tiered library media program, with the information infrastructure—buildings,
equipment, and the network-- followed by the basic direct services libraries traditionally provide,
including reference, individual help, and provision of materials at a teacher’s request. The next
level identifies four key programmatic concerns for the library media specialist: collaboration,
reading, enhancing learning through technology, and information literacy. The end result of these
parts of a library program functioning well is increased student achievement. The visual model
indicates clearly that the technical and paraprofessional support staff assumes the greater part
maintaining the infrastructure and providing many direct services, while the LMS devotes most
of his time to instructional roles: collaborating with teachers in the creation of meaningful
learning experiences that build reading and information literacy skills and exploit technology to
enhance learning. See figure 1.

89
Figure 1. Loertscher’s model of the school library media program. From Loertscher, D. (2000).
Taxonomies of the School Library Media Program. 2nd edition. San Jose: Hi Willow Research
and Publishing. Reproduced with permission.
The taxonomy for the library media specialist in Loertscher’s model describes ten levels on a
continuum of involvement by the LMS, moving from a complete lack of involvement to
increasing collaboration and involvement with the entire school community. In the lower levels,
traditional roles of the librarian predominate; the LMS manages a functional information
infrastructure that includes access to physical and digital resources, equipment use, collection
development, individual reference assistance, and the supply of resources by pre-arrangement
and planning between the LMS and the classroom teacher.

90
It is only at the eighth level in Loertscher’s taxonomy that the LMS begins to implement
program elements that are included in what Loertscher calls the “academic achievement building
block” (Loertscher, 2000, 21): collaboration, reading literacy, enhancing learning through
technology, and information literacy. Through the intentional, deliberate collaboration between
the LMS and classroom teachers to integrate reading, technology and information literacy goals
into the classroom teacher’s curriculum, the library media program can have a substantial impact
on student achievement. The top level in this taxonomy indicates the library media specialist
participating in school and district curriculum planning, providing instructional and resource
expertise in the development of all types of curricula. See Figure 2 for Loertscher’s library
media specialist taxonomy.

91
Figure 2. Loertscher’s library media specialist’s taxonomy. From Loertscher, D. (2000).
Taxonomies of the School Library Media Program. 2nd edition. San Jose: Hi Willow Research
and Publishing. Reproduced with permission.
The Library Media Specialist's Taxonomy for the Library Media Program
1. NO INVOLVEMENT -- The Library media center is bypassed entirely. 2. SELF-HELP WAREHOUSE -- Facilities and materials are available for the
self-starter. 3. INDIVIDUAL REFERENCE ASSISTANCE -- Students or teachers retrieve
requested information or materials for specific needs. 4. SPONTANEOUS INTERACTION AND GATHERING -- Spur-of-the-
moment activities and gathering of materials occur with no advance notice. 5. CURSORY PLANNING -- Informal and brief planning with teachers and
students for librarian and library media center involvement -- usually done in the hall, the teachers' lounge, the lunchroom, etc. (Ex., "Here's an idea for an activity and some materials to use." "Have you seen …?" "What are you doing with your 6th grade? Can I help?")
6. PLANNED GATHERING - Gathering of materials is done in advance of class project upon teacher request.
7. EVANGELISTIC OUTREACH -- A concerted effort is made to promote the philosophy of an integrated library media center program.
8. IMPLEMENTATION OF 4 MAJOR PROGRAMMATIC ELEMENTS OF THE LMC PROGRAM— The four elements--
a. Collaboration b. Reading literacy c. Enhancing learning through technology d. Information literacy--
are operational in the school. The LMC is on its way to achieving its goal of contributing to academic achievement.
9. THE MATURE LMC PROGRAM—The LMC program reaches the needs of every student and teacher who will accept its offerings in each of the four programmatic elements.
10. CURRICULUM DEVELOPMENT -- Along with other educators, the library media specialist contributes to the planning and structure of what will actually be taught in the school or district.

92
Loertscher’s model grew out of a history of professional and academic work that increasingly
emphasizes the library media specialist’s instructional role. Based on analysis of survey
responses from faculty and students at 39 Ohio schools, Todd and Kuhlthau (2004) extend this
model by further delineating the LMS’s roles as informational and transformational. Figure 3
shows the traditional role of LMS as information specialist in tandem with the transformational
roles as curriculum partner and leader acting on knowledge creation, increased problem solving
skills, and higher academic achievement by students, so that the school library program becomes
a “dynamic agent of learning.” Todd and Kuhlthau identified eight roles the LMS plays in this
learning:
• Resource Agent: Provide current and diverse resources for curricular and personal
information needs; provide instruction in choosing resources and information
technologies effectively.
• Information Literacy Agent: Instruct and guide students in the research process; help
students become reflective researchers who make a connection between an effective
search process and academic success.
• Knowledge construction agent: provide instructional interventions to build information
literacy and help students construct and demonstrate new knowledge and understanding.
• Academic achievement agent: use expertise in the pedagogy of information literacy, team
teaching and learning, learning styles, and individualized instruction in responding to the
diverse needs of students to boost academic achievement.
• Independent reading and personal development agent: foster independent reading, plan
and develop ways to promote and encourage reading for academic achievement, personal
pleasure, and lifelong learning.

93
• Technological agent: provide information technology to access information; facilitate
students’ use of technology in the manipulation, production and presentation of ideas and
information.
• Rescue agent: provide just-in-time resources, help with technology, interventions in
creation of students’ work, and address other student needs for last minute help.
• Individualized learning agent: use expertise in information-centered pedagogy and
differentiated learning to provide the right intervention at the right time.
Figure 3. Todd & Kuhlthau’s (2004) model of the school library as dynamic agent of learning.
From “Student Learning through Ohio School Libraries: Background, Methodology and Report
of Findings,” available http://www.oelma.org/StudentLearning/documents/
OELMAReportofFindings.pdf. Reproduced with permission.

94
Todd and Kuhlthau’s (2004) model more explicitly details the instructional roles of the
LMS and suggests that those instructional roles are in play in the lower levels of Loertscher’s
(2000) taxonomy. Knowledge of differentiated learning and of learning styles, for example, may
inform the LMS’s interactions with students and teachers when providing individual reference
assistance. Spontaneous interactions, cursory planning, and planned gatherings—also at the
lower end of Loertscher’s (2000) taxonomy--are all informed by the LMS’s expertise in
information literacy pedagogy, facility with information technologies, and knowledge of
curriculum. Both models, though, do describe the library media specialist’s dual role as manager
of the information space, place and resources, and as instructional leader, partner, and resource to
students and staff. Under both models, the most successful school library media programs are
those in which the LMS attends to both roles.
Conclusion
This chapter has reviewed the evolution of the school library media program and the role
of the library media specialist, examining the profession’s standards, the research informing
those standards, and the studies that indicate a positive relationship between school library
programs and student achievement. In light of the limitations of the Sinclair-Tarr & Tarr (2004)
study, the need for a new California study examining the relationship between student
achievement and school library programs was argued. Theoretical models by Loertscher (2000)
and Todd & Kuhlthau (2004) were presented that reflect the dual roles of the LMS as both
manager of information space, place and resources and as instructional leader, partner and
resource to students and staff. These theoretical models are in turn reflected in the survey
instrument used in this study. That survey instrument is described in the proceeding chapter,
which discusses the methodology of the study.

95
CHAPTER 3
METHODOLOGY
Research Questions
This descriptive, non-experimental study examines the relationships between school
library media programs and student achievement in California’s comprehensive public schools.
Several data sources were used to examine the relationship between student achievement and
school library programs. This relationship was explored through the following research
questions:
1. How does student achievement vary, if at all, in relationship to the levels of
certificated staffing in school library media programs?
2. How does student achievement vary, if at all, in relationship to the levels of
combined certificated and clerical staffing in school library media programs?
3. How does student achievement vary, if at all, in relationship to library staff
services offered, either independently or in combination?
4. How does student achievement vary, if at all, in relationship to other library
program elements?
5. How does student achievement vary, if at all, in relationship to a combination of
library program elements?
6. If student achievement significantly correlates with school library staff services,
how does the level of these services vary, if at all, in relationship to certificated
library staffing levels?

96
7. If student achievement significantly correlates with school library staff services,
how does the level of these services vary, if at all, in relationship to overall library
staffing levels?
Null Hypotheses
The following null hypotheses were formulated from the research questions:
H01: Student achievement does not vary in relationship to the levels of certificated
staffing in school library media programs.
H02: Student achievement does not vary in relationship to the levels of combined
certificated and clerical staffing in school library media programs.
H03: Student achievement does not vary in relationship to library staff services offered,
either independently or in combination.
H04: Student achievement does not vary in relationship to other library program
elements.
H05: Student achievement does not vary in relationship to any combination of library
staffing levels and other library program elements.
H06: The level of school library services does not vary in relationship to certificated
library staffing levels.
H07: The level of school library services does not vary in relationship to overall library
staffing levels.
Sources of Data
Student achievement—the dependent variable-- was measured by the school level mean
scaled score on the 2006-2007 school year California Standards Tests (CSTs) and included
criterion-referenced tests from grades four, eight and eleven-- grades appearing frequently in
97
other state-wide studies like this one. The English Language Arts test includes a reading
comprehension component but also tests other state standards for this content area and is given at
all three grade levels, so this was a good candidate for use as a dependent variable. At both the
eighth and 11th grades, most students take a social studies test, affording another data analysis
opportunity related to a content area frequently associated with support from school library
programs.
School-level results for these tests are posted on the California Department of Education
(CDE) Website annually and can be downloaded as comma delimited files. These scores are
reported as both mean scale scores and by percentage of students who score at the advanced,
proficient, basic, below basic, and far below basic levels. Cut-points for these levels are held
constant from year to year for each grade level and content area, but the number or percent
correct associated with each scaled score may vary. Using the mean scaled scores from a
criterion-referenced test is a valid method of test analysis (Urbina, 2004) and on the CST,
Standardized Testing and Reporting (STAR) officials say that these scores may be used to
compare results within content area and grade level tests, both within a single year and across
years (STAR Technical Assistance Center, 2006). Mean scaled scores were used for this study,
as the number of students scoring at proficient or above on some tests is less than 30% of the
total testing population (Ed-Data, 2008). Using the mean scaled score as the dependent variable
allowed for a direct and accurate comparison between schools across the entire spectrum of
performance.
The CST tests undergo content reviews by content-area experts at Educational Testing
Service and the CDE, and all test items are subjected to a thorough review by a content-area
Assessment Review Panel. This panel reviews items for accuracy, clarity, bias, and quality, and

98
it also determines if the items are measuring the content standards as appropriate for the testing
population. Reliability analyses on the CSTs consistently yields reliability measures of between
.91 and .95 for the English/language arts and social studies tests, considered highly reliable
(Educational Testing Service, 2007).
The independent variables from school library media programs were taken from the
California Department of Education School Library Survey, administered annually as an online
survey by the state school library consultant, who works within the CDE. All public schools are
required by California Education Code 18122 to respond annually to this survey, although there
are no consequences for failing to respond. The survey includes 19 questions including type of
library, hours the library is open, amount of certificated and clerical staff hours per week,
number of books in the collection, average copyright date of books in a given section,
technologies available in or through the school library, budget for print and non-print collection
development, funding sources, type of scheduling, program services offered, and databases most
frequently used by students. See Appendix A for the complete survey.
According to Barbara Jeffus, California’s School Library Consultant to the CDE, and
John McGinnis, the California School Library Association’s Vice President of Governmental
Relations, the survey was first administered for the 1998-1999 school year and was developed
by the CDE, San Jose State University, and the California School Library Association, using
many of the questions from Brandes’ 1987 California study, which was itself based upon the
U.S. Department of Education’s Center for Statistics national library survey instrument (Brandes,
1987). The new survey instrument added questions based on the research by Miller and Shontz
(1996, 1997, 1998) about indicators for successful school libraries (B. Jeffus & J. McGinnis,
personal communication, November 17, 2007).

99
The purpose of this survey was to collect data about elements of a school library program
in California, to measure school library media program progress, and to create a point of
comparison with national statistics (B. Jeffus & J. McGinnis, personal communication,
November 17, 2007). Jeffus and McGinnis noted that the survey was modified based on input
from the CSLA curriculum committee, the CSLA governing board, David Loertscher from San
Jose State University, and representatives from large California school districts. The second year
of the survey replaced many of the fill-in items with multiple choice responses, which improved
the reliability of the instrument (B. Jeffus & J. McGinnis, personal communication, November
17, 2007). In addition, survey participants were able to identify their county, district and school
codes online, which made it easier to track who had responded and to more easily match this data
set with other data collected by the state, including demographics and test results. Minor changes
have been made to the test since that time based on feedback from survey participants and
consultations with the California School Library Association and library leaders from major
school districts throughout California. In 2005, data collection was taken over by the
Technology Services Division of the CDE; changes to the online interface have made results
more reliable. Data is now collected and validation statistics are run. Outlying data are identified
by the Technology Services Division and verified by the School Library Consultant’s office
where possible; data from schools reporting anomalies that cannot be verified are discarded (B.
Jeffus & J. McGinnis, personal communication, November 17, 2007). See Appendix A for the
survey.
The CDE School Library Survey also reflects the theoretical models offered by
Loertscher (2000) and Todd & Kuhlthau (2004). Figure 4 illustrates the survey’s alignment with

100
the two models, particularly in terms of the types of services regularly offered by a school library
media program.
CDE Library Survey Todd & Kuhlthau (2004) Loertscher (2000)
• Offered a program of curriculum-integrated information literacy instruction
Literacy Development Agent: LMS “engages students in an active and meaningful search process, enabling them to explore, formulate and focus their searches”
Knowledge Construction Agent: LMS “develops information literacy scaffolds for engaging students with information in meaningful ways.”
Information literacy: “As collaborative projects are planned with teachers…attention is given to providing research strategies at the time of need.”
• Informally instructed students in the use of resources
• Helped students and teachers find and use resources outside school library
• Facilitated interlibrary loan for
students and teachers
Resource Agent: “The teacher-librarian provides instructional interventions by guiding students in their information choices through the effective use of these resources.”
Rescue Agent: “The library is opportunistic, responding to the multiple needs that arise from learning.”
Individual reference assistance (Level 3): The LMS “may at times deliver the information directly to the user but will continually work to help patrons gain the skills they need to find and use information themselves”
• Provided reading, listening, and viewing guidance for students
Independent Reading and Personal Development Agent: “The school library plays a role in fostering independent reading.”
Individual reference assistance (level 3) “includes reading, viewing and listening advisory services for students and teachers.”
• Provided instruction on Internet searching and research
• Provided access to online library catalog and circulation
• Provided Internet access for students in the library
• Provided electronic access to a resource sharing network
The library program provides students with “up-to-date software across multiple media. Lessons must go beyond teaching the effective use of software to include technical troubleshooting (disk, printing, Internet access) and problem-solving skills.”
Enhancing Learning Through Technology (level 8): LMS “realizes that networks and computers… (and) other technologies…only provide potential to enhance learning…(The LMS) demonstrates and encourages methods to exploit technology” to enhance teaching and learning.
Figure 4. Alignment of the CDE library survey and theoretical models.
California schools provide data for the Academic Performance Index annually, including
the percentage of minority students, the percentage of students in the Free or Reduced Lunch

101
Program (a poverty indicator), percentage of students participating in migrant education,
percentage of English learners, the average education level of parents, percentage of fully-
credentialed teachers on staff, average class size, and the mobility of students (California
Department of Education, 2006). Data from this source, which is publicly available as a comma-
delimited file download from the CDE Website, was used to control for community and school-
based influences on the dependent variables. Additionally, data from the School Accountability
Report Card (SARC), also available each year as a comma-delimited filed download from the
CDE, was used to determine and control for average teacher salary as an intervening variable.
Among the school level control variables not included in this study was average class
size. Englehart (2007), in a comprehensive review of the literature on class size, concludes that
the disparity of findings from the research makes drawing definitive conclusions about the
effects of class size on student achievement difficult. Englehart suggests that the failure in this
research stems from an inability to account for the interaction effects among the many variables
that accompany class size, including socio-economic status, the size of a school district, the
demographics of individual classes, teacher experience, and many others. Englehart’s assertion
of the inconclusiveness of research in the area is affirmed by several others in recent years who
found either contradictory results or no significant relationship between class size and student
achievement (see Akerhielm, 1995; Borland, Howsen & Trawick, 2005; Davis, 2007; Ready &
Lee, 2006; Ross, 2007).
Another problematic school level control variable is student mobility. Nelson, Simoni &
Adelman (1996) suggested in their three-year study of over 2,500 early elementary students that
students who change schools are lower achieving to begin with. Mobility, in other words, may
not be a cause, but a symptom of low achievement. Alexander, Entwisle & Dauber’s (1996)

102
study affirms this claim. When tracked through five years of elementary school at twenty
Baltimore city public schools, students who had moved had lower test scores, but when
controlling for students’ socio-economic status and prior academic performance, test score
differences were no longer significant at p < .05. Wright’s (1999) study of third and fourth
graders in 33 Midwestern, urban schools concluded that, while mobility significantly correlates
with student achievement, it is confounded with other much stronger predictors—specifically,
ethnicity and poverty level—and that it therefore holds little predictive power. Heinlein and
Shinn (2000) found that most student mobility studies did not control for prior student
achievement. In their own study of 764 New York City sixth-grade students, Heinlein and Shinn
(2000) found that, when controlling for students’ achievement at the third grade, mobility after
the third grade was not related to students’ achievement scores in the sixth grade. There was a
weak, though significant negative relationship between student achievement at the sixth grade
and mobility before the third grade. The authors conclude from their study that early mobility is
more disruptive to achievement than later mobility. The lack of consistent results from the
studies mentioned suggested mobility would not be a reliable control for this study.
Data Collection and Human Subjects Considerations
This study used four sources of data: the California Department of Education School
Library Survey results from 2006-2007; the 2007 CST scores for grades 4, 8 and 11; the
demographic data available through the 2007 Academic Progress Index (API) scores, and school
data from the School Accountability Report Card (SARC). The analysis unit was the California
public school at the elementary, middle and high school levels. The targeted population was
those schools for which a completed survey, the relevant CST mean scaled score, the
demographic data from the API, and the school data from the SARC are available.

103
Data from the California Department of Education School Library Survey is available on
school and county basis. The entire data file is available on request and was received as a
comma-delimited (.csv) file. Data files of the entire battery of STAR test scores are publically
available as either comma-delimited or ASCII downloads from the CDE Website, as are the
demographic data from the API scores and school data from the SARC.
The California School Library Survey data does not include the names or positions of
those who complete the survey, so no identification of individuals is possible. Data files for CST
tests and the API are publically available; test scores are reported with the whole school as the
principle analysis unit. Test scores and demographic data are available by subgroups such as
ethnicity, English language fluency, gender, and other school and community subgroups; to
safeguard students’ identities, no scores are reported among subgroups of fewer than ten
individuals. No individual data is reported.
The Institutional Review Board at the University of North Texas determined that,
consistent with Department of Health and Human Service regulations at 45 CFR 46.101(b), this
research study would be exempt from further review because it constituted “research, involving
the collection or study of existing data, documents, records, pathological specimens, or
diagnostic specimens, if these sources are publicly available, or if the information is recorded by
the investigator in such a manner that subjects cannot be identified, directly or through identifiers
linked to the subjects” (IRB Guidelines, 2007).
Data Analysis
This study used four sources of data: the California Department of Education School
Library Survey from 2006-2007; the CST scores for grades 4, 8 and 11; the demographic data
available through the 2007 API scores, and the school data available through SARC. All four

104
data sources contain school level information identifiable by unique school codes. Data files for
the CST scores were disaggregated first by grade and then by test; these disaggregated data were
then combined with demographic data from the API scores and school data from SARC; these
were then combined with data from the library survey, all matched by school code. The analysis
unit was the California public school at the elementary, middle and high school levels. The
targeted population was those schools for which a completed survey, the relevant CST mean
scaled score, the demographic data from the API, and the school data from SARC was available.
Schools that did not have data from all four sources were eliminated from the study.
This study employed both descriptive and inferential statistics. Bivariate correlation
analysis was used to assess the direction and strength of relationship between pairs of variables
(e.g., staffing levels and library services provided; mean scaled scores on English/Language Arts
tests) and to assist in factor analysis used to combine variables for data reduction. For questions
1-4, bivariate correlations were used to determine the direction and strength of relationship
between the dependent and independent variables. Where significant relationships were found,
both partial correlation and hierarchical multiple regression analysis were used to examine the
relationship between school library media program variables and student achievement when
accounting for community and school variables. Partial correlations are useful because they
provide a correlation between two variables with the influence of a third variable removed
(Hinkle, Wiersma & Jurs, 2003). In this study, partial correlations and multiple regression were
used to account for the following community and school variables: education level of parents,
percent of students eligible for the free and reduced lunch program, ethnicity, percentage of
English learners, average salary of teachers, and percentage of teachers fully credentialed.

105
Prior to multiple regression, factor analysis was used to combine variables within each of
three areas: school library media program elements such as staffing, budget, and services
available; school variables such as average teacher salary, percent of teachers fully credentialed,
and percentage of English language learners; and community variables such as parent education
level and percent of students eligible for free and reduced lunch. In a hierarchical solution,
predictor variables are entered in a series of groups, allowing the researcher to determine if each
new group of variables adds predictive value. The hierarchical model is frequently used to
control for one set of variables while determining the effect of another set of variables on the
dependent variable (Pedhazur, 1982). In this study, school and community variables were
entered in the first step, followed by library variables. Each regression was examined to make
sure assumptions about linearity, normality and multicollinearity were met. Linearity was tested
by examining plots of standardized residuals against standardized estimates of the dependent
variable to see if the pattern was random. In addition, each regression was checked to see that the
standard deviation of the residuals exceeded the standard deviation of the dependent variable
(Hutcheson & Sofroniou, 1999). Normality was tested by inspecting histograms of the residuals
and values of skewness and kurtosis (Hutcheson & Sofroniou, 1999). Multicollinearity was
tested through inspection of tolerance and variance inflation factor (VIF) values (Leech, 2005).
When statistically significant correlations were found between specific library services
and student achievement in either partial correlations or multiple regression, bivariate
correlations were also used to determine the relationship between that particular service and the
level of both certificated and total library staffing .n For the purposes of this study, statistical
significance was set at p <.05. Data was gathered and analyzed using the Statistical Package for
the Social Sciences (SPSS 14.0).

106
Assumptions and Limitations
This study used publically available data from the criterion-referenced CST’s, school and
community information from the state API and SARC reports, and responses to the California
School Library Survey. Although schools are required to submit this survey, there are no
consequences for noncompliance. According to Ed-Data (2008), there were 8,215
comprehensive public schools in California in 2007. Close to 70% of these schools reported data
from all four sources. This constitutes a sample size large enough—and diverse enough-- to
counteract sample bias created by the self-selection of participants. Additionally, respondents to
the survey do not identify themselves or their job titles. This study acknowledges that there may
be some discrepancy in answers according to the positions of the people actually responding to
the survey and the data available to them in providing their answers.
This study was conducted with the assumption, too, that the standardized tests to be used
do, in fact, constitute some valid measure of student achievement. The criterion-referenced tests
used in this study—English Language Arts and social studies-- assess mastery of specific
standards in content areas that are commonly associated with library use at each grade level. It is
also acknowledged, nevertheless, that such assessments describe a very narrow band of student
achievement and so provide a similarly narrow view of the relationship between student
achievement and school library media programs.

107
CHAPTER 4
RESULTS
Purpose
The purpose of this descriptive, non-experimental study was to examine the relationships
between school library media programs and student achievement in California’s comprehensive
public schools. Student achievement was measured by the school level mean scaled scores on the
California Standards Tests (CST) in English Language Arts at grades 4, 8 and 11; in Social
Studies in grade 8; and in U.S. History in grade 11. Data about school library media programs
was obtained through the California Department of Education School Library Survey, a 19
question survey completed online by a majority of the state’s public schools. Data about
community and school variables, including education level of parents, percent of students
eligible for the free and reduced lunch program, ethnicity, percentage of English learners,
average salary of teachers, and percentage of teachers fully credentialed, were obtained from the
Academic Performance Index and the School Accountability Report Card, for which public
schools are required to submit information annually.
Research questions were considered in the form of null hypotheses as follows:
H01: Student achievement does not vary in relationship to the levels of certificated
staffing in school library media programs.
H02: Student achievement does not vary in relationship to the levels of combined
certificated and clerical staffing in school library media programs.
H03: Student achievement does not vary in relationship to library staff services offered,
either independently or in combination.

108
H04: Student achievement does not vary in relationship to other library program
elements.
H05: Student achievement does not vary in relationship to any combination of library
staffing levels and other library program elements.
H06: The level of school library services does not vary in relationship to certificated
library staffing levels.
H07: The level of school library services does not vary in relationship to overall library
staffing levels.
This chapter reviews the population used for the study, then presents the results of
research questions one through seven by grade level 4, 8 and 11. A summary of results for each
question is provided, followed by a review of the major findings for all seven questions.
Populations
Grade 4
For the school year 2006-2007, there were 5714 public elementary schools in California
(Ed-Data, 2008). Of these, 3,528, or 61.7%, had data from all four sources required for this
study. Nearly all—98.3%-- of the 3,528 schools reported they had a space they called a library
(see Table 16). Just 4.4% of these schools reported having at least 1 full-time library media
specialist; 84.6% reported having no library media specialist staffing at all (see Table 17).
Schools reporting both a full-time library media specialist and full-time clerical staffing
amounted to 1.2%, just 43 schools out of 3528 in the population sample.

109
Table 16
California Elementary School Libraries with Responses to Library Survey Type of Library
Number
Percent
School Library
3469
98.3
Joint Use Library 7 0.2
Use an adjacent library 8 0.2
No library 44 1.2
Total 3528 100.0
Table 17 Certificated Library Staff Hours, Grade 4 Certificated Staffing Level
Number
Percent
No certificated staff
2986
84.6
Less than half-time 206 5.8
Half-time or more, but not full-time 180 5.1
1 FTE 138 3.9
More than 1 FTE 18 0.5
Total 3528 100.0
The mean English Language Arts CST score was 354.44, with a standard deviation of 29.02, n =
3528 in a normal distribution.
Grade 8
There were 1,257 California public middle schools during 2006-2007 (Ed-Data, 2008).
1,197 of these schools, or 95.2%, had data from all four sources used for this study. Of these,

110
6.2% reported having no library at all, while 91.9 % report having a school library (see Table
18). 27.3% report having at least one full-time library media specialist, while 63.2% report
having no library media specialist staffing at all. 8.5% of middle schools report having full-time
staffing for both LMS and clerical positions (see Table 19).
Table 18 California Middle School Libraries with Responses to Library Survey Type of Library
Number
Percent
School Library
1100
91.9 Joint Use Library 6 0.5 Use an adjacent library 17 1.4 No library 74 6.2 Total 1197 100.0

111
Table 19 Certificated Library Staff Hours, Grade 8 Certificated Staffing Level
Number
Percent
No certificated staff
757
63.2
Less than half-time 49 4.1
Half-time or more, but not full-time 64 5.3
1 FTE 280 23.4
More than 1 FTE 47 3.9
Total 1197 100.0
The mean English Language Arts CST score was 341.01, with a standard deviation of 28.27, n =
1,197; the mean Social Studies CST score was 330.56, with a standard deviation of 30.49, n = 1,
195, both scores normally distributed.
Grade 11
There were 1,182 California comprehensive public high schools during the 2006-2007
school year (Ed-Data, 2008). 987 had data from the four required sources for this study, with
slightly fewer—965—with data available for U.S. history CST scores. 19.6% of high schools in
the sample had no library at all, while 76.1% had a school library (see Table 20). At this level,
44.1% reported having no LMS staffing at all, with 47.8% reporting having at least one full-time
LMS (see table 21). In addition, 30.3% of high schools in the sample reported having full-time
support of both LMS and clerical staff.

112
Table 20 California High School Libraries Responding to Library Survey Type of Library
Number
Percent
School Library
751
76.1
Joint Use Library 9 0.9
Use an adjacent library 34 3.4
No library 193 19.6
Total 965 100.0
Table 21 Certificated Library Staff Hours, Grade 11 Certificated Staffing Level
Number
Percent
No certificated staff
435
44.1
Less than half-time 34 3.4
Half-time or more, but not full-time 46 4.7
1 FTE 402 40.7
More than 1 FTE 70 7.1
Total 987 100.0
The mean English Language Arts CST score was 316.60, with a standard deviation of 37.41, n =
987; the mean U.S. History CST score was 320.02, with a standard deviation of 31.57, n = 965,
both scores normally distributed.

113
H01: Student Achievement and Certificated Staffing
The first research questioned examined was, “How does student achievement vary, if at
all, in relationship to the levels of certificated staffing in school library media programs?” The
null hypothesis H01 is that student achievement does not vary in relationship to the levels of
certificated staffing in school library media programs.
Grade 4
At the fourth grade level, there was a statistically significant but weak positive correlation
between certificated staffing levels and English Language Arts CST scores at r = .06 and p
<.001. When community and school independent variables were used as controls in partial
correlations, the strength of this association did not vary greatly; controlling for ethnicity
produced the strongest association at r = .11, p < .001, while the relationship when controlling
for parent education level was not statistically significant. See Table 22 for a summary of
results.
Table 22 Partial Correlation, Certificated Staff Hours, English Language Arts CST Scores, and School and Community Variables, Grade 4 Control
r
Parent Education Level
.02
Free and Reduced Lunch .10**
Ethnicity .11**
Percentage English Learners .09**
Avg. Teacher Salary .04*
Percentage Fully Credentialed Teachers .06** *p <.05, **p <.001.

114
Grade 8
At the eighth grade level, the relationship between certificated staffing and English
Language Arts scores was not statistically significant (r =.00, p=.99). As seen in Table 23, a
positive significant relationship was shown when controlling for free and reduced lunch at r =
.10, p < .001, and for ethnicity, r = .16, p < .001. The relationship between ELA scores and
certificated staffing was not significant when controlling for the other four school and
community variables.
Table 23 Partial Correlation, Certificated Staff Hours, English Language Arts CST Scores, and School and Community Variables, Grade 8 Control
r
Parent Education Level
.01
Free and Reduced Lunch .10**
Ethnicity .16**
Percentage English Learners .04
Avg. Teacher Salary -.04
Percentage Fully Credentialed Teachers .01 **p <.001
There was, however, a weak but significant positive relationship between certificated
staffing and social studies CST scores at the middle school level, with r = .07, p =.001. When
controlling for school and community variables, the association strengthened in every case
except for average teacher salary, which was not statistically significant. Controlling for ethnicity

115
again produced the strongest association at r = .22, followed by controlling for free and reduced
lunch at r = .20. In both cases, p < .001. See Table 24 for a summary of these results.
Table 24 Partial Correlation, Certificated Staff Hours, Social Studies CST Scores, and School and Community Variables, Grade 8 Control
r
Parent Education Level
.09**
Free and Reduced Lunch .20**
Ethnicity .22**
Percentage English Learners .12**
Avg. Teacher Salary .03
Percentage Fully Credentialed Teachers .08**
**p <.001
Grade 11
At the high school level, all bivariate correlations and partial correlations were significant
between LMS staffing and test scores. The relationship between certificated staffing and ELA
scores was significant at r = .44, p < .001. When controlling for school and community
variables in separate partial correlations, the relationship between English Language Arts scores
and LMS staffing did not substantially change. Average teacher salary weakened the relationship
slightly to r = .41, p < .001; in all other cases, the control variable strengthened the relationship.
See Table 25 for a summary of these results.

116
Table 25 Partial Correlation, Certificated Staff Hours, English Language Arts CST Scores, and School and Community Variables, Grade 11
Control
r
Parent Education Level
.46**
Free and Reduced Lunch .48**
Ethnicity .52**
Percentage English Learners .51**
Avg. Teacher Salary .41**
Percentage Fully Credentialed Teachers .45** **p <.001
The relationship between LMS staffing and U.S. history CST scores was similar, at r =
.45, p <.001. Controlling for school and community variables generally strengthened the
relationship, average teacher salary at r = .41 and parent education level at r = .44 being the
exceptions. In each case, the value of p was less than .001. See Table 26 for results.
Table 26
Partial Correlation, Certificated Staff Hours, U.S. History CST Scores, and School and Community Variables, Grade 11
Control
r
Parent Education Level
.44**
Free and Reduced Lunch .48**
Ethnicity .52**
Percentage English Learners .51**
Avg. Teacher Salary .41**
Percentage Fully Credentialed Teachers .46** **p <.001

117
Summary and Discussion for Research Question 1
In all but one case, there was a statistically significant correlation between CST scores
and certificated LMS staffing (See Table 27). Partial correlations between CST scores and LMS
staffing using school and community variables as controls generally strengthened or did not
change those relationships. These positive correlations are consistent with results of prior studies
in Illinois (Lance, Hamilton-Pennell & Rodney, 2005), Florida (Baumbach, 2003), Iowa
(Rodney, Lance & Hamilton-Pennell, 2002), Michigan (Rodney, Lance & Hamilton-Pennell,
2003), Alaska (Lance et al., 1999), North Carolina (Burgin, Bracy & Brown, 2003), Ontario
(Ontario Library Association, 2006), Minnesota (Baxter & Smalley, 2003), and Wisconsin
(Smith, 2006). While the correlations are weak at both the elementary and middle school, the
bivariate and partial correlations found at the high school level were stronger than those in any of
the other studies mentioned here. These findings also support the models of school library
programs proposed by Loertscher (2000) and Todd & Kuhlthau (2004), which emphasize the
presence of certificated library staff in support of school-wide student achievement.
The null hypothesis that student achievement does not vary in relationship to the levels of
certificated staffing in school library media programs is rejected.
Table 27
Summary of Bivariate Correlations, CST Scores and LMS Staffing
Grade
Test
r
4
English Language Arts
.06**
8
English Language Arts
.00
8
Social Studies
.07 *
11
English Language Arts
.44**
11
U.S. History
.45** *p <.05, **p <.001
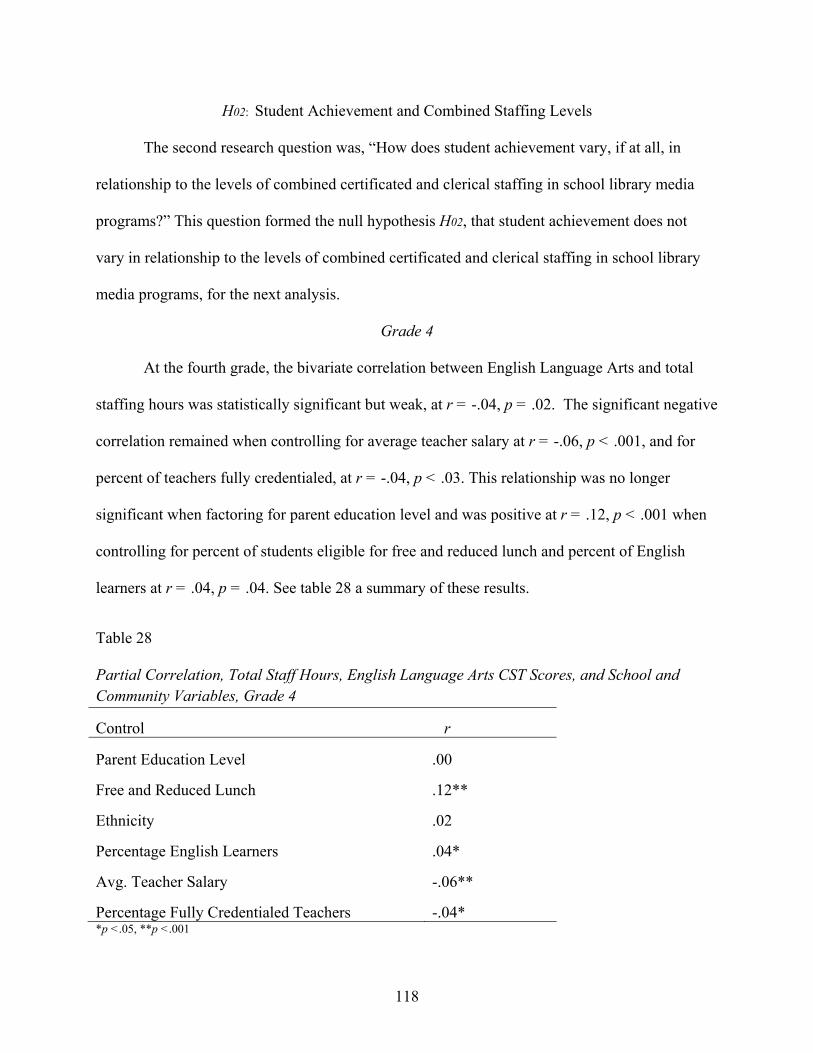
118
H02: Student Achievement and Combined Staffing Levels
The second research question was, “How does student achievement vary, if at all, in
relationship to the levels of combined certificated and clerical staffing in school library media
programs?” This question formed the null hypothesis H02, that student achievement does not
vary in relationship to the levels of combined certificated and clerical staffing in school library
media programs, for the next analysis.
Grade 4
At the fourth grade, the bivariate correlation between English Language Arts and total
staffing hours was statistically significant but weak, at r = -.04, p = .02. The significant negative
correlation remained when controlling for average teacher salary at r = -.06, p < .001, and for
percent of teachers fully credentialed, at r = -.04, p < .03. This relationship was no longer
significant when factoring for parent education level and was positive at r = .12, p < .001 when
controlling for percent of students eligible for free and reduced lunch and percent of English
learners at r = .04, p = .04. See table 28 a summary of these results.
Table 28 Partial Correlation, Total Staff Hours, English Language Arts CST Scores, and School and Community Variables, Grade 4
Control
r Parent Education Level
.00
Free and Reduced Lunch
.12**
Ethnicity
.02
Percentage English Learners
.04*
Avg. Teacher Salary
-.06**
Percentage Fully Credentialed Teachers
-.04*
*p <.05, **p <.001

119
Grade 8
At the eighth grade level, the relationship between English Language Arts CST scores
and total staffing was significant at r = .12, p < .001. This relationship remained significant in
partial correlations with all school and community variables used as controls. The relationship
was strongest when controlling for ethnicity at r = .22, p < .001. Table 29 summarizes the
results.
Table 29
Partial Correlation, Total Staff Hours, English Language Arts CST Scores, and School and Community Variables, Grade 8 Control
r
Parent Education Level
.09**
Free and Reduced Lunch .18**
Ethnicity .22**
Percentage English Learners .19**
Avg. Teacher Salary .07*
Percentage Fully Credentialed Teachers .09** *p <.05, **p <.001
Correlations between social studies CST scores and total staffing hours at the eighth
grade level were significant at r = .19, p < .001. This positive relationship persisted in all partial
correlations using school and community variables. All of the community variables strengthened
the relationship, the strongest of these being ethnicity, at r = .28, p <.001. Both average teacher
salary and percent fully credentialed teachers weakened the relationship, the weakest being
average teacher salary at r = .12, p < .001. See table 30 for a summary of results.

120
Table 30 Partial Correlation, Total Staff Hours, Social Studies CST Scores, and School and Community Variables, Grade 8 Control
r
Parent Education Level
.17**
Free and Reduced Lunch .26**
Ethnicity .28**
Percentage English Learners .26**
Avg. Teacher Salary .12**
Percentage Fully Credentialed Teachers .06** **p <.001
Grade 11
At the eleventh grade level, the bivariate correlation of English Language Arts and total
staffing hours yielded r = .54, with p <.001. As seen in Table 31, the strength of that correlation
remained generally the same in partial correlations with school and community control variables,
with a range of r = .49, p < .001, for average teacher salary to r = .59, p < .001, for English
learners as the control.

121
Table 31
Partial Correlation, Total Staff Hours, English Language Arts CST Scores, and School and Community Variables, Grade 11 Control
r
Parent Education Level
.53**
Free and Reduced Lunch .53**
Ethnicity .57**
Percentage English Learners .59**
Avg. Teacher Salary .49**
Percentage Fully Credentialed Teachers .54** **p <.001
The correlation between eleventh grade U.S. History CST scores and total staffing hours
was similarly strong at r = .56, p <.001, and the relationship followed a similar pattern when
controlling for school and community variables in partial correlations, which ranged from r = .52
when controlling for average teacher salary to r = .60 when controlling for percentage of English
learners, both at p <.001. See table 32 for results.
Table 32
Partial Correlation, Total Staff Hours, U.S. History CST Scores, and School and Community Variables, Grade 11 Control
r
Parent Education Level
.56**
Free and Reduced Lunch .56**
Ethnicity .59**
Percentage English Learners .60**
Avg. Teacher Salary .52**
Percentage Fully Credentialed Teachers .57**

122
**p <.001
Summary and Discussion for Research Question 2
Overall results indicate a positive significant relationship between total staffing levels
and student achievement, indicating a rejection of the null hypothesis. At the fourth grade level,
there was a significant negative correlation between English Language Arts CST scores and total
staffing, r =-.04, p =.02, but the significance of the correlation disappeared or the direction of
the relationship became positive in partial correlations controlling for community variables, the
strongest positive value being r =.12, p <.001, when controlling for parent education. All of
these correlations were very weak and would not alone lead to a rejection of the null hypothesis
that student achievement does not vary in relationship to total library staffing levels.
At the eighth grade level, though, bivariate correlations between total library staffing and
both English Language Arts and social studies CST scores were significant at r =.12, p <.001
and r =.19, p <.001 respectively. The strength of these relationships tended to increase with
partial correlations controlling for school and community variables. The strongest partial
correlations for both English Language Arts and social studies controlled for ethnicity, at r = .22,
p <.001 and r = .28, p <.001 respectively.
At the eleventh grade, bivariate correlations between total library staffing levels and CST
scores were again stronger than at middle or elementary levels at r = .54, p <.001 for English
Language Arts CST scores and r = .56, p <.001 for U.S. History scores. The strength of those
associations remained in partial correlations with school and community variables. For English
Language Arts, those correlations ranged from r =.49, p <.001 when controlling for average
teacher salary to r = .59, p <.001 when controlling for percentage of English learners. For U.S.
History, those partial correlations ranged from r =.52, p <.001 when controlling for average

123
teacher salary to r =.60, p <.001 when controlling for percentage of English learners. A
summary of the bivariate correlations from all three levels can be seen in Table 33.
Table 33
Bivariate Correlations, LMS Staffing and Total Staffing, Grades 4, 8 and 11 Grade
CST Test
LMS Staffing
Total Staffing
4
English Language Arts
.06**
-.04*
8 English Language Arts .00 .12**
8 Social Studies .07* .19**
11 English Language Arts .44** .54**
11 U.S. History .45** .56** *p <.05, **p <.001.
Consistent with results from question 1, the strength of correlations tended to increase
with grade level. Additionally, a comparison of correlations indicated at the middle and high
school level that total staffing accounted for more of the variance in scores than did certificated
staffing alone. Results from this question are supported by previous studies linking total staffing
to higher test scores, including studies from Illinois (Lance et al., 2005), Florida (Baumbach ,
2003), Michigan (Rodney et al., 2003), New Mexico. (Lance, Rodney & Hamilton-Pennell,
2002), North Carolina (Burgin et al., 2003), Pennsylvania (Lance et al., 2000b), and Wisconsin
(Smith, 2006).
The similarities between English Language Arts and social studies CST score
correlations with staffing levels at the eighth grade, and English Language Arts and U.S. History
CST scores and staffing levels at the eleventh grade are also consistent with previous studies
showing positive correlations between library staffing and measures of student achievement
124
other than reading scores (see Greve, 1977; Hall-Ellis & Berry, 1995; Jenkins, 2000; Mancall,
1985; Martin, 1996).
This finding also supports the research (Loertscher, Ho & Bowie, 1987) and theoretical
model proposed by Loertscher (2000), which indicate that for a school library program to have a
significant impact on student achievement, adequate levels of both clerical and certificated staff
are essential (see also Beaird, 1999; Callison, 2004; Didier, 1984; Farwell, 1998; Gaver, 1962;
Lance et al., 1999; Lance, Rodney & Hamilton-Pennell, 2000b, 2002; Lance, Welborn &
Hamilton-Pennell, 1993; Loertscher & Land, 1975; McCracken, 2001; Underwood, 2004).
Results from this study indicate that as certificated library staff increases, test scores tend to
increase. But in the absence of clerical support, certificated staff is left to run the warehouse
functions of the library and has little or no time to collaborate with teachers on lessons and
activities that raise achievement. This study also indicates that at the middle school and high
school level, as total library staffing increased, test scores tended to increase.
H03: Student Achievement and Library Staff Services Offered
The third research question, “How does student achievement vary, if at all, in relationship to
library staff services offered, either independently or in combination?” formed the null
hypothesis H03: Student achievement does not vary in relationship to library staff services
offered, either independently or in combination.
In the California Department of Education school library survey, two multi-part questions
assess staff services. Question 18 asks, “Which of the following services and/or programs were
regularly provided in the 2006-2007 school year?” Twenty-one services are described, as listed
in Figure 5.

125
Question #18: Which of the following services and/or programs were regularly provided in the 2006-2007 school year?
(A) Offered a program of curriculum-integrated information literacy instruction. (B) Informally instructed students in the use of resources. (C) Planned or conducted workshops for teachers. (D) Assisted school curriculum committee with recommendations. (E) Collaborated with teachers to develop, implement, and evaluate student learning two or
more hours per week. (F) Provided teachers with information about new resources. (G) Provided reference assistance to students and teachers. (H) Helped students and teachers find and use resources outside school library. (I) Facilitated interlibrary loan for students and teachers. (J) Provided reading, listening, and viewing guidance for students. (K) Helped parents realize importance of lifelong learning. (L) Coordinated in-school production of materials. (M) Coordinated video production and dissemination activities. (N) Coordinated cable TV, distance education, and related activities. (O) Coordinated school or library computer networks. (P) Provided access to online library catalog and circulation. (Q) Provided Internet access for students in the library. (R) Provided instruction on Internet searching and research. (S) Provided electronic access to a resource sharing network. (T) Communicated proactively with principal. (U) Attended meetings of school site council, two or more times per school year. (V) None of the above.
Figure 5. California Department of Education school library question #18. Used with
permission.
Results to this question were re-coded into separate variables; when the service was regularly
provided, the appropriate variable would be coded “1;” when the service was not indicated, it
would be coded with a “0.” An additional variable, “total services,” added together all the
“service” variable scores, A through U in Figure 5, to provide a total number of services
regularly provided.

126
Grade 4
At the fourth grade level, there were significant positive correlations between English
Language Arts CST scores and fourteen library staff services. The two strongest associations
were with choice B, “Informally instructed students in the use of resources,” at r = .16 (p < .001)
and choice T, “Communicated proactively with principal” at r = .15, p < .001. Total services
correlated with the English Language Arts CST scores at r = .14, p < .001. Table 34 lists all
results. Of the fourteen with significant correlations, seven remained significant in partial
correlations with all school and community variables used as controls:
• Offered a program of curriculum-integrated information literacy instruction
• Informally instructed students in the use of resources
• Provided teachers with information about new resources
• Provided reference assistance to students and teachers
• Helped students and teachers find and use resources outside school library
• Helped parents realize importance of lifelong learning
• Communicated proactively with principal
In addition, total services remained significant in partial correlations controlling for each of the
school and community variables, as shown in Table 35.

127
Table 34 Bivariate Correlation, English Language Arts CST and Library Services, Grade 4
Library Service
r
Offered a program of curriculum-integrated information literacy instruction .12**
Informally instructed students in the use of resources .16**
Planned or conducted workshops for teachers .01
Assisted school curriculum committee with recommendations .00
Collaborated with teachers to develop, implement, and evaluate student learning two or more hours per week
.00
Provided teachers with information about new resources .09**
Provided reference assistance to students and teachers .11**
Helped students and teachers find and use resources outside school library .05**
Facilitated interlibrary loan for students and teachers .07**
Provided reading, listening, and viewing guidance for students .09**
Helped parents realize importance of lifelong learning .10**
Coordinated in-school production of materials -.03
Coordinated video production and dissemination activities -.03
Coordinated cable TV, distance education, and related activities -.01
Coordinated school or library computer networks .05**
Provided access to online library catalog and circulation .14**
Provided Internet access for students in the library .08**
Provided instruction on Internet searching and research .06**
Provided electronic access to a resource sharing network .02
Communicated proactively with principal .15**
Attended meetings of school site council, two or more times per school year .07**
Total Services .14** **p <.001

128
Table 35
Partial Correlation, Total Library Services, English Language Arts CST Scores, and School and Community Variables, Grade 4 Control
r
Parent Education Level
.08**
Free and Reduced Lunch .13**
Ethnicity .10**
Percentage English Learners .13**
Avg. Teacher Salary .12**
Percentage Fully Credentialed Teachers .13** **p <.001
Grade 8
At the eighth grade level, there were also fourteen services that were significantly related
to English Language Arts CST scores, with the three strongest being “Communicated proactively
with principal” , “Offered a program of curriculum-integrated information literacy instruction,”
and Total services, all at r = .19, p <.001 (see Table 36).

129
Table 36
Bivariate Correlation, English Language Arts CST and Library Services, Grade 8 Library Service
r
Offered a program of curriculum-integrated information literacy instruction .09**
Informally instructed students in the use of resources .19**
Planned or conducted workshops for teachers .00
Assisted school curriculum committee with recommendations .02
Collaborated with teachers to develop, implement, and evaluate student learning
two or more hours per week
.04
Provided teachers with information about new resources .18**
Provided reference assistance to students and teachers .19**
Helped students and teachers find and use resources outside school library .11**
Facilitated interlibrary loan for students and teachers .14**
Provided reading, listening, and viewing guidance for students .12**
Helped parents realize importance of lifelong learning .11**
Coordinated in-school production of materials .04
Coordinated video production and dissemination activities .03
Coordinated cable TV, distance education, and related activities .01
Coordinated school or library computer networks .10**
Provided access to online library catalog and circulation .16**
Provided Internet access for students in the library .18**
Provided instruction on Internet searching and research .13**
Provided electronic access to a resource sharing network .06*
Communicated proactively with principal .19**
Attended meetings of school site council, two or more times per school year .05
Total Services .19** *p <.05, **p <.001.

130
Of the fourteen services that significantly correlated with English Language Arts CST
scores, just one, “Provided electronic access to a resource sharing network,” did not remain
significant in relation to those scores when factoring for school and community variables in
partial correlations. Total services also remained statistically significant in each partial
correlation, strengthened by some controls and weakened by others, as indicated in Table 37.
Table 37
Partial Correlation, Total Library Services, English Language Arts CST Scores, and School and Community Variables, Grade 8 Control
r
Parent Education Level
.14**
Free and Reduced Lunch
.21**
Ethnicity
.23**
Percentage English Learners
.21**
Avg. Teacher Salary
.15**
Percentage Fully Credentialed Teachers
.15** **p <.001
When correlated with eighth grade social studies CST scores, sixteen of the library
services were statistically significant, and total services were significant at r = .24, p < .001.
Among these sixteen, all but two remained statistically significant in partial correlations with all
community and school control variables, and those two lost significance only when controlling
for average teacher salary. In this partial correlation, “Collaborated with teachers to develop,
implement, and evaluate student learning two or more hours per week” correlated at r = .05, p =
.120, and “Attended meetings of school site council, two or more times per school year”
correlated at r = .05, p = .075. See table 38 for bivariate correlations for all services.

131
Table 38
Partial Correlation, Total Library Services, Social Studies CST Scores, and School and Community Variables, Grade 8 Library Service
r
Offered a program of curriculum-integrated information literacy instruction .14**
Informally instructed students in the use of resources .22**
Planned or conducted workshops for teachers .04
Assisted school curriculum committee with recommendations .05
Collaborated with teachers to develop, implement, and evaluate student learning two or more hours per week
.08**
Provided teachers with information about new resources .21**
Provided reference assistance to students and teachers .22**
Helped students and teachers find and use resources outside school library .14**
Facilitated interlibrary loan for students and teachers .15**
Provided reading, listening, and viewing guidance for students .14**
Helped parents realize importance of lifelong learning .14**
Coordinated in-school production of materials .07
Coordinated video production and dissemination activities .05
Coordinated cable TV, distance education, and related activities .020
Coordinated school or library computer networks .14**
Provided access to online library catalog and circulation .20**
Provided Internet access for students in the library .22**
Provided instruction on Internet searching and research .17**
Provided electronic access to a resource sharing network .10**
Communicated proactively with principal .21**
Attended meetings of school site council, two or more times per school year .07**
Total Services .24** **p <.001

132
Total services remained statistically significant when controlling for each of the school
and community variables in partial correlations, too. These correlations ranged in strength from r
= .20, p <.001, when controlling for average teacher salary, to r = .28, p < .001, when
controlling for ethnicity. See Table 39 for complete results.
Table 39
Partial Correlation, Total Library Services, Social Studies CST Scores, and School and Community Variables, Grade 8 Control
r
Parent Education Level
.21**
Free and Reduced Lunch
.27**
Ethnicity
.28**
Percentage English Learners
.27**
Avg. Teacher Salary
.20**
Percentage Fully Credentialed Teachers
.21** **p <.001
Grade 11
In bivariate correlations between English Language Arts CST scores and each library
service, there was statistically positive relationship with each service except “Coordinated cable
TV, distance education, and related activities,” at r = .05, p = .14. As was the case for research
questions one and two, the strength of these bivariate relationships was greatest at the high
school level. Total services correlated most strongly at r =.49, p <.001, followed by “Provided
teachers with information about new resources” at r = .48, p < .001, and “Informally instructed
students in the use of resources,” at r = .47, p < .001. In partial correlations using each
community and school variable as a control, only “Coordinated video production and
dissemination activities” did not retain statistical significance in relationship to English
Language Arts CST scores. See Table 40 for a summary of bivariate correlation results.

133
Table 40
Bivariate Correlation, English Language Arts CST and Library Services, Grade 11 Library Service
r
Offered a program of curriculum-integrated information literacy instruction
.38**
Informally instructed students in the use of resources .47**
Planned or conducted workshops for teachers .22**
Assisted school curriculum committee with recommendations .23**
Collaborated with teachers to develop, implement, and evaluate student learning two or more hours per week
.28**
Provided teachers with information about new resources .48**
Provided reference assistance to students and teachers .47**
Helped students and teachers find and use resources outside school library .41**
Facilitated interlibrary loan for students and teachers .17**
Provided reading, listening, and viewing guidance for students .34**
Helped parents realize importance of lifelong learning .20**
Coordinated in-school production of materials .16**
Coordinated video production and dissemination activities .07*
Coordinated cable TV, distance education, and related activities .05
Coordinated school or library computer networks
.27** Provided access to online library catalog and circulation .45**
Provided Internet access for students in the library .46**
Provided instruction on Internet searching and research .43**
Provided electronic access to a resource sharing network .30**
Communicated proactively with principal .44**
Attended meetings of school site council, two or more times per school year .31**
Total Services .49** *p <.05, **p <.001
Total services remained statistically significant in all partial correlations using school and
community controls as well; as seen in Table 41, these correlations ranged from r = .45 when
controlling for average teacher salary to .53 when controlling for the percent of English learners.

134
Table 41
Partial Correlation, Total Library Services, English Language Arts CST Scores, and School and Community Variables, Grade 11 Control
r
Parent Education Level
.48**
Free and Reduced Lunch .48**
Ethnicity .51**
Percentage English Learners .53**
Avg. Teacher Salary .45**
Percentage Fully Credentialed Teachers .49** **p <.001
Bivariate correlations between U.S. History CST scores and library services produced
similar results when compared to the correlations between English Language Arts CST scores
and library services. As shown in Table 42, of the 21 library service variables, only “Coordinated
cable TV, distance education, and related activities,” at r = .04, p = .254, was not statistically
significant. And as with the previous results, only “Coordinated video production and
dissemination activities” did not remain statistically significant in partial correlations with each
of the school and community variables.

135
Table 42
Bivariate Correlation, U.S. History CST Scores and Library Services, Grade 11 Library Service
r
Offered a program of curriculum-integrated information literacy instruction
.39**
Informally instructed students in the use of resources .47**
Planned or conducted workshops for teachers .22**
Assisted school curriculum committee with recommendations .25**
Collaborated with teachers to develop, implement, and evaluate student learning two or more hours per week
.29**
Provided teachers with information about new resources .49**
Provided reference assistance to students and teachers .47**
Helped students and teachers find and use resources outside school library .41**
Facilitated interlibrary loan for students and teachers .20**
Provided reading, listening, and viewing guidance for students .35**
Helped parents realize importance of lifelong learning .22**
Coordinated in-school production of materials .17**
Coordinated video production and dissemination activities .08*
Coordinated cable TV, distance education, and related activities .04
Coordinated school or library computer networks .28**
Provided access to online library catalog and circulation .46**
Provided Internet access for students in the library .47**
Provided instruction on Internet searching and research .44**
Provided electronic access to a resource sharing network .29** Communicated proactively with principal .45**
Attended meetings of school site council, two or more times per school year .31**
Total Services .51**
*p <.05, **p <.001.
Partial correlations between total services and U.S. History CST scores remained
significant when controlling for each school and community variable, ranging in strength from r

136
= .46, p < .001, controlling for average teacher salary and r = .53, p < .001 when controlling for
percentage of English learners. See Table 43.
Table 43
Partial Correlation, Total Library Services, U.S. History CST Scores, and School and Community Variables, Grade 11
Control
r Parent Education Level
.50**
Free and Reduced Lunch .50**
Ethnicity .52**
Percentage English Learners .53**
Avg. Teacher Salary .46**
Percentage Fully Credentialed Teachers .51** **p <.001
Summary and Discussion of Response to Research Question 3
Total library services were significantly related to student achievement at each level in all
bivariate and partial correlations, and the strength of those correlations increased with grade
level. At the fourth grade level, there were significant positive correlations between English
Language Arts CST scores and 14 library staff services. The two strongest associations were
with informally instructing students in the use of resources, at r = .16 (p < .001), and
communicating proactively with principal, at r = .15, p < .001. Total services correlated with
the English Language Arts CST scores at r = .14, p < .001.
Of the 14 with significant correlations, seven remained significant in partial correlations
with all school and community variables used as controls; the strongest of these were offering a
program of curriculum-integrated information literacy instruction, at r =.18, p <.001 and
providing reference assistance to students and teachers, at r =.17, p <.001, both controlling for

137
the percent of teachers fully credentialed. Total library services correlated significantly bivariate
correlation with English Language Arts scores at r =.14, p <.001, and with partial correlations
when controlling for each of the school and community variables. The strength of these scores
ranged from r =.08, p <.001, when controlling for parent education level to r =.13, p <.001
when controlling for free and reduced lunch.
Again, the correlations between library services and student achievement were stronger at
the middle school than at the elementary school level. At the eighth grade level, there were also
fourteen services that were significantly related to English Language Arts CST scores, with the
three strongest being communicating proactively with principal , offering a program of
curriculum-integrated information literacy instruction, and total services, all at r = .19, p <.001.
Just one of the fourteen services did not remain significant in relationship to English Language
Arts CST scores when controlling for school and community variables in partial correlations.
Total services remained significant in all partial correlations, the strongest when controlling for
ethnicity at r =.23, p <.001.
Slightly stronger bivariate correlations between social studies CST scores and library
services were seen, the strongest being total services at r =.24, p <.001, and informally
instructing students in the use of resources and providing reference assistance to students and
teachers, both at r =.22, p <.001. All but two of sixteen services remained statistically
significant in partial correlations with each school and community variable as a control, and
library services remained significant in these partial correlations with r values ranging from .20
to .28, p <.001.
At the high school level, in 21 of 22 categories there was a statistically significant
relationship between library services and student achievement. The relationship between

138
English Language Arts CST scores and library services was very similar in strength to that of
U.S. History CST scores, which will be summarized here. The strongest bivariate correlations
included total services at r =.51, p <.001, providing teachers with information about new
resources, r = .49, p <.001, and informally instructed students in the use of resources, r = .47, p
<.001. Partial correlations between total services and U.S. History CST scores remained
significant when controlling for each school and community variable, ranging in strength from r
= .46, p < .001, controlling for average teacher salary and r = .53, p < .001 when controlling for
percentage of English learners.
The null hypothesis that student achievement does not vary in relationship to library staff
services offered, either independently or in combination, was rejected.
In Loertscher’s (2000) model, the activities that the school librarian engages in related to
collaboration, reading, information literacy, and enhancing learning through technology are
instrumental in the library program’s contribution to student achievement. At the high school
level, where nearly half the schools have a full-time, certificated librarian, the correlations
between student achievement and these activities ranged from r =.22 to r =.49. See Appendix C
for a summary of the correlations between school library elements from Loertscher’s model and
11th grade student achievement scores.
Todd and Kuhlthau’s (2004) model identifies these roles in terms of “dynamic agents of
learning, ” and include resource agent, information literacy agent, knowledge construction
agent, academic achievement agent, independent reading and personal development agent,
technological agent, rescue agent, and individualized learning agent. Todd and Kuhlthau’s
model suggests that activities lower in Loertscher’s taxonomy also critically contribute to student
achievement, and this study supports that assertion. The correlations between activities

139
connected to Todd and Kuhlthau’s model and student achievement at the high school level range
from r = .20 p <.001 to r = .49, p <.001. See Appendix D for a summary of correlations
between elements of Todd and Kuhlthau’s model and 11th grade student achievement scores.
With Loertscher’s (2000) and Todd and Kuhlthau’s (2004) models in mind, the entire
range of services the school library program provides contributes to student achievement. At the
high school level, the correlation between student achievement and total services was r =.51, p
<.001. Although correlations with other services were weak at both elementary and middle
school, the total services correlation for elementary was r = .14 p <.0, and r = .24, p <.001 at
the middle school level. Although correlations do not indicate causality, the evidence is
consistent with the assertion that the instructional role of the school librarian contributes to
student achievement and lends support to a host of prior research (see Baughman, 2000;
Callison, 2004; Gehlkin, 1994; Didier, 1984; Haycock, 1992; Marchant, Broadway, Robinson &
Shields., 1984; Lance, Rodney & Hamilton-Pennell, 2000a, 2000b, 2002; Lance et al., 2005
Smith, 2006;).
H04: Student Achievement and Other Library Program Elements.
The fourth research question states, “How does student achievement vary, if at all, in
relationship to other library program elements?” The null hypothesis H04 was derived from this
question as follows: student achievement does not vary in relationship to other library program
elements.
Remaining library program elements for which there was data from the library survey
included hours open, collection size, budget, and technology available in the library. Data for
technology available in the library was taken from question 11 on the library survey (see
Appendix A), which asks, “Check one or more of the following technologies available in or

140
through the school library.” Twelve technologies were listed as choices, including online
databases, library Web pages, Internet access, automated catalog and circulation, DVD’s, audio
books, video collections, and integrated search tools. The total number of technologies indicated
on the original response was coded into a new category called “total technology,” which was
used as a measure of overall technology in the library.
Grade 4
At the fourth grade, there were significant but weak correlations between English
Language Arts CST scores and all other library program elements, including hours open,
collection size, budget, and total technology. Though weak, the significance persisted when
partial correlations using school and community control variables were calculated. See Table 44.
Table 44
Bivariate and Partial Correlations, Library Program Elements and English Language Arts CST Scores, Grade 4 Control
Hours Open
Collection Size
Budget
Total Technology
None (bivariate correlation)
.08**
.08**
.07**
.11**
Parent education
.09** .05** .04* .04*
Free and reduced lunch
.08** .07** .05** .08**
Ethnicity
.06** .07** .06** .08**
Percent English learners
.11** .13** .08** .09**
Average teacher salary
.05** .04* .06** .09**
Percent teachers fully credentialed
.08** .07** .10** .09**
*p < .05, **p <.001.

141
Grade 8
At the eighth grade level, each library program element was significantly related to
English Language Arts CST scores in bivariate correlations. Significance persisted using each of
the six school and community controls in partial correlations involving both hours open and total
technology. Partial correlations with hours open ranged from r = .11 to r = .25. Partial
correlations with total technology ranged from r = .12 to r = .24. Significance values in each of
these correlations were less than .001. With collection size and budget, bivariate correlations
were significant but very weak (.05 and .06 respectively, p <.001); relationships to English
Language Arts CST scores strengthen in some partial correlations and fell to insignificance with
others. See Table 45 for results.
Table 45 Bivariate and Partial Correlations, Library Program Elements and English Language Arts CST Scores, Grade 8 Control
Hours Open
Collection Size
Budget
Total Technology
None (bivariate correlation)
.16**
.05**
.06**
.19**
Parent education
.17** .07** .05 .12**
Free and reduced lunch
.20** .20** .09** .21**
Ethnicity
.23** .15** .12** .24**
Percent English learners
.25** .15** .10** .22**
Average teacher salary
.11** .00 .03 .14**
Percent teachers fully credentialed
.14** .02 .06 .15**
**p < .001
In bivariate correlations with eighth grade social studies CST scores, each library
program again yielded significant results. Both hours open and total technology remained

142
significant in all the partial correlations. Partial correlations between social studies scores and
hours open ranged from r = .13 to r = .28, p < .001. Partial correlations with total technology
ranged in value from r = .17 to r = .27, p < .001. Both collection size and budget were
significant in each partial correlation except the one controlling for average teacher salary.
Significant partial correlations with collection size ranged from r = .08 to r = .25, p < .001.
Significant partial correlations with budget ranged from r = .09 to r = .15, p < .001 (see Table
46).
Table 46
Bivariate and Partial Correlations, Library Program Elements and Social Studies CST Scores, Grade 8 Control
Hours Open
Collection Size
Budget
Total Technology
None (bivariate correlation)
.20**
.10**
.09**
.22**
Parent education
.21** .13** .09** .17**
Free and reduced lunch
.24** .25** .13** .25**
Ethnicity
. 25** .19** .15** .27**
Percent English learners
.28** .19** .13** .26**
Average teacher salary
.13** .04 .05 .17**
Percent teachers fully credentialed
.18** .08** .09** .20**
**p < .001
Grade 11
In all categories, there were significant correlations between English Language Arts CST
scores and library program elements at grade 11. All relationships remained significant in partial
correlations with each of the school and community variables. Not only were there more

143
significant correlations at the high school level, but the strength of these correlations was greater
for each library program element. The strongest correlation was between English Language
Arts CST scores and hours open; five of the six partial correlations had r values greater than .50;
the sixth had a value of r = .49, p <.001. See Table 47 for a summary of results.
Table 47
Bivariate and Partial Correlations, Library Program Elements and English Language Arts CST Scores, Grade 11 Control
Hours Open
Collection Size
Budget
Total Technology
None (bivariate correlation)
.52**
.44**
.36**
.49**
Parent education
.52** .47** .36** .49**
Free and reduced lunch
.52** .47** .37** .49**
Ethnicity
.55** .52** .39** .52**
Percent English learners
.57** .51** .40** .53**
Average teacher salary
.49** .40** .32** .46**
Percent teachers fully credentialed
.53** .45** .37** .50**
**p < .001
Results were similar in correlations between U.S. History CST scores and library
program elements at grade 11, with each library program element significantly correlated to the
CST score in all bivariate and partial correlations. As in the correlations with English Language
Arts CST scores, the strongest relationship was between test scores and hours open; partial
correlations using each of the six school and community controls resulted in r values greater than
.50, the highest being r = .57, p < .001. As shown in Table 48, Total technology partial
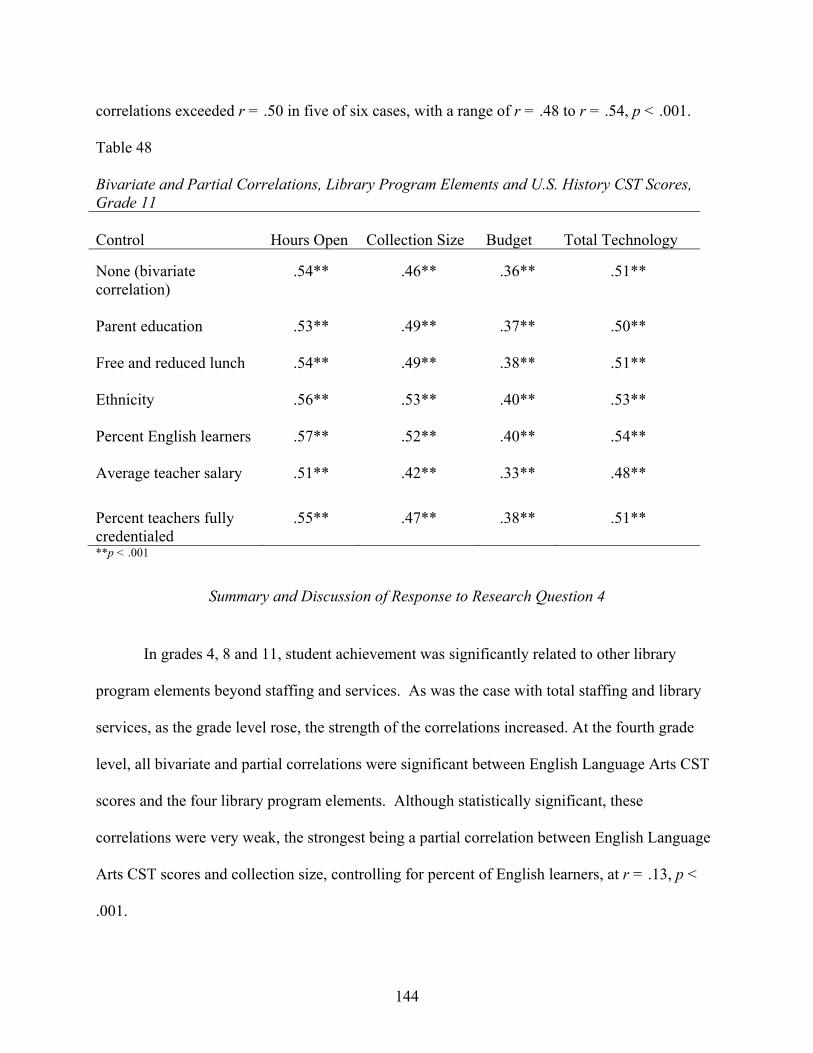
144
correlations exceeded r = .50 in five of six cases, with a range of r = .48 to r = .54, p < .001.
Table 48
Bivariate and Partial Correlations, Library Program Elements and U.S. History CST Scores, Grade 11 Control
Hours Open
Collection Size
Budget
Total Technology
None (bivariate correlation)
.54**
.46**
.36**
.51**
Parent education
.53** .49** .37** .50**
Free and reduced lunch
.54** .49** .38** .51**
Ethnicity
.56** .53** .40** .53**
Percent English learners
.57** .52** .40** .54**
Average teacher salary
.51** .42** .33** .48**
Percent teachers fully credentialed
.55** .47** .38** .51**
**p < .001
Summary and Discussion of Response to Research Question 4
In grades 4, 8 and 11, student achievement was significantly related to other library
program elements beyond staffing and services. As was the case with total staffing and library
services, as the grade level rose, the strength of the correlations increased. At the fourth grade
level, all bivariate and partial correlations were significant between English Language Arts CST
scores and the four library program elements. Although statistically significant, these
correlations were very weak, the strongest being a partial correlation between English Language
Arts CST scores and collection size, controlling for percent of English learners, at r = .13, p <
.001.

145
At the eighth grade level, all bivariate correlations between English Language Arts CST
scores and library program elements were significant. With each of the six partial correlations
controlling for school and community variables, significance remained for hours open and total
technology. The relationships with these two library variables were stronger than at the fourth
grade level; hours open r values ranged from .11 to .29; total technology r values ranged from
.12 to .24, p < .001. Collection size was significant in four of six partial correlations, while
budget was significant in three of six partial correlations. The strength of the significant
correlations for both these variables, though, was generally weak. For collection size, the r value
ranged from .07 to .20; for budget, r ranged from .09 to .12, p <.001.
Relationships between eighth grade social studies CST scores and library elements were
somewhat stronger. Each library program element was again significantly related to test scores in
bivariate correlations. Hours open and total technology were significant in all partial
correlations; r values for hours open ranged from .13 to .28, p < .001, and r values for total
technology ranged from .17 to .27, p < .001. Collection size and budget were significant in five
of six partial correlations; both were insignificant when controlling for average teacher salary.
Again, results were markedly different at the high school level. In all categories, there
were significant bivariate correlations between CST scores and library program elements at
grade 11, and significance remained when controlling for each of the school and community
variables in partial correlations. The strongest relationships were again in hours open and total
technology in correlations with both English Language Arts and U.S. History CST scores. In all
but one case, r values for hours open were above .50 across both tests in bivariate and partial
correlations; total technology r values ranged from .46 to .54, p <.001. There was a stronger
relationship between CST scores and collection size, with r values ranging from .40 to .53, p <

146
.001, across correlations with both English Language Arts and U.S. History CST scores. The
relationship between budget and test scores strengthened, too, with r values ranging from .33 to
.40, p < .001, across correlations with English Language Arts and U.S. History CST scores.
Across grade levels, there were consistent, statistically significant correlations between
test scores and the remaining library program elements, and the strength of those correlations
generally increased with grade level. The null hypothesis that student achievement does not vary
in relationship to other library program elements is rejected.
At the elementary level, the lack of certificated staff may account for some of the
weakness in correlations. As will be discussed later, there was a persistent correlation between
all library elements and staffing levels. The presence of a professional may have an impact on
all of the variables investigated here: the hours a library is open also depends on the activities
that occur and the help with students that transpires during open hours. The size of the collection
is not an indication of quality, and the presence of a professional in collection development may
have an impact on whether that collection contributes to student achievement. Similarly, the
presence of a certificated librarian in allocating budget priorities may be the key to budget size as
an indicator of student achievement. And technology in the library may become more significant
as a professional facilitates its best use with students and staff.
The greater presence of certificated staff at the middle school level bears out this
contention. Collection size and budget—related items—are still only weakly correlated with
student achievement, but hours open and total technology exhibit r values in partial correlations
of up to .28 and .27, p <.001, respectively. At the high school level, where professional staffing
is strongest, so are the correlations between these library elements and student achievement. No
bivariate or partial correlation between these library elements and either English Language Arts

147
or U.S. History CST scores had an r value of less than .32, p <.001, and only budget had r values
of less than .40. These results support previous research that these library elements contribute to
student achievement:
• Hours open (Baxter & Smalley, 2003; Burgin et al., 2003; Gaver, 1962; Rodney
et al., 2003; Smith, 2006)
• Collection size (Baumbach, 2003; Krashen, 1995; Krashen, 2004; Lance,
Hamilton-Pennell & Rodney, 2005; Lance, Rodney & Hamilton-Pennell, 2002;
McQuillan, 1998; Rodney et al., 2002, 2003; Smith, 2006; Squire, Applebee &
Lucas, 1967)
• Budget size (Baxter & Smalley, 2003; Bruning, 1994; Burgin et al., 2003; Greve,
1977; Hall-Ellis & Berry, 1995; Lance et al., 2002; Rodney et al., 2003; Smith,
2006)
• Technology available in the library (Baule, 1997; Lance et al., 2005; Oliver, 2003;
Rodney et al., 2003; Ryan, 2006; Smith, 2006).
H05: Student Achievement, Staffing Levels and Other Library Program Elements
The fifth research question asks how student achievement varies, if at all, in relationship
to a combination of library program elements. The null hypothesis for this question, H05, is that
student achievement does not vary in relationship to any combination of library staffing levels
and other library program elements.
Grade 4
To reduce the overall number of variables and address possible issues of
multicollinearity, all school and community variables were entered into a factor analysis with

148
varimax rotation. This procedure was also used to identify variables that correlated highly with
one another and formed factors (Leech, Barrett, & Morgan, 2005). Only factor loadings greater
than .600 were considered for inclusion in groupings, and only groupings with an eigenvalue of
at least 1 were retained. After rotation, the first factor accounted for 53.8% of the variance; the
second factor accounted for 17.8%, for a total of 71.6%. Table 49 displays the items and factor
loadings for the rotated factors, with loadings less than .40 omitted for clarity.
Table 49
Component Matrix for Factor Analysis of School and Community Variables, Grade 4 Variable
Factor 1
Factor 2
Average Parent Education
.843
Free and Reduced Lunch -.910
Ethnicity .885
Percentage English Learners -.910
Average Teacher Salary .817
Percent Teachers Fully Credentialed .641 Note: Extraction method was principal component analysis. Rotation Method: Varimax with Kaiser Normalization.
Rotation converged in 3 iterations.
Although percentage of English Learners is part of factor 1, this factor largely represents
community factors, while factor 2, average teacher salary and percent of teachers fully
credentialed, represents school factors.
A similar procedure was used to combine library variables. In the first factoring, budget
and collection size were eliminated for not loading at .600; all remaining variables loaded on a
single factor accounting for just 55.98% of the variance. Hours open was dropped as it had the

149
lowest communality and loading values of the remaining variables. The remaining three
variables accounted for 62.97% of the variance. Table 50 displays the final factor loadings.
Table 50
Component Matrix for Factor Analysis of Library Variables, Grade 4 Variable
Factor 1a
Total Staff Hours
.71
Total Services .83
Total Technology .83 Note: Extraction method was principal component analysis.
a. Only one component was extracted.
The school and community factors were then entered into the first step of a hierarchical
multiple regression, followed by the library factor added in the second step. Assumptions of
linearity, normality and multicollinearity were met in tests outlined in the previous chapter.
Together, the school, community and library factors produced an adjusted R2 of .70 (F(3, 3452) =
2619.63, p <.001) for the prediction of English Language Arts CST scores. The library factor
produced a ∆R2 of just .002. Beta weights indicated that the strongest predictor was the
community factor (.80), followed by school (.23) and library factors(.04). See Table 51 for
unstandardized and standardized betas and standard error.

150
Table 51
Summary of Hierarchical Regression Analysis for Variables Predicting English Language Arts CST Scores, Grade 4 Variable
В
SE В
β
Step 1
(Constant) 354.37 0.27 --
Community factor 23.15 0.27 .80**
School factor 23.15 0.27 .23**
Step 2
(Constant) 354.36 0.27 --
Community factor 23.10 0.27 .80**
School factor 6.60 .27 .23**
Library factor 1.23 .28 .04** Note: R2 = .69 for Step 1; ∆R2 =.002 for Step 2 (p <.001).
**p <.001
Grade 8 English Language Arts
Factor analysis with varimax rotation was again performed for the library, school and
community. Again, only factor loadings greater than .600 were considered for inclusion in
groupings, and only groupings with an eigenvalue of at least 1 were retained. For library
program elements, all variables loaded on a single factor accounting for 57.66% of the variance.
Budget loaded at .54 and was dropped. A second factor analysis accounted for 64.68% of the
variance with factor loadings indicated in Table 52.

151
Table 52
Component Matrix for Factor Analysis of Library Variables, Grade 8 Variable
Factor 1a
Hours Open
.811
Collection Size .705
Total Staff Hours .831
Total Services .819
Total Technology .831 Note: Extraction method was principal component analysis.
a. Only one component was extracted.
In the first factor analysis for school and community variables, percent of teachers fully
credentialed was eliminated with a loading of .35. A second factor analysis resulted in two
factors that accounted for 82.46% of the variance; the first includes the strongest loadings for
parent education, free and reduced lunch, ethnicity, and percentage English Learners, and this
factor accounted for 61.78% of the variance. As with fourth grade, this factor was largely
associated with community variables. The second factor, accounting for 20.68% of the variance,
most strongly loaded on average teacher salary, a school variable. See Table 53 for the factor
matrix and Table 54 for the total variances explained.

152
Table 53
Rotated Component Matrix for Factor Analysis of School and Community Variables, Grade 8 Variable
Factor 1
Factor 2
Average Parent Education
-.83
.18
Free and Reduced Lunch .89 -.22
Ethnicity -.88 -.09
Percentage English Learners .86 .06
Average Teacher Salary -.05 .987 Note: Extraction method was principal component analysis. Rotation Method: Varimax with Kaiser Normalization.
Rotation converged in 3 iterations.
The school and community factors were then entered into the first step of a hierarchical
multiple regression, followed by the library factor added in the second step. Assumptions of
linearity, normality and multicollinearity were met in tests outlined in the previous chapter.
Together, the school, community and library factors produced an adjusted R2 of .64 (F(3, 1143) =
688.44, p <.001) for the prediction of English Language Arts CST scores. Beta weights
indicated that the strongest predictor was the community factor (-.76), followed by school (.17)
and library factors(.13). The library factor produced a ∆R2 of .02, meaning that it accounted for
2% of the variance in 8th grade English Language Arts CST scores. See Table 54 for
unstandardized and standardized betas and standard error.
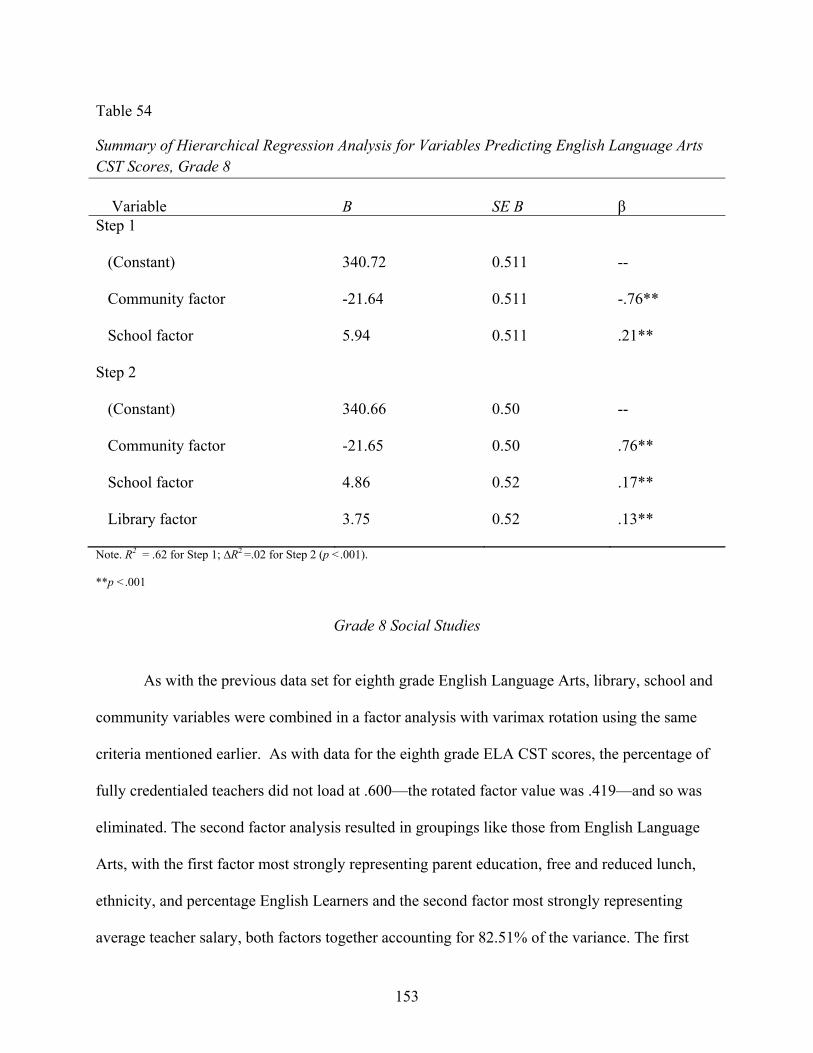
153
Table 54
Summary of Hierarchical Regression Analysis for Variables Predicting English Language Arts CST Scores, Grade 8 Variable
В
SE В
β
Step 1
(Constant) 340.72 0.511 --
Community factor -21.64 0.511 -.76**
School factor 5.94 0.511 .21**
Step 2
(Constant) 340.66 0.50 --
Community factor -21.65 0.50 .76**
School factor 4.86 0.52 .17**
Library factor 3.75 0.52 .13**
Note. R2 = .62 for Step 1; ∆R2 =.02 for Step 2 (p <.001).
**p <.001
Grade 8 Social Studies
As with the previous data set for eighth grade English Language Arts, library, school and
community variables were combined in a factor analysis with varimax rotation using the same
criteria mentioned earlier. As with data for the eighth grade ELA CST scores, the percentage of
fully credentialed teachers did not load at .600—the rotated factor value was .419—and so was
eliminated. The second factor analysis resulted in groupings like those from English Language
Arts, with the first factor most strongly representing parent education, free and reduced lunch,
ethnicity, and percentage English Learners and the second factor most strongly representing
average teacher salary, both factors together accounting for 82.51% of the variance. The first

154
factor, which will be called “Community factor,” accounted for 61.82% of the variance, while
the second factor, called “school factor,” accounted for 20.69% of the variance. See Table 55 for
the factor matrix.
Table 55
Rotated Component Matrix for Factor Analysis of School and Community Variables, Grade 8 English Language Arts Variable
Factor 1
Factor 2
Average Parent Education
-.83
.18
Free and Reduced Lunch .893 -.22
Ethnicity -.88 -.09
Percentage English Learners .88 .06
Average Teacher Salary -.05 .98
Note: Extraction method was principal component analysis. Rotation Method: Varimax with Kaiser Normalization.
Rotation converged in 3 iterations.
The first factor analysis for library variables resulted in the creation of two factors with an
Eigenvalue of greater than 1; however, the total variance of those two factors was just 54.31%.
Because collection size had the lowest extraction commonality—the amount of the variance in
the variable accounted for by the components—as well as the lowest rotated loading factor, this
variable was eliminated next. Removing collection size resulted in two factors that accounted
for just 59% of the variance. Budget total was eliminated next because it loaded most weakly and
had the lowest extraction communality among remaining variables. Remaining variables loaded
on a single factor; the loading value for average copyright was .18; this was removed for a final,

155
single factor for library variables consisting of total services, total technology, total staff hours,
and hours open.
The library factor accounted for 70.57% of the variance. See Table 56 for the factor matrix.
Table 56 Component Matrix for Factor Analysis of Library Variables, Grade 8 Social Studies Variable
Factor 1a
Hours Open
.82
Total Staff Hours .83
Total Services .85
Total Technology .87
Note: Extraction method was principal component analysis.
a. Only one component was extracted.
The school and community factors were then entered into the first step of a hierarchical
multiple regression, followed by the library factor added in the second step. Assumptions of
linearity, normality and multicollinearity were met in tests outlined in the previous chapter.
Together, the school, community and library factors produced an adjusted R2 of .60 (F(3, 1141) =
574.16, p <.001) for the prediction of eighth grade Social Studies CST scores. Consistent with
the other eighth grade regression, Beta weights indicated that the strongest predictor was the
community factor (-.70), followed by school (.24) and library factors(.17). The library factor
produced a ∆R2 of .03, meaning that it accounted for 3% of the variance in 8th grade Social
Studies CST scores. See Table 57 for unstandardized and standardized betas and standard error.

156
Table 57
Summary of Hierarchical Regression Analysis for Variables Predicting Social Studies CST Scores, Grade 8 Variable
В
SE В
β
Step 1
(Constant) 330.50 0.59 --
Community factor -21.48 0.59 -.70**
School factor 8.63 0.59 .28**
Step 2
(Constant) 330.40 0.57 --
Community factor -21.34 0.57 .70**
School factor 7.24 0.59 .24**
Library factor 5.02 0.59 .17** Note. R2 = .57 for Step 1; ∆R2 =.03 for Step 2 (p <.001).
**p <.001
Grade 11 English Language Arts
Factor analysis of school and community variables resulted in similar groupings of the
variables as indicated earlier; the percentage of teachers fully credentialed was eliminated for not
loading to at least .600. In the final factor analysis, two factors were produced, accounting for
83.00% of the variance, as shown in Table 58.

157
Table 58
Rotated Component Matrix for Factor Analysis of School and Community Variables, Grade 11 Variable
Factor 1
Factor 2
Average Parent Education
.86
.24
Free and Reduced Lunch -.86 -.27
Ethnicity .89 -.05
Percentage English Learners -.87 .08
Average Teacher Salary .06 .98
Note: Extraction method was principal component analysis. Rotation Method: Varimax with Kaiser Normalization.
Rotation converged in 3 iterations.
All library variables loaded on a single factor that accounted for 74.95% of the variance, as
indicated in Table 59.
Table 59 Component Matrix for Factor Analysis of Library Variables, Grade 11 Variable
Factor 1a
Hours Open
.88
Collection Size .82
Budget .73
Total Staff Hours .92
Total Services .90
Total Technology .92 Note: Extraction method was principal component analysis.
a. Only one component was extracted.

158
In a hierarchical regression with school and community factors entered in the first step,
followed by the addition of the library factor in the second step, the adjusted R2 was .57 (F(3,
953) = 423.49, p <.001) for the prediction of eleventh grade English Language Arts CST scores.
Assumptions of linearity, normality and multicollinearity again were met in tests outlined in the
previous chapter. Like regressions for previous grades, Beta weights indicated that the strongest
predictor was the community factor (.51). Unlike previous regressions, this was followed by the
library factor (.46) and school factor (.14) last. The library factor produced a ∆R2 of .19,
meaning that it accounted for 19% of the variance in 11th grade English Language Arts CST
scores, a much stronger relationship than those exhibited at the middle and elementary school
levels. See Table 60 for unstandardized and standardized betas and standard error.
Table 60
Summary of Hierarchical Regression Analysis for Variables Predicting English Language Arts CST Scores, Grade 11 Variable
В
SE В
β
Step 1
(Constant) 316.63 0.95 --
Community factor 20.87 0.95 .55**
School factor 10.43 0.95 .28**
Step 2
(Constant) 316.51 0.80 --
Community factor 19.28 0.80 .51**
School factor 5.33 .83 .14**
Library factor 17.20 .84 .46** Note. R2 = .38 for Step 1; ∆R2 =.19 for Step 2 (p <.001).
**p <.001

159
Grade 11 U.S. History
Factor analysis of school and community and library variables resulted in the same
groupings of the variables as indicated for English Language Arts with similar factor loadings;
the percentage of teachers fully credentialed was eliminated for not loading to at least .600. In
the final factor analysis, two factors were produced, accounting for 83.32% of the variance. The
first factor accounted for 62.60% and largely represented community variables. The second
factor accounted for 20.72% of the variance and loaded most heavily on average teacher salary, a
school variable. See Table 61 for the factor matrix.
Table 61
Rotated Component Matrix for Factor Analysis of School and Community Variables, Grade 11 U.S. History Variable
Factor 1
Factor 2
Average Parent Education
.86
.24
Free and Reduced Lunch -.86 -.27
Ethnicity .89 -.06
Percentage English Learners -.87 .08
Average Teacher Salary .06 .98 Note: Extraction method was principal component analysis. Rotation Method: Varimax with Kaiser Normalization.
Rotation converged in 3 iterations.
All library variables loaded on a single factor that accounted for 74.34% of the variance, as
indicated in Table 62.

160
Table 62
Component Matrix for Factor Analysis of Library Variables, Grade 11 U.S. History Variable
Factor 1a
Hours Open
.88
Collection Size .82
Budget .72
Total Staff Hours .92
Total Services .90
Total Technology .92 Note: Extraction method was principal component analysis.
a. Only one component was extracted.
Results of the hierarchical regression were similar to those with eleventh grade English
Language Arts CST scores. Entering community and school and community factors in the first
step, followed by all three factors in the second step, produced an adjusted R2 of .56 (F(3, 931) =
395.47, p <.001) for the prediction of eleventh grade U.S. History CST scores. Assumptions of
linearity, normality and multicollinearity were met in tests outlined in the previous chapter.
Unlike other regressions performed, however, Beta weights indicated that the library factor was
the strongest predictor of U.S. History CST scores (.48), followed by community (.47) and
school (.16) factors. The addition of the library factor produced a ∆R2 of .21; 21% of the variance
in U.S. History Scores was accounted for by the library factor. See Table 63 for unstandardized
and standardized betas and standard error.

161
Table 63
Summary of Hierarchical Regression Analysis for Variables Predicting U.S. History CST Scores, Grade 11 Variable
В
SE В
β
Step 1
(Constant) 320.23 0.84 --
Community factor 16.26 0.84 .55**
School factor 9.34 0.84 .28**
Step 2
(Constant) 320.11 0.69 --
Community factor 15.08 0.69 .47**
School factor 4.99 0.72 .16**
Library factor 15.24 0.72 .48** Note. R2 = .35 for Step 1; ∆R2 =.21 for Step 2 (p <.001). **p <.001
Summary and Discussion of Results for Research Question 5
Results to this question followed the established pattern. There was a statistically
significant but very weak effect at the elementary level; combined library elements accounted for
just 0.2% of the variance in English Language Arts CST scores when community and school
factors were controlled for in a hierarchical regression. At the middle school level, the library
factor accounted for 2% of the variance in English Language Arts CST scores and 3% of the
variance in social studies CST scores. At the high school level, the library factor accounted for
19% of the variance in English Language Arts CST scores and 21% of the variance in U.S.

162
History CST scores. In both cases, Beta weights indicated that the library factor was a stronger
predictor of scores than other school variables; in fact, the library factor was stronger than either
school or community factors in predicting U.S. History CST scores. Table 64 provides a
summary of the R2 values in multiple regressions at each grade level.
Table 64
∆R2 Produced by Addition of Library Factor in Multiple Regressions Grade
Dependent Variable
∆R2
3
English Language Arts
.002**
8 English Language Arts .02**
8 Social Studies .03**
11 English Language Arts .19**
11 U.S. History .21** **p <.001
The null hypothesis, that student achievement does not vary in relationship to any combination
of library staffing levels and other library program elements, is rejected.
Statistically significant relationships in this study support earlier studies in which the
overall library program accounted for between 1 and 21% of the variance in test scores (see
Baughman, 2000; Lance et al., 2000a, 2002; Lance, Welborn & Hamilton-Pennell, 1993; Miller
et al., 2003; Rodney et al., 2002; Smith, 2001). At the middle school level, the change in R2
values with the addition of library factors into multiple regressions including school and
community variables produced results similar to those in Iowa (Rodney et al., 2002) and
Colorado (Lance et al., 2000a). The R2 values at the high school level are among the highest
reported in studies of this kind.

163
H06 and H07: School Library Services, Certificated Staffing and Total Staffing
The rejection of all null hypotheses for research questions 1 through 5 leads naturally to
the final two research questions. If there is a relationship between staffing levels and student
achievement on the one hand, and a relationship between library services and student
achievement on the other, it is reasonable to explore the connection between library staffing
levels and the services that staff provides. The sixth research question asks, “If student
achievement significantly correlates with school library staff services, how does the level of
these services vary, if at all, in relationship to certificated library staffing levels?” This question
forms the null hypothesis H06, that the level of school library services does not vary in
relationship to certificated library staffing levels. The final research question asks, “If student
achievement significantly correlates with school library staff services, how does the level of
these services vary, if at all, in relationship to overall library staffing levels?” From this question
is derived the null hypothesis H07, that the level of school library services does not vary in
relationship to overall library staffing levels.
Grade 4
At the fourth grade, there was a weak but statistically significant correlation between
certificated staffing levels and English Language Arts scores. In bivariate correlations between
certificated staffing levels and services provided to staff and students on a regular basis, twenty-
two of twenty-seven services were significantly related to certificated staffing levels, although
most were related weakly at under r = .10. Strongest significant correlations were with offering a
program of curriculum-integrated information literacy instruction (r =.3, p <.001) and
collaboration with teachers to develop student learning (r =.23, p <.001). There was also a

164
significant negative relationship between certificated staffing levels and clerical staffing hours
with an r value of -.27 (p <.001).
In bivariate correlations between library services and total library staffing, all
relationships were statistically significant at p <.001. Those relationships also tended to be
stronger than library services and certificated staffing hours, most notably in library hours (r
=.47), total technology (r = .38) and total services (r =.38). At the fourth grade level, data
support the idea that there is a positive relationship between staffing levels and library services
regularly offered. This data also supports the notion that total staffing levels are more strongly
associated with the level of services provided than solely certificated staffing levels. Table 65
provides a summary of results.
Table 65
Comparison of Bivariate Correlations, Certificated Staffing Levels and Total Staffing Levels with Regularly Provided Library Services, Grade 4.
Library Service
Certificated Staff
Level
Total Staffing
Level
Hours open
.13**
.47**
Offered a program of curriculum-integrated information literacy instruction
.31** .21**
Informally instructed students in the use of resources
.03 .17**
Planned or conducted workshops for teachers
.20** .18**
Assisted school curriculum committee with recommendations
.13** .15**
Collaborated with teachers to develop, implement, and evaluate student learning two or more hours per week
.23** .19**
(table continues)

165
Table 65 (continued)
Library Service
Certificated Staff
Level
Total Staffing
Level Provided teachers with information about new resources
.07**
.22**
Provided reference assistance to students and teachers
.04* .23**
Helped students and teachers find and use resources outside school library
.09** .21**
Facilitated interlibrary loan for students and teachers
.04** .17**
Provided reading, listening, and viewing guidance for students
.07** .20**
Helped parents realize importance of lifelong learning
.09** .22**
Coordinated in-school production of materials
.05** .13**
Coordinated video production and dissemination activities
.02 .09**
Coordinated cable TV, distance education, and related activities
.02 .07**
Coordinated school or library computer networks
.02 .13**
Provided access to online library catalog and circulation
.06** .22**
Provided Internet access for students in the library
.06** .27**
Provided instruction on Internet searching and research
.15** .27**
Provided electronic access to a resource sharing network
.04** .12**
Communicated proactively with principal
.03 .15**
(table continues)

166
Table 65 (continued)
Library Service
Certificated Staff
Level
Total Staffing
Level Attended meetings of school site council, two or more times per school year
.04*
.16**
Budget
.05** .18**
Total Technology
.09** .38**
Print Collection Size
.07** .23**
Clerical Staff Hours
-.27** .72**
Total Library Services .18** .38** *p < .05, ** p < .001.
Grade 8
All correlations between library services and certificated library staffing levels at the
middle school level were significant except one—coordination of cable TV, distance education,
and related activities-- and those correlations were typically stronger than at the elementary level.
Correlations were strongest among the following services: offering a program of curriculum-
integrated information literacy instruction (r = .52, p <.001), total library services (r = .46, p
<.001), planning or conducting workshops for teachers total library services (r = .44, p <.001),
collaboration with teachers to develop student learning (r = .41, p <.001and total technology (r
= .39, p <.001). Again, there was a significant negative correlation with clerical staffing, r = -
.20, p <.001.
All correlations between library services and total library staffing levels at the middle
school were significant; these correlations were stronger than those with certificated library
staffing in twenty-two of twenty-seven services, most notably in hours open (r = .68, p <.001),
total technology (r = .60, p <.001), and total library services (r = .59, p <.001). Data from
middle school more strongly demonstrate a relationship between the level of certificated staffing

167
and library services provided and suggest that total staffing is an even better indicator of services
provided than solely certificated staffing. See Table 66 for a summary.
Table 66:
Comparison of Bivariate Correlations, Certificated Staffing Levels and Total Staffing Levels with Regularly Provided Library Services, Grade 8
Library Service
Certificated Staff
Level
Total Staffing
Level Hours open
.32**
.68**
Offered a program of curriculum-integrated information literacy instruction
.52** .39**
Informally instructed students in the use of resources
.24** .47**
Planned or conducted workshops for teachers
.44** .32**
Assisted school curriculum committee with recommendations
.31** .27**
Collaborated with teachers to develop, implement, and evaluate student learning two or more hours per week
.41** .33**
Provided teachers with information about new resources
.26** .43**
Provided reference assistance to students and teachers
.23** .46**
Helped students and teachers find and use resources outside school library
.27** .34**
Facilitated interlibrary loan for students and teachers
.06 .17**
Provided reading, listening, and viewing guidance for students
.27** .35**
Helped parents realize importance of lifelong learning .21** .28**
(table continues)

168
Table 66: (continued) Library Service
Certificated Staff
Level
Total Staffing
Level
Coordinated in-school production of materials
.12**
.19**
Coordinated video production and dissemination activities
.07** .09**
Coordinated cable TV, distance education, and related activities
.02 .08**
Coordinated school or library computer networks
.17** .22**
Provided access to online library catalog and circulation
.25** .41**
Provided Internet access for students in the library
.26** .46**
Provided instruction on Internet searching and research
.36** .48**
Provided electronic access to a resource sharing network
.26** .29**
Communicated proactively with principal
.19** .37**
Attended meetings of school site council, two or more times per school year
.29** .33**
Budget
.26** .34**
Total Technology
.39** .60**
Print Collection Size
.36** .53**
Clerical Staff Hours
-.20** .57**
Total Library Services .46** .59** *p < .05, ** p < .001.
Grade 11
Consistent with earlier findings, the correlations between certificated library staff and
library services at the high school level were uniformly stronger than at elementary or middle

169
school levels. All correlations were significant at p=.001; eight library services had Pearson r
values of greater than .60. Total library services correlated with certificated library staffing levels
at r = .70. At the high school level, in contrast to middle and elementary school, there was a
positive correlation between certificated and clerical staffing levels (r = .40).
In twenty-four of twenty-seven cases, library services correlated more strongly with total
library staffing than with certificated library staffing, and all library services correlated
significantly at p=.001. Three services--total library services, hours open, and total technology--
correlated with total staffing at or near r =.80; nine services correlated at r values greater than
.70. In the correlations between certificated library staff and library services, only total library
services reached an r value.70. See Table 67 for a summary.
Table 67
Comparison of Bivariate Correlations, Certificated Staffing Levels and Total Staffing Levels with Regularly Provided Library Services, Grade 11 Library Service
Certificated Staff
Level
Total Staffing
Level Hours open
.64**
.80**
Offered a program of curriculum-integrated information literacy instruction
.63** .61**
Informally instructed students in the use of resources
.61** .75**
Planned or conducted workshops for teachers
.42** .41**
Assisted school curriculum committee with recommendations
.39** .42**
(table continues) Table 67
Library Service
Certificated Staff Level
Total Staffing Level
Collaborated with teachers to develop, implement, and evaluate student learning two or more hours per week
<.51**
.49**

170
Provided teachers with information about new resources
.61** .74**
Provided reference assistance to students and teachers
.59** .73** Helped students and teachers find and use resources outside school library
.53** .61**
Facilitated interlibrary loan for students and teachers
.20** .31** Provided reading, listening, and viewing guidance for students
.54** .61**
Helped parents realize importance of lifelong learning
.29** .31** Coordinated in-school production of materials
.26** .29** Coordinated video production and dissemination activities
.11** .13**
Coordinated cable TV, distance education, and related activities
.08** .12**
Coordinated school or library computer networks
.37** .41** Provided access to online library catalog and circulation
.57** .69**
Provided Internet access for students in the library
.58** .73** Provided instruction on Internet searching and research
.64** .71**
Provided electronic access to a resource sharing network
.36** .38**
Communicated proactively with principal
.58** .68** Attended meetings of school site council, two or more times per school year
.47** .50**
Budget
.56** .62** Total Technology
.67** .80** Print Collection Size
.65** .74** Clerical Staff Hours
.40** .84** Total Library Services .70** .79** ** p < .001
Summary and Discussion of Responses to Research Questions 6 and 7
Correlations between certificated library staff and library services were significant at
every grade level; as with other relationships examined earlier in this chapter, those relationships
grew stronger as the grade level increased. The null hypothesis for research question 6, that the

171
level of school library services does not vary in relationship to certificated library staffing levels,
was rejected.
At each of the three grade levels, all bivariate correlations between total library staffing
levels and library services were also statistically significant; these correlations were generally
stronger than those between certificated staffing levels and library services at each level, too.
These correlations increased in strength with grade level, grade 4 exhibiting the weakest
correlations and grade 11 exhibiting the strongest. The null hypothesis for research question 7,
that the level of school library services does not vary in relationship to total library staffing
levels, was thus rejected.
At the elementary level, while there was not a positive significant relationship between
total staffing levels and student achievement, there was a positive correlation between the
services the library provided and student achievement. The consistently positive significant
correlations between total staffing levels and services provided appears to contradict the lack of
positively significant correlation between total staffing and student achievement. What can be
concluded, though, is that total staffing tends to correlate more strongly with services offered
than does certificated staff alone. This is seen most starkly in the differences in r values
between certificated staffing and total staffing levels in correlations with hours open, total
technology, and total services, as indicated in table 68.

172
Table 68 Comparison of Bivariate Correlations, Certificated Staffing Levels and Total Staffing Levels with Regularly Provided Library Services, Grade 4.
Library Service
Certificated Staff Level Pearson r
Total Staffing Level
Pearson r Hours open
.13**
.47**
Total Technology
.09** .38**
Total Library Services .18** .38** **Correlation is significant at the .001 level
The consistent, positive correlations between staffing and services were seen at all three grade
levels, and at each level, total staffing levels tended to correlate more strongly with services than
did certificated staff levels, although those correlations were generally significant, too.
This trend did not hold at any grade level, though, for three services, which correlated
more strongly with certificated staffing levels than with total staffing levels: offering a program
of curriculum-integrated information literacy instruction; planning or conducting workshops for
teachers; and collaborating with teachers to develop, implement, and evaluate student learning.
One possible interpretation of this result is that these are all activities requiring professional
training and experience; in this case, the certificated staff hours are a more critical component
than the total staff hours in providing the service. Nevertheless, the significant correlations at all
three levels in both certificated and total staffing support previous research which shows that as
staffing levels rise, there tends to be a corresponding increase in the services the library program
provides (see Brandes, 1987; Didier, 1984; Gaver, 1962; Lance et al., 1999; Lance et al., 2000b;
Lance, Welborn & Hamilton-Pennell, 1993; Loertscher & Land, 1975; Loertscher et al., 1987;
McCracken, 2001; Rodney et al., 2002).

173
Summary of Chapter 4
Research questions 1-7 were stated in the form of null hypotheses. Questions 1-4 were
addressed through bivariate and partial correlations and in each case, the null hypothesis was
rejected. For each question, bivariate correlations and partial correlations accounting for school
and community variables produced positive, statistically significant results. In addition, the
strength of the bivariate and partial correlations increased with grade level. That is, middle
school staffing and services were more strongly related to student achievement than at the
elementary level, and high school staffing and services were more strongly related to student
achievement than at the middle school level.
In addressing research question 5, library variables were combined in a factor analysis, as
were school and community variables. These factors were entered into hierarchical multiple
regressions, entering school and community variables first as controls, then determining the ∆R2
produced by the addition of the library factor. At each level, there was a statistically significant
positive result, which was very weak (∆R2 = .002, p <.001) at the elementary level, somewhat
stronger (∆R2 = .02, p <.001 for English Language Arts, ∆R2 = .03, p <.001 for Social Studies
CST scores) at the eighth grade, and considerably stronger at the high school level (∆R2 = .19, p
<.001 for English Language Arts, ∆R2 = .21, p <.001 for U.S. History).
Research questions 1 and 2 investigated the relationship between staffing levels and
student achievement; questions 3 and 4 investigated the relationship between library elements
and student achievement, and question 5 investigated the way a combination of library elements
may be related to student achievement. Rejection of the null hypothesis for each of these
questions led to an investigation in research questions six and seven of the relationship between
staffing levels and library services.

174
All bivariate correlations between certificated library staffing and library services
regularly provided were statistically significant; the same was true for correlations between total
library staffing levels—a combination of certificated and clerical staffing—and library services
provided. Two trends emerged from these calculations: the correlations grew stronger with grade
level, and within grade level, student achievement tended to correlate more strongly with total
staffing than with certificated staffing alone. The null hypotheses for research questions 6 and 7
were also rejected.

175
CHAPTER 5
SUMMARY AND CONCLUSIONS
The purpose of this study was to examine the relationship between school library
programs and student achievement. The independent variables for school library programs
included level of certificated library staff, levels of total library staffing, number and types of
services regularly provided, amount of technology available through the library, hours open,
collection size, and budget. Data for these were derived from the California Department of
Education School Library Survey. The dependent variables were the standardized test scores
from the California Standards Tests (CST) in English Language Arts for grades 4, 8 and 11,
social studies at grade 8, and U.S. History at grade 11.
A review of the relevant literature detailed the evolving instructional role of the library
media specialist and the studies indicating a significant relationship between school library
programs and student achievement. Theoretical models by Loertscher (2000) and Todd &
Kuhlthau (2006) posit that a successful library media program includes adequate certificated and
clerical staffing, and that the library media specialist provides critical instructional roles that
contribute significantly to student achievement. This review of the literature further noted that
while California school libraries have enjoyed occasional budget windfalls for materials
purchases, their current status as last among all states in certificated and clerical staffing levels is
not a recent development. California has had woefully inadequate staffing levels dating back at
least forty years (Howell, 1968), levels that have been in steady decline at least since 1986
(Brandes, 1987). A 2004 study by Sinclair-Tarr and Tarr reported significant but very weak
relationships between some aspects of school library programs and student achievement in

176
California’s elementary and middle schools; at the high school level, a significant negative
relationship was found between school library programs and student achievement.
This study was undertaken with a methodology more like that used in other state-wide
studies (see Lance et al., 2000b). The relationship between school library programs and student
achievement was explored through the following seven research questions:
1. How does student achievement vary, if at all, in relationship to the levels of
certificated staffing in school library media programs?
2. How does student achievement vary, if at all, in relationship to the levels of
combined certificated and clerical staffing in school library media programs?
3. How does student achievement vary, if at all, in relationship to library staff
services offered, either independently or in combination?
4. How does student achievement vary, if at all, in relationship to other library
program elements?
5. How does student achievement vary, if at all, in relationship to a combination of
library program elements?
6. If student achievement significantly correlates with school library staff services,
how does the level of these services vary, if at all, in relationship to certificated
library staffing levels?
7. If student achievement significantly correlates with school library staff services,
how does the level of these services vary, if at all, in relationship to overall library
staffing levels?
For research questions 1-4, bivariate correlations were used to assess the significance and
strength of the relationships. Separate partial correlations controlled for school and community

177
factors, including average parent education level, percent of students eligible for free and
reduced lunch, ethnicity, percentage of English learners, average teacher salary, and percentage
of teachers fully credentialed. For question 5, a combination of library variables were then
entered into hierarchical multiple regressions, school and community factors entered first as
controls. Questions 6 and 7 then used bivariate correlations to assess the significance and
strength of relationships between staffing levels and services library programs provided.
Summary of Results
Research Question 1
Research Question 1: How does student achievement vary, if at all, in relationship to the
levels of certificated staffing in school library media programs?
At the elementary level, there was a weak but statistically significant positive correlation
between certificated staffing and English Language Arts CST scores, r =.06, p <.001. The
strongest partial correlation controlled for ethnicity at r = .11, p <.001. At the middle school
level, the relationship between English Languages Arts CST scores and certificated staffing only
became significant in partial correlations, the strongest controlled for ethnicity, at r =.16, p
<.001. The bivariate correlation between Social Studies CST scores and certificated staffing was
weak but significant at r = .07, p <.001. Partial correlations generally increased the strength of
this relationship, the strongest control variable again being ethnicity at r =.22, p <.001. At the
high school level, the correlations were much stronger, at r =.44, p <.001 for English Language
Arts and r =.45, p <.001 for U.S. History CST scores. Partial correlations again typically
increased the strength of these relationships; the strongest for both English Language Arts and
U.S. History controlled for ethnicity at r =.52, p <.001.

178
Research Question 2
Research Question 2: How does student achievement vary, if at all, in relationship to the
levels of combined certificated and clerical staffing in school library media programs?
Overall results indicate a positive significant relationship between total staffing levels
and student achievement. At the fourth grade level, there was a significant negative correlation
between English Language Arts CST scores and total staffing, r =-.04, p =.02, but the
significance of the correlation disappeared or the direction of the relationship became positive in
partial correlations controlling for community variables, the strongest positive value being r
=.12, p <.001, when controlling for parent education. All of these correlations were very weak
and would not alone lead to a rejection of the null hypothesis that student achievement does not
vary in relationship to total library staffing levels.
At the eighth grade level, though, bivariate correlations between total library staffing and
both English Language Arts and social studies CST scores were significant at r =.12, p <.001
and r =.19, p <.001 respectively. The strength of these relationships tended to increase with
partial correlations controlling for school and community variables. The strongest partial
correlations for both English Language Arts and social studies controlled for ethnicity, at r = .22,
p <.001 and r = .28, p <.001 respectively.
At the eleventh grade, bivariate correlations between total library staffing levels and CST
scores were again stronger than at middle or elementary levels at r = .54, p <.001 for English
Language Arts CST scores and r = .56, p <.001 for U.S. History scores. The strength of those
associations remained in partial correlations with school and community variables. For English
Language Arts, those correlations ranged from r =.49, p <.001 when controlling for average
teacher salary to r = .59, p <.001 when controlling for percentage of English learners. For U.S.

179
History, those partial correlations ranged from r =.52, p <.001 when controlling for average
teacher salary to r =.60, p <.001 when controlling for percentage of English learners.
Research Question 3
Research Question 3: How does student achievement vary, if at all, in relationship to
library staff services offered, either independently or in combination?
At the fourth grade level, there were significant positive correlations between English
Language Arts CST scores and fourteen library staff services. The two strongest associations
were with informal instructing students in the use of resources, at r = .16 (p < .001), and
communicating proactively with principal, at r = .15, p < .001. Total services correlated with
the English Language Arts CST scores at r = .14, p < .001. Of the fourteen with significant
correlations, seven remained significant in partial correlations with all school and community
variables used as controls; the strongest of these were offering a program of curriculum-
integrated information literacy instruction, at r =.18, p <.001 and providing reference assistance
to students and teachers, at r =.17, p <.001, both controlling for the percent of teachers fully
credentialed. Total library services correlated significantly bivariate correlation with English
Language Arts scores at r =.14, p <.001, and with partial correlations when controlling for each
of the school and community variables. The strength of these scores ranged from r =.08, p
<.001, when controlling for parent education level to r =.13, p <.001 when controlling for free
and reduced lunch.
Again, the correlations between library services and student achievement were stronger at
the middle school than at the elementary school level. At the eighth grade level, there were also
fourteen services that were significantly related to English Language Arts CST scores, with the
three strongest being communicating proactively with principal, offering a program of

180
curriculum-integrated information literacy instruction, and total services, all at r = .19, p <.001.
Just one of the fourteen services did not remain significant in relationship to English Language
Arts CST scores when controlling for school and community variables in partial correlations.
Total services remained significant in all partial correlations, the strongest when controlling for
ethnicity at r =.23, p <.001.
Slightly stronger bivariate correlations between social studies CST scores and library
services were seen, the strongest being total services at r =.24, p <.001, and informally
instructing students in the use of resources and providing reference assistance to students and
teachers, both at r =.22, p <.001. All but two of sixteen services remained statistically
significant in partial correlations with each school and community variable as a control, and
library services remained significant in these partial correlations with r values ranging from .20
to .28, p <.001.
At the high school level, in 21 of 22 categories there was a statistically significant
relationship between library services and student achievement. The relationship between
English Language Arts CST scores and library services was very similar in strength to that of
U.S. History CST scores, which will be summarized here. The strongest bivariate correlations
included total services at r =.51, p <.001, providing teachers with information about new
resources, r = .49, p <.001, and informally instructed students in the use of resources, r = .47, p
<.001. Partial correlations between total services and U.S. History CST scores remained
significant when controlling for each school and community variable, ranging in strength from
r = .46, p < .001, controlling for average teacher salary and r = .53, p < .001 when controlling
for percentage of English learners.

181
Research Question 4
Research Question 4: How does student achievement vary, if at all, in relationship to
other library program elements?
The patterns for correlations in answer to this question were the same as on prior
questions; the strength of correlations increased with grade level. At the elementary level, all
other library program elements—hours open, collection size, budget, and total technology—were
significantly, though weakly, related to English Language Arts CST scores in all bivariate and
partial correlations.
At the middle school level, collection size and budget—related items—were still only
weakly correlated with student achievement, but hours open and total technology exhibited r
values in partial correlations of up to .28 and .27, p <.001, respectively.
At the high school level, where professional staffing was strongest, so were the
correlations between these library elements and student achievement. No bivariate or partial
correlation between these library elements and either English Language Arts or U.S. History
CST scores had an r value of less than .32, p <.001, and only budget had r values of less than
.40.

182
Research Question 5
Research Question 5: How does student achievement vary, if at all, in relationship to a
combination of library program elements?
Results to this question followed the established pattern. There was a statistically
significant but very weak effect at the elementary level; combined library elements accounted for
just 0.2% of the variance in English Language Arts CST scores when community and school
factors were controlled for in a hierarchical regression. At the middle school level, the library
factor accounted for 2% of the variance in English Language Arts CST scores and 3% of the
variance in social studies CST scores. At the high school level, the library factor accounted for
19% of the variance in English Language Arts CST scores and 21% of the variance in U.S.
History CST scores. In both cases, Beta weights indicated that the library factor was a stronger
predictor of scores than other school variables; in fact, the library factor was stronger than either
school or community factors in predicting U.S. History CST scores.
Research Questions 6 and 7
Research Question #6: If student achievement significantly correlates with school library
staff services, how does the level of these services vary, if at all, in relationship to certificated
library staffing levels?
Research Question 7: If student achievement significantly correlates with school library
staff services, how does the level of these services vary, if at all, in relationship to overall library
staffing levels?
At the elementary level, while there was not a positive significant relationship between
total staffing levels and student achievement, there was a positive correlation between the
services the library provided and student achievement. The consistently positive significant

183
correlations between total staffing levels and services provided appears to contradict the lack of
positively significant correlation between total staffing and student achievement. What can be
concluded, though, is that total staffing tended to correlate more strongly with services offered
than did certificated staffing alone. For example, the r value for the correlation between hours
open and certificated staffing was .13, p <.001, versus .47 for the correlation between library
hours and total staffing. r values increased similarly in total technology (from r =.09 to r =.38, p
<.001) and total library services (from r = .18 to .38, p <.001).
All correlations between library services and certificated library staffing levels at the
middle school level were significant except one—coordination of cable TV, distance education,
and related activities-- and those correlations were typically stronger than at the elementary level.
Correlations were strongest among the following services: offering a program of curriculum-
integrated information literacy instruction (r = .52, p <.001), total library services (r = .46, p
<.001), planning or conducting workshops for teachers total library services (r = .44, p <.001),
collaboration with teachers to develop student learning (r = .41, p <.001) and total technology (r
= .39, p <.001).
All correlations between library services and total library staffing levels at the middle
school were significant; these correlations were stronger than those with certificated library
staffing in twenty-two of twenty-seven services, most notably in hours open (r = .68, p <.001),
total technology (r = .60, p <.001), and total library services (r = .59, p <.001). Data from
middle school more strongly demonstrate a relationship between the level of certificated staffing
and library services provided and suggest that total staffing is an even better indicator of services
provided than solely certificated staffing.

184
At the high school level, the correlations between certificated library staff and library
services at the high school level were uniformly stronger than at elementary or middle school
levels. All correlations were significant at p=.001; eight library services had Pearson r values of
greater than .60. Total library services correlated with certificated library staffing levels at r =
.70. At the high school level, in contrast to middle and elementary school, there was a positive
correlation between certificated and clerical staffing levels (r = .40).
In twenty-four of twenty-seven cases, library services correlated more strongly with total
library staffing than with certificated library staffing, and all library services correlated
significantly at p=.001. Three services--total library services, hours open, and total technology--
correlated with total staffing at or near r =.80; nine services correlated at r values greater than
.70. In the correlations between certificated library staff and library services, only total library
services reached an r value.70.
Key Findings
Several key findings emerged from this study in the areas of staffing levels, library services,
library program elements, and the total library program.
Staffing Levels
1. There was a great discrepancy in library staffing levels from the elementary grades through
high schools. At the elementary level, just 1.2% of schools had both a full time library media
specialist and a full time clerk, compared to 8.5% at the middle school, and 30.3% at the high
school level.
2. There was a weak but statistically significant correlation between certificated staffing levels
and student achievement on California Standards Tests (CST) at the elementary school level.
185
That correlation remained significant when controlling for five of six school and community
variables. Certificated staffing levels were not significantly related to English Language Arts
CST scores in the middle school, but they were significantly related to social studies CST
scores, a correlation that persisted when controlling for five of six community variables. At
the high school level, certificated staffing levels were significantly related to both English
Language Arts and U.S. History CST scores, with r values of .44 and .45, p <.001,
respectively. Those correlations persisted and were generally strengthened when controlling
for all school and community variables.
3. The correlation between total staffing levels and student achievement strengthened as total
staffing levels increased from elementary through high school. At the elementary level,
where just over 1% of schools had both full time certificated librarians and clerks, results
were inconclusive, ranging from very weak negative to very weak positive partial and
bivariate correlations. At the middle school level, with 8.5% of schools employing full time
certificated librarians and clerks, there was a statistically significant relationship between
total staffing and student achievement in both English Language Arts and social studies CST
scores, and that relationship remained significant when controlling for all school and
community variables. At the high school level, where over 30% of schools have full time
certificated librarians and clerks, there was a significant correlation between total staffing
and both English Language Arts and U.S. History CST scores, with r values ranging from .49
to .60, p < .001.

186
Table 69
Bivariate and Partial Correlations, Total Staffing and Student Achievement, Grades 4, 8, 11
Control
Grade 4 ELA
Grade 8 ELA
Grade 8 Social Studies
Grade 11 ELA
Grade 11 U.S.
History None (bivariate correlation)
-.04*
.12**
.19**
.54**
.56**
Parent Education Level .00 .09** .17** .53** .56**
Free and Reduced Lunch .12** .18** .26** .53** .56**
Ethnicity .02 .22** .28** .57** .59**
Percentage English Learners .04* .19** .26** .59** .60**
Avg. Teacher Salary -.06** .07* .12** .49** .52**
Percentage Fully Credentialed Teachers
-.04* .09** .06** .54** .57**
*p <.05, **p <.001.
The summary of bivariate and partial correlations across grade level show in Table 69 suggests
that the lack of correlation at the elementary level may have been due to an overall paucity of
credentialed and clerical staffing; as the overall staffing levels increased in middle school and
high school, so did the strength of correlations between staffing and student achievement.
Library Services
1. At the fourth and eighth grade level, there were significant positive correlations between
English Language Arts CST scores and fourteen library staff services. Also at the middle
school level, social studies CST scores were significantly related to 16 library services. At
the high school level, 20 of 21 library services were significantly related to both English
Language Arts and U.S. History test scores.

187
2. Total library services were significantly related to student achievement at all levels, and this
relationship persisted when controlling for all school and community variables.
Library Program Elements
1. At the elementary level, English Language Arts CST scores were significantly related to
hours open, collection size, library budget, and total technology available through the library.
Correlations persisted when controlling for all school and community variables.
2. At the middle school level, English Language Arts and social studies CST scores tended to
rise as both the hours open and the total amount of technology available increased. These
correlations were significant when controlling for all school and community variables. In
bivariate correlations, collection size and library budget were significantly related to test
scores; these correlations remained significant when controlling for four of six school and
community variables with English Language Arts and five of six school and community
variables with social studies CST scores.
3. At the high school level, English Language Arts and U.S. History CST scores were
significantly correlated with hours open, collection size, library budget, and total technology
available in the library. These correlations remained significant when controlling for all
school and community variables. As library hours, collection size, budget, and technology in
the library increased, there tended to be a corresponding increase in both English Language
Arts and U.S. History CST scores.
Total Library Program
Consistent with the overall percentages of fully staffed schools from elementary through
high school, there was an increasingly stronger relationship between total library programs and
student achievement when controlling for all school and community variables. At the elementary

188
level, the overall school library program accounted for less than 1% of the variance in test scores.
That number increased to as much as 3% in middle school and to 21% at the high school level.
Library Services and Staffing
At elementary, middle and high school levels, the certificated and total staffing levels
were generally associated with the strength of library program elements. The strength of those
associations increased with each grade level, and at the 11th grade, there was a significant
correlation between both certificated and total staffing levels and every library service regularly
provided.
Assumptions and Limitations
The data for this study came from four publically available sources within the California
Department of Education (CDE): school and community information from the state Academic
Progress Index (API), school information from the School Accountability Report Card (SARC),
test scores from the criterion-referenced California Standards Tests (CST), and the CDE School
Library Survey. This study assumed that school and community information from the API and
SARC were accurate. It was also conducted with the assumption that the CST scores are a valid
measure of student achievement; however, the CST scores in English Language Arts and social
studies--chosen because these courses of study are commonly associated with library use--
represent a very narrow band of student achievement and therefore provide a correspondingly
narrow view of the relationship between student achievement and school library media
programs.
In addition, while schools are required to submit a completed CDE School Library
Survey annually, there is no consequence for noncompliance. Therefore, this population was
technically self-selected. Nevertheless, 61% of elementary schools, 95% of middle schools, and

189
84% of high schools, for a total of 5690 schools, had data available from all four sources, which
constitutes a robust sample size.
Another limitation to this study was that respondents to the library survey identified
neither themselves nor their job titles. This allows for the possibility that there may be some
discrepancy in answers based upon positions of the people responding and the data available to
them in providing their answers.
Another variable that was unaccounted for in this study was the operation of reading
intervention programs such as Reading First, Accelerated Reader, and Read 180 through the
library program. Similarly, a great number of library employees are responsible for managing
textbook distribution and collection, a duty that requires significant time away from library
responsibilities. School library programs that must administer reading programs or manage
textbooks may not be able to offer the range of services to students and teachers that other school
library programs can.
The paucity of full-time certificated staffing at the elementary level, particularly the small
numbers of full-time library media specialists working with full-time clerical assistants, raises
questions about unaccounted-for intervening variables at the elementary school. While there
were enough full-time library media specialists at the elementary level to establish a statistically
significant result, other factors may have been at play to obscure results. First, the lack of a
sizable community of elementary level library media specialists may be inhibiting the
establishment of best practice in school librarianship at that level. Second, the very lack of
library media specialists suggests a widespread lack of administrative and district level support
of school library programs at the elementary level.

190
Conclusions
In 1968, the publication of School Libraries in California (Howell) brought attention to
the inadequacies of this state’s school libraries. Nationally, 93% of high schools employed
certificated librarians, compared to 64% in California. At the elementary level, just 38% of
schools had libraries at all. Less than 11% of schools had any certificated library staffing, and
just 4.1% had full-time certificated staff, compared to over 50% nationally. The first
recommendation in that report was for legislative action to ensure adequate staffing of school
libraries at all levels. While there was a substantial response to this report through state and
federal funding, no staffing levels were mandated by the state. When the economic tide turned in
the late 1970s, library programs were decimated, so that by the 1987 publication of The Crisis in
California School Libraries (Brandes), California once again had the lowest certificated staffing
ratios in the country. After a major push through the 1990s for state level funding of school
libraries, for four years the California Public School Library Act provided dedicated funding at a
level of over $28 per student. While this funding revitalized many school libraries, the state
legislature made no efforts to mandate certificated staffing levels. When funding dried up,
California regained its spot at the bottom of all 50 states in certificated library staffing (Everhart,
2003).
Successful school library programs are much more than books, bytes and buildings. As
results from this study demonstrate, the level of library staffing, both certificated and clerical, is
directly related to the kinds and number of services such programs provide. And at the middle
and high school level, where there is at least a critical mass of professional staffing, the levels of
staffing are directly related to student achievement. At all grade levels, the levels of services
regularly provided by the library program are significantly related to student achievement. As an

191
indirect indicator of student achievement, the services a school library program provides is
significantly related to the levels of both certificated and total staffing levels. These findings
confirm a host of prior research on the relationship between school libraries and student
achievement.
It is more than ironic that school districts are willing to spend hundreds of thousands of
dollars on reading programs and staff development which have had limited success in boosting
test scores, but are unwilling to invest in school library programs that show such direct
correlations to student success. It is, in fact, an inequity to the California students who are
deprived of such programs.
There is only one sustainable way to advocate for support of school library programs, and
that is through success. School library programs must contribute to student success as defined by
the larger school communities of which they are a part. It is hoped that this study will serve
efforts to garner support for more staffing of all types in California’s school libraries. But the
impact of school library programs on standardized test scores is just one measure of such
success, and in the opinion of many educators, not the most important. The professional and
academic communities are just at the beginning in their efforts to demonstrate just how critical
school libraries are to student success.
Implications
The results of this study differ markedly from those of the Sinclair-Tarr and Tarr study
(2004). External factors as well as study design may account for the contrast. Sinclair-Tarr and
Tarr’s most recent data were from the 2001-2002 school year, five years older than the data used
in this study. While school library programs’ efforts prior to No Child Left Behind may have
contributed to increased test scores, those increases may have been a byproduct of an emphasis

192
on other learning goals. In the interim between the Sinclair-Tarr and Tarr study and now, school
library programs have increasingly focused on ways to facilitate increases in test scores. In
addition, the design of this study differed from the earlier study in some key ways. The authors
of the previous study (Sinclair-Tarr & Tarr, 2004) only examined the absence or presence of the
certificated librarian, rather than the levels of such staffing; nor were total staffing levels
considered as a variable. Furthermore, the control variable used, the School Characteristics
Index, did not, as a school-wide metric, account for the variances in the individual grade level
test scores used to measure student achievement. In addition to including levels of certificated
and total staffing as independent variables, the design of the current study also employs more
traditionally utilized school and community control variables.
In this study, the level of total staffing increased substantially by grade level. Out of
3,528 elementary schools participating in this study, just 43, or 1.2%, had at least full-time
staffing for both a clerk and a certificated school librarian. Out of 1095 middle school libraries,
102,or 8.5%, reported a full-time librarian and a full-time clerk. At the high school level, out of
987 school libraries, 299, or 30.3%--reported both positions filled full-time. The discrepancy in
these numbers suggests there is almost non-existent support for professional staffing at the
elementary level, and only poor support at the middle school level. The ability of a library media
specialist to be effective at an individual site depends upon more than just his own skills. He
must also work in a setting that values the role of the school library. Bell and Totten (1991), in
their study of school climate factors related to collaboration between classroom teachers and
library media specialists, provide evidence to suggest that the effectiveness of library media
specialists may be influenced by organizational and institutional characteristics that require the
attention of the principal and other site and district level administrators and school board

193
members. Since the early 1980s there have been several studies offering evidence that principals,
in particular, exert a strong influence over the extent and quality of planning and teaching
collaborations between classroom teachers and library media specialists (Aaron, 1981; Farwell,
1998; Gehlken, 1994; Hartzell, 2003; Haycock, 1995; Mocek, 2002; Slygh, 2000; Tallman &
Donham van Deusen, 1994; Underwood, 2004; Yetter, 1994). In his 1995 literature review,
“Research in Teacher-Librarianship and the Institutionalization of Change,” Haycock states that
“the role of the principal is the key factor in the development of an effective school library media
program” (p. 231). Yet a recent Indiana study (Lance, Rodney & Russell, 2007) about
principals’ perceptions of library media specialists’ roles indicate from survey data that nearly
90% of principals’ knowledge of what library media specialists do comes from their experience
on the job, and just 7% of principals reported learning about school libraries through their own
coursework. At the high school level in California, the sheer number of library media
specialists, as well as the overall percentage, provides opportunities for many more principals
and other administrators to experience the beneficial effects of a well-run program first-hand,
and so may come to a school with a predisposition to support adequate staffing levels. But just
4% of this state’s elementary school principals even have an opportunity to see a full-time library
media specialist in action, and just over 1% have an opportunity to observe a library media
specialist in action with a full-time clerical assistant. Elementary school principals cannot
support what they have not seen.
In spite of the low staffing levels at the elementary and middle school levels, results of
this study indicate that as the overall percentage of library media specialists at a grade level
increases, so does the strength of the association between school library program elements and
student achievement. The same trend holds for total staffing levels.

194
At the high school level, implications for policy makers are clear. At a time when
achievement on standardized tests is so strongly weighted in assessing the overall success of
schools, investment in a robust school library program should be a primary goal. Certificated
staffing levels, total staffing levels, total budgets, collection sizes, and total technology available
in the library all correlated with test scores with r values between .32 and .60, p <.001 when
controlling for school and community variables, and the library factor was a better predictor of
test scores than other school variables. Any school or district that decides not to invest in school
library programs must account for that decision in terms of the public charge of equitable access
to a quality education for all public school students.
Strong correlations between test scores and the instructional roles regularly provided by
library media specialists at the high school level also offer some indicators for certificated staff
and their administrative supervisors about how to allocate library work time. Providing reference
assistance; instructing students in research strategies, use of resources and information literacy;
and communicating proactively with the principal were among those activities that were most
strongly related to student achievement. Library media specialists who develop methods to
describe and measure these activities and share them with school leadership can help the larger
school community build understanding about the library program’s critical instructional role.
At the middle school level, the implications are less clear, but results of this study suggest
that investment in a school library program may lead to increased student achievement. School
and district officials, as well as library media specialists, may seek to investigate best practice at
schools with successful school library media programs; implementation of such programs holds
great potential for higher student achievement. While correlations were weakest at the
elementary level, a similar investigation of best practice among successful school library

195
programs would constitute a positive first step in creating school libraries that are truly viable
with the elementary population.
In the absence of strong correlations to test scores at the elementary school level, the
connection between staffing levels and activities like the following may inform the decisions of
school board members, district and school administrators, and school site council members in
setting budget priorities:
• Instructing students in the use of resources
• Providing reference assistance
• Providing reading, listening and viewing guidance for students
• Providing instruction on Internet searching and research
• Offering curriculum-integrated information literacy instruction
At all levels, including elementary, the services that the library program regularly provided its
school community were directly related to the amounts of both certificated and total library
staffing, and with few exceptions, total staffing more strongly correlated with delivery of those
services than did certificated staffing alone.
Library media specialists and the academic community must lead the effort to identify the
best practices which connect school library programs at the high school level so strongly to
student achievement. They must lead parallel efforts at the elementary and middle school, where
a critical mass of successful school library programs does not appear to exist. The best practices
of successful school library programs at all levels must also be shared with pre-service teachers
and administrators in their credential programs. Because there are so few certificated library
professional grades k-8, many teachers and administrators will never have the opportunity to
experience the benefits of a strong library program first-hand unless that happens as part of their

196
formal training. Schools of library and information science must create partnerships with pre-
service programs to accomplish this goal. Practitioners can join this partnership by working with
pre-service teachers to plan model units and with pre-service administrators to develop
educational visions that takes advantage of the school library in facilitating student success.
Recommendations for Further Research
There are several questions that remain to be explored with the data sources used in this
study. CST scores can be disaggregated by ethnicity, and in California, where Hispanic and
African-American students’ scores lag behind that of the general population, it would be useful
to know if there is a relationship between achievement in these sub-groups and school library
media programs. Another avenue for exploration available through this data is the relationship
between school library programs and drop-out rates; California recently changed the process for
tracking students, and this new method is said to provide a considerably more reliable drop-out
statistic than was previously possible. This particular issue is one way to use a quantitative
methodology to broaden the investigation of the relationship between school library programs
and the overall success of schools.
Fundamentally, though, this study provides a baseline of data that can be used to pursue
qualitative research about school library programs. This study highlights the disparity in the
strength of relationships between California’s school library media programs and test scores
from elementary through high school levels. It is truly a story of the haves, the halves, and the
have-nots. Research is recommended to examine the reasons for this disparity, which may
include investigations into the role of administrative leadership at schools whose school library
programs contribute to higher academic achievement, whether best practice looks the same at all

197
levels, and whether developmental differences in students or structural differences in the
organization of schools may require different emphases for school library programs at different
grade levels.
The American Association of School Librarians’ (AASL) “Standards for the 21st Century
Learner” (2007) describes a range of real-world problem-solving abilities students need to
develop, including locating, evaluating, and synthesizing information from a variety of sources,
considering problems from a variety of perspectives, using technology tools to organize and
analyze data and present information, and maintaining the resiliency and intrinsic motivation to
complete lengthy and complex tasks. The shift in focus from what the library media specialist
does to what the student should accomplish necessitates measurement tools that better capture
how well students meet these standards than do the current standardized tests. Results from this
study might also serve as a starting point for qualitative research that more deeply explores ways
school library programs contribute to student achievement in these areas.

198
APPENDIX A
SCHOOL LIBRARY SURVEY 2006-2007
(Reproduced with permission from the California Department of Education)

199

200

201

202

203

204
APPENDIX B
LETTER FROM CALIFORNIA DEPARTMENT OF EDUCATION

205

206
APPENDIX C
ELEMENTS OF LOERTSCHER’S TAXONOMY OF SCHOOL LIBRARIES AND
BIVARIATE CORRELATIONS, LIBRARY SERVICES AND U.S. HISTORY SCORES, GRADE 11.

207
Table 70
Elements of Loertscher’s Taxonomy of School Libraries and Bivariate Correlations, Library Services and U.S. History Scores, Grade 11. Collaboration r
Collaborated with teachers to develop, implement, and evaluate student learning two or more hours per week
.29**
Provided teachers with information about new resources .49**
Provided reference assistance to students and teachers .47**
Planned or conducted workshops for teachers .22**
Assisted school curriculum committee with recommendations .25**
Reading
Provided reading, listening, and viewing guidance for students
.35**
Information Literacy
Offered a program of curriculum-integrated information literacy instruction
.39**
Provided instruction on Internet searching and research .44**
Enhancing learning through technology
Provided access to online library catalog and circulation .46**
Provided Internet access for students in the library .47**
Provided instruction on Internet searching and research .44**
Coordinated school or library computer networks .28**
Provided electronic access to a resource sharing network .29**
**p <.001
208
APPENDIX D ELEMENTS OF TODD & KULTHAU’S MODEL OF THE SCHOOL LIBRARY AS
DYNAMIC AGENT OF LEARNING AND BIVARIATE CORRELATIONS, LIBRARY SERVICES AND U.S. HISTORY SCORES, GRADE 11

209
Table 71 Elements of Todd & Kulthau’s Model of the School Library as Dynamic Agent of Learning and Bivariate Correlations, Library Services and U.S. History Scores, Grade 11 Resource Agent r
Informally instructed students in the use of resources .47**
Provided teachers with information about new resources .49**
Provided reference assistance to students and teachers .47**
Helped students & teachers find and use resources outside school library .41**
Facilitated interlibrary loan for students and teachers .20**
Information Literacy Agent
Offered a program of curriculum-integrated information literacy
instruction
.39**
Provided instruction on Internet searching and research .44**
Knowledge Construction Agent, Academic Achievement Agent
Collaborated with teachers to develop, implement, and evaluate student
learning two or more hours per week
.29**
Independent Reading and Personal Development Agent:
Provided reading, listening, and viewing guidance for students .34**
Helped parents realize importance of lifelong learning .20**
Provided teachers with information about new resources .49**
Technological Agent
Provided access to online library catalog and circulation .46**
Provided Internet access for students in the library .47**
Provided instruction on Internet searching and research .44**
Coordinated school or library computer networks .28**
Provided electronic access to a resource sharing network .29** **p <.001

210
REFERENCES
Aaron, S.L. (1972). A review of selected research studies in school librarianship 1967-971: Part I. School Libraries 21 (Summer), 29-46.
Aaron, S. L. (1981). The instructional role of the school library media specialist: What research says to us now. School Media Quarterly 9(4), 281-285.
Achterman, D. (2007). The sower: an interview with Keith Curry Lance. School Library Journal 53(10), 50-53.
Ahern, M.E.(1905). The library as an educational factor. The Elementary School Teacher 5(5), 278-284.
Ainsworth, L. (1969). An objective measure of the impact of a library learning center. School Libraries 18(2), 33-35.
Akerhielm, K. (1995). Does class size matter? Economics of Education Review 14(3), 229-241.
Alexander, K.L., Entwisle, D.R., & Dauber, S.L. (1996). Children in motion: School transfers and elementary school performance. Journal of Educational Research 90(1), 3-12.
American Association of School Librarians (AASL) (1960). Standards for school library programs. Chicago: American Library Association.
American Association of School Librarians (2006). Position statement on appropriate staffing for school library media centers. Retrieved September 29, 2008 from http://www.ala.org/ ala/aasl/aaslproftools/positionstatements/aaslpositionstatementappropriate.cfm.
American Association of School Librarians (2007). Standards for the 21st century learner. Chicago: American Library Association.
American Association of School Librarians & Association for Educational Communications and Technology (AASL & AECT) (1975). Media programs: District and school. Chicago: American Library Association.
American Association of School Librarians & Association for Educational Communications and Technology (AASL & AECT) (1988). Information power: Guidelines for school library media programs. Chicago: American Library Association.
American Association of School Librarians & Association for Educational Communications and Technology (AASL & AECT) (1998). Information power: Building partnerships for learning. Chicago: American Library Association.

211
American Association of School Librarians & Department of Audiovisual Instruction of the National Education Association (AASL & DAVI) (1969). Standards for school media programs. Chicago: American Library Association.
American Library Association (ALA) (1920). Standard library organization and equipment for secondary schools of different sizes; Report of the Committee on Library Organization and Equipment. Chicago: Author.
American Library Association (ALA) (1925). Elementary school library standards. Report of the Joint Committee on Elementary School Library Standards. Chicago: American Library Association and National Education Association.
American Library Association (ALA) Committees on Post-war Planning (1945). School libraries for today and tomorrow, functions and standards. Chicago: American Library Association.
American Library Association (ALA) Education Committee (1927). School library yearbook-Number 1. Chicago: American Library Association.
American Library Association (ALA) Education Committee (1928). School library yearbook-Number 2. Chicago: American Library Association.
Archon, M. (2003). A study of perceptions of the impact of new funding on library media teachers’ and paraprofessionals’ provision of service toward library clients in school libraries. Retrieved from Proquest Digital Dissertations (AAT 3100046).
Austin, M.C., & Morrison, C. (1963). The Harvard report on reading in elementary schools. New York: Macmillan Company.
Baughman, J. C. (2000). School libraries and MCAS scores. Unpublished paper presented at a symposium sponsored by the Graduate School of Library and Information Science, Simmons College. Retrieved October 9, 2008 at http://web.simmons.edu/~baughman/mcas-school-libraries/Baughman%20Paper.pdf
Baule, S. (1997). The technology planning process and the school library media specialist. Retrieved from Proquest Digital Dissertations database (AAT 9805167).
Baumbach, D.J. (2003). Making the grade: The status of school library media centers in the Sunshine State and how they contribute to student achievement. Salt Lake City, UT: Hi Willow Research and Publishing.
Baxter, S.J., & Smalley, A.W. (2003). Check it out! Results of the school library media program census. Saint Paul, MN: Metronet.

212
Beaird, Marilyn Miller. (1999) The effect of increased collaboration among the library media specialist and school personnel on perceptions of the roles and responsibilities of the library media specialist. Retrieved from Proquest Digital Dissertations database (AAT 9987938).
Bell, M.D. (1990). Elementary school climate factors and personality and status variables associated with school library media specialists chosen by classroom teachers for cooperation on instructional problems. Retrieved from Proquest Digital Dissertations database (AAT 9114100).
Bell, M., & Totten, H.L. (1991). School climate factors related to degrees of cooperation between public elementary school teachers and school library media specialists. Library Quarterly 61(3), 293-310.
Bell, M., & Totten, H.L. (1992). Cooperation in instruction between classroom teachers and school library media specialists. A look at teacher characteristics in Texas elementary schools. School Library Media Quarterly 20(2), 79-85.
Bingham, J.E.M.(1994). A comparative study of curriculum integrated and traditional school library media programs. Achievement outcomes of sixth-grade student research papers. Retrieved from Proquest Digital Dissertations database (AAT 9517451).
Borland, M.V., Howsen, R.M., & Trawick, M.W. (2005). An investigation of the effect of class size on student achievement. Education Economics 13(1), 73-83.
Bostwick, A.W. (1915). School libraries and mental training. The School Review 23(6), 395-405.
Bowie, M.M. (1984). Do media programs have an impact on student achievement? Instructional Innovator 29, 18-20.
Bowman, E.L., & Dillon, J. (1942). The librarian and the teacher of music. Chicago: American Library Association.
Brandes, B. (1987). The crisis in California school libraries: A special study. Sacramento: California State Department of Education.
Breck, E. (1916). The efficient high-school library. English Journal 5(1), 10-19.
Broadway, M.D., & Baldridge, S. (1988). Prescription for excellence in instruction. Clearing House 61, 277-279.
Bruning, Michael James (1994) A statistical analysis of the relationship between student achievement and spending for libraries in Ohio public schools. Retrieved from ProQuest Digital Dissertations database (AAT 9500561).

213
Burgin, R., Bracy, P. B., & Brown, K. (2003). An essential connection: How quality school library media programs improve student achievement in North Carolina. RB Software & Consulting. Retrieved 10 October, 2008 from http://www.rburgin.com/NCschools2003/ NCSchoolStudy.pdf.
California Department of Education (2006). 2005 Academic Performance Index base report: Information guide. Retrieved September 18, 2008 from http://www.cde.ca.gov/ta/ac/ap/documents/infoguide05b.pdf.
California Department of Education (2007). 2006-2007 APR Glossary—Base API. Retrieved September 18, 2008 from http://www.cde.ca.gov/ta/ac/ap/glossary07b.asp.
California Education Code (2007). Retrieved September 19, 2008 from http://www.leginfo.ca.gov/cgi-bin/calawquery?codesection=edc&codebody=&hits=20.
California School Library Association (CSLA) (2004). Standards and guidelines for strong school libraries. Sacramento: Author.
Callison, D. (1990). A review of the research related to school library media collections: Part I. School Library Media Quarterly 19(1), 57-62.
Callison, D. (2004) Survey of Indiana school library media programs: A collaborative project between the Association for Indiana Media Educators & Indiana University. Indianapolis: Association for Indiana Educators and Indiana University. Retrieved September 30, 2008, from http://www.ilfonline.org/Assets/ilf_assets/pdf/yhba/SurveyofInSchoolLibraries04.pdf.
Callison, D., & Preddy, L. (2006). The blue book on literacy and instruction for the information age. Englewood, CO: Libraries Unlimited
Cecil, H., & Heaps, W. (1940). School library services in the United States: An interpretive survey. New York: H.W. Wilson Company.
Certain, C.C. (1924). The elementary-school library defined in terms of books conservation and library service. Elementary School Journal 24(5), 357-364.
Clabo, C. A. (2002). A study of the library use practices of high school students in three east Tennessee counties. Retrieved from Proquest Digital Dissertations database (AAT 3042412).
Cleaver, B.P., & Taylor, W.D. (1989). The instructional consultant role of the school library media specialist. Chicago: American Library Association.

214
Clifton, Nicole S. (2006) An examination of home and school technology access and usage in relation to urban high school students and the achievement gap. Retrieved from ProQuest Digital Dissertations database. (AAT 3255989).
Commission on Teacher Credentialing (2007). Teacher Librarian services credential. State of California Commission on Teacher Credentialing. Retrieved 18 September, 2008 from http://www.ctc.ca.gov/credentials/leaflets/cl562.pdf.
Committees on Post-War Planning (1945). School libraries for today and tomorrow. Chicago: American Library Association.
Constantino, R. (2005). Print environments between high and low socioeconomic status (SES) communities. Teacher Librarian 32(3), 22-25.
Craver, K.W. (1986). The changing instructional role of the high school library media specialist: 1950-84. School Library Media Quarterly 14(4), 183-191.
Davies, R.A. (1969). The school library: A force for educational excellence. New York: R.R. Bowker Co.
Davis, J.C. (2007). Modeling the effects of class size reduction on student achievement. Retrieved from ProQuest Digital Dissertations database (AAT 3278553).
DeBlauw, R.A. (1973). The effect of a multi-media program on achievement and attitudes of elementary and secondary students. Retrieved from ProQuest Digital Dissertations database (AAT 7325217).
DeSouza, M. (2006). Succeeding in school: Exploring how academic achievement is possible for Mexican-Origin English learners. Retrieved from Proquest Digital Dissertations database (AAT 3226257).
Didier, E.K. (1982). Relationships between student achievement in reading and library media programs and personnel. Retrieved from Proquest Digital Dissertations database (AAT 8214981).
Didier, E.K. (1984). Research on the impact of school library media programs on student achievement: implications for school media professionals. In S. Aaron & P. R. Scales (Eds.), School Library Media Annual 1984 (pp. 343-361). Littleton, CO: Libraries Unlimited.
Donham van Deusen, Jean. (1993). The effects of fixed versus flexible scheduling on curriculum involvement and skills integration in elementary school library media programs. School Library Media Quarterly 21(3), 173-182.

215
Donham van Deusen, J., & Tallman, J.(1994). The impact of scheduling on curriculum consultation and information skills instruction. Part one: The 1993–1994 AASL/ Highsmith Research Award study. School Library Media Quarterly 23(1), 17–25.
Duke, N. K. (2000). For the rich it’s richer: Print experiences and environments offered to children in very low - and very high - socioeconomic status first-grade classrooms. American Educational Research Journal, 37(2), 441-478.
Ed-Data (2008). Education data partnership: Fiscal, demographic, and performance data on California’s K-12 schools. Retrieved September 25, 2008 from http://www.ed-data.k12.ca.us/welcome.asp.
Educational Testing Service. (2007). California Standards Tests (CST) Technical Report Spring 2006 Administration. Educational Testing Service. Retrieved October 14, 2008 from http://www.cde.ca.gov/ta/tg/sr/documents/startechrpt06.pdf.
Englehart, J. (2007) The centrality of context in learning from further class size research. Educational Psychology Review(19)4, 455-467.
Everhart, N. (2003). State mandates for teacher-librarians. Teacher Librarian 31(1), 26.
Farmer, L. (2006). Library media program implementation and student achievement. Journal of Librarianship and Information Science 38(1), 21-32.
Farwell, S.M. (1998). Profile of planning: A study of a three year project on the implementation of collaborative library media programs. Retrieved from Proquest Digital Dissertations database (AAT 9913911).
Fletcher, M. (1915). The struggling high-school library. English Journal 4(6), 357-361.
Gann, L. (1998). School library media standards and guidelines: A review of their significance and impact. In K. H. Latrobe (Ed.), The emerging school library media center: Historical issues and perspectives (pp. 153-194). Englewood, CO: Libraries Unlimited.
Gaver, M. V. (1962). Research on elementary school libraries. ALA Bulletin 56, 117-124.
Gaver, M.(1963). Effectiveness of centralized library service in elementary schools (2nd ed.). New Brunswick, New Jersey: Rutgers University Press.
Gehlken, V. S. (1994). The role of the high school library media program in three nationally recognized South Carolina Blue Ribbon secondary schools. Retrieved from Proquest Digital Dissertations database (AAT 9508143).
Grazier, M.H. (1979). The curriculum consultant role of the school library media specialist. Library Trends 28, 263–79.

216
Greve, C. (1977). The relationship of the availability of libraries to the academic achievement of Iowa school seniors. Retrieved from Proquest Digital Dissertations database (AAT 7501870).
Guidelines for California library media programs: School, district, county, state (1977). Burlingame, CA: California Media and Library Educators Association.
Hall-Ellis, S.D., & Berry, M.A. (1995). School library media centers and academic achievement in South Texas. Texas Library Journal 71, 94-97.
Hara, K. (1997). Significance of formal instruction for information skills in elementary schools. Education 118, 111-122.
Hartzell, G. (2003). Why should principals support school libraries? Teacher Librarian 31(2), 21-29.
Haycock, K. (1992). What Works: Research about teaching and learning throughout the school library’s resource center. Seattle: Rockland Press.
Haycock, K. (1995). Research in teacher-librarianship and the institutionalization of change. School Library Media Quarterly 23(4), 227-233.
Heinlein, L. M., & Shinn, M. (2000). School mobility and student achievement in an urban setting. Psychology in the Schools 37(4), 349-357.
Heller, F.M., & Labrant, L.L.(1938). The librarian and the teacher of English. Chicago: American Library Association.
Henne, F., & Pritchard, M. (1945). The librarian and the teacher of home economics. Chicago: American Library Association.
Hill, R., & DePascale, C. (2002). Determining the reliability of school scores. The National Center for the Improvement of Educational Assessment. Retrieved September 28, 2008 from http://www.nciea.org/publications/CCSSO02_Reliability_RHCD03.pdf.
Hinkle, D.E., Wiersma, W., & Jurs, S. (2003). Applied statistics for the behavioral sciences. Boston: Houghton Mifflin Company.
Holton, B., Bae, Y., Baldridge, S., Brown, M., & Heffron, D. (2004). The status of public and private school library media centers in the United States: 1999–2000, NCES 2004–313. Washington, DC: U.S. Department of Education National Center for Education Statistics.
Howell, M. (1968). School libraries in California. Sacramento: California State Department of Education.

217
Hutcheson, G., & Sofroniou, N. (1999). The multivariate social scientist: Introductory statistics using generalized linear models. Thousand Oaks, CA: Sage Publications.
IRB guidelines (2007). Office of Research and Economic Development, University of North Texas. Retrieved May 14, 2008 from http://research.unt.edu/ors/compliance/irbmanual.htm.
Ireland, L.(2001) The impact of school library services on student academic achievement: An annotated bibliography. Fifth edition. (ERIC Document Reproduction Service No. ED450807).
Jenkins, C.S.O. (2000). Empowering agent for Oklahoma school learning communities: An examination of the Oklahoma Library Improvement Program. Retrieved from Proquest Digital Dissertations database (AAT 3041907).
Jeffus, B. (2002). What's past is prologue: A timely look at school libraries. CSLA Journal 26(1), 11-14.
Jones, A.C. (1997). An analysis of the theoretical and actual curriculum development involvement of Georgia school library media specialists. Retrieved from Proquest Digital Dissertations database (AAT 9804388).
Jones, J.R. (1994). The teacher-librarian partnership in a literature based approach. Retrieved from Proquest Digital Dissertations database (AAT 9424113).
Jones, M.L. (1977). Survey of school media standards. Washington, D.C.: U.S. Department of Health, Education and Welfare.
Kennon, M.F., & Doyle, L.A. (1962). Planning school library development: A report of the school library development project, American Association of School Librarians, February 1, 1961-July 31, 1962. Chicago: American Library Association.
Keyes, R.K. (1914). How we use our school library. English Journal 3(2), 86-93.
Kirkland, N. C. (1993). Developing a sequential, relevant approach to research writing for high school juniors and seniors. Unpublished doctoral practicum. Nova University. (ERIC Document Reproduction Service No. ED361742, retrieved September 4, 2008 from http://www.eric.ed.gov/ERICWebPortal/recordDetail?accno=ED361742).
Krashen, S.D. (1995). School libraries, public libraries, and the NAEP reading scores. School Library Media Quarterly 23(4), 235-237.
Krashen, S.D.(2004). The power of reading: Insights from the research (2nd ed.). Westport, CT: Libraries Unlimited.

218
Kreiser, J. (1991) A comparative study of curriculum integrated and traditional school library media programs: Fifth-grade students' reading and media program attitudes and utilization. Retrieved from Proquest Digital Dissertations database (AAT 9218617).
Lance, K.C., Hamilton-Pennell, C., Rodney, M. J., Petersen, L., & Sitter, C. (1999). Information empowered: The school librarian as agent of academic achievement in Alaska schools. Revised Edition. Juneau, Alaska: Alaska State Library.
Lance, K.C., Hamilton-Pennell, C., & Rodney, M. J. (2005). Powerful libraries make powerful learners: the Illinois study. Canton, Illinois: Illinois School Library Media Association.
Lance, K.C., & Loertscher, D.V. (2005). Powering achievement: School library media programs make a difference: The evidence (3rd ed.). Salt Lake City, UT: Hi Willow Research & Publishing.
Lance, K.C., Rodney, M. J., & Hamilton-Pennell, C.H. (2000a). How school librarians help kids achieve standards: The second Colorado study. San Jose, CA: Hi Willow Research and Publishing.
Lance, K.C., Rodney, M.J., & Hamilton-Pennell, C.H. (2000b). Measuring up to standards: The impact of school library programs & information literacy in Pennsylvania schools. Pennsylvania: Pennsylvania Department of Education, Office of Commonwealth Libraries.
Lance, K.C., Rodney, M.J., & Hamilton-Pennell, C.H. (2001). Good schools have school librarians: Oregon school librarians collaborate to improve academic achievement. Terrebonne, OR: Oregon Educational Media Association.
Lance, K.C., Rodney, M. J., & Hamilton-Pennell, C.; (2002). How school libraries improve outcomes for children: The New Mexico study. Santa Fe, NM: New Mexico State Library.
Lance, K.C., Rodney, M.J., & Russell, B. (2007). How students, teachers, and principals benefit from strong school libraries: The Indiana study. Indianapolis, IN: Association for Indiana Media Educators.
Lance, K.C., Welborn, L., & Hamilton-Pennell, C.H.; (1993). The impact of school library
media centers on academic achievement. Castle Rock, Colorado: Hi Willow Research and Publishing.
Leech, N.L. (2005). SPSS for intermediate statistics: Use and interpretation. Mahwah, N.J: Lawrence Erlbaum.

219
Lester, J., & Latrobe, K. (1999). The education of school librarians. In K. H. Latrobe (Ed.), The emerging school library media center: Historical issues and perspectives (pp. 1-15). Englewood, CO: Libraries Unlimited.
Libraries and the Learning Society Advisory Board. (1984). Alliance for excellence: Librarians respond to A Nation at Risk. U.S. Department of Education. Washington, D.C.: Government Printing Office.
Loertscher, D.V. (1973). Media center services to teachers in Indiana senior high schools, 1972-1973. Retrieved from ProQuest Digital Dissertations database (AAT 7400395).
Loertscher, D.V. (2000). Taxonomies of the school library media program. 2nd edition. San Jose: Hi Willow Research and Publishing.
Loertscher, D.V., Ho, M. L., & Bowie, M. M. (1987). "Exemplary elementary schools" and their library media centers: A research report. School Library Media Quarterly, 15(3), 147-153.
Loertscher, D.V., & Land, P. (1975). An empirical study of media services in Indian Elementary Schools. School Library Media Quarterly 4(1), 8-18.
Los Angeles City School District Librarians (1933). The school library system of Los Angeles: A symposium prepared by the librarians. Los Angeles: Los Angeles City School District.
Lowe, J.L. (1984). A comparative analysis of reading habits and abilities of students in selected elementary schools in North Louisiana with and without centralized libraries. Retrieved from Proquest Digital Dissertations database (AAT 8423876).
Mancall, J. C. (1985). An overview of research on the impact of school library media programs on student achievement. School Library Media Quarterly 14(1), 33-35.
Manzo, K.K. (1999). Library spending regains some lost ground. Education Week 19(9), 3.
Marchant, M.P., Broadway, M.D., Robinson, E., & Shields, D.M. (1984). Research into learning resulting from quality school library media service. School Library Journal 30(8), 20-22.
Martin, B.A. (1996). The relationship of school library media center collections, expenditures, staffing, and services to student academic achievement. Retrieved from Proquest Digital Dissertations database (AAT 9700745).
Mayer, R.P. (2006, January 14). Riverside Unified: Outpouring of state money drops to a trickle; dwindling dollars; school libraries make do with decreasing funding. The Press Enterprise, p. B01.

220
McCarthy, C.A. (2006). Progress in school library media programs: Where have we been? Where are we now? And where are we going? Advances in Librarianship 30, 271-297.
McCracken, A. (2001). School library media specialists' perceptions of practice and importance of roles described in Information Power. School Library Media Research 4(42). Retrieved October 11, 2008 from http://www.ala.org/ala/mgrps/divs/aasl/aaslpubsandjournals/slmrb/slmrcontents/volume42001/mccracken.cfm.
McGregor, J. (2006). Flexible scheduling: Implementing an innovation. School Library Media Research 9. Retrieved September 24, 2008 from http://www.ala.org/ala/aasl/aaslpubsandjournals/slmrb/slmrcontents/volume9/ flexible.cfm.
McIntosh, C. (1994). The evolution of the role of the K-12 public school library media specialist. Retrieved from Proquest Digital Dissertations database (AAT 9422281).
McQuillan, J. (1998). The literacy crisis: False claims, real solutions. Portsmouth, NH: Heinemann.
Michie, J., & Holton, B. (2005). Fifty years of supporting children’s learning: A history of public school libraries and federal legislation from 1953 to 2000. Washington, D.C.: National Center for Education Statistics, U.S. Department of Education.
The Millbrook Report: The changing role of the school library. 1990. Brookfield, CT: The Millbrook Press, Inc. (ERIC Document Reproduction Service No. ED 340392).
Miller, J., Want, J., & Whitacre, L. (2003). Show-me connection: How school library media center services impact student achievement, 2002-2003. Jefferson City, MO: Missouri State Library. Retrieved October 12, 2008, from http://dese.mo.gov/divimprove/curriculum/librarystudy/libraryresearch.pdf
Miller, M.L., & Shontz, M.L. (1996). Live wires: “High-tech” media specialists get connected. School Library Journal 42(10), 26-32.
Miller, M.L., & Shontz, M.L. (1997). Small change: expenditures for resources in school library media centers, FY 1995-96. School Library Journal 43(10), 28-37.
Miller, M.L., & Shontz, M.L. (1998). More services, more staff, more money: A portrait of a high-service library media center. School Library Journal 44(5), 28-33.
Miner, L. B. (1905). Voluntary reading in the English high school. The School Review 13(2), 180-190.

221
Minor, B. (1985). ERIC research studies dealing with school library media programs: June 1981-June 1984. School Library Media Quarterly 13, 348-371.
Mocek, R.C. (2002). The influence of educational administrators' leadership behaviors on student achievement in reading. Retrieved from Proquest Digital Dissertations database (AAT 3055455).
Mosqueda, Barbara Ray (1999). The perceptions of the role of the library media program and the library media specialist in selected National Blue Ribbon Schools in Florida. Retrieved from ProQuest Digital Dissertations database (AAT 9923715).
National Center for Education Statistics (NCES) (2005). America’s public school libraries: 1953-2000. Jessup, MD: U.S. Department of Education ED Pubs.
National Center for Education Statistics (NCES) (2007). Digest of education statistics: 2006. Washington, D.C.: National Center for Education Statistics. Retrieved September 18, 2008 from http://nces.ed.gov/programs/digest/d06/tables/dt06_417.asp?referrer =list.
National Commission on Excellence in Education (1983). A Nation at Risk: The Imperative for Educational Reform. Washington, D.C.: U.S. Government Printing Office.
National Commission on Libraries and Information Science (NCLIS) (2006). School libraries work! New York: Scholastic Library Publishing. Retrieved October 11, 2008 from http://librarypublishing.scholastic.com/content/stores/LibraryStore/pages/images/slw_06.pdf.
Nelson, P.S., Simoni, J.M., & Adelman, H.S. (1996). Mobility and school functioning in the early grades. Journal of Educational Research 92(6), 347-353.
Neuman, S.B., & Celano, D. (2001). Access to print in low-income and middle-income communities: An ecological study of four neighborhoods. Reading Research Quarterly 36(1) 8-26.
Novljan, S. (1998).Pupils’ reading is better in schools with a librarian: evidence from Slovenia. Journal of Research in Reading 21(3), 228-231.
Oliver, S.Q. (2003). The role of the school library media specialist in the integration of computer technology in the high school curriculum. Retrieved from Proquest Digital Dissertations database (AAT 3115129).
Ontario Library Association (2006). School libraries & student achievement in Ontario. Toronto, Ontario: Ontario Library Association. Retrieved October 9, 2008 from http://www.accessola.com/data/6/rec_docs/ 137_eqao_pfe_study_2006.pdf.

222
Pedhazur, E.J. (1982). Multiple regression in behavioral research. New York: Holt, Rinehart and Winston.
Pender, K. (1984). Historical influences on the development of American school libraries to 1978. Audiovisual Librarian 10(4), 200-204.
Perie, M., Grigg, W., and Donahue, P. (2005). The nation’s report card: Reading 2005. U.S. Department of Education, National Center for Education Statistics. Washington, D.C.: U.S. Government Printing Office.
Putnam, E. (1996). The instructional consultant role of the elementary-school library media specialist and the effects of program scheduling on its practice. School Library Media Quarterly 25(1), 43-49.
Pond, P.B. (1998). The history of the American Association of School Librarians part I: Origins and development, 1890-1951 (pp. 57-72). In K. H. Latrobe (Ed.), The emerging school library media center: Historical issues and perspective. Englewood, CO: Libraries Unlimited.
Ready, D. D., & Lee, V.E. (2006, May). Optimal elementary school size for effectiveness and equity: Disentangling the effects of class size and school size. Symposium conducted at the conference What Do We Know about the Effects of School Size and Class Size?, sponsored by the Brookings Institution, Washington, D.C. Retrieved October 3, 2008 from http://www.brookings.edu/gs/brown/bpepconference/readylee_paper.pdf.
Rodney, M.J, Lance, K.C., & Hamilton-Pennell, C.H. (2002). Making the connection: Quality school library media programs impact academic achievement in Iowa. Bettendorf, IA: Mississippi Bend Area Education Agency.
Rodney, M.J, Lance, K.C., & Hamilton-Pennell, C.H. (2003). The impact of Michigan school librarians on academic achievement: Kids who have libraries succeed. Lansing: Library of Michigan.
Rojtas-Milliner, M.C. (2006). Hey, this school library isn't what it used to be: The change process and the sociopolitical realities of implementing a curricularly integrated high school information literacy program. Retrieved from Proquest Digital Dissertations database (AAT 3224035).
Roscello, F. (2004). Standards--Our earliest history. Knowledge Quest 32(4), 6-8.
Ross, K.N. (2007). Making the grade: Is there a connection among school factors, student standardized test scores, and adequate yearly progress? Retrieved from Proquest Digital Dissertations database (AAT 3291644).

223
Russell, M. (2002). California’s public school accountability system. Williams watch series: Investigating the claims of Williams v. State of California (University of California, Los Angeles). Los Angeles: UCLA’s Institute for Democracy, Education & Access. Retrieved August 14, 2007 from http://repositories.cdlib.org/idea/wws/wws-rr006-1002.
Ryan, A.H. (2006) The digital divide: Lived experiences of elementary teachers and children in low- and high-income communities. Retrieved from Proquest Digital Dissertations database (AAT 3245889).
Saunders, H.E. (1975). The modern school library (2nd ed.). Metuchen, NJ: Scarecrow Press, Inc.
School libraries struggle to survive in California (1993, May 10). New York Times, p. A12.
School libraries (2007, January 29). San Jose Mercury News, p. B2.
Siebens, C.R., & Bartlett, W.L. (1942). The Librarian and the Teacher of Science. Chicago: American Library Association.
Simonitus, J. (2002). California school library media centers and student achievement: A survey of issues and network applications. SBC Pacific Bell. Retrieved September 30, 2008 from http://www.kn.pacbell.com/survey/k12libraries.pdf.
Sinclair-Tarr, S.L., & Tarr, W.W. (2004). Using large scale assessments to evaluate the effectiveness of school library programs in California. Retrieved from Proquest Digital Dissertations database (AAT 3191660).
Slygh, G.L. (2000). Shake, rattle and roll! The effects of professional community on the collaborative role of the school librarian. Retrieved from Proquest Digital Dissertations database (AAT 9982268).
Smalley, T. (2004). College success: High school librarians make the difference. Journal of Academic Librarianship 30(3), 193-198.
Smith, C., Constantino, R., & Krashen, S. (1997). Differences in print environment for children in Beverly Hills, Compton and Watts. Emergency Librarian 24(4), 8-9.
Smith, E.G. (2001). Texas School Libraries: Standards, Resources, Services, and Students’ Performance. Austin, Texas: EGS Research & Consulting.
Smith, E. G. (2006). Student Learning through Wisconsin school library media centers. Madison: Wisconsin Department of Public Instruction.
Squire, J.R., Applebee, R.K., & Lucas, R.A. (1967). Student reading and the high school library. School Libraries (Summer), 11-19.

224
STAR Technical Assistance Center (2006). 2006 California standardized testing and reporting post-test guide technical information for STAR district and test site coordinators. California Department of Education. Retrieved October 9, 2007 from http://www.startest.org/pdfs/STAR.post-test_guide.2006.pdf.
Statistics about California school libraries (2007). California Department of Education. Retrieved September 14, 2008 from http://www.cde.ca.gov/ci/cr/lb/libstats.asp.
Tallman, J.I., & Donham van Deusen, J. (1994). Collaborative unit planning: Schedule, time, and participants. Part One: The 1993-94 AASL/Highsmith Research Award study. School Library Media Quarterly 23(1), 33–37.
Technical Design Group (2000). Construction of California’s 1999 school characteristics and similar schools ranks (No. 00-1). Sacramento, CA: California Department of Education.
Todd, R. (1999). Transformational leadership and transformational learning: Information literacy and the World Wide Web. NASSP Bulletin 83(605), 4-12.
Todd, R.J., & Kuhlthau, C.C. (2004). Student learning through Ohio school libraries: Background, methodology and report of findings. Ohio Educational Library Media Association. Retrieved May 10, 2005 from http://www.oelma.org/StudentLearning/documents/OELMAReportofFindings.pdf
Underwood, Linda Jean (2004). A case study of four school library media specialists' leadership in Louisiana. Retrieved from Proquest Digital Dissertations database (AAT 3132971).
Urbina, S. (2004). Essentials of psychological testing. Hoboken, N.J.: John Wiley & Sons.
Valenza, J. (2007). Virtual libraries and high school students’ information seeking. In M.K. Chelton & Colleen Cool (Eds.), Youth information seeking behavior II: Context theories, models, and issues (pp. 207-255). Lanham, MD: The Scarecrow Press.
Voelker, A. (2006). How six fourth graders experienced and understood literacy events during one year in a quality school library. Retrieved from Proquest Digital Dissertations database (AAT 3230039).
Warnken, P. (2004). Managing Technology: The impact of technology on information literacy in libraries. The Journal of Academic Librarianship,30(2), 151-156.
Warschauer, M. (2000).Technology and school reform: A view from both sides of the track. Education Policy Analysis Archives, 8(4). Retrieved September 20, 2008, from http://epaa.asu.edu/epaa/v8n4.html.
Warschauer, M., Knobel, M., & Stone, L.(2004) Technology and equity in schooling: deconstructing the digital divide. Educational Policy 18(4), 562-588.

225
Wenglinsky, H. (1998). Does it compute?: The relationship between educational technology and student achievement in mathematics (policy information report). Princeton, NJ: Educational Testing Service.
Williams, J.W. (1987). Statistics of public and private school library media centers, 1985-86. Center for Education Statistics, Office of Educational Research and Improvement, U.S. Department of Education. Washington, D.C.: Superintendent of Documents, Government Printing Office. (ERIC Document Reproduction Service No. ED284545).
Wilson, H.E. (1928). Review: The high school library. [Review of the book The high school library: Its functions in Education]. The School Review 36(10), 794-795.
Woolls, B. (2005). The whole school library handbook. Chicago: American Library Association.
Wright, D. (2001). Student mobility: A negligible and confounded influence on student achievement. Journal of Educational Research 92(6), 347-353.
Yetter, C.L. (1994). Resource-based learning in the information age school: The intersection of roles and relationships of the school library media specialist, teachers, and principal. Retrieved from Proquest Digital Dissertations database (AAT 9426426).
Zweizig, D. L. (1999). Access and use of library resources in Library Power. School Libraries Worldwide 5(2), 16–28.