Embed Size (px)
DESCRIPTION
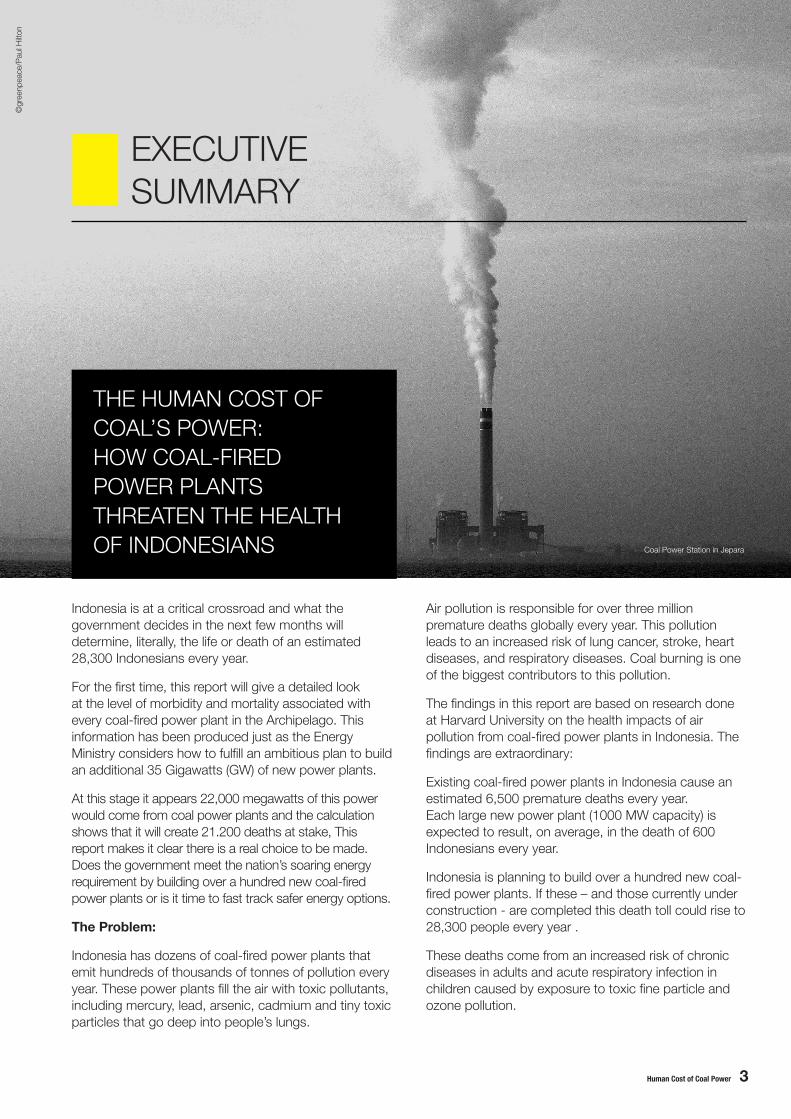
HOW COAL-FIRED POWER PLANTS THREATEN THE HEALTH OF INDONESIANS. Indonesia is at a critical crossroad and what the government decides in the next few months will determine, literally, the life or death of an estimated 28,300 Indonesians every year. For the first time, this report will give a detailed look at the level of morbidity and mortality associated with every coal-fired power plant in the Archipelago. This information has been produced just as the Energy Ministry considers how to fulfill an ambitious plan to build an additional 35 Gigawatts (GW) of new power plants.
Citation preview

Human Cost of Coal Power 1
How coal-fired power plants threaten the health of Indonesians
August 2015
HUMAN COST OF
COALPOWER

2 Human Cost of Coal Power
Executive Summary 3
Chapter 1: Introduction 5
Chapter 2: Methodology 8
Chapter 3: A Sustainable Energy Future Cannot be Build on Coal 9
Chapter 4: Health Impacts of Coal-fired Power Plants 11
Chapter 5: Climate Change Impacts of Coal-fired Power Plants 16
Chapter 6: Environmental Impacts of Coal-fired Power Plants 17
Chapter 7: Status of coal-fired power plants in Indonesia 18
Chapter 8: Inadequate Legal Protection for the Right to Clean Air 20
Chapter 9: Case Studies 21
Chapter 10: Recommendations 25
APPENDIX 1: Methodology of the study 28
TABLE/FIGURES
Table 1.1 Estimated Current Impacts of Indonesia’s Coal-Fired Power Plants 5
Table 1.2 Projected Impacts of New Projects 5
Figure 1 Air Pollutants From Coal Power Plants And Their Health Risk 14
TABEL OFCONTENTS
Human Cost of Coal Power 3
Indonesia is at a critical crossroad and what the government decides in the next few months will determine, literally, the life or death of an estimated 28,300 Indonesians every year.
For the first time, this report will give a detailed look at the level of morbidity and mortality associated with every coal-fired power plant in the Archipelago. This information has been produced just as the Energy Ministry considers how to fulfill an ambitious plan to build an additional 35 Gigawatts (GW) of new power plants.
At this stage it appears 22,000 megawatts of this power would come from coal power plants and the calculation shows that it will create 21.200 deaths at stake, This report makes it clear there is a real choice to be made. Does the government meet the nation’s soaring energy requirement by building over a hundred new coal-fired power plants or is it time to fast track safer energy options.
The Problem:
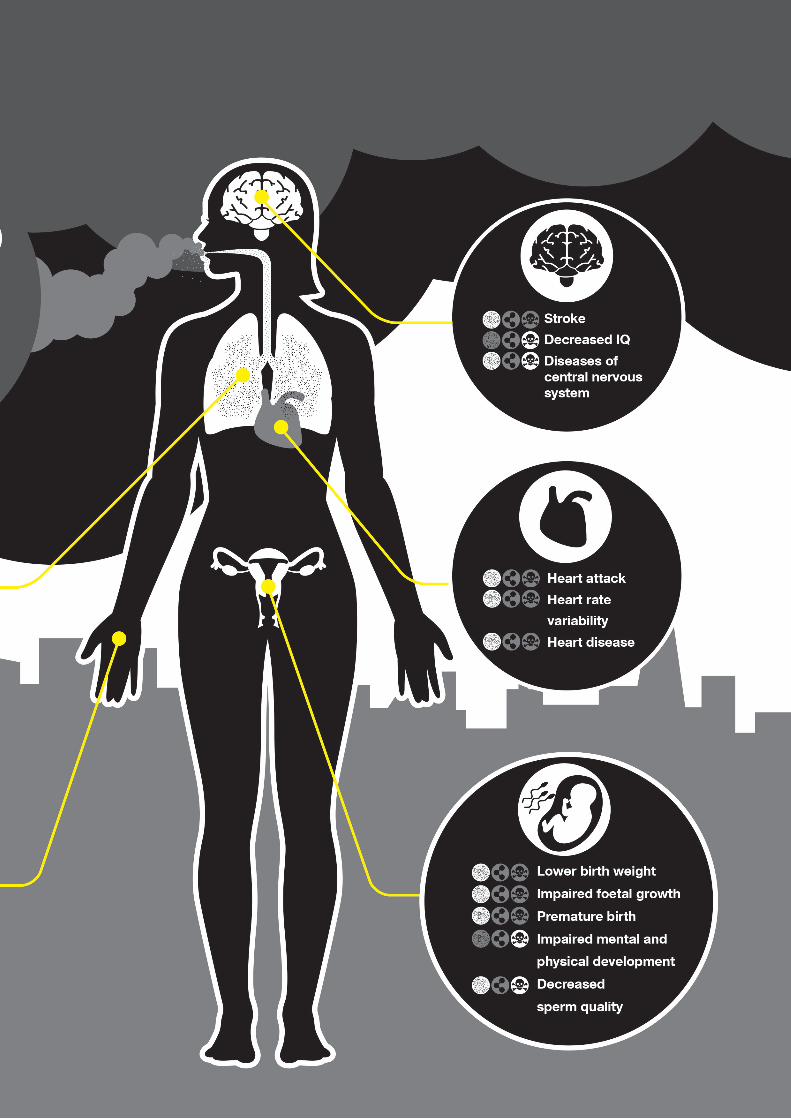
Indonesia has dozens of coal-fired power plants that emit hundreds of thousands of tonnes of pollution every year. These power plants fill the air with toxic pollutants, including mercury, lead, arsenic, cadmium and tiny toxic particles that go deep into people’s lungs.
EXECUTIVESUMMARY
Air pollution is responsible for over three million premature deaths globally every year. This pollution leads to an increased risk of lung cancer, stroke, heart diseases, and respiratory diseases. Coal burning is one of the biggest contributors to this pollution.
The findings in this report are based on research done at Harvard University on the health impacts of air pollution from coal-fired power plants in Indonesia. The findings are extraordinary:
Existing coal-fired power plants in Indonesia cause an estimated 6,500 premature deaths every year. Each large new power plant (1000 MW capacity) is expected to result, on average, in the death of 600 Indonesians every year.
Indonesia is planning to build over a hundred new coal-fired power plants. If these – and those currently under construction - are completed this death toll could rise to 28,300 people every year .
These deaths come from an increased risk of chronic diseases in adults and acute respiratory infection in children caused by exposure to toxic fine particle and ozone pollution.
THE HUMAN COST OFCOAL’S POWER:HOW COAL-FIREDPOWER PLANTSTHREATEN THE HEALTHOF INDONESIANS Coal Power Station in Jepara
©gr
eenp
eace
/Pau
l Hilt
on

4 Human Cost of Coal Power
Coal fired power plants compromise the health of entire communities. They generate pollution that sickens, and sometimes kills, people and causes extensive harm to agriculture, fisheries, the environment, finally it ultimately also damages the economy.
The Global market in structural decline:
The choice over how to power Indonesia into the 21st century just got easier with the realization that the global coal market is now in structural decline. Coal-fired power stations are shutting down in developed countries and China and many other developing countries are transitioning away from coal. Energy efficiency, renewable energy and a growing awareness of the true cost of coal are leading to an inexorable decline in the world’s appetite for this 19th century fuel supply.
For example, the United States has retired or scheduled the closure of coal plants. Indeed as 82.5 gigawatts of coal-fired energy was coming offline, the U.S. added 46 gigawatts of renewable energy from wind, solar, and geothermal technology. 1
Financial markets confirm this decline. The Dow Jones Total Coal Market index has fallen by 76% in the past five years. In the US, twenty-four coal companies have gone out of operation in the past three years, and one-sixth of the remaining companies are losing money.
Nor is the US alone in the movement away from coal. All the recent market data from China indicates a drastic change in coal use trends. This change is being
powered by communal outcry over the appalling air quality, an almost historic transition to renewable energy and a new economic growth strategy.
According to the International Energy Agency, Chinese thermal power generation in the first quarter of 2015 was down 3.7%, hydropower generation was up 17%, and wind and solar power generation were up over 20%. Chinese coal sales fell 4.7% in this quarter compared to the same time in 2014. Meanwhile, coal imports saw a dramatic 40% drop during the same period. A key element behind the reduction in China’s coal use is the massive air pollution emissions from coal burning, the main cause of the country’s crisis-level air pollution.
Global Divestment:
International Financial Institutions (IFIs), like the World Bank, US Export Import Bank, and the European Bank for Reconstruction and Development, have stopped investing in coal-fired plants, as has Norway’s sovereign wealth fund. Divestment movements against coal are proliferating around the globe Coalswarm reported; “that two-thirds of coal-fired power plants proposed worldwide since 2010 have been stalled or cancelled. The growth rate in coal-fired generating capacity is slowing, down from 6.9% in 2010 to 2.7% in 2013.” 2 This trend will make raising capital for new coal power capacity increasingly difficult and unlikely.
1 In June 2015, Alliant Energy committed to phase out additional 6 Coal Power Plant, resulting in total 200 coal power plant are scheduled to be phased out since 2010. http://content.sierraclub.org/coal/200
2 Coal mining: In the depths. The Economist. 2015.

Human Cost of Coal Power 5
It is estimated that coal power plants endanger the life of 6,500 every year in Indonesia and in total 7,100 people including outside Indonesia.
This shocking figure is established based on atmospheric modeling conducted by a research team at Harvard University Atmospheric Chemistry Modelling Group, using the cutting edge atmospheric chemistry-transport model GEOS-Chem. The research team found that air pollutants from operating coal power plants cause an estimated 7,100 premature deaths each year. The main causes of these premature deaths include strokes (2,800), ischemic heart disease (2,500), chronic obstructive pulmonary disease (430), lung cancer (350) and other cardiovascular and respiratory diseases (1,000). The health impacts also include 100 deaths of young children due to increased
risk of acute respiratory infections. 800 deaths are due to increased exposure to ozone, and the rest due to increased exposure to toxic particulate matter (PM2.5) due to emissions from power plants. (Table 1)
Plans to expand coal power plants will lead to even more premature deaths.
President Jokowi’s new energy plans, announced mid-2014 will nearly double the amount of coal power generation in Indonesia, compared to the old scenario.
The Old Energy Scenario
Before President Jokowi announced his new energy plans in 2014, Indonesia already planned to expand its coal power plants in the next decade and beyond to increase its power generation capacity by
INTRODUCTION1 STUDY ON PREMATURE DEATHS DUE TO COAL-FIREDPOWER PLANTS IN INDONESIA
Table 1.2 Projected Impacts of New Projects
Table 1.1 Estimated Current Impacts of Indonesia’s Coal-Fired Power Plants
WithinIndonesia
Stroke
2681
2761
380
427
323
347
179
185
5878
6180
115
118
480
801
6473 3700 9500
7099 3900 10500
2315
2459
Total TOTAL LOWER UPPER
Confidence interval (95%)
Ischemic Heart
Disease
ChronicObstructive
Pulmonary DiseaseLung
Cancer
Other cardiovascularand respiratory
diseases
Lower Respiratory Infections
Respiratory diseases
PM2.5 exposure to adults PM2.5 exposure to children
Ozone exposureto adults
Total including impacts outside
Indonesia
CURRENT
IMPACTS
WithinIndonesia
Stroke
6590
7581
935
1801
792
1057
440
545
14388
18796
282
407
1050
2027
15719 8900 23100
21231 11800 31300
5632
7812
Total TOTAL LOWER UPPER
Confidence interval (95%)
Ischemic Heart
Disease
ChronicObstructive
Pulmonary DiseaseLung
Cancer
Other cardiovascularand respiratory
diseases
Lower Respiratory Infections
Respiratory diseases
PM2.5 exposure to adults PM2.5 exposure to children
Ozone exposureto adults
Total including impacts outside
Indonesia
PROJECTED
IMPACTS

6 Human Cost of Coal Power
Projected increase in PM2.5 pollution levels causedby new coal-fired power plant projects in Indonesia,
annual average (μg/m3).
Projected increase in ozone pollution levels causedby new coal-fired power plant projects in Indonesia,
annual average (ppb).
PM2.5 pollution levels attributed to currentlyoperating coal-fired power plants in Indonesia, annual
average (μg/m3).
Ozone pollution levels attributed to currentlyoperating coal-fired power plants in Indonesia,
annual average (ppb).
CURRENT PROJECTED

Human Cost of Coal Power 7
approximately 20,000 megawatts with around 117 new coal plants. Our estimates of the deaths from projected additional coal plants are based on this Old Energy Scenario.
The New Energy Scenario
Since modeling and analysis for this report began, President Jokowi has put forth a new expansion plan for Indonesia’s power sector, which will see an additional 35 GW new power plants, 22,000 megawatts of which would come from coal power generation. These power plants under the New Energy Scenario is not captured in this study, but will clearly dramatically increase the existing estimate of mortality and mobility resulting from coal power generation.
The Harvard University modeling results indicate that if all the under construction or planned coal-fired power plants from the Old Energy Scenario in Indonesia are completed, their health impacts will soar to 28,300 premature deaths every year, increasing by 21,000 deaths from the current level. 2,800 of these deaths will result from exposure to ozone and the rest due to exposure to toxic particles. The causes of death would include stroke (7,600), ischemic heart disease (7,800), chronic obstructive pulmonary disease (1,800), lung cancer (1,100), other cardiovascular and respiratory diseases in adults (2,600), and acute respiratory infections in young children (400). In other words, on average, every new large coal-fired power plant would be responsible for approximately 600 avoidable deaths every year.
The scope of damage from air pollution caused by the coal power plant is not limited to the area in which the plants are located, but encompasses the entire nation. It is tragic that premature death due to the use of fossil fuel continues to increase in the 21st century, when they are avoidable given the continuous technological for energy solutions. Furthermore, the current plans to increase reliance on coal power in Indonesia directly contradict the global trend of recognizing the problems with fossil fuels and shifting to renewable energy.
©gr
eenp
eace
/Pau
l Hilt
on
Coal Power Station in Jepara
8 Human Cost of Coal Power
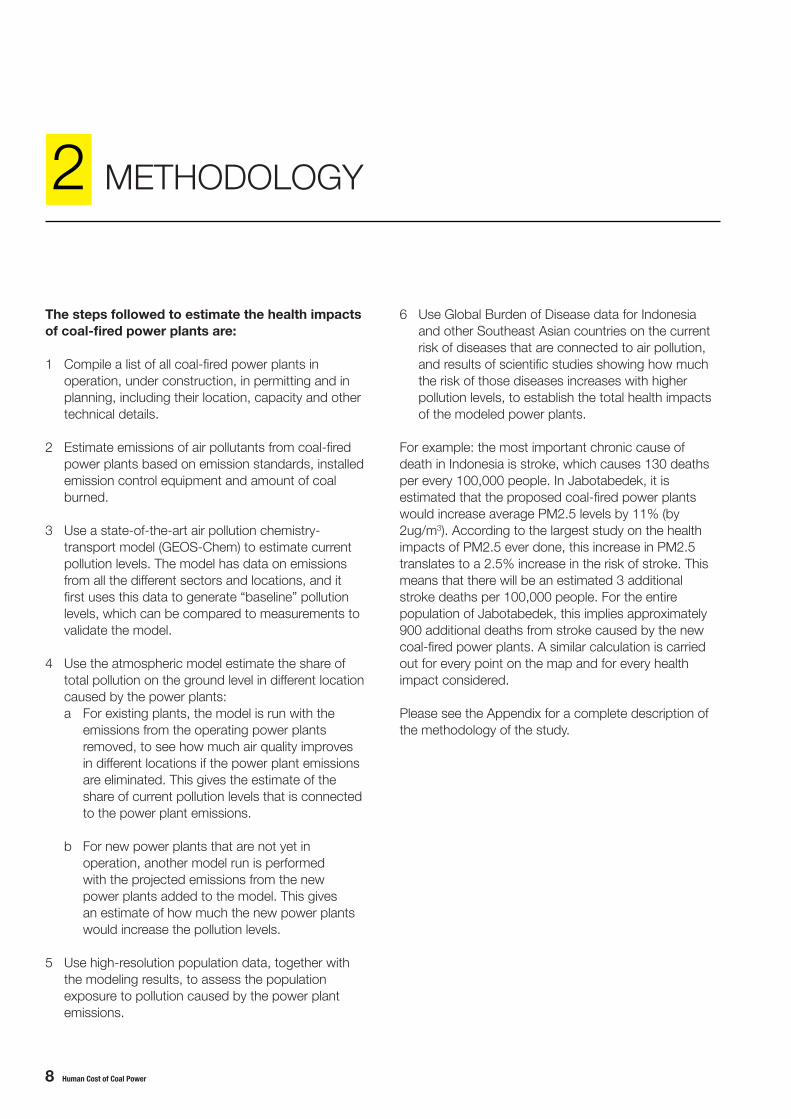
The steps followed to estimate the health impacts of coal-fired power plants are:
1 Compile a list of all coal-fired power plants inoperation, under construction, in permitting and in planning, including their location, capacity and other technical details.
2 Estimate emissions of air pollutants from coal-fired power plants based on emission standards, installed emission control equipment and amount of coal burned.
3 Use a state-of-the-art air pollution chemistry-transport model (GEOS-Chem) to estimate current pollution levels. The model has data on emissions from all the different sectors and locations, and it first uses this data to generate “baseline” pollution levels, which can be compared to measurements to validate the model.
4 Use the atmospheric model estimate the share oftotal pollution on the ground level in different location caused by the power plants:
a For existing plants, the model is run with theemissions from the operating power plants removed, to see how much air quality improves in different locations if the power plant emissions are eliminated. This gives the estimate of the share of current pollution levels that is connected to the power plant emissions.
b For new power plants that are not yet inoperation, another model run is performed with the projected emissions from the new power plants added to the model. This gives an estimate of how much the new power plants would increase the pollution levels.
5 Use high-resolution population data, together withthe modeling results, to assess the population exposure to pollution caused by the power plant emissions.
6 Use Global Burden of Disease data for Indonesiaand other Southeast Asian countries on the current risk of diseases that are connected to air pollution, and results of scientific studies showing how much the risk of those diseases increases with higher pollution levels, to establish the total health impacts of the modeled power plants.
For example: the most important chronic cause of death in Indonesia is stroke, which causes 130 deaths per every 100,000 people. In Jabotabedek, it is estimated that the proposed coal-fired power plants would increase average PM2.5 levels by 11% (by 2ug/m3). According to the largest study on the health impacts of PM2.5 ever done, this increase in PM2.5 translates to a 2.5% increase in the risk of stroke. This means that there will be an estimated 3 additional stroke deaths per 100,000 people. For the entire population of Jabotabedek, this implies approximately 900 additional deaths from stroke caused by the new coal-fired power plants. A similar calculation is carried out for every point on the map and for every health impact considered.
Please see the Appendix for a complete description of the methodology of the study.
METHODOLOGY2

Human Cost of Coal Power 9
Today, about 40% of the electricity generated 3 worldwide is from coal-fired power plants, damaging our planet and jeopardizing our children’s future. Coal generates pollutants during its entire life cycle, from mining, to transport, to processing, and finally to combustion for electricity generation.
Airborne pollutants from coal-fired power plants can be transported by wind, spreading over hundreds of kilometers and affecting human health and the environment. In recent years, there has been a growing recognition in scientific and medical communities of the severe health risks of fine particles (PM2.5) in these air emissions. Coal-fired power plants emit a large quantity of pollutants like NOx and SO2, the main ingredients in the formation of acid rain and a major ingredient of PM2.5 pollution. Coal plants also emit soot and dust contributing to PM2.5, as well as harmful chemicals like mercury and arsenic.
Coal related air pollution causes deaths and hospitalizations. 4 In 2011, the World Health Organization (WHO) compiled air quality data from 1,100 cities in 91 countries and found that residents living in many urban areas were exposed to persistently elevated levels of fine particle pollution and that coal-fired power plants were one of the main causes. 5
According to the International Energy Agency (IEA), although coal represented 29% of the world’s total primary energy supply in 2012, it accounted for 44% of global CO2 emissions. 6 Coal burning is the largest source of the planet’s GHG emissions, which are
A SUSTAINABLE ENERGY FUTURE CANNOT BE BUILD ON COAL3
triggering climate change. In 2009, James Hanson, then the head of the NASA Goddard Institute for Space Studies, contributed an article about CO2 emissions and environmental problems caused by coal to The Guardian, a British daily newspaper. In his article, “Coal-fired power stations are death factories. Close them,” Mr. Hanson stressed that coal is the single greatest threat to civilization and all life on our planet. 7
However, there is some good news. Coal-fired power stations are losing ground worldwide. These dirty relics of the last century are failing in the face of growing energy efficiency, evidence of the true costs of pollution, more affordable and reliable renewable resources, and a rising tide of community resistance across the world voicing their concerns against expansion of the coal industry. For example, the United States now has 187 coal plants retired or scheduled to be retired. In the same period that 23% (78 gigawatts) of coal-fired energy has been coming offline, the U.S. added 46 gigawatts of renewable energy from wind, solar, and geothermal technology. Financial markets confirm the decline of coal. The Dow Jones Total Coal Market index has fallen by 76% in the past five years. High-cost deep mines in the rich world have been hit the hardest.
The US is not alone in the movement away from coal. All data from China indicates a drastic energy policy change to reduce reliance on coal power generation, incentivized by air pollution concerns and structural economic change. According to the International Energy Agency, Chinese thermal power generation in
3 International Energy Agency (IEA). 2014. Key World Energy Statistics 2014. http://www.iea.org/publications/freepublications/publication/key-world-energy-statistics-2014.html. 4 University of Illinois at Chicago School of Public Health. 2013. Scientific Evidence of Health Effects from Coal Use in Energy Generation. April 2013.. http://noharm.org/lib/downloads/climate/Coal_Literature_Review_2.pdf. 5 World Health Organization (WHO). 2011. Tackling the Global Clean Air Challenge. 26 September 2011. http://www.who.int/phe/eNews_37.pdf.6 IEA. 2014. CO2 Emissions From Fuel Combustion Highlights 2014. http://www.iea.org/publications/freepublications/publication/co2-emissions-from-fuel-combustion-highlights-2014.html.7 Hansen, J. 2009. Coal-fired power stations are death factories. Close them. The Guardian, 15th February ,2009. http://www.theguardian.com/commentisfree/2009/feb/15/james-hansen-power-plants-coal 8 Brune, M. Winning Numbers. Coming Clean: The Blog of the Executive Director-Sierra Club. 8th, April 2015.
http://sierraclub.org/michael-brune/2015/04/beyond-coal-climate-clean-energy. U.S. Energy Information Administration (EIA) data shows that 145 plants (15GW) out of 1,308 coal plants (310GW, as of 2012) in the U.S. were closed between 2010 and 2012. In addition, over 100 units or a total of 60 GW will be retired by 2020. U.S. Energy Information Administration (EIA). 2014. AEO2014 projects more coal-fired power plant retirements by 2016 than have been scheduled. http://www.eia.gov/todayinenergy/detail.cfm?id=15031. For more information on the growth of RE, see Boren, Z. 2014. Renewables cutting US emissions more than gas as coal consumption drops. Energy Desk: Greenpeace, 20th October, 2014. http://energydesk.greenpeace.org/2014/10/20/renewables-cutting-us-emissions-gas-coal-consumption-drops/,

10 Human Cost of Coal Power
the first quarter of 2015 was down 3.7%, hydropower generation was up 17%, and wind and solar power generation were up over 20%. Meanwhile, coal imports saw a dramatic 40% drop during the same period. A key element behind the reduction in China’s use of coal for power generation is fundamental recognition of the massive air pollution emissions from burning coal, which is the main cause of the country’s crisis-level air pollution. China has required many of the biggest coal-consuming provinces to reduce total coal usage and to close down polluting factories and power plants.
In Europe, more than a hundred coal-fired power plant units are expected to close over the next decade, pushed out of the market by rapid expansion in renewable energy and new standards for controlling air pollution. 9 Since the year 2000, the capacity of European coal-fired power plants has fallen by 25 gigawatts, while wind and solar power have increased by 120 and 90 gigawatts respectively Essentially, all new power generation capacity in Europe comes from renewable energy and gas 10.
Given the existing momentum to tackle coal as a contributor to the global crisis of climate change, International Financial Institutions (IFIs) like the World Bank, US Export Import Bank, and the European Bank for Reconstruction and Development, have
stopped investing in coal-fired plants. This year, in an unprecedented vote the Norwegian Government unanimously agreed to divest its $890 billion USD government pension fund, considered to be the largest sovereign wealth fund in the world, from coal companies. The divestment movement continues to gather steam, which may be contributing to Coalswarm report showing “that two-thirds of coal-fired power plants proposed worldwide since 2010 have been stalled or cancelled. The growth rate in coal-fired generating capacity is slowing, down from 6.9% in 2010 to 2.7% in 2013.” 11 As such, raising capital for new coal projects will be increasingly difficult and unlikely.
There is hope, and there is progress. Indonesia can embrace a clean, green energy mix for a better future, and stand by other world leaders in transitioning to a low carbon economy.
9 Economist Intelligence Unit 2014: Coal’s last gasp in Europe. http://www.eiu.com/industry/article/741997658/coals-last-gasp-in-europe/2014-07-09
10 The European Wind and Energy Association (EWEA). 2013. Wind in Power. http://www.ewea.org/fileadmin/files/library/publications/statistics/EWEA_Annual_Statistics_2013.pdf.
11 Coal mining: In the depths. The Economist. 2015.

Human Cost of Coal Power 11
12 Anenberg, S., Horowitz L., Tong, D., West, J. 2010. An estimate of the global burden of anthropogenic ozone and fine particulate matter on premature human mortality using atmospheric modeling. Environ. Health Percept. 118: 1189-95..http://www.ncbi.nlm.nih.gov/pubmed/20382579.13 Greenpeace. 2012. Dangerous Breathing-PM2.5: Measuring the human health and economic impacts on China’s largest cities. 18th December 2012. http://www.greenpeace.org/eastasia/Global/eastasia/publications/reports/climate-energy/2012/Briefing%20Dangerous%20Breathing%20-%20Greenpeace.pdf.14 Polycyclic Aromatic Hydrocarbons (PAHs) consist of multiple aromatic rings. A great number of PAHs are formed by incomplete combustions or heat-induced decomposition of
organic matter and they have adverse effects on the environment and human health. Many studies have already found the potential carcinogenicity of PAHs (e.g., in pollutants from coal burning, exhaust gas, cigarette smoke, etc.) It is difficult to explain all the compounds containing PAHs since their compositions are extremely complex.
What is PM2.5?
The term “PM” stands for “particulate matter,” which is characterized according to size and expressed in terms of micrometers (μm) or one-millionth of a meter. Particulate matter that is 10μm or less in diameter - PM10 - is defined as ‘respirable’ particles, as it can enter into the lungs, and particulate matter that is 2.5μm or less in diameter is defined as a fine particle - PM2.5. The latter, which is smaller than one twenty-fifth of the diameter of a human hair, penetrates the respiratory system, directly reaching the alveoli and entering the bloodstream, causing a wide range of physiological and biological harm and increasing the risk of chronic diseases.
Fine particles or PM can be classified as either “primary particles,” which are directly released into the air, or “secondary particles,” which are formed through the atmospheric chemical reactions of other pollutants initially released as gases. The former consists of organic carbon, elemental carbon, minerals, and ash (containing heavy metals.) The latter can be divided into organic and inorganic particles. The secondary organic particles are formed from the oxidation reaction of organic compounds with OH, O2 or NO2 and the secondary inorganic particles are formed through the reaction of atmospheric ammonia, NOx, or sulfur dioxide to form sulfate, nitrate, or ammonium.
Among others, PM2.5 is a long-range transboundary pollutant, which stays a long time in the atmosphere
HEALTH IMPACTS OF COAL-FIRED POWER PLANTS4
and causes high concentration levels of air pollution. It is likely that the chemical composition of PM influences health impacts, but the current understanding is that all PM2.5 is dangerous regardless of chemical composition, and there is little consistent evidence of how the health impacts of different types of PM2.5 differ. Exposure to PM2.5 causes serious short-term and long-term health effects.
Source of Fine Particles, PM2.5
Fine particles or PM2.5 generated by human activities, such as burning of fossil fuels in power plants and vehicles, are the dominant source of the PM2.5 in the atmosphere 12. The secondary formation of PM2.5 cannot be ignored. Indeed, PM2.5 is formed through the chemical reactions of airborne pollutants, including NOx, SOx, VOC and NH2.
Health Effects of PM2.5
PM2.5 has far-reaching effects. It is so small that it can penetrate deep into the lungs and the bloodstream. This is why PM2.5 is more toxic and harmful to the human body than larger particles. 13
The main health impact of coal air pollution is from PM2.5 itself, but there are other problems too. PAHs 14 transported by PM2.5 can be inhaled into the body and accumulate in the alveoli, and penetrate further into the bloodstream, causing inflammation and lung diseases, as well as cardiovascular disorders. Exposure to PM2.5 increases the risk of cardiovascular, cerebrovascular,
Fine particle matter comparisonμm = micrometer
HUMAN HAIRabout 70μm wide
GRAIN OF SANDabout 50μm wide
PM10less than 10μm wide
PM2.5less than 2.5μm wide
12 Human Cost of Coal Power
and respiratory diseases, as well as cancers, all of which consequently raises the mortality rate. 15
The most comprehensive evidence of the health risks from PM2.5 pollution comes from a American Cancer Society study that followed half a million U.S. adults for 20 years, and found that people living in more polluted cities had a significantly higher risk of dying from cardiovascular and respiratory diseases as well as from lung cancer. For example, a 10μg/m3 increase in the average PM2.5 pollution level increased the risk of lung cancer by 14% and overall risk of death by 4-8%.16
Another study found that the same increase in the PM2.5 level also increases children’s risk of death from acute respiratory infections by 12% 17.
In 2013 WHO confirmed that long-term exposure to fine particles (PM2.5) can trigger atherosclerosis, adverse birth outcomes and childhood respiratory diseases, also a possible link with neurodevelopment, cognitive function and diabetes, and strengthens the causal link between PM2.5 and cardiovascular and respiratory deaths. 19
Additional Pollutants from Coal Power Plants and their Health Risks
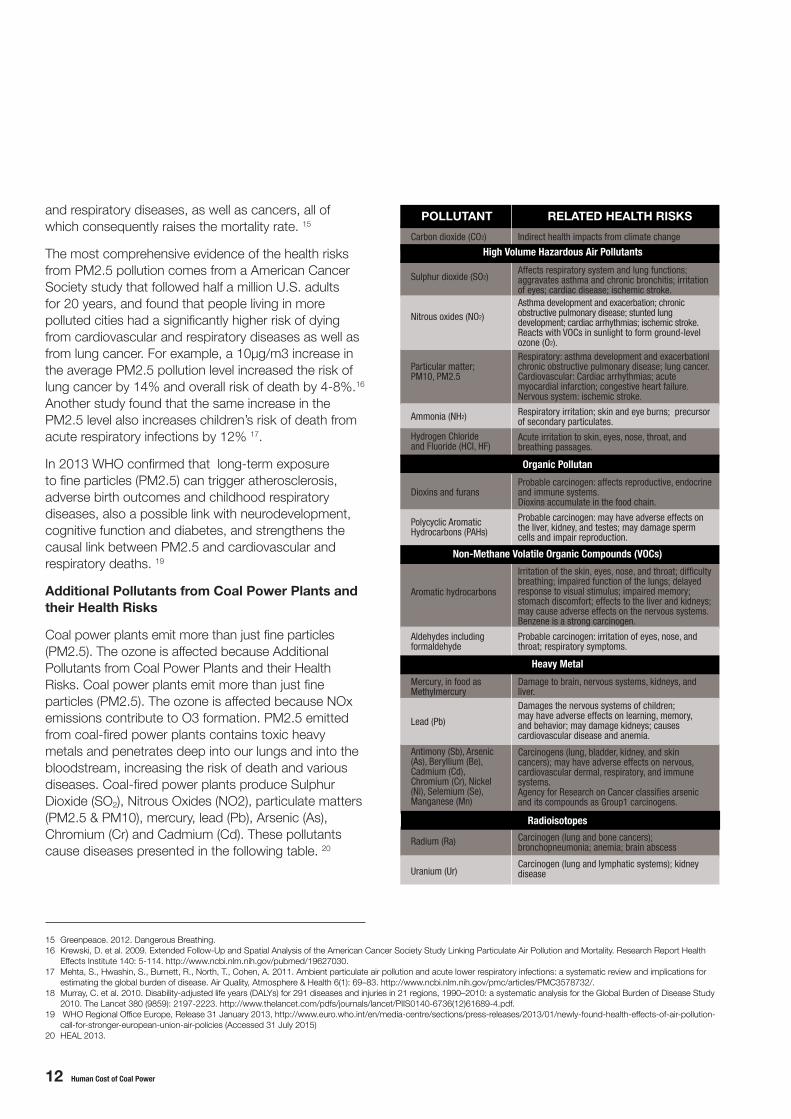
Coal power plants emit more than just fine particles (PM2.5). The ozone is affected because Additional Pollutants from Coal Power Plants and their Health Risks. Coal power plants emit more than just fine particles (PM2.5). The ozone is affected because NOx emissions contribute to O3 formation. PM2.5 emitted from coal-fired power plants contains toxic heavy metals and penetrates deep into our lungs and into the bloodstream, increasing the risk of death and various diseases. Coal-fired power plants produce Sulphur Dioxide (SO2), Nitrous Oxides (NO2), particulate matters (PM2.5 & PM10), mercury, lead (Pb), Arsenic (As), Chromium (Cr) and Cadmium (Cd). These pollutants cause diseases presented in the following table. 20
15 Greenpeace. 2012. Dangerous Breathing. 16 Krewski, D. et al. 2009. Extended Follow-Up and Spatial Analysis of the American Cancer Society Study Linking Particulate Air Pollution and Mortality. Research Report Health Effects Institute 140: 5-114. http://www.ncbi.nlm.nih.gov/pubmed/19627030.17 Mehta, S., Hwashin, S., Burnett, R., North, T., Cohen, A. 2011. Ambient particulate air pollution and acute lower respiratory infections: a systematic review and implications for estimating the global burden of disease. Air Quality, Atmosphere & Health 6(1): 69–83. http://www.ncbi.nlm.nih.gov/pmc/articles/PMC3578732/.18 Murray, C. et al. 2010. Disability-adjusted life years (DALYs) for 291 diseases and injuries in 21 regions, 1990–2010: a systematic analysis for the Global Burden of Disease Study 2010. The Lancet 380 (9859): 2197-2223. http://www.thelancet.com/pdfs/journals/lancet/PIIS0140-6736(12)61689-4.pdf.19 WHO Regional Office Europe, Release 31 January 2013, http://www.euro.who.int/en/media-centre/sections/press-releases/2013/01/newly-found-health-effects-of-air-pollution- call-for-stronger-european-union-air-policies (Accessed 31 July 2015)20 HEAL 2013.
Carbon dioxide (CO2)
Sulphur dioxide (SO2)
Nitrous oxides (NO2)
Particular matter;PM10, PM2.5
Ammonia (NH2)
Hydrogen Chlorideand Fluoride (HCI, HF)
Dioxins and furans
Polycyclic Aromatic Hydrocarbons (PAHs)
Aromatic hydrocarbons
Aldehydes including formaldehyde
Mercury, in food as Methylmercury
Lead (Pb)
Antimony (Sb), Arsenic (As), Beryllium (Be), Cadmium (Cd), Chromium (Cr), Nickel (Ni), Selemium (Se), Manganese (Mn)
Radium (Ra)
Uranium (Ur)
Indirect health impacts from climate change
Affects respiratory system and lung functions; aggravates asthma and chronic bronchitis; irritation of eyes; cardiac disease; ischemic stroke. Asthma development and exacerbation; chronic obstructive pulmonary disease; stunted lung development; cardiac arrhythmias; ischemic stroke. Reacts with VOCs in sunlight to form ground-level ozone (O2).Respiratory: asthma development and exacerbationl chronic obstructive pulmonary disease; lung cancer.Cardiovascular: Cardiac arrhythmias; acute myocardial infarction; congestive heart failure.Nervous system: ischemic stroke.
Respiratory irritation; skin and eye burns; precursor of secondary particulates.
Acute irritation to skin, eyes, nose, throat, and breathing passages.
Probable carcinogen: affects reproductive, endocrine and immune systems. Dioxins accumulate in the food chain.
Probable carcinogen: may have adverse effects on the liver, kidney, and testes; may damage sperm cells and impair reproduction.
Irritation of the skin, eyes, nose, and throat; difficulty breathing; impaired function of the lungs; delayed response to visual stimulus; impaired memory; stomach discomfort; effects to the liver and kidneys; may cause adverse effects on the nervous systems. Benzene is a strong carcinogen.
Probable carcinogen: irritation of eyes, nose, and throat; respiratory symptoms.
Damage to brain, nervous systems, kidneys, and liver.Damages the nervous systems of children; may have adverse effects on learning, memory, and behavior; may damage kidneys; causes cardiovascular disease and anemia.
Carcinogens (lung, bladder, kidney, and skin cancers); may have adverse effects on nervous, cardiovascular dermal, respiratory, and immune systems. Agency for Research on Cancer classifies arsenic and its compounds as Group1 carcinogens.
Carcinogen (lung and bone cancers); bronchopneumonia; anemia; brain abscess
Carcinogen (lung and lymphatic systems); kidney disease
POLLUTANT RELATED HEALTH RISKS
High Volume Hazardous Air Pollutants
Non-Methane Volatile Organic Compounds (VOCs)
Organic Pollutan
Heavy Metal
Radioisotopes
Human Cost of Coal Power 13
Coal burning accounted for an estimated 50% of Indonesia’s energy-related SO2 emissions, 30% of PM10 emissions, and 28% of NOx emissions in 2008. 21 These numbers are very likely to have grown, as coal use has doubled from 2008 to 2014, and the share of coal in Indonesia’s total energy consumption grew from 24% to 35%. 22 SO2 and NOx are the main ingredients in the formation of acid rain. Coal burning also releases harmful chemicals like mercury and arsenic.
Air pollutants emitted from coal plants can be transported by the wind, spreading over hundreds of kilometers. This pollution increases the risk of serious illnesses like lung cancer, stroke, heart disease, chronic respiratory ailments and acute respiratory infection. Infants, pregnant women, and the elderly are most vulnerable to the acute effects of air pollution.23 Air pollution is the largest environmental health risk humans face and the leading environmental cause of cancer deaths.
Coal burning produces a large quantity of PM2.5, fine toxic particles which are recognized as the leading environmental health risk to the world. Premature deaths and illnesses due to PM2.5 from coal-fired power plants are a global problem.
The Natural Resources Defense Council and researchers from Tsinghua and Peking universities, the Chinese Academy of Social Sciences, and other government-affiliated bodies studied the true impact of coal in China and found that coal and coal-related industrial processes account for 50-60% of PM2.5. They determined that approximately 708,000 people died because of PM2.5 pollution generated by coal use in 2012 (coal plants and other uses of coal). 24 In China, coal-fired power plants alone are responsible for 256,000 premature deaths each year. 25 Coal is responsible for 60% of the air pollution
21 J. Kurokawa, T. Ohara, T. Morikawa, S. Hanayama, G. Janssens-Maenhout, T. Fukui, K. Kawashima, and H. Akimoto. 2013. Emissions of air pollutants and greenhouse gases over Asian regions during 2000-2008: Regional Emission inventory in ASia (REAS) version 2. Atmos. Chem. Phys. 13: 11019-11058.22 Calculated from BP. 2015. Statistical Review of World’s Energy 2015.23 University of Illinois at Chicago School of Public Health. 2013. Scientific Evidence of Health Effects from Coal Use in Energy Generation.24 National Resources Defense Fund. 2014. The True Cost of Coal in 2012. http://www.nrdc.cn/coalcap/index.php/English/project_content/id/508. 25 http://energydesk.greenpeace.org/2013/12/12/map-health-impact-chinas-coal-plants/ 26 Greenpeace. 2013. Coal Kills: An Assessment of Death and Disease caused by India’s Dirtiest Energy Source. www.greenpeace.org/india/Global/india/report/Coal_Kills.pdf. 27 Brune 2015 citing The Clean Air Task Force. 2010. The Toll From Coal. September 2010. http://www.catf.us/resources/publications/files/The_Toll_from_Coal.pdf. 28 Epstein, P. et al. 2011. Full cost accounting for the life cycle of coal. Annals of the New York Academy of Sciences- Ecological Economics Reviews 1219: 73-98. www.chgeharvard.org/sites/default/files/epstein_full cost of coal.pdf. 29 Greenpeace. 2013. Silent Killers: Why Europe must replace coal power with green energy. June 2013. http://www.greenpeace.org/international/Global/international/publications/climate/2013/Silent-Killers.pdf.30 Health and Environment Alliance (HEAL). 2013. The Unpaid Health Bill: How coal power plants make us sick. 7th March 2013. www.env-health.org/IMG/pdf/heal_report_the_unpaid_health_bill_how_coal_power_plants_make_us_sick_final.pdf.
health impacts in China.
A report by Greenpeace and partners entitled “Coal Kills,” which investigated coal plants in India, estimated that coal pollution causes between 80,000 and 115,000 premature deaths each year, and more than 20 million asthma cases from exposure to total PM10 pollution. The study quantified additional health impacts such as hundreds of thousands of heart attacks, emergency room visits, hospital admissions, and lost workdays caused by coal-based emissions. The study also estimated that the monetary cost associated with these health impacts exceeds USD $3.3 to 4.6 billion per year.” 26
In the U.S., the Clean Air Task Force estimates that in 2010, coal-fired power plants contributed to 13,200 premature deaths, 20,400 heart attacks, and 217,600 asthma attacks.27 A Harvard study estimating the life cycle effects of coal and its waste stream found that coal related ailments were costing the U.S. public a third to over one-half of a trillion dollars annually. 28
Coal-fired power plants caused 22,000 premature deaths in Europe in 2012. In the EU, they also caused about 8,500 new cases of chronic bronchitis, and over 4 million lost working days each year. 29 The economic costs of health impacts from coal combustion in Europe are estimated at up to €42.8 billion per year. 30

14 Human Cost of Coal Power
Figure 1.
AIR POLLUTANTS FROM COAL POWER PLANTS AND THEIR HEALTH RISK 31
Coal-fired power plants expose people to toxic particles, ozone and heavy metals. The most serious health impacts are due to microscopic particles (PM2.5) formed from emissions of sulphur and nitrogen oxides, dust and soot. These particles penetrate deep into the lungs and into the bloodstream, causing deaths and numerous health problems
Source: Rückerl R et al (2011). Health effects of particulate air pollution: A review of epidemiological evidence. Inhalation Toxicology 23(10): 555–592;Pope III CA & Dockery DW (2006). Health Effects of Fine Particulate Air Pollution: Lines that Connect. J Air & Waste Manage. Assoc. 56:709 –742; .US EPA: Six Common Air Pollutants. www.epa.gov/airquality/urbanair; US EPA: Integrated Risk Information System (IRIS). www.epa.gov/IRIS
31 Modified design from Greenpeace Interntional. Silent Killers. 2013. Duplication request July 2015.
Human Cost of Coal Power 15

16 Human Cost of Coal Power
Jono, a 50-year-old fisherman, mends his net before going to fish in the waters around the Cilacap coal power plant. Since the plant started operating, he has seen his fishing catch decrease by 50%. 23 Sep, 2008
In its Fifth Assessment Report in 2013, the Intergovernmental Panel on Climate Change (IPCC) stressed that in order to avoid severe and disastrous climate change, the global temperature should not go 2°C above pre-industrial levels, and 40-70% of GHG emissions should be cut by 2050. Coal is the single largest source of GHG emissions, responsible for 44% of global CO2 emissions in 2011. Coal burning is the world’s main contributor to CO2 emissions. 32 A typical coal plant of 500MW emits around 3 Mt of CO2 per year 33, which is equivalent to the annual CO2 emissions from about 630,000 vehicles. 34
The CO2 produced from a coal plant with the most efficient technology available today is still more than twice that of a natural gas plant and 15 times higher than that of a renewable power plant. 35
CLIMATE CHANGE IMPACTSOF COAL-FIRED POWER PLANTS 5
Commercial operation of the 1,600 planned coal-fired power plant units around the world would lead to significant growth in carbon emissions, exacerbating climate change 36. The growth in CO2 emissions would follow a trajectory consistent with average global temperature rise of 5 to 6º by 2100. 37 Professor Kevin Anderson, a renowned climate scientist, once said, “a 4º future is incompatible with an organized global community, is likely to be beyond ‘adaptation’, is devastating to the majority of ecosystems and has a high probability of not being stable.” 38
Coal burning was responsible for over 40% of Indonesia’s energy-related CO2 emissions in 2014. While the destruction of forests is the main source of CO2 emissions within Indonesia, the country’s coal exports amount to more CO2 emissions than all domestic energy use. 39
32 IEA. CO2 Emissions From Fuel Combustion Highlights. 2014. ,33 Massachusetts Institute of Technology. 2007. The Future of Coal Summary Report. http://web.mit.edu/coal/..34 Calculated based on the US Environmental protection Agency (EPA). Greenhouse Gas Equivalencies Calculator. http://www.epa.gov/cleanenergy/energy-resources/calculator.html#results. [last accessed 18th July 2015].35 European Climate. New unabated coal is not compatible with keeping global warming below 2 °C- Statement by leading climate and energy scientists. http://www.europeanclimate.org/documents/nocoal2c.pdf. 36 CoalSwarm and Sierra Club 2015: Boom and Bust. Tracking the Global Coal Plant Pipeline. http://action.sierraclub.org/site/DocServer/Coal_Tracker_report_final_3-9-15.pdf?docID=17381 37 This refers to the emission trajectory of the Current Policies Scenario in IEA: World Energy Outlook 2012. The CO2 emissions from new coal-fired power plant projects would significantly overshoot the increase in power sector CO2 emissions in the Current Policies Scenario, which the IEA estimates to be consistent with 5-6 degree global warming.38 Roberts, D. The Brutal logic of climate change. The Grist, 6th December 2011. http://grist.org/climate-change/2011-12-05-the-brutal-logic-of-climate-change/. (quoting Professor Kevin Anderson of the Tyndal Institute). 39 Calculated from British Petroleum (BP). 2015. Statistical Review of World’s Energy 2015. http://www.bp.com/en/global/corporate/about-bp/energy-economics/statistical-review-of-world-energy.html.
© G
reen
peac
e /
Ard
iles
Ran
te

Human Cost of Coal Power 17
Coal power not only endangers lives through its toxic emissions and impacts on our global climate, it produces pollutants during its entire life cycle that affect water resources which further confirm that coal is not a sustainable source of energy for Indonesia.
Water pollution
Coal is one of the most water-intensive methods of generating electricity since it consumes and pollutes a huge amount of water during extraction, processing, and combustion at power plants. An incredible amount of water is used and contaminated during the entire lifecycle of coal: coal mines deplete groundwater and pollute rivers and lakes. Coal washing turns large amounts of freshwater into toxic wastewater. Coal power plants consume vast amounts of water for cooling and pollution controls and their coal ash ponds can contaminate surrounding water bodies.
In general, the water consumption of a 1,000MW coal plant is equivalent to the amount of water consumed by a half million people for one year. 40 The IEA found that global water consumption for power generation is expected to more than double, from 66 billion cubic meters (bcm) in 2010 to 135 bcm, by 2035, and that coal would account for 50% of this growth. 41
Coal-fired power plants that use seawater for cooling (as opposed to freshwater) still create major problems. The plants create thermal pollution that can kill or damage fragile marine ecosystems, especially in warm tropical waters. The plants suck in vast quantities of water for cooling. They essentially become giant fish blenders, killing aquatic life that is sucked up against the intake pipes filters. The water that goes through the filters and into the plant to cool it down comes out
mostly devoid of life: fish eggs that are small enough to pass through the filters, as well as the microorganisms that fish eat to live, simply die from extreme temperatures.
The toxic chemicals in coal power plant exhausts also affect rivers and lakes. Research found that fish caught in a rural area downwind from a coal-fired power plant had 19 times more mercury than store-bought fish.42 Mercury is a neurotoxin, a heavy metal that bioaccumulates as it works its way up the food chain and into the human body. Eating fish contaminated with mercury can have serious effects on human health, and is particularly damaging for the physical and mental development of children. Acid rain can harm aquatic life and mobilize toxic heavy metals into water ecosystems.
Coal ash pollution
Burning pulverized coal in boilers to create steam for power generation produces a number of combustion residuals. One is bottom ash, which is removed from the bottom of coal furnaces. Another is fly ash, most of which is captured by filtration equipment before flue gases reach the chimneys of power plants. Other combustion residuals are emitted through the stack.
Such coal ash is generally trucked in dry or sent through pipelines with water to a disposal facility. The former generates fugitive dust and the latter often leads to groundwater contamination as heavy materials and other toxic chemicals flow into bodies of natural water. Coal ash is highly likely to contaminate soils, as well as harm ecosystems and human health, since it contains various heavy metals like arsenic, cadmium, chrome, cobalt, copper, lead, and mercury, as well as radioactive substances such as radium, thorium, and uranium.
ENVIRONMENTAL IMPACTS OFCOAL-FIRED POWER PLANTS6
40 Naidoo, K. The Unquenchable Thirst of an Expanding Coal Industry. The Guardian, 1st April 2014. http://www.theguardian.com/sustainable-business/unquenchable-thirst-expanding-coal-industry.41 Greenpeace. 2014.Coal Impacts on Water. 21st March 2014. http://www.greenpeace.org/international/en/campaigns/climate-change/coal/Water-impacts/. 42 University of Pittsburg Schools of the Health Sciences. 2007. Higher Levels Of Pollutants Found In Fish Caught Near A Coal-fired Power Plant. Science Daily, 8th November 2007. http://www.sciencedaily.com/releases/2007/11/071107083907.htm.

18 Human Cost of Coal Power
Most of Indonesia’s coal is designed for export. However, a growing percentage of the nation’s coal is feeding a domestic addiction to the world’s dirtiest fossil fuel. Moreover, the future will be darker yet, if the government goes forwards with 117 new, authorized coal-fired power plants. These 117 plants would add to the country’s existing 42 coal-fired power plants, and would lock the country into a carbon-heavy, polluting future for at least one generation and possibly for 50 years, which is roughly the average age at which coal-fired power plants are retired worldwide. 43
There is no doubt that Indonesians require more energy, particularly the millions living in dire energy poverty without access to electricity. 44 It is a tragedy that around 30% of the population remains deprived of electricity. 45 Power shortages, blackouts (rolling blackouts lasted roughly 3.8 hours per day on a national average, according to 2009 data” 46), and brownouts – even in places that are grid-connected – remain a serious cramp on the economy. Greenpeace welcomes the commitment by the government to electrify the country, as articulated by Indonesia’s Director General of Electricity Jarman, responsible for the sector’s regulation within the Ministry of Energy and Mineral Resources, who stated in 2012: “Our main goal is that by 2020, we hope [the] electrification rate [will] have reached 99 per cent.” 47 However, Greenpeace also stands by the
position that new energy can and should come from clean, renewable means, such as geothermal, instead of deadly coal. The government’s expansion of power generation capacity has been laudable in its goal to better provide power for all citizens, but irresponsible and damaging in the choice of coal or diesel to be the bedrock for Indonesian electricity.
Domestic coal use has been growing alarmingly in Indonesia. The first decade of the new millennium could have been a time for the government to embrace modern technology and move into a clean, green future. Instead, it chose to cling to technologies from the 19th
century. Thus, as electricity consumption skyrocketed, so did the dirtiest fossil fuel use. The electricity sector remains the largest source of Indonesian domestic consumption, with coal-fired power plants making up roughly two thirds of coal sales in the country in 2010. From 1993 to 2003 the country saw a 78% growth in its domestic power generation capacity with over 48% of this capacity coming from coal-fired power stations. 48
The main point is this: Indonesian coal use has been rising. The government, in fact, promoted increased domestic dependence on coal.
Looking to the future, we see a potentially bleak picture of continued coal addiction, unless the government
STATUS OF COAL-FIREDPOWER PLANTS IN INDONESIA 7
43 Pritchard, A (director). The Dirty Truth About Coal: Exposing the Human Cost of the World’s Filthiest Fuel., www.thedirtytruthaboutcoal.com/?page_id=4 (explaining “A typical coal-fired power plant has an average life expectancy of 50 years.”); See also, Environment America Research & Policy Center: Schneider, J. and Madsen, T., Boggs, J. 2013. America’s Dirtiest Power Plants: Their Oversized Contribution to Global Warming and What We Can Do About It. September 2013. http://environmentamericacenter.org/sites/environment/files/reports/Dirty%20Power%20Plants.pdf (“Coal plants are not designed to last much longer than 30 years, but coal companies routinely renovate these plants to extend their lifetimes.”); Union of Concerned Scientists. 2012. Ripe for Retirement: The Case for Closing America’s Costliest Coal Plants. November 2012. http://www.ucsusa.org/assets/documents/clean_energy/Ripe-for-Retirement-Full-Report.pdf. 44 IESR Indonesia: Elisabeth A., Fabby, T., Henriette, I., Rini, A. Energy Poverty: Fact and Solution.. 2010. Energy Poverty: Fact and Solution. http://www.iesr.or.id/english/wp-content/uploads/BookletENG250111.pdf. 45 In 2011, Indonesia had 131.2 million people who relied on wood and biomass cook stoves. See Lavelle, M. 2013. Five Surprising Facts About Energy Poverty. National Geographic, 29th May 2013. http://news.nationalgeographic.com/news/energy/2013/05/130529-surprising-facts-about-energy-poverty/.46 Sonal, P. 2013. Indonesia: Energy Rich and Electricity Poor. Powernews, 7th January 2013. http://www.powermag.com/indonesia-energy-rich-and-electricity-poor/ 47 Power Engineering International. 2010. Power for the Island Mosaic: Indonesia’s uphill journey to electrify its people. 10th January 2012. http://www.powerengineeringint.com/articles/print/volume-20/issue-9/special-country-report/power-island-mosaic-indonesias-uphill-journey-electrify-people.html. 48 Source Watch. Indonesia and coal. http://www.sourcewatch.org/index.php/Indonesia_and_coal [last accessed 18th July 2015].

Human Cost of Coal Power 19
changes course now. In early May this year, Jokowi launched his ambitious plan to build 35.000 megawatts new power plants. The power plants project designed to provide an additional 35.000 MW by 2019. Unfortunately, it was clear that there is no political will from the government of Indonesia to move away from coal, since over 60% of this 35 GW will still come from coal power plants.
The government’s argument that this projects is a solution for energy poverty is also false argument. Because over 65% of this project will still be built in Jawa and Bali. The area where the electrification ratio almost reach 100%.
The government and PLN’s misguided strategies are responsible for our domestic coal addiction. Perusahaan Listrik Negara (PLN), the state-owned power utility, bears some responsibility for rushing headlong onto a coal-heavy path, with its “Fast Track Program” to dramatically increase domestic coal consumption.
Sadly, even recent legal reforms indicate that the government is committed to earmarking ever more coal for use at home. The Energy and Mineral Resources Ministry issued a decree in 2009 requiring producers of coal and other minerals to allocate a proportion of their annual production output to the domestic market, or face sanctions. The decree, signed on December 31, 2009, states that a certain proportion of coal output must be earmarked, annually, to home users (the so-called Domestic Market Obligation, or DMO) [WC 4/2010]. The DMO will be equal to the estimate of annual demand proposed by potential domestic buyers
49 Indonesia – Domestic coal decree. The Asia Miner, 14th February 2010. http://www.asiaminer.com/news/archive/104-2010/february-2010/2745-indonesia-domestic-coal-decree.html#.VYJayxOqqko.
a year earlier. 49 Since its declaration, law and policy reforms have been developed to give the decree teeth and ensure its application. This initiative, and others like it, all lean towards boosting domestic coal consumption for electricity production, rather than developing policies and programs to quit coal.
Air pollution standards in Indonesia are not protecting us
Despite the enormous health impacts of particulate matter pollution, Indonesia has no air quality standards for PM2.5, no standards for yearly average PM10 levels, and only a very weak standard of 150μg/m3 for daily PM10 levels. There is almost no air quality monitoring in Indonesia. From everyday experience it is clear that air pollution is a serious issue e.g. on much of Java and Sumatra, but there is little hard data made available by the government.
In comparison, China, a country suffering serious problems due to PM2.5, applies Class1 standards of 35µg/m3 annual mean and 15µg/m3 24-hour mean to special regions like national parks. Other countries like the U.S., Japan, and Canada apply annual and 24-hour PM2.5 standards of 35µg/m3 & 12µg/m3, 35 µg/m3 & 15µg/m3 and 28 µg/m3 & 10µg/m3, respectively.
It is also very alarming that while Indonesia plans a major expansion of coal-fired power plants, it requires no emission controls for SO2 or NOx to be installed in most power plants. The emission standards are also very lax, allowing up to 10 times more toxic emissions than countries with strong standards, including China.

20 Human Cost of Coal Power
Air Pollution laws
Indonesia does not have an act that regulates air quality protection and management. This must be remedied as a matter of urgency. We need a Clean Air Act, and we need it now.
Happily, the Indonesian Constitution (Undang-Undang Dasar 45, Article 28 H 1) protects the right to a healthly environment. Arguably, by killing them and making them sick, what coal-fired power plants are doing to the people of Indonesia is unconstitutional. Act No. 23 of 1997 on Environmental Management also protects the right to a good and healthy environment and imposes on each individual, including power plant operators, the obligation to preserve the environment and restrict activities that exceed environmental standards. This can and should also be used as a basis for lawsuits against coal-fired power plants.
Government Regulation (PP) No. 41/1999 on Air Pollution Control is an implementation regulation to Act No. 23/1997, which imposes ambient air quality standards,
INADEQUATE LEGAL PROTECTIONFOR THE RIGHT TO CLEAN AIR 8
emission standards, and a Pollution Standard Index (PSI). These are a good start, and can also be used to sue polluting plants, but do not go far enough – nor do the MoE regulations and decrees issued to implement this PP.
Government Regulation No. 41/1999 concerning Air Pollution Control gives authority to provincial governments to set emissions standards and air quality standards. Thus, the ball is also in the court of provincial governments to immediately act in order to protect their people better.
The National Ambient Air Quality Standards (NAAQS) fall far short of WHO guidelines and must be improved. All cities are required to meet the NAAQS, but until the NAAQS evolves, cities should establish their own AAQS, higher than the current NAAQS.
The Act No. 5/1984 on Industrial Activities, combined with PP No. 27/1999 concerning Environmental Impact Analysis and its implementing guidelines, along with Act No. 30/2007 concerning Energy simply are not good enough at protecting Indonesians’ right to clear air.
Children play by the beach near a coal power plant in Jepara, Central Java, oblivious to the possible threats
to their health. The coal mining furore poses serious hazards to human health, the environment and the social
integrity of communities around mining areas.26 Dec, 2012
© K
emal
Juf
ri /
Gre
enpe
ace

Human Cost of Coal Power 21
Air pollutants from coal-fired power plants have a nationwide impact, and people living near the plants are hit hardest. This section will introduce the damages directly attributable to two coal-fired power plants.
Tanjung Jati B and Batang case studies
In addition to estimating the total health impacts of all coal-fired power plants in Indonesia, two case studies were carried out for this report:• The operating coal-fired power plant Jati B in Jepara• The planned power plant project Batang
These additional case studies provide a detailed analysis of the air quality and health impacts of these individual power plants, which is outside of the scope of the Harvard project. The impacts were modeled over a 1500km x 900km domain covering Java, South Sumatra, Bali and the southern coast of Kalimantan. There are approximately 170 million Indonesians living within this domain.
The case studies follow the methodology of the Harvard study for emission estimates and health impact assessment, while using the CALPUFF modeling system for pollutant dispersion modeling in order to obtain a more detailed picture of the local and regional impacts of these power plants.
- The emissions from the power plants Elevate the levels of toxic particles in the air over a large part of the northern coast of Java and beyond, increasing the risk of diseases such as stroke, lung cancer, heart and respiratory diseases in adults, as well as respiratory infections in children. This leads to premature deaths from these causes. SO2, NOx and dust emissions contribute to toxic particle exposure.
- Cause acid rain, which can affect crops and soils.
- Cause fallout of toxic heavy metals such as mercury, arsenic, nickel, chrome and lead.
Tanjung Jati B
Jati B is a 2400MW coal-fired power plant in Jepara, Central Java, with four units brought into operation in 2006-2012. Unlike the majority of operating coal-fired power plants, it has installed desulphurization equipment in units 3 and 4. For other pollutants, the power plant was assumed to meet national standards.
CASE STUDIES9
PM1027141809
NOx2278420104
SO2201048042
Units 1&2Units 3&4
Estimated annual emissions fromthe Jati B power plant, tonnes per year
Modeled annual average PM2.5 concentrations caused by the Jati B power plant. Black and red areas have the highest
individual health risk.
The power plant is estimated to be responsible for 1020 premature deaths per year (95% confidence interval: 620–1440). This includes 450 deaths from stroke, 400 deaths from ischemic heart disease, 60 deaths from lung cancer, 90 deaths from chronic respiratory diseases and 20 deaths of small children due to acute respiratory diseases.

22 Human Cost of Coal Power
The worst modeled air quality impacts occur in Jepara, Pecangaan, Kembang and Karangsari, while Semarang in the south as well as Rembang and Lasem in the east are also affected. Most of the modeled premature deaths occur in Semarang due to the large amount of population exposed.
Estimated premature deaths caused by air pollutant emissions from the Jati B coal-fired power plant,
cases per year
Modeled fallout of fly ash containing toxic metals caused by the Jati B power plant, kilograms per square
kilometer per year.
Technical data of the Batang power plantused for the air pollution modeling.
Technical Specification of Coal Power Plant Chimney Stack
Source : PT BPI, 2013
StrokeIschemic Heart DiseaseChronic Obstructive Pulmonary DiseaseLung CancerOther Chronic Cardiovascular And Respiratory DiseasesLower Respiratory Infections In Children Less Than5 Years OldTotal
450400
60
50
30
20
1020
280-630260-540
40-90
23-87
19-42
5-45
620-1440
BestEstimated
95%Confidence
Interval
Batang
The Batang power project is a project to build a proposed 2000MW coal-fired power plant on the north coast of Central Java. The power plant would install desulphurization and de-NOx equipment. Projected emissions from the plant were taken from the Environmental Impact Assessment, and the plant was assumed to operate with an annual average load factor of 80%.
Number of Chimney Stack
Chimney Stack Height
Chimney Diameter
Chimney Coverage Area
Flow Rate
Temperature
Gas Flow (32oC)
Gas Flow (25oC)
Coal Requirement
Ash Content
Sulphur Content
Nitrogent Content
Emission Rate (25oC)
Without Processing
Particulate (Ash)
SO2
NO2
Particulate (Ash)
SO2
NO2
1.
2.
3.
4.
5.
6.
7.
8.
9.
1.
2.
3.
1.
2.
3.
1
240
8.65
58.74
19.1
32
1,121.85
1,096.10
550
152,778
3.50
0.23
0.90
5,347
351
1,375
54.81
328.83
284.99
1
240
8.65
58.74
19.1
32
1,121.85
1,096.10
550
152,778
3.50
0.23
0.90
5,347
351
1,375
54.81
328.83
284.99
CHIMNEY STACK 1
UNITSPECIFICATIONNo. CHIMNEY STACK 2
unit
m
m
m2
m/secondoC
m3/second
m3/second
Ton/hour
gr/dt
%
%
%
gr/second
gr/second
gr/second
gr/second
gr/second
gr/second
CHIMNEY STACK 1
UNITSPECIFICATIONNo. CHIMNEY STACK 2
WITHOUT PROCESSING
WITH PROCESSING

Human Cost of Coal Power 23
Modeled annual average PM2.5 concentrations caused by the Batang power plant. Black and red areas have the
highest individual health risk
The most severe air quality effects would occur in Batang and Pekalongan. These are the areas where the individual health risk from the power plant would be the most severe.
The air pollutant emissions from the Batang power plant would be projected to cause 780 premature deaths per year (95% confidence interval: 470-1090). This includes 340 deaths from stroke, 300 deaths from ischemic heart disease, 40 deaths from lung cancer, 70 deaths from chronic respiratory diseases and 10 deaths of small children due to acute respiratory diseases.
Most of the modeled health impact occurs in the cities of Pekalongan, Tegal, Semarang and Cirebon. The
StrokeIschemic Heart DiseaseChronic Obstructive Pulmonary DiseaseLung CancerOther Chronic Cardiovascular And Respiratory DiseasesLower Respiratory Infections In Children Less Than5 Years OldTotal
340300
50
40
20
10
780
210-480190-410
30-68
17-66
14-32
4-34
470-1090
BestEstimated
95%Confidence
Interval
Projected premature deaths caused by air pollutant emissions from the Batang coal-fired power plant,
cases per year
impacts were projected for population in 2020, taking into account population growth in the coming years.
Highest modeled toxic fly ash fallout from the Batang power plant would occur in the immediate vicinity of the power plant, within a distance of 5-10km. Mountain slopes to the southwest and southeast would also be affected. Most affected areas would be projected to receive 500-1000 kilograms per square kilometer of fly ash.
Alya, a 4-year-old, is comforted by her mother Siti Soliah, 23-year-old. According to the local
doctor the child is suffering from bronchitis. They live in Kuasen, a small village located just 50 meters from the Cilacap coal-fired
power plant. A huge number of people living in the vicinity of the plant suffer from
respiratory-related diseases.23 Sep, 2008©
Gre
enpe
ace
/ A
rdile
s R
ante

24 Human Cost of Coal Power
Modeled fallout of fly ash containing toxic metalscaused by the Batang power plant, kilograms per square
kilometer per year.
Methodology
The case studies follow the methodology of the Harvard regional-level study for the estimation of air pollutant emissions and for the assessment of health impacts. The air pollution dispersal modeling was done using the CALPUFF modeling system which is the regulatory standard for long-range, single-source modeling in the U.S. The model uses detailed data on wind speeds and directions, temperature, humidity, mixing layer height and other meteorological factors, as well as detailed 3-dimensional terrain data and data on atmospheric
chemistry to project the dispersion, chemical transformation and deposition of pollution from the modeled source in the atmosphere.
The newest version of the CALPUFF model includes the option of using the same chemistry mechanism as the Geos-Chem model. The results of the atmospheric chemistry simulation results from the Harvard study were also used by extracting the daily ozone, hydrogen peroxide and ammonia concentrations from the Geos-Chem model outputs and using them as inputs into the CALPUFF model. Hourly surface-level weather data from five different weather stations on Java were input into the model. Prognostic wind fields were developed using the TAPM atmospheric model developed by Australia’s national science agency CSIRO, and weather and geophysical input data for the year 2012 also provided by CSIRO. Recommendations from Australian regulators for this use of TAPM were followed in the modeling.
The horizontal resolution of the model is 1.67 km in a 170km x 100km area around the modeled power plants, 5km over an area of 500km x 300km, and 15km over the rest of the domain. High-resolution population density data was obtained from the NASA Sedac 50 database and normalized to the official population totals for 2013 (current population) and to UN projections for 2020.
50 http://sedac.ciesin.columbia.edu/data/set/gpw-v3-population-count-future-estimates
50 year-old Munjiah holds her chest X-Ray, showing specks strongly suspected to be coal dust in her lungs at her home in Cilacap, Central Java. She was diagnosed with chronic obstructive pulmonary disease. According to a health survey carried out by Greenpeace in August 2008, 80% of the people living around the coal plant suffered from respiratory diseases believed to be caused by coal dust.25 Dec, 2012
© K
emal
Juf
ri /
Gre
enpe
ace

Human Cost of Coal Power 25
RECOMMENDATIONS10
SO2 cause formation of secondary PM2.5 through chemical reactions in the atmosphere. The impact of air pollution from coal-fired power plants on PM2.5 cannot be ignored. Our air quality laws have to better protect us; Indonesians deserve to breathe clean air.
AMDALS:
In addition, the Ministry of Environment must manage environmental impact assessments for coal power plant projects, taking into account the data presented in this report. In particular, any assessments of impacts on health and environment or of GHG emissions in AMDALs should be strengthened. The Ministry of Environment needs to play a stronger role in the ongoing environmental impact assessment of coal-fired power plant projects and conduct thorough examinations of damages caused by these plants. Each power generator should be required to carry out an epidemiological survey on health impacts on local residents and environmental pollution near the power plant, publish the results transparently, and come up with strong, long-term measures to reduce damages.
Penalties:
Penalties for power plants generating air pollutants exceeding the standards should be strengthened with more stringent measures to monitor air pollutant emission and impose heavy fines on power plants concerned. We must levy penalty surcharges for NOx (one of precursors to the secondary formation of PM2.5). We must appropriately fine and sanction power producers responsible for excess emission of air pollutants, in order to incentivize them not to break the law and exceed emission limits.
Monitoring:
For Indonesia, the first step to manage PM2.5 effectively is to create a functional air quality monitoring network throughout the country, identify major emission sources, and support research on the health, environment, social, and economic impacts of PM2.5.
1. No new coal plants!
In addition to the existing coal-fired power plants in operation, at least 117 – and possibly more – coal fired power plants are under construction or about to be built. According to the analysis by Harvard University, if all of the planned coal power plants start operation, Indonesia will see an estimated 21,200 premature deaths each year due to pollution from coal-fired plants. This loss of life is entirely unnecessary, as renewable energy and the latest cutting-edge, energy-efficient solutions enable us to keep the lights on without coal. With this in mind, Indonesia must cancel its plan to build more power plants.
2. Phase out the oldest and dirtiest existing coal fired power plants
Coal-fired power plants in operation cause 6,500 premature deaths each year in Indonesia.
At a minimum, the government should closely monitor their emissions and require them to respect the law. The authorities must also protect our people by fining dirty plants for over-emissions and law violations. We need to hold power plants responsible for any damages to local communities and surrounding areas.
If the plants cannot respect the law, they should be closed down. The oldest and dirtiest plants that have failed to adopt the best available technology that exists to limit their toxic emissions should likewise be closed.
3. Strengthen the law and enforcement
We must strengthen the monitoring and regulations on air pollutants from coal-fired power plants.
Laws: Indonesia needs a Clean Air Act.
Our laws must squarely and specifically address the harms of coal-fired power plants. NOx and

26 Human Cost of Coal Power
In addition, it is also necessary to introduce a systematic and publicly accessible emission source management system based on research and monitoring data.
The government should mandate regular inspection of pollution-control devices at power stations and strengthen the monitoring and punishment for over-emission of pollutants.
4. Embrace renewable energy
The most important step we can take is to replace existing and planned coal-fired power plant projects in our country with a robust and strategic plan for energy efficiency, net metering, smart grid rollout, and nationwide development of renewable energy resources including geothermal.
Greenpeace has predicted that by 2030, when all planned coal power plants (and those under construction) begin operations, renewable energy will be cheaper than coal-based power generation.51
Indonesia should increase the share of renewable energy in its master plan. Currently, our target ratio of renewable energy is 25% by 2025 which still seen pessimistic by various parties because not yet supported by proper regulations. It is still far from the achievement of other countries that had been earlier tried to leave coal and switch on the development of renewable energy in a more ambitious, such as China that is growing rapidly for solar and wind power usage.
Indonesia’s obsession with fossil fuels is regressive. The country is destined to lose its future competitiveness and fall behind the rest of the world unless it immediately enters the rapidly growing renewable energy market. We need to boldly embrace cutting edge technologies and not stay stuck in the past.
It is not too late to massively invest in the renewable energy market and implement advanced policies to ensure a sustainable energy future and to take advantage of the fact that Indonesia has one of the world’s richest potentials for renewable energies of all kinds. The ambitious target set for an energy mix of 25% renewable energy by 2025, often referred to as the “25–25 vision” is sadly off-track. In 2011, only “about 1.25 GW of nameplate renewable capacity – including geothermal, wind, solar, and mini and micro hydro – had been installed.” 52
However, it doesn’t have to be this way. We could embrace renewables as a true alternative to coal:
• Indonesia could lead the world in geothermal,with 40% of the world’s geothermal reserves. Geothermal capacity exceeds 29,000 MW, but our country has developed less than 4% of its geothermal capacity.53
• Overall, Indonesia has an estimated potentialtarget of 1267 MW 54 to 7500 MW 55 of mini hydropower plants ranging from 300 kW to 5 MW that are economically feasible today. Micro and mini-hydro installed capacity is already thought to have reached around 100 MW
51 Greenpeace. 2012. Energy [r]evolution: A sustainable energy outlook for South Korea. http://www.energyblueprint.info/fileadmin/media/documents/national/2012/05_gpi_south_korea_lr.pdf.52 Patel 2013.; See also Center for Data and Information on Energy and Mineral Resources, Ministry of Energy and Mineral Resources. 2012. Handbook of Energy and Economic Statistics of Indonesia. http://prokum.esdm.go.id/Publikasi/Handbook%20of%20Energy%20&%20Economic%20Statistics%20of%20Indonesia%20/Handbook%20of%2 Energy%20&%20Economic%20Statistics%20ind%202012.pdf. 53 Rosen, L. 2013. Climate Change, the World Bank, Indonesia and Coal. The Futurist-World Future Society. 15th October 2013. https://www.wfs.org/blogs/len-rosen/climate-change-world-bank-indonesia-and-coal 54 Cahyafitri, R. 2014. Power tariff set to help mini-hydro plants attract developers. Jakarta Post, 6th May 2014. http://www.thejakartapost.com/news/2014/05/06/power-tariff-set-help-mini-hydro-plants-attract-developers.html.55 Center for Research on Material and Energy Institut Teknologi Bandung & Canadian International Development Agency. 2002. Clean Development Mechanism Project: Opportunities in Indonesia: Pre-feasibility Report on a Micro Hydro Power. October 2002. www.teriin.org/ee/pdf/indonesia-mhp.pdf.

Human Cost of Coal Power 27
(Greenpeace does not include irresponsible, unsustainable large hydro projects in the calculus). 56 37 micro and mini-hydro power plants (172 MW) are reported to be already under construction, and 55 more projects (286.5 MW) have been proposed.There has been 1,96 MW installed capacity for wind with the potency 3-6 m/sec, 57 in a country with thousands of miles of coastline on hundreds of islands, and constant winds.” Jokowi just launched 50MW wind power plant in Bantul, Jogjakarta.
Solar has “a mere 12 Megawatts to date in a country that straddles the equator and receives more sunlight than most other places in the world,” 58 with a potential of approximately 4.8 kWh/m2/day. 59
5. The government must do better on climate change
In 2009, Indonesia pledged to reduce GHG emissions by 26% below business-as-usual by 2020 with its own measures, and by 41% with sufficient
international support, yet the country still sticks to a policy of coal plant expansion. Coal-fired power plants are the largest source of carbon dioxide (CO2) emissions that have already changed our climate. Continued coal burning will cause even more catastrophic climate change.
With the global trend of cutting GHG emissions ahead of a new universal climate change agreement to be adopted in December 2015, it is a time for Indonesia to change its policy and stop promoting coal-fired power plants. Indonesia is going against the global trend, ignoring the health of its own people and breaking its promise to reduce GHG emissions.
56 Liu, H., Masera, D. and Esser, L., eds. (2013).World Small Hydropower Development Report 2013. United Nations IndustrialDevelopment Organization; International Center on Small Hydro Power. Available from www.smallhydroworld.org. or http://www.smallhydroworld.org/fileadmin/user_upload/pdf/Asia_South_Eastern/WSHPDR_2013_Indonesia.pdf 57 Ibid. 58 Ibid. 59 See Eichelbrönner, M. 2013. A Fuel Saver Concept for Indonesia: How to Roll- out Solar PV on a 100 MW Scale to Substitute Diesel in Island Grids. GIZ, 3rd June 2013. http://www.giz.de/fachexpertise/downloads/giz2013-en-eichelbroenner-pep-workshop-indonesien-pv-hybridsysteme.pdf.
Hundreds of people create a human banner with a wind turbine and the
statement ‘Clean Energy Now’ on the site of a proposed nuclear power plant.
The Indonesian government is forging ahead with plans to build its first nuclear power plant in the shadow of a dormant
volcano despite mounting opposition from residents and environmental groups.
30 Nov, 2007
© G
reen
peac
e /
Pau
l Hilt
on

28 Human Cost of Coal Power
APPENDIX 1: Methodology of the Study
Emissions
First, the study of the health impacts of coal-fired power plants requires detailed information on the location, operation and emissions of the power plants. The inventory is based on a detailed listing of coal-fired power plants and their technical data in the covered countries. The basis for the listing is the Platts World Electric Power Plants database, complemented by a comprehensive mapping of new power plant projects by CoalSwarm and by the national groups participating in this project.
The operating data (thermal efficiency and capacity factor) for most plants was obtained from the CARMA database, and for the rest, average national values were calculated by power plant size category and steam conditions. Total coal consumption estimated in this way for each country for 2011 matched the IEA data quite well, but fuel use was scaled to the IEA numbers. The plant-specific operating data was, in other words, used to differentiate coal use among power plants. Flue gas volumes were estimated using EEA default factors for hard coal and lignite.
The national emission standards applied to each power plant were identified and were used to calculate air pollutant emissions as a first approximation. Indonesia’s state power company, PLN, has said they design their power plants for 4300 kcal coal with 0.35% sulfur, so emission rates for plants for which Platts reports “compliance fuel” as the SO2 control method were calculated on this basis. Non-PLN plants without SO2 controls were assumed to burn average Indonesian coal with 0.6% sulfur.
However, it is common for the power sector to significantly under- or over-achieve the legally required performance. For example, all Japanese utilities report average emission rates far below the legal standards, and in Indonesia it is common for small power plants not to have any pollution
The most common approach for studying the health impacts of coal-fired power plants is the “impact pathway” approach, which follows air pollution from emissions from the studied sources, to the dispersion and chemical transformation of emissions, to resulting pollution levels in different locations, to population exposure, resulting increase in health impacts, and finally to the total health impacts on the population-level.
The impact pathway approach with information sources used in the study
Emissions(SO2, NOx, dust)
Cutting-edge atmosphericmodel (Geos-Chem) at
Harvard University
High-resolution population density maps from NASA
Results of largeepidemicological studies
Death rates from lung cancer, stroke, heart disease,
chronic respiratory diseaseand lower respiratory
infections in each country
Coal power plant database developed for the project
Emission rates from official statistics, companies and
academic studies
National emission standards
Fuel use data from the IFA
Dispersion & chemisty in the
atmosphere
Populationexposure to
PM2.5
Health Impacts

Human Cost of Coal Power 29
controls, resulting in emission levels exceeding the national standards. The following sources were used to adjust emission rates for power plants:
• Power-plant specific information, if this could be found, from company presentations etc.
• Company average emissions performance, typically in g/kWh from CSR reports
• National emissions statistics
• REAS 2.1 estimates for air pollutant emissionsfrom coal-fired power plants for each country, scaled by change in coal consumption from 2008 to 2011
When the available statistics covered all thermal power plants, the REAS values for average emission per TJ fuel were used to estimate shares of coal, using fuel use data from IEA (national statistics) or from company reports. When plant-specific data was available, this was preferred. Emission rates for power plants for which individual data was not available were scaled to the available national emission data.
The overall inventory is significantly lower than national statistics or the REAS 2.1 estimates. In many cases
(Thailand SO2, Indonesia SO2 and PM, Philippines PM), it was not possible to reconcile national statistics with emissions performance reported by operators of individual large power plants without assuming very high emission rates for the rest of the power plant fleet, bordering on the physically implausible. In these cases, the information reported by power plant operators, even if potentially selective, was relied on, making the estimates conservative. (Side note: it might be interesting to do a set of model runs with the REAS inventory for CFPPs, our estimates, and an inventory calculated assuming full compliance with national standards.)
Power plant emission standards for PPM are set in terms of total PM. The PM10 and PM2.5 fractions were estimated using US EPA AP-42 PM size distributions for different control technologies on the plant level, when information on technique was available from Platts. In other cases, an ESP was assumed for stack emission concentrations below 500 mg/Nm3 and uncontrolled combustion otherwise.
New power plants are assumed to meet national emission standards for new plants (when more specific information is not available), with the exemption of SO2 emissions from “compliance fuel” plants, which are treated the same way as in the case of operating power
Hundreds of fishermen from Batang, Central Java together with Greenpeace and Public Defender of the Indonesian Legal Aid Foundation (YLBHI), use
fishing boats to spell out ‘TOLAK PLTU’ (No To The Coal Power Plant) in Ujung Negoro-Roban, Batang, to highlight community’s opposition to
the proposed coal power plant in their area.24 Sep, 2014©
Gre
enpe
ace

30 Human Cost of Coal Power
plants. New units are assumed to operate at a capacity factor of 80%, in line with available data for newly commissioned units in the region. For countries and power plant operators whose actual reported emission rates are below national standards, new power plants are assumed to over-achieve the standards by the same ratio. In addition, technology-specific minimum emission control performance is defined for circulating fluidized bed boilers, flue gas desulphurization and selective catalytic reduction devices, low-NOx boilers, subcritical boilers burning subbituminous coal without NOx control measures and for baghouses. All new power plants for which information on particulate control technology is not available are nevertheless assumed to install an electrostatic precipitator with a minimum 99% removal rate. In countries with lenient emission standards for new power plants, such as Philippines, Indonesia and Myanmar, all of these minimum performance assumptions lead to significantly lower estimated emission rates from new plants than simply assuming the highest permissible emission rates.
Atmospheric modeling
Atmospheric modeling was carried out by the research group of professor Daniel Jacobs at Harvard University. The group used the GEOS-Chem global model of atmospheric composition (www.geos-chem.org) to quantify the surface air concentrations of particulate matter (PM) and ozone resulting from present and future scenarios of coal-fired power plant emissions. GEOS-Chem is a widely used, open-source tool for modeling atmospheric composition on global and regional scales. It describes the transport and chemical evolution of species in the atmosphere and thus serves to relate emissions from specific sources to receptor concentrations.
Professor Jacob’s group at Harvard has considerable experience and credentials in global/regional modeling of atmospheric composition for air quality and climate applications. Jacob leads the GEOS-Chem modeling community of over 100 research groups worldwide. The GEOS-Chem model is centrally managed at Harvard by Jacob’s group.
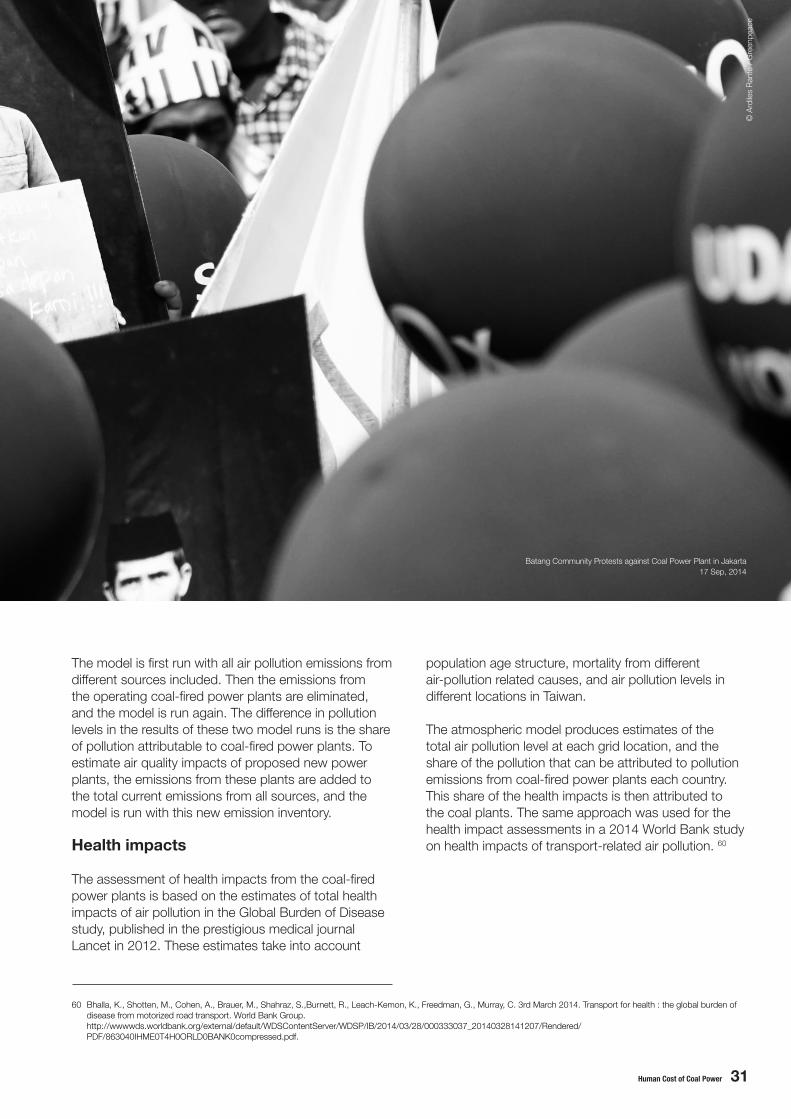
Human Cost of Coal Power 31
60 Bhalla, K., Shotten, M., Cohen, A., Brauer, M., Shahraz, S.,Burnett, R., Leach-Kemon, K., Freedman, G., Murray, C. 3rd March 2014. Transport for health : the global burden of disease from motorized road transport. World Bank Group. http://wwwwds.worldbank.org/external/default/WDSContentServer/WDSP/IB/2014/03/28/000333037_20140328141207/Rendered/ PDF/863040IHME0T4H0ORLD0BANK0compressed.pdf.
The model is first run with all air pollution emissions from different sources included. Then the emissions from the operating coal-fired power plants are eliminated, and the model is run again. The difference in pollution levels in the results of these two model runs is the share of pollution attributable to coal-fired power plants. To estimate air quality impacts of proposed new power plants, the emissions from these plants are added to the total current emissions from all sources, and the model is run with this new emission inventory.
Health impacts
The assessment of health impacts from the coal-fired power plants is based on the estimates of total health impacts of air pollution in the Global Burden of Disease study, published in the prestigious medical journal Lancet in 2012. These estimates take into account
population age structure, mortality from different air-pollution related causes, and air pollution levels in different locations in Taiwan.
The atmospheric model produces estimates of the total air pollution level at each grid location, and the share of the pollution that can be attributed to pollution emissions from coal-fired power plants each country. This share of the health impacts is then attributed to the coal plants. The same approach was used for the health impact assessments in a 2014 World Bank study on health impacts of transport-related air pollution. 60
Batang Community Protests against Coal Power Plant in Jakarta17 Sep, 2014
© A
rdile
s R
ante
/ G
reen
peac
e

32 Human Cost of Coal Power
Greenpeace is an independent global campaigning organisation
that acts to change attitudes and behaviour, to protect and
conserve the environment, and to promote peace.
Greenpeace Indonesia
Mega Plaza Lt. 5, HR. Rasuna Said Kav. C3,
Jakarta, 12920
greenpeace.org/seasia/id
Printed on recycled paper with soya ink
Images : Ardiles Rante, Kemal Jufri (cover), Paul Hilton.
Design : Babul Royani
Thank you to : Research Team Harvard University - Atmospheric Chemistry Modeling Group (ACMG) Greenpeace Southeast Asia
Publication, Agustus 2015: GREENPEACE INDONESIA
Contact: [email protected]