Embed Size (px)
Citation preview

देहरादनू
क� द्र�य भू�म जल बोडर्
जल संसाधन, नद� �वकास और गंगा संर�ण मंत्रालय
भारत सरकार Central Ground Water Board
Ministry of Water Resources, River Development and Ganga Rejuvenation
Government of India
Report on
AQUIFER MAPPING Haridwar District, Uttarakhand
उ�राचंल �ेत्र, देहरादनू Uttaranchal Region, Dehradun
Draft Report

2
CENTRAL GROUND WATER BOARD
MINISTRY OF WATER RESOURCES,
RIVER DEVELOPMENT AND GANGA REJUVENATION
GOVERNMENT OF INDIA
AQUIFER MAPPING REPORT
HARIDWAR DISTRICT, UTTARAKHAND
UTTARANCHAL REGION
DEHRADUN
OCTOBER – 2016

3
AQUIFER MAPPING REPORT, HARIDWAR DISTRICT, UTTARAKHAND
By Vikas Tomar
Assistant Hydrologist
Preface
Executive Summary
CONTENTS
Chapter 1: Introduction Objectives Scope of the Study Approach and Methodology
Area Details Brief Description: Data availability, Data adequacy and Data gap analysis and Data
generation Climate and Rainfall Climate Rainfall Physiography Structural Hills The Bhabar Geomorphology Land use Soil Drainage Agriculture and Cropping Pattern in Area Irrigation Geology Acknowledgement
Chapter 2: Data Collection and Generation Hydrogeology
Bhagwanpur Block
Bahadrabad Block
Roorkee Block
Narsan Block
Laksar Block
Khanpur Block
Long Term Depth to water Level Hydrochemistry Geophysical Data Acquisition
Exploratory Drilling

4
Chapter 3: Data Interpretation, Integration and Aquifer Mapping Ground Water Exploration Chemical Qualities of Shallow Ground Water Geophysical Survey Results Interpretation Aquifer 3-D disposition and Lithological Cross Section of District
Chapter 4: Ground Water Resources Assessment Of Ground Water Resource Potential Of Unconfined And Confined
Aquifer System Computation of Static Ground Water Resource Confined Resource Methodology and Assumption
Chapter 5: Ground Water Related Issues Decline in Groundwater Level Groundwater Quality Groundwater Demand and Budgeting
Chapter 6: Management Strategies
Conclusion
Acknowledgement
List of Tables:-
1. Data Availability and Data Gap Analysis In Haridwar District, Uttarakhand
2. The Climatological, Rainfall distribution and Monthly Rainfall data of Haridwar District
3. Morphostratigraphy In Haridwar District
4. Block wise Land Utilization in District Haridwar (in Hectares)
5. Block wise Gross Sown Area and Irrigation in District Haridwar (in Hectares)
6. Block wise Irrigated area Through Different Sources in District Haridwar (in Hectares)
7. Block wise Agriculture in District Haridwar (in Hectares)
8. General Stratigraphic sequence of Haridwar District
9. Long Term Hydrograph Data of GWMW (DTW m bgl)
10. Long Term Hydrograph Analysis Results
11. Hydrographs of different location in Haridwar district
12. Chemical data of Haridwar District
13. The details and location of VES points in Haridwar District
14. Hydrogeological details of Exploratory Wells Drilled by CGWB, Haridwar District, Uttarakhand

5
15. The interpreted results of VES at Bhagwanpur
16. The interpreted results of VES at Sikandarpur
17. Block wise Ground Water Resource Potential of Haridwar (As on 31-03-2011)
18. Parameter & Static Resources for Unconfined Aquifer- Haridwar
19. Ground Water Resources based on Flow Rate Concept- District Haridwar
20. Ground water Resources based on Storativity Concept-District Haridwar, Uttarakhand
21. Summary of Heavy Metal Analysis from different location in Haridwar district.
22. Total Water Demand of the district for Various sectors
23. Water Budget
List of Figures:-
1. Administrative Map of Haridwar district
2. Geomorphological Map of Haridwar district
3. Geological Map of Haridwar District
4. Hydrogeological Map of Haridwar District
5. Depth to Water Level Map for the Year 2015 of Haridwar District
6. Groundwater Exploration Map of Haridwar District
7. Groundwater Samples of Haridwar District Plotted in Piper-Trilinear diagram
8. VES Curves of Bhagwanpur and Sikandarpur sites in Haridwar District
9. (a)Lithological Cross Section-1 of Haridwar District
9. (b) Lithological Cross Section-2 of Haridwar District
10. Aquifer 3-D disposition Map of Haridwar District
11. Groundwater Table Contour showing flow direction

6
PREFACE
A study on Aquifer Mapping in Haridwar District, Uttarakhand was taken up by
Central Ground Water Board, Uttaranchal Region during AAP 2013-14/2015-16 with an
objective to identify and map the aquifers at micro level, quantify the availability of the
ground water resource and suggest aquifer management plans compatible with the ground
water demand, the aquifer characteristics and the basic issues of the area. The study area
consists of 6 Blocks of Haridwar district i.e Roorkee, Bhagwanpur, Laksar, Khanpur,
Bahadrabad and Narsan.
During the study period, available data was compiled, data gap analysis was carried
out and data generated to fill these gaps. Extensive hydrogeological surveys were carried
out including village wise well inventory, water level and water quality monitoring, etc. All
the data collected using various techniques was studied and synthesized in the form of
Aquifer maps incorporating the various attributes of the aquifer system. Based on these
Aquifer maps and analysis of data, Aquifer Management Plans were prepared. The study
also identifies the major groundwater issues in the study area that need redressal through
appropriate management plans.
The support received from different central and state government agencies has
helped a lot in completion of this study. I thank and congratulate all of them for such an
exhaustive work and completing the work within scheduled timeframe.
The report deals with each aspect of the study carried out in much detail. It is
expected that this report will be of immense help and interest to the planners, policy
makers, professionals, academicians and researchers dealing with water resources in
general and groundwater in particular.
Place: Dehradun (Anurag Khanna)
Date: 25/10/2016 Head of the Office

7
EXECUTIVE SUMMARY
The aquifer mapping study in Haridwar District, Uttarakhand, India was taken up with
the objective to evolve an aquifer management plan. The study involves establishing the
aquifer disposition and its characterization at 1:50,000 scale using latest state of art
technology in the field of hydrogeology and recommending aquifer management plan.
Haridwar district is located in south-western part of Uttarakhand State. It lies from
29º35' to 300 40' North latitude and 77º43 ' to 78º22' East longitude and falls in Survey of
India Degree Sheet Nos. 53 J, F, G and K. The geographical area of the district is 2360 km2.
The total study area taken up for the aquifer mapping is about 2000 sq.km. The area
includes 6 blocks of Haridwar District i.e Roorkee, Bhagwanpur, Laksar, Khanpur,
Bahadrabad and Narsan, Uttarakhand. There exist three tier aquifer system in the study
area of indo-gangetic belt of Haridwar district separated by thick confining clay layers of
varying thickness. In the study area the nature of alluvial sediment is complex and there is
alternation of fine to coarse sediments.
The saturated aquifer system is comprised of fine to coarse-grained sand and gravels. In
the bouldery formation (Bhabar belt) the aquifer group has been intervened by thin clay
layers which at places are thick are mixed with boulders and cobble, pebble. The southern
part of the district contains a good thickness of granular material sediments of older
alluvium as well as younger alluvium. Since, the aquifer exist in three-tier system, each of
this aquifer group contains considerable thickness of sand. The Aquifer 3-D disposition map
reveals that the first aquifer is encountered after sandy clay layer between 5-25 m. The first
and the second aquifer are separated by 10-20m thick clay layer. In Bhabhar belt
groundwater occurs under unconfined conditions. In Terai belt groundwater occurs under
confined conditions. In Gangetic alluvium the groundwater occurs in Semi-Confined/
Confined conditions.
The drilled depth of wells in district ranges between 36.58 to 223.96 m bgl. The water
level in these tube wells ranges between 5.85 to 26.40 m bgl with a discharge ranging 21.66
to 46lps. The transmissivity ranges between 176 to 19850 m2/day. The exploratory well
drilled falls under Bhabar zone as well as in Indo Gangetic alluvial plain.
The quality of the Ground Water is also suitable for drinking and irrigational purposes.
The E.C. is slightly higher in parts of Laksar block (upto 1535 microS/cm) while rest all other
study area it is in between 500 to 900 microS/cm. Ground water level in the study area is
about 1.68 m bgl to 23 m bgl whereas deeper groundwater level also exist upto 70 m bgl in

8
foothills of the Siwaliks, where the formation is Bhabar. The Groundwater is the main source
of water for fulfilling the demands of irrigation, domestic and industrial purposes. The
aquifer disposition and characteristics prevailing in the area has been studied based on
exploratory drilling tapping different aquifers. Monitoring of Ground Water regime is done 4
times a year i.e May, August, November and January.
The main Ground Water related problem in the study area is decline in groundwater
level and deterioration of groundwater quality especially the heavy metal content in some
parts of the study area. The possible causes may be the following 1) the Massive
deforestation in the Bhabar zone which is the recharge area of the Tarai aquifers. 2) Rapid
increase in the number of shallow tube wells in the region consequent upon increase in
agricultural land. 3) General downward trend in the rainfall in the region. And 5) Increase in
agricultural practices using Ground Water by constructing shallow tube wells.
Based on the present and past studies certain recommendations are made to sustain
and manage the groundwater for further future needs and development.1) To remove the
stress on the phreatic aquifer and to avoid the poor quality of groundwater it is
recommended to construct deep tubewells in these locations for groundwater extraction
and the well design for the deeper tubewells are also recommended. 2) It is quite safe to tap
second and third aquifer below 150 meter for further development in the southern part.
The upper most aquifer group should be left for shallow borings for the local farmers to use.
3) it has been observed that around Bhagwanpur township the industrial activities are going
on and there are a number of sugar mills in Laksar and Chudiala areas the industrialist
should be advised to adopt the root top rainwater harvesting system and waste sewerage
treatment plant, so that it may not contaminate the ground water. 4) Afforestation in
Bhabar Zone will increase recharge in Tarai. 5) Promoting efficient water conveyance and
field application devices within the farm viz, underground piping system, Drip & Sprinklers,
pivots, rain-guns and other application devices etc. 6) Farmer oriented activities like capacity
building, training and exposure visits, demonstrations, farm schools, skill development in
efficient water and crop management practices (crop alignment) including large scale
awareness on more crop per drop of water through field days, and extension activities. The
study recommended development of holistic water management programme which
involves controlled use of available fresh water resources as the overall Stage of Dynamic
Groundwater Development in the study area had already reaches 65% (97% in Bhagwanpur)
and there exist 3 semi-critical blocks also.

9
ACKNOWLEDGEMENT
The Author is thankful to Shri K.B.Biswas Chairman, Central Ground Water Board for
giving the opportunity and guidance throughout the study. I place on record my sincere
thanks to Shri Anurag Khanna, Head of Office, Central Ground Water Board, Uttaranchal
Region, Dehradun for giving me his constant help and supervision.
The author place on record, sincere gratitude and appreciation to various central and
state government departments for providing valuable data on various aspects of the district.
Thanks are also due to the various officers of Central Ground Water Board especially Shri
Jagdamba Prasad Scientist ’D’ and Shri R.A.Pir Assistant Hydrogeologist for their valuable
previous work on Aquifer Mapping of the district .
Sincere thanks is also due to Shri G.D.Barthwal, Scientist ‘D’ for sharing his valuable
experience on investigations for groundwater in the Haridwar District.
Finally, I owe it to my senior colleagues and friends, Shri D. Jamlokhi Scientist ‘D’, Shri
RaviKalyan Bussa Scientist ‘C’, Ms Amandeep Kaur Scientist ‘B’, Dr Somveer Singh Scientist
‘B’, Shri D. Bagchi, Asstt Hydrogeologist and Ms Monalisa Singh Scientist ‘B’ for constant
encouragement regarding the completion of the assignment and at various stages of writing
report.
Place: Dehradun (Vikas Tomar)
Date: 25/10/16 Asstt. Hydrologist

10
Chapter -1 Introduction
INTRODUCTION
With the growing human population and ever increasing demand for water supply for
drinking, agricultural and industrial purpose, pressure has been mounted on this renewable
but limited resource. Ground Water is an important source of fresh water. For the scientific
exploration of this natural resource a judicious development and management is required.
Objectives:
The report deals with Aquifer Mapping carried out in Haridwar district of
Uttarakhand. The primary objective of the Aquifer Mapping Programme is to prepare micro
level aquifer information system with 1:50,000 or larger scale aquifer map and develop
Aquifer Management Plans, which will allow institutions and stakeholders to effectively
understand and manage groundwater resources at local and larger level. Also problems of
Ground water pollution, due to unscientific sewerage and industrial effluent disposal has
come up. Besides there are inherent ground water quality related issues which upscale with
over pumping of aquifers in some areas. Under the Aquifer Mapping Programme micro level
aquifer information system on 1:50,000 or larger scale will be prepared by the technically
competent department/agency. This will lead to development of Aquifer Management
Plans, which will allow institutions and stakeholders to effectively understand and manage
groundwater resources at regional and local level.
Scope of the Study:
Apart from the general hydrogeological condition of the district, efforts have been made
to present the information which shall help the local state government and other user
agencies in planning various development activities for the welfare of the people.
Approach and Methodology:
The general methodology for Aquifer Mapping is to first collect and compile the
existing data (thematic maps, geology, hydrogeology, hydrochemical, hydrology,
meteorology, subsurface data etc.). All the existing data is projected in common platform
and is to be interpreted validated and correlated. Then, all the data is analysed to identify

11
the data gaps/incompleteness in data. After identifying the data gaps, finally the gaps are to
be filled (through Data Gap Generation).
Since the Aquifer Mapping is proposed to be taken on 1: 50,000 scale and the thematic
layers are to be prepared on the same scale. The data is to be plotted grid wise on the map
i.e. 5' x 5' grid (9 x 9 km) and the data gaps are to be identified accordingly. For the
subsurface data, the depth information in alluvial formation is to be taken as 300m.
Moreover, if there is more than one geological formation in a single grid, the data pertaining
to only one formation is available; it will also be treated as data gap.
Area Details: Haridwar district is located in southwestern part of Uttarakhand State. It lies from 29º35' to
300 40' North latitude and 77º43 ' to 78º22' East longitude and falls in Survey of India Degree
Sheet Nos. 53 J, F, G and K. Dehradun and Pauri bounds the district in northeast, Bijnor
district of Uttar Pradesh in the southeast, southern boundary with Muzaffarnagar district of
Uttar Pradesh while the western part is bounded by district Saharanpur. The geographical
area of the district is 2360 km2. Hardwar district has been divided into three Tehsils viz.
Roorkee, Bhagwanpur and Laksar and six Development Blocks namely Roorkee,
Bhagwanpur, Laksar, Khanpur, Bahadrabad and Narsan and comprises 622 villages. The
administrative map of Haridwar district is given at Fig 1. Haridwar district has been very well
connected with the network of metaled roads and railway lines. The famous holy Ganges
originates from Gangotri Glaciers, after traveling 300 kms in the Himalayan ranges enters
the plains of Haridwar.

12
Fig 1: Administrative map of Haridwar district
Brief Description: Data availability, Data adequacy and Data gap analysis and
Data generation
One of the important aspect of the aquifer mapping programme was the synthesis of the
large volume of data already collected during specific studies carried out by Central Ground
Water Board and various Government organizations with a new data set generated that

13
broadly describe an aquifer system. The data were assembled, analyzed, examined,
synthesized and interpreted from available sources. On the basis of available data, Data
Gaps were identified. The brief data is given below in Table 1.
There was also a strong need for generating additional data to fill the data gaps to achieve
the task of aquifer mapping. This was achieved by multiple activities such as exploratory
drilling, geophysical techniques and hydro-geochemical analysis.
Table 1. Data Availability and Data Gap Analysis in Haridwar District, Uttarakhand
S.No. Items Data Requirement Data Availability Data Gap
1 Climate Metereological Stations spread over the project area
1 Metereological Station in NIH Roorkee
Not required
2 Soil Soil type in area Different type of soil
present in the area
Soil Infiltration Rate across study
area
3 Land Use Latest Land Use
pattern
Land use data of
2012-13
Not required
4 Geomorphology Geomorphological
map
Geomorphological
map
Not required
5 Geophysics VES No-77 VES Nos 21 VES Nos 56
6 Exploration Data 21 23 19
7 Monitoring Regime 2 to 3 wells in each blocks
39 monitoring wells Not required
8 Recharge
Parameters
Recharge parameters for different soil and aquifer types based on field studies
Recharge parameters given in Ground Water Resources Estimation
Entire Study
area
9 Discharge
Parameters
Discharge parameters for different GW abstraction structures
Discharge parameters given in Ground Water Resources Estimation
Entire Study
area

14
Climate and Rainfall
Climate:
District Haridwar comes under hot sub-humid (dry) eco-region with alluvium-derived
soils. The eco-region has hot, sub humid (dry) climate. It covers northern Indo-Gangetic
Plain, including Piedmont Plain of the Western Himalayas. Also experiences moderate
subtropical to humid climate with three distinct season’s viz. summer followed by rainy and
winter seasons. The hydro-metereological observations are given in Table 2.
The temperature begins to rise from March (27.60C) and reaches to its maximum at
during May (37.20C) with the commencement of monsoon season by the mid of June and
the temperature begins to lower by the end of June. During the winter season in the month
of December to February the temperature ranges between 24.70Cto 17.70C.The mean
monthly wind speed is highest the summer season when it goes up to 2.4 km/hour in the
month of May and June and the minimum wind speed is observed during winter when it is
0.5 km/hour in the month of November. The evaporation is maximum in the month of May
156 mm and minimum 24.5 mm in the month of January.
Rainfall:
The average normal annual rainfall in Haridwar district is 1174.3 mm, out of which 84%
is received during monsoon season and only 16% occurs during non-monsoon period. The
district receives heaviest rainfall in northern part. The rainfall gradually decreases towards
south. The data related to recent trend of rainfall distribution over the district, monthly
rainfall during monsoon has been given in Table 2. The monthly distribution of rainfall
during the monsoon season over the district shows that June, July and August are the
wettest month in the district having a rainfall 387.8 mm, 304.7mm and 412.8 mm. The
highest rainfall is recorded during the month of August. The monsoons retreat in the first
fortnight of October giving a meager rainfall of 24.6 mm. Maximum rainfall occurs in the
foothills of Himalayas and gradually decreases towards south.

15
Table 2: The Climatological, Rainfall distribution and Monthly Rainfall data of Haridwar District
Sn Agroecological Zone
Avrage monthly rainfall (mm)
No. of Rainy Days (No.)
Maximum Rainfall intencity Avrage weekly tem Potencial Evapo transpiration
up to 15
minute (mm)
Beyond 15 but
up to 30 min
(mm)
Beyond 30 but up to 60min (mm)
Period Period
Summer(April may) Winter (Oct-March) Rainy (June Sep)
Sum
mer
Win
ter
Rai
ny
Min
Max
mea
n
Min
Max
mea
n
Min
Max
mea
n
Name of Block- Bhagwanpur
1 Hot Sub humid (Dry)
1141 45 92 45 15 9.3 23.7 16.5 1.1 19.9 10.5 13.1 23.4 18.3 4.04 1.92 3.8
Name of Block -Roorkee
2 Hot Sub humid (Dry)
1040 35 90 43 12 1.1 23 12.1 1.3 19.5 10.4 14 23.4 18.7 4.9 1.92 3.9
Name of Block -Narsan
3 Hot Sub humid (Dry)
1080 37 91 35 10 10.1 23.7 16.9 1.1 19.3 10.2 12 23.4 17.7 4.04 1.92 3.7
name of block - Bahadrabad
4 Hot Sub humid (Dry)
1120 47 88 37 7 9.3 22 15.7 1.2 19.9 10.6 12.8 22.4 17.6 5.1 1.92 3.9
name of block - Laksar
5 Hot Sub humid (Dry)
1131 44 90 44 12 10.3 21 15.7 1.2 19.2 10.2 12.9 23.2 18.1 4.04 1.92 4.1
Name of Block- Khanpur
6 Hot Sub humid (Dry)
1137 42 93 41 14 9.8 23.7 16.8 1 19.6 10.3 13.1 23.5 18.3 4.04 1.92 4
Distt Haridwar
Hot Sub humid (Dry)
1108 42 91 41 12 8.32 22.85 15.58 1.15 19.57 10.36 12.98 23.22 18.10 4.36 1.92 4

16
Physiography:
The general, Haridwar district can broadly be divided in to physiographic units viz. the
structural hills, the upper piedmont plain or the Bhabar and the Tarai or the lower piedmont
plain.
Structural Hills
The complete northern and northeastern part of the Haridwar district is covered by the
structural hills called the Siwaliks. This unit shows high relief and deep incised drainage with
steep and sharp lenticular hill slopes and well defined crest line (northern boundary of the
district). The run-off is high due to the rugged topography and homogenous lithology. The
part of Siwalik falling in the district has middle and upper Siwaliks composed of sand stones,
conglomerates, sands, clay, silt etc. The lower Siwaliks are missing in this district. These hills
are traversed by many local minor and major faults.
The Bhabar
The second unit lying just below the foothills of Siwaliks locally called as Bhabar. This
unit is characterized by Boulders, cobbles, pebbles sands and clays etc. with relatively dry
terrains fringing the Siwalik foothill belt and lying at higher elevation as compared to plains
having a steeper gradient around 10 to 20 meters/kms. These terms have thus geographic
and geomorphological connection. Geologically the term Bhabar is used to describe the
deposits formed along the foothill zone by coalescence of series of alluvial and talus cones,
composed of heterogeneous materials ranging in texture from boulders, gravels to sand and
silt. Locally this composition is governed by the parent rock Siwaliks and the drainage
system and this varies from place to place. This Bhabar area covers most of the Bhagwanpur
block and some part of Bahadrabad block.
Tarai or the plains
Just below the Bhabar zone lies the Tarai or plains or the lower piedmont plain. This
shows almost a plain surface sloping towards south with very low gradient around 1.2
meter/kms. This area is characterized by course to fine grained sand, gravels, clays etc. This
third unit plain is further divided in to lower piedmont plain, the older alluvial plains and the
younger alluvial plains.

17
The lower piedmont plain shown flat to undulating plains with gradient towards south
and southeast having micro relief. The older alluvial plains also showed flat to undulating
topography. It is characterized by the sediments brought by river Ganga and Solani
consisting of older alluvium. The younger alluvial plains lies along the river Ganga and Solani
shows flat to gently sloping, slightly undulating terrain formed by extensive deposition of
sediments brought by the rivers. It comprises of younger unconsolidated alluvial material of
varying lithology and consisting of fluvial landforms like palaeo channels, meander, scar and
point bars. Flood plains also exist all along the rivers, by deposition of sediments brought of
recent origin.
Geomorphology
Morphostratigraphically, there are two units or surfaces viz., an older upland or
interfluve area free from floods-the Bangar, and a younger low land called the Khadar, a
flood prone area. Latter is also known as the flood plain defined by palaeo banks of the
river. The upland based on gradient and sediment characteristics, is further divisible in to
tow units the Piedmont zone (Bhabar), and the Varanasi plain.
The piedmont zone is a narrow, southerly sloping upland adjoining the Siwalik Hills or
sub-Himalayas. It is made up of unsorted coarse clastic sediments (bounders, pebbles etc.)
of the Varanasi alluvium of middle to upper Pleistocene age, and recent alluvial and colluvial
fans, It has a high gradient plain as compared to the Varanasi plain with slope varying from
about 10m/km in the northern part to about 0.4 m/km in the southern part around Tarai. It
is in this zone that most of the small seasonal river draining the sub-Himalaya disappears.
These streams reappear as spring line at distal end that merges with Varanasi plain, and
locally forms the swampy conditions-the Tarai. There is high moisture content which
support dense forest. It lies to the south of Bhabar zone and imperceptibly merges with the
Varanasi plain in the south where the gradient is 0.14 m/km. The Varanasi plain is an almost
flat erosional surface formed after late Pleistocene glaciations. It has a very low gradient
towards southeast or to east. The development of four levels of relict palaeo-bluffs is seen
along the left bank of Ganga River downstream and upstream of Bijnor district. The
resultant prominent terraces are leveled as Daranagar (T2) Mandawar (T3) and the
Chandokh-Roorkee (T4) Terraces in ascending order. These are considered as evidences for
the different stage in the evolution of drainage system related to post – glacial climate

18
fluctuations (cold to war humid) in the beginning of the present day climate, and also to
westward shift of course of Ganga River.
The flood plain or the Bangar-surface postdates the last glaciations in Late Pleistocene,
and is the youngest geomorphic surface, which developed in Middle Holocene after the
onset of the present day warm and humid climate. It is further subdivided in to two unit’s
viz., the Old Flood Plain and the Active Flood Plain. The Old Flood Plain is defined by
palaeobanks with bluffs, showing development of 2 to 4 levels or terraces, the highest being
erosional in nature and locally preserved. This surface did not receive any alluviation. The
lower terrace is made up of Terrace Alluvium. This surface gets flooded during exceptionally
high floods and is characterized by levees, meander scroll, ox-bow lakes and abandoned
channels. The Active Flood Plain, on the other hand, gets flooded annually, and is defined by
banks of the present day or active river. The active channels keep oscillating. At places,
where the river about against a palaeobanks, there is undercutting resulting in collapse of
palaeobanks on the convex sides of the meander causing erosion of the upland surface. The
flood plain is characterized by point-bar, channel bar-sands and over bank silts. The
morphostratigrapy in Haridwar district is given below in Table 3.
The detailed geomorphological map prepared by Remote Sensing Application center,
Lucknow has been attached herewith along with the legends and land forms present in the
Haridwar district Fig 2.The Bhabar formation or the bouldery formation, occurring along the
south of the Siwalik Hills in variable lateral; and aerial extent formed at the foot hill by
coalescence of several alluvial fans, in the map has been described as Upper Piedmont Plain
(PPU) and flat to undulating plain with gradient towards southwest having micro relief, with
finer sediments has been term as Lower Piedmont Plain (PPL). Structural hills have been
marked with (SH).

19
Table.3 Morphostratigraphy in Haridwar District
Age Morphostratigraphic Units Morphological Features
Late Holocene to
Present
Ganga
Plain
Flood Plain
(Khadar)
Active
Flood
Plain
Oscillating/migratory active channel
defined by banks with point-bar, channel
bar sands and over bank silts
Old Flood
Plain
Defined by palaeobanks with bluffs and
showing developments of terraces, the
highest locally developed/preserved is
erosional and did not receive alleviation
while lower, filled up by Terrace alluvium,
gets flooded during high floods.
Characterized by levees, meander scrolls,
ox-bow lakes and abandoned channels.
Late Pleistocene to
Early Holocene
Varanasi
Uplands or
interfluves
area free
from flood
(Banger)
Piedmont
Zone
(Bhabar)
A narrow southerly sloping northern part
of the upland adjoining Siwalik hills With
moderate southerly gradient, seasonally
active fluvial channel dying out and
reappearing as spring line at distal end
merging with the Varanasi plain and
forming local swampy (terai) conditions.
Varanasi
Plain
Almost flat with south-easterly gradient,
characterized by low sandy mounds and
ridges in northern part (Bhur surface) and
wide extensive clayey sourthern part with
soil alkalization, abundant relict fluvial
features- palaeochannels with meander
cutoffs, ox-bow lakes and tals.

20
Land use:
Total geographical area of Haridwar is 2.43 lac ha out of which, 1.62 lakh ha land
is under cultivation, which amounts to 67% of total land. Among land for agricultural
use, 13 % is under rainfed and 87 % area is under irrigation. Total Forest area in
Haridwar district is 0.84 lac ha. Land holdings of the farmers in the blocks having area
less than 1 ha, is three times more than having areas of land above 2 ha indicating that
number of marginal and sub marginal are highest.
Soil:
Soils play an important role in ground water recharge and the agriculture
production of the area. The land of Haridwar district is highly fertile. The important soils
of the district are Ultisols, which are the brown hill soil, occurring all through the
northern part of the district in Siwaliks. These are the soils with a horizon of clay
accumulation and low base supply. The Entisols are the soils also called the Bhabar soil
occurs all along the foothills of Siwaliks and extends up to Tarai. These are soils without
pedogenic horizons. Though these soils consist of boulders, pebbles, sand, silt and clay
but are also highly fertile. Molisols soil occurs in the southern part of the district also
called the Tarai soil, which consist mainly of the fine-gained sand, silt and clay. These
are soils with a nearly black; organic-rich surface horizon and high base supply. These
three types of soils are mineral soils with organic matter less than 25%. This is the most
fertile soils of the district.
Drainage:
River Ganga is the major drainage system of the area. It enters in the district at the
boundary of Haridwar and flows southwardly draining the eastern part of the district.
One stream emerges from river Ganga at near Shahpur Sheetlakhera and passes
through Bhogpur, Sultanpur Patti and Raisi called Ban Ganga River. River KotwaliRoa,
Rasawan Nadi and Pili Nadi emerging from Siwalik Hills in the eastern part of the district
are the tributary of River Ganga River Ganges and Solani are the perennial rivers.
The other prominent river in the area is Solani, which drains the central part of the
district. The Solani River originates from Saharanpur. SiplaNadi joins Solani river
between Bhagwanpur and Roorkee. MohandRoa, ChillawalRoa, the seasonal tributaries
meets Solani River at the northern part of the district. These rivers originate from
Siwaliks at the northern end and passes through the Bhabar belt lying below the

21
foothills of Siwaliks. The other major tributaries of Solani River are Ratmau Rao and
GholnaRao, Apart from these rivers other seasonal river/nalas also contributes the river
Solani. The drainage pattern in the district is sub dendetric to dendetric and trills. The
drainage courses of most of the nalas out falling in the various tributaries are broad, flat
and occupied with cobbles, boulders and gravels. Most of these nalas are torrential,
carried surface run off which fluctuate gently and are losing springs.
Substantial seepage is expected to be taking place from such streams during the
monsoon period. Beyond the monsoon season most of these nalas as well as tributaries
go dry. However, in Tarai belt, the drainage is more or less perennial as it receives
effluent seepage through the ground water body-giving rise to number of springs on
depressions along the nalas. A drainage map of Haridwar district showing all the major
and minor river system is attached herewith geomorphology at Fig 2.

22

23
LEGEND MAP
SYMBOL
GEOMORPHIC
UNIT
LITHO
STRAT
IGRAP
HY
STRUCTURE DESCRIPTION GROUND
WATER
PROSPEC
TS
SAND BAR RIVER
SAND
- Ganga, Yamuna and Solani rivers have produced
extensive and deposits of varying sizes along their
margins through the fluvial action. The area is good
for shallow to deep aquifers with good quality of
groundwater.
Good to
excellent
FLOOD PLAIN
(FP)
ALLU
VIUM
(AL)
- Surface of relatively smooth, low lying, flat land
adjacent to the Ganga, Yamuna and Solani rivers
comprises unconsolidated, coarse to fine sand with
silt and clay. The area is repeatedly inundated during
the floods. Good for shallow to deep aquifers.
Good to
very good
RAVINES (RA)
ALLU
VIUM
(AL)
- Network of gullies formed due to the erosion by
surface runoff in deep alluvium along Kali &
Silakhala rivers. It is composed of unconsolidated
alluvium with varying lithology.
Poor
YOUNGER
ALLUVIUM
PLAIN (APY)
ALLU
VIUM
(AL)
- Flat to gentle sloping, slightly undulating terrain
formed by the extensive deposition of sediments by
the rivers Ganga and Yamuna. it comprises younger
unconsolidated alluvium materials of varying
lithology & consisting of fluvial landforms like
palaeochannel, meander scar and point bar.
Good to
very good
OLDER
ALLUVIUM
PLAIN (APO)
ALLU
VIUM
(AL)
- Similar to younger alluvial plains but formed at early
stage by the rivers and consisting of older alluvium.
Good to
excellent
LOWER
PIEDMONT
PLAIN (PPL)
ALLU
VIUM
(AL)
- Flat to undulating plain with gradient towards
southwest having micro relief, sediment varies from
fine clastic to coarse clastic with variable runoff and
infiltration. Flowing wells are common. Feasible for
construction of tubewells even at shallow depth.
Very
Good
UPPER
PIEDMONT
PLAIN (PPU)
ROCK
DEBRI
S
- It occurs all along the south of Siwalik hills in
variable
lateral and areal extent formed at the foot hills by the
coalesence of several alluvial fans comprising
boulders, gravel, sand and clay. The water table is
expected at deeper
level (locally called Bhabar)
Moderate
to Good
STRUCTURAL
HILLS
SAND
STON
E (Sst)
- This unit shows high relief and deep incised drainage
with steep and sharp hill slop and well defined crest
line (northern boundary of the district). The runoff is
high due to rugged topography and homogenous
lithology.
Moderate
to Good
along
linear
valleys
LANDFORMS
VEGETATION
ANOMALY
- Dense vegetation indicates the presence of loose
alluvial material and good quality of groundwater.
Dense vegetation indicates the presence of loose
alluvial material and good quality of groundwater.
Good
OLD
MEANDER
- Gently sloping, crescent shaped features formed by
drying up to abandoned meandering river channels
developed along the rivers Ganga and Yamuna.
Excellent
MEANDER
SCAR
- An abandoned meander often filled with alluvium
and covered with vegetation.
Good to
Excellent
PALAEOCHA
NNEL
- Abandoned and buried river channels in alluvial
plains.
STRUCTURAL FEATURES
THRUST
FAULT
Confirmed
Thrust
Confirmed
Fault
Bhimgoda thrust and Ganga, Yamuna faults are
delineated.
Moderate
to good
FP
(AL)
PPU
SH
VvVvV
vV
...........
...........
..
..........
555
RL
(AL)
APY
(AL)
APO
(AL)
PPL

24
Agriculture and Cropping Pattern in Area:
Haridwar district is a part of Ganga floodplain. Extremely north of the district is carved
by Himalayan foothills called the Siwaliks. The land of Haridwar district is highly fertile
even in Bhabar area, which is occupied with boulders and pebbles. In the Bhabar area
the surface soil carried by the nalas in this area are rich in minerals but the crops mainly
depends on the monsoon because of lack of tube wells and canals. This bouldery
formation lying in the foot of Siwalik, in the area is called Bhabar. Its agricultural
products besides the mills and factories in urban area also control the economy of the
district. Area under Kharif is 0.96 lakh ha (Irrigated – 0.93 and rainfed 0.02 ha) whereas
area under Rabi is 0.51 lac ha ((Irrigated – 0.49 lac and rainfed 0.02 lac ha). Area under
summer crop is very less (0.12 lac ha). Area under horticulture and plantation crop is
also very less (0.016 lac ha) which is solely irrigated. The most important crops in the
district are sugarcane, wheat and paddy. The crops grown among the cereals are rice,
maize, sorghum, pearl millet in Kharif, wheat and Barley in Rabi and maize in Zaid
season. In oilseeds, the major crops are soybean, groundnut, til and sunflower in kharif,
mustard in Rabi and sunflower in Zaid. Among pulses, pigeon pea, urd, moong and
cowpea in kharif, gram, pea and lentil in Rabi and urd/moong in Zaid season. The
cropping intensity is 150 percent. The block wise land utilization, block wise agriculture,
crop wise percentage of area under main crops are given in Table 4, 5, 6 and 7.
Irrigation:
Though the Upper Ganga canal and the Central Ganga canal passes through the
district but the irrigation facilities through canal have not been developed to
considerable extent in the whole of the district. The southwestern part of the district, in
Narsan, part of Roorkee and Bhagwanpur block the irrigation is done through canals
(Deoband branch, main Basera distributary etc.) but in most of the part of district canal
irrigation is very less. Bhabar or the area lying at the foothills of Siwaliks are lacking
irrigation facilities due to bouldery formation and run off zone as well as because of its
very deep water level. Therefore, this area remains depends on rainfall for its crops.
The maximum irrigation in the district is done through tube wells, which consists stress
on the ground water. The 84% of irrigation in the district is done through tube wells and
only 15% of irrigation is done by the canal network system. Only 1% of irrigation is done
by the other sources. The block wise gross sown area and irrigation block wise irrigated
areas though different sources are given in Table 5 and 6.

25
Table.4 Block wise Land Utilization in District Haridwar (in Hectares)
Table.5 Block wise Gross Sown Area and Irrigation in District Haridwar (in Hectares)
Block Kharif (Area in ha) Rabi (Area in ha) Jayad (Area in ha) Total (Area in ha) Total Net Area Irrigated
Gross Area Irrigated
Irrigated
Rainfed Total Irrigated Rainfed Total Irrigated Rainfed
Total Irrigated Rainfed
BAHADRABAD 17282 900 18182 10515 660 11175 4029 0 4029 31826 1560 33386 18688 27383
LAKSAR 18946 0 18946 7972 0 7972 1105 0 1105 28023 0 28023 16069 21855
KHANPUR 10501 0 10501 3837 0 3837 492 0 492 14830 0 14830 20775 27308
ROORKEE 13748 630 14378 7625 506 8131 1661 0 1661 23034 1136 24170 23279 31303
BHAGWANPUR 15000.16 1090.92 16361 11144.5 670.5 12103 3787.26 241.74 3879 29931.92 2411.08 32343 20485 27743
NARSAN 18034 0 18034 8278 0 8278 1427 0 1427 27739 0 27739 10915 14315
T. DISTRICT 93511.16 2620.92 96402 49371.5 1836.5 51496 12501.26 241.74 12593 155383.9 5107.08 160491 110211 150207
S.No. Block Name Total Geographical
Area
Area Under Agriculture Area Under Forest
Area under Wasteland
Area Under Others
uses
Gross Cropped Area (1)
Net Shown
Area (2)
Area Sown more
than once (1-2)
Cropping intensity
(%)
1 BHAGWANPUR 30276 27696 23080 8709 153 275 2004 4564
2 ROORKEE 22329 18054 15045 5677 158 0 1104 3644
3 NARSAN 28446 24681 20552 7755 166 0 1345 4545
4 BAHADRABAD 46053 32372 26977 10180 168 2856 2840 10651
5 LAKSAR 25924 24335 20279 7652 165 12 1545 3492
6 KHANPUR 14611 13188 10990 4147 165 705 320 1296
TOTAL DISTRICT 167639 140326 116923 44122 165 3848 9158 28192

26
Table.6 Block wise irrigated area Through Different Sources in District Haridwar (in hectares)
BLOCK CANALS TUBEWELLS DUG WELLS PONDS OTHERS TOTAL
GOVT. PRIVATE
1 2 3 4 5 6 7 8
BHAGWANPUR - 1312 17197 - - - 18580
ROORKEE 168 1082 14678 - - 8 15997
NARSAN 8501 966 11761 - - - 21205
BAHADRABAD 4262 690 16236 - - 1658 22876
LAKSAR - 206 20087 - - - 20375
KHANPUR - 133 10646 - - - 10822
TOTAL DISTRICT 12931 4389 90605 - - 1666 109855
Table.7 Block wise Agriculture in District Haridwar (in hectares)
YEAR /BLOCK Paddy Wheat Barley Maize Sugarcane Total Pulses Total Edible
Total Irrig. Total Irrig. Total Irrig. Total Irrig. Total Irrig. Total Irrig. Total Irrig.
1 2 3 4 5 6 7 8 9 10 11 12 13 14 15
BHAGWANPUR 1860 1838 8943 8893 19 3 276 8 11502 11244 291 17 11389 10759
ROORKEE 1788 1759 6260 6245 1 - 10 - 9389 9357 115 11 8174 8015
NARSAN 1717 1709 6646 6635 7 1 - - 15139 15174 83 13 8453 8358
BAHADRABAD 3471 3439 9614 9586 22 5 335 17 12013 11907 264 27 13706 13074
LAKSAR 2369 2336 6548 6532 - - 33 17 15357 15321 42 6 8992 8891
KHANPUR 2371 2338 3090 3075 - - - - 7674 7651 13 - 5474 5413
TOTAL DISTRICT 13576 13419 41101 40966 49 - 654 42 71128 70654 808 74 56188 54510

27
Geology
The northern and northwestern part of the district Haridwar is covered by high steep
hills of Himalayas called Siwalik Range. The altitude of Siwalik varies between 600 to 900
meters. The geology of foothills of Himalayas was mapped by ONGC. In the outer most rage
lying just north to the district the upper Siwaliks followed by middle Siwaliks are exposed.
The area has also been studied and described by Mathur and Shahni (1964) and Roopke and
Sharma.
The middle Siwaliks in this area is largely consists of lower alterations of clay and sand
stone sequence and an upper sequence of massive sand stones. The upper part is frequently
split up by clays in to a more argillaceous sequence. The thickness of middle Siwaliks is
around 2000 meters.
Table.8 General Stratigraphic sequence of Haridwar District
Era Period Age Formation Group Lithology
Cenozoic Neogene
Holocene Younger alluvium Terraces,
channels, flood plains, fans,
paleochannels
Newer/Younger Alluvium
Sands of various grade, silt and clays
Middle to Upper
Pliestocene
Older Alluvium (Bhabber and
Terai)
Ramnagar/ Varanasi/ Ambala
Boulders, Cobbles, Pebbles,
Gravels, Sand, Silt & Clay
Pliestocene to Early
Pliestocene Sedimentaries
Middle Siwaliks Sandstone with boulders,cobbles,
Pebbles, Conglomerate and associated Clay
Upper Siwaliks Conglomerates, Sandstones, Siltstones,
Shales with boulders,Pebbles,
Sands and Clay

28
Fig 3: Geological Map of Haridwar District

29
The upper Siwaliks are mostly redaceous consisting of sand stone, boulders, pebbles,
conglomerates, shale, slit and clay. The maximum thickness of upper Siwaliks is around 1000
meters. Middle Siwaliks have steep hills which are dipping towards south up to 200 to 600.
These middle Siwaliks has traversed by many minor faults.
Just below the Siwaliks are the Bhabar area which is characterized by the alluvial fans,
which are consists of boulder, cobbles, pebbles, gravel with clay and silts. The source
sediments have governed the lithological composition of the Bhabar formation. The
sediments of the Bhabar area are heterogeneous in composition and texture, as the
sediments are not only derived from the foothill but also from higher land area in
Himalayas. Mostly the boulders, pebbles, cobbles, gravels and sand have been derived from
Upper Siwalik conglomerate bed. The alluvium has been extended down to south in
complete district. The texture has also changed as we go from north to south depending
upon the duration, distance of transportation and nature of deposition of sediments. The
older and younger alluvial plains consist of various grades of sands, grave, silt and clay. The
sand bars, flood plains, point bars, palaeochannels meanders has been created by the
riverine agencies in younger alluvium along the rivers. In general the geological sequence in
the Haridwar district is given as below in Table 8. The geological map of Haridwar district is
given in Fig 3.
30
Chapter-2 Data Collection and Generation
Hydrogeology
Haridwar district shows different hydrogeological conditions due to its variegated geological
settings and topography. The district is occupied by Siwaliks in the extreme north and
northeastern part. Here the ground water occurs in the form of spring and seepage. Below it
lies the boulder formation called Bhabar. The Bhabar belt along it’s along its northern fringe
constitutes the main intake or recharge zone. Ground water in this zone is unconfined to
semi-confined in nature. The hydraulic gradient or the water in the boulder formation is
generally deep. The depth to water becomes comparatively shallower in the peripheral
portion. Below Bhabar, towards south Tarai from a narrow belt along the northern margin
of the Gangetic alluvium of newer quaternary age and older alluvium of middle to upper
Pleistocene age and is separated by sporadic spring line. The spring line is not very much
clear but it has been observed seepage and water oozing out in nalas and rivers on
Biharigarh-Bandarjud road. The water level along the spring line is very shallow. The spring
line sporadically again visible at Chiriapur in Rasawannadi and KotwaliRoanadi. Free flowing
or artisan conditions prevail in the area east of Haridwar- Chiriapurraod between
Raswannadi and KotwaliRoanadi in some part of the Area. The major part of the district is
covered by drainage system of seasonal and perennial rivers causing different depth to
water level in the area. The hydrogeological map of Haridwar district is given in Fig 4. The
block-wise hydrogeological conditions in the district is described here under.
1. Bhagwanpur Block:
Bhagwanpur block comprising an area of 315 km. (excluding forest) lying north of
district and extends up to northwestern part of the district. Broadly the road (national
highway) leading from Mohund-Bhagwanpur-Chudiala forms the western boundary of the
Bhagwanpur block. The main occupation is agriculture in the area and is being developing as
industrial area. Bhagwanpur block can distinctly be divided in to three geomorphologic
units. The northern most part of Bhagwanpur block is occupied by the rocks of upper and
middle Siwaliks ranging in altitude from 400 to 869 m above mean sea level. Below the
structural hills of Siwalik lies the upper piedmont plain consisting of rock debris, occurs all
along the south of Siwalik hill in variable lateral and areal extent formed at the foot hills by
the coalescence of many alluvial fans comprising of boulders, cobbles, sands, gravel and clay

31
(locally called as Bhabar) the marshy and swampy land is marked at the junction between
Bhabar and Tarai formation at certain places which act as discharge zone.
Fig 4: Hydrogeological Map of Haridwar District
Further south of this formation (south to Solani River) the area is occupied by the formation
of lower piedmont plain comprised of sands of difference grade clay and silt. The water level

32
shows difference behavior in all the three existing formation. The ground water in the hills
emerges in the form of seepage and springs while the water level is deep in the Bhabar
zone.
The water level is quite deep in tube wells. In general the water table in this unit ranges
between 3.98 to 9.67 m bgl. South of the Solani river in third unit in lower piedmont plain
the water level ranges from 3.48 to 22.69 m bgl during pre-monsoon and 1.57 to 17.76 m
bgl during post-monsoon respectively The major central part of the block contains deep
water level up to 21 m bgl. The seasonal fluctuation ranges between -01.7 to 6.46 m. The
depth to water level map of Haridwar district for the year 2015 is given in Fig 5.
2. Bahadrabad Block:
Bahadrabad district is the biggest block in Haridwar district. It covers an area of about 466
sq. km. this block is situated in the north eastern part of the district. Its northern boundary
touches Dehradun district and eastern boundary touches the district Pauri Garhwal.
Bahadarabad block also possess the same topography/geomorphology as the Bhagwanpur
block. The similar hydrogeological condition prevails in the block. The ground water in
Siwaliks occurs in the form of seepage/springs, water level is deep in the Bhabar area which
becomes shallower in the Tarai region of the block. During the pre-monsoon period the
depth to water level ranges between 3.25 m bgl and13.53 m bgl, and 69.30 m bgl observed
at Laldhang. The reason being deeper water level at Laldhang as it is located at foothills of
the Siwaliks, where the formation is Bhabar. In general the water levels are deeper in
Bhabar formations. Upper Ganga Canal passes through the center of the block. The Bhabar
formation roughly extends up to Upper Ganga Canal. Below it or the south of the canal
lower piedmont plain or the Tarai exists. The water level is shallower south of Upper Ganga
Canal. The seasonal fluctuation ranges between -13.0 to 17.1 meters. The formation south
of canal consists of clay sands and silt. The shallow water level in the area may be because
of the effect of Upper Ganga Canal and other rivers flowing in the area. This also forms part
of Khadar because of the newer flood pains deposited by these rivers.
3. Roorkee Block:
Roorkee block covering an area of 217 sq. km. lies in the center of the district between
Bhagwanpur and Bahadarabad block. The sub-surface formations this bloc consists of cyclic

33
sequence of grey micaceous sand, silt and clay/brownish grey clay, sand and gravels with
occasional pebbles and boulders of terrace, fans and channel alluvium of quaternary age.
The depth to water level in most of this block lies between 3.20 to 19.39 m bgl. At certain
places the depth to water table observed in tube wells rests between 11.00 to 18.00 m bgl.
The seasonal fluctuation ranges between 0.47m to 3.65 meters.
Fig 5: Depth to Water Level Map for the Year 2015 of Haridwar District
4. Narsan Block:
Narsan block lies in the southwestern part of the district having an area of about 273 sq.
M. consists of the same formation as of Roorkee. The sediment of lower piedmont plain
occupies the block/ It consists of sands, gravels silt and clay of recent quaternary age. The

34
depth to water level in the area ranges between 4.0 m bgl to 19.0 m bgl. At certain place it
has been reported to 17.00 to 19.00 m bgl. The seasonal fluctuation ranges between 0.34
meter to 2.15 meters.
5. Laksar Block:
The Laksar block lying in the south-eastern part of the district form a part of Khadar.
Khadar is a local terminology used for the areas occupying the flood plains of the rivers and
recent sediments deposited by the rivers. It consists of mainly fine sand, silt and clay.
Ground water occurs in this area is in unconfined condition. Here the ground water occurs
at very shallow depth. The pre-monsoon post-monsoon depth to water level in this area
ranges between 4.38 to 5.69 m bgl and 2.32 to 2.53 m bgl respectively. The seasonal
fluctuation ranges between 1.85 to 5.69 meters.
6. Khanpur Block:
Khanpur block lies extremely south of the Haridwar district in flood plains of Ganga,
Bangana and Solani rivers. This area is also called Khadar. It also consists of the same
formation as of Laksar block. The depth to water in this area is also very shallow. Formation
consists of fine grained sand, silt and clay of recent age. In general the depth to water level
in entire area is less than 5m bgl. The pre-monsoon and post-monsoon depth to water
measured in the area ranges between 1.96 to 4.75 m bgl and 1.68 to 3.0 m bgl respectively.
The seasonal fluctuation ranges between -0.5 to 1.88 meters.
Long Term Depth to water Level:
The long-term water level has been examined from the Ground Water Monitoring Wells
(National Hydrograph Stations) of Haridwar district from 7 stations viz. Rampur, Jwalapur,
Laksar, Shahpur, Landaura, Bahadrabad and Raipur and is given in Table 9.

35
Table.9 Long Term Hydrograph Data of GWMW (DTW m bgl)
Well Location Year Jan May Aug Nov
Shahidwala Grant (DW)
2006 NA NA 11.63 12.12
2007 12.43 13.3 12.87 18.21
2008 13.23 14.04 10.24 12.18
2009 12.54 13.24 13.5 13.08
2010 13.39 14.59 11.26 10.92
2011 11.2 12.7 10.3 8.9
2012 10.09 12.19 11.3 11.13
2013 11.68 12.63 9.2 8.93
2014 9.2 10.60 9.4 8.06
2015 8.95 10.91 9.9 9.74
Bahadrabad (DW)
2002 3.7 4.15 2.18 3.17
2003 3.4 4.75 3.22 1.27
2004 4.08 4.91 4.92 4.9
2005 5 5.4 3.36 3.04
2006 4.04 5.1 4.12 4.18
2007 5.58 5.49 4.38 6.36
2008 5.73 4.78 3.35 4.36
2009 4.62 4.31 4.87 4.97
2010 5.1 5.56 2.5 1.97
2011 3.17 NA 2.48 4.82
2012 4.31 5.4 3.59 5.09
2013 5.63 5.44 10.15 4.41
Roorkee
2005 6 7.55 6.06 5.66
2006 5.72 6.45 6.1 6.12
2007 6.55 7.52 5.48 9.10
2008 6.48 7.79 5.2 5.96
2009 6.16 7.74 6.71 6.36
2010 6.1 7.04 5.3 5
2011 4.8 6.75 3.86 5.06
2012 5.98 7.68 4.95 6.72
2013 6.36 7.98 4.58 5.49
2014 4.98 7.30 6.7 6.88
2015 6.23 8.3 6.05 6.64
Jhabreda
2006 NA NA 10.34 10.24
2007 10.64 11.58 12 15.08
2008 9.82 12.34 9.13 9.68
2009 8.68 9.51 10.38 9.13
2010 8.62 9.34 9.66 6.72
2011 6.88 7.52 0.44 6.54
2012 5.63 11.24 3.42 9.54
2013 8.26 11.16 4.84 8.88
2014 7.39 10.17 9.14 9.40
2015 9.15 9.98 5.76 9.64
Hussainpur DW
2005 2.24 3.28 2.3 1.63
2006 1.73 4.73 1.83 2.4
2007 2.42 2.93 0.76 3.87
2008 2.68 3.44 1.11 2.93
2009 3.9 3.81 1.67 2
2010 2.17 4.04 1.13 2.76
2011 1.86 3 0.91 2.26
2012 2.54 4.49 1.58 2.57
2013 2.29 4.15 1.48 2.2
2014 2.13 4.73 2.63 2.47
2015 1.98 4.38 1.77 2.53

36
The analysis of the data reveals that there is minor declining trend at Bahadrabad station
while other stations shows minor rising trend in water level. Though the well at Roorkee is
showing declining trend in pre-monsoon while rising trend in post-monsoon. The pre-
monsoon and post-monsoon long-term trend ranges between -0.39 to 0.094 m/year and -
0.71 to 0.148 m/year respectively. The hydrograph analysis results given in the following
Table 10 and hydrographs are shown in Table 11.
Table 10.Long Term Hydrograph Analysis Results
S.No. Location Trend Equation No of Years data used
Water Level Trend m/yrs
Pre Post
1 Shahidwala Grant y = -0.391x + 800.3 10 -0.39 -0.71
2 Bahadrabad y = 0.087x - 169.6 12 0.087 0.148
3 Roorkee y = 0.094x - 182.5 10 0.094 -0.073
4 Jhabrera y = -0.128x + 268.7 10 -0.128 -0.291
5 Hussainpur y = 0.084x - 166.6 10 0.084 -0.067

37
Table 11: Hydrographs of different location in Haridwar district.
y = -0.3917x + 800.33
y = -0.7066x + 1432
0
5
10
15
20
2004 2006 2008 2010 2012 2014 2016
De
pth
to
Wat
er
Leve
l (m
)
Year
Long Term Water Level Trend
Pre(May)
Post(Nov)
Shahidwal Grant
y = 0.0945x - 182.51
y = -0.0732x + 153.4
0
2
4
6
8
10
2004 2006 2008 2010 2012 2014 2016
De
pth
to
Wat
er
Leve
l (m
)
Year
Long Term Water Level Trend
Pre(May)
Post(Nov)
Roorkee
y = 0.0871x - 169.68
y = 0.1485x - 294.13
0
1
2
3
4
5
6
7
2004 2006 2008 2010 2012 2014
De
pth
to
Wat
er
Leve
l (m
)
Year
Long Term Water Level Trend
Pre(May)
Post(Nov)
Bahadrabad
y = -0.1285x + 268.73
y = -0.2916x + 595.7
0
2
4
6
8
10
12
14
16
2004 2006 2008 2010 2012 2014 2016D
ep
th t
o W
ate
r Le
vel (
m)
Year
Long Term Water Level Trend
Pre(May)
Post(Nov)
Jhabrera

38
Hydrochemistry
The water samples from Dug wells, hand pumps and tube wells were collected during the
study in Haridwar district. These samples were analyzed in the Chemical laboratory of
CGWB, Northern Region, Lucknow. The water samples were analyzed to determine the
Electrical Conductance, total dissolved solids, hydrogen ion concentration and cat ions like
Silicon, Iron, Calcium, Magnesium, Sodium and Anions-Sulphate, Chloride, Carbonates and
Bi-carbonates.
Ground water in its natural form is clear, colorless, transparent and does not contain
suspended material or bacteria. But due to its slow movement in ground it has a long
contact with earth material it dissolves certain minerals and soluble. Its quality also
deteriorates due to anthropogenic activities. The chemical quality of ground water varies
from place to place depending upon the lithology, aquifer material and chemistry of the
sediments or rocks irrigation practices an urban activity. The chemical constituents in
solution dissociate in to electrically charged negative and positive particles called anions and
cat ions.
The water samples were collected in plastic container to avoid unpredictable changes in
physico-chemical characteristics. The testing of samples was done according to the
procedure prescribed by BIS, (IS: 10500, 2012). Present study comprises of interpretation
and analysis of water samples collected from thirty nine different monitoring stations at all
over district. The samples were analyzed for different chemical, physical parameters and the
results were carefully studied and analyzed. The collected groundwater samples were
analyzed for Electrical conductivity, pH, total hardness (TH) as CaCO3, calcium (Ca2+),
sodium (Na+), potassium (K+), bicarbonate (HCO3 ), chloride (Cl−), sulfate (SO4 ), nitrate (NO3
), and fluoride (F−), following the standard water quality methods . The evaluation of
chemical characteristics of groundwater and suitability of groundwater quality was for
drinking purposes.

39
Table 12: Chemical date of Haridwar District
Location Block Lat. Long.
Aquifer
Type pH
E.C
mS/cm
at 25°C HCO3 Cl F NO3 SO4
TH as
CaCO3 Ca Mg Na K SiO2
Budhwa Shahid Bhagwanpur
U.C 8.00 505 305 7.1 nd 18 7.1 260 72 19.5 8.5 1.4 22
Shahidwala
Grant Bhagwanpur 30.09 77.90 U.C 7.90 581 329 7.1 nd 34 6 300 76 26.8 8.3 1.3 20
Buggawala Roorkee
U.C 8.10 564 342 7.1 nd 23 5.4 290 76 24.3 9.2 1.4 22
Bandarjud Bahadrabad 30.05 77.94 U.C 8.00 592 366 14 nd 5.5 2.5 295 64 32.8 14 1.6 24
Rathaura Bahadrabad 30.01 77.94 U.C 7.80 570 354 7.1 nd 0.25 2.8 230 32 36.5 35 2.7 25
Kota Muradpur Bhagwanpur
U.C 8.00 628 403 7.1 nd 0.18 3.2 260 56 29.2 39 2.4 26
Teliwala Roorkee
U.C 7.90 902 317 92 nd 33 71 360 108 21.9 63 2.9 15
Imlikhera Roorkee 29.93 77.89 U.C 8.10 564 354 7.1 0.12 1.4 6.3 135 28 15.8 80 1.9 18
Bahabalpur Bhagwanpur 29.99 77.81 U.C 8.00 559 354 11 0.08 1.8 2.7 245 48 30.4 29 1.8 20
Bhagwanpur Bhagwanpur 29.94 77.81 U.C 8.10 812 329 96 0.12 0.81 37 350 72 41.3 44 3.6 21
Chudiyala Bhagwanpur 29.91 77.76 U.C 7.69 620 378 14 0.36 nd 10 275 56 32.8 29 3.2 25
Iqbalpur Bhagwanpur 29.87 77.80 U.C 7.97 455 262 18 0.52 nd 9.1 200 44 22 20 4.6 26
Jhabrera Narsan 29.81 77.78 U.C 7.75 950 354 78 0.33 26 80 360 68 46 70 8.4 25
Khera Jat Narsan 29.68 77.81 U.C 8.15 455 244 11 0.14 5.1 25 230 52 24 8.1 3.8 30
Narsan Narsan 29.71 77.91 U.C 8.15 545 281 25 0.2 nd 36 280 60 32 7.5 4.3 26
Libraheri Narsan 29.76 77.87 U.C 7.75 1535 494 128 0.13 86 177 490 64 80 80 119 28
Manglore Roorkee
U.C 7.86 544 299 11 0.21 1.3 37 270 68 24 6.9 5.9 22
Landhaura Roorkee 29.81 77.93 U.C 7.75 550 329 7.1 0.11 7.7 13 250 64 22 23 3.2 32
Sikhar Narsan 29.76 77.92 U.C 8.10 655 378 14 0.04 23 11 315 76 30 19 2.5 32
Amkheri Roorkee 29.74 77.94 U.C 8.15 397 220 11 0.3 11 7.8 180 48 15 11 2.8 28
Mundlana Narsan 29.74 77.91 U.C 7.88 665 329 35 0.13 29 23 290 76 24 31 4 31
Hussainpur Laksar 29.78 78.00 U.C 8.20 465 287 11 0.03 0.08 4.3 185 36 23 30 5 24

40
Laksar Laksar
U.C 7.70 1500 390 128 nd 3.8 310 610 88 95 92 11 14
Goverdhanpur Khanpur 29.71 77.96 U.C 7.90 725 427 21 0.01 0.31 17 200 44 22 87 5.1 20
Khanpur Khanpur 29.60 78.01 U.C 8.20 630 366 21 0.19 nd 18 180 40 19 74 7 19
Dallawala Khanpur 29.57 78.03 U.C 8.05 800 403 43 0.1 0.94 45 230 60 19 88 8.1 20
Roorkee Roorkee 29.86 77.90 U.C 8.16 332 171 7.1 0.44 nd 22 155 40 13 8.2 2.9 19
Bahadrabad Bahadrabad 29.92 78.04 U.C 8.00 262 128 7.1 0.21 nd 20 120 36 7.3 5.3 0.49 20
Sarai Bahadrabad 29.91 78.10 U.C 7.66 756 342 35 0.17 31 43 230 60 19 35 72 17
Panjaheri Bahadrabad
U.C 8.18 505 256 21 0.14 9.5 23 235 68 16 17 4.8 12
Dhanpura Bahadrabad 29.85 78.11 U.C 8.04 588 256 28 0.13 36 44 270 52 34 22 4.8 20
Shahpur
Sitlakhera Bahadrabad 29.76 78.11 U.C 7.98 730 342 28 0.21 41 42 310 68 34 19 36 20
Bikkhampur Laksar 29.75 78.14 U.C 7.76 585 317 14 0.23 0.18 30 280 60 32 17 4.3 23
Bhogpur Narsan 29.78 78.17 U.C 8.19 940 427 43 0.23 25 67 315 84 26 39 91 22
Sultanpur Laksar
U.C 7.70 1095 415 85 nd 49 82 435 92 50 62 20 23
Dudha
Dayalwala Bahadrabad
U.C 7.84 537 281 14 0.05 0.1 34 225 56 21 22 2.2 24
Laldhang Bahadrabad 29.85 78.31 U.C 7.85 572 305 7.1 nd 8.3 35 280 88 15 15 1.5 17
Shyampur Bahadrabad
U.C 7.86 598 336 14 0.01 15 21 295 72 28 8.7 3.4 19
Bhupatwala Bhagwanpur
U.C 8.10 555 329 14 0.08 1.7 12 260 72 19 21 2.1 22
Concentration in mg/l, U.C = Unconfined

41
Geophysical
Surface geophysical methods provide a relatively quick and inexpensive means to
characterize the sub-surface. Surface geophysical methods measure the physical properties
of the sub-surface such as electrical conductivity or resistivity, magnetic permeability,
density or acoustic velocity etc.
The resistivity surveys were carried out at proposed drilling sites with an objective to:
Delineate the boulder bed/s with their depths and thickness.
Delineate the ground water potential granular zone/s with their depths and
thickness.
Electrical surface geophysical methods can be used to detect changes in the electrical
properties of the sub-surface. The electrical properties of soils and rocks are determined by
water content, mineralogical clay content, salt content, porosity and the presence of
metallic minerals. However, typically the resistivity of the water has a larger effect on the
bulk resistivity than the soil or rock type. Variations in these electrical properties of soils and
rocks, either vertically or horizontally, produce variations in the electrical signature
measured by surface geophysical tools.
Data Acquisition
A total of nine sites were shown where resistivity surveys were to be conducted. The names
of the sites are as below:
1) Bhagwanpur
2) Sikandarpur
3) Latherdewa Sheikh
4) Nanhera Anantpur
5) Chudiala
6) Manakpur (Adampur)
7) Latherdewa Hun
8) Ramnagar, Roorkee City.
9) Mundlana (drilling was in progress).

42
In all a total of 10 VES were conducted at the above said sites. At these sites, VES points
were selected in such a way, that the maximum current electrode separation was achieved,
so that the deeper sub-surface information can be deciphered. But at some sites, due to the
irrigated agriculture fields, the larger spread was not possible. In order to achieve the
maximum electrode separation and avoid the irrigated fields, some VES were conduted
around 500 to 900 m away from the proposed drilling sites. The Schlumberger soundings
were conducted with the maximum current electrode separation (AB) ranging from 340 m
to 900 m, due to the spread constraints arising from field restrictions. Current electrode
separation were expanded in steps of 2 m up to AB/2 = 20 m and then in increment of 5 m
up to AB/2 = 100 m, with appropriate MN separation.
Table 13: The details and location of VES points in Haridwar District.
S. No. Site Name AB/2 (m)
Location
1 Bhagwanpur 200 At the corner of the field of Sh. Karam Singh, adjacent to the Mango orchard. Behind the B.D Inter College building & playground.
2 Sikandarpur 200 At the corner of Junior High Secondary School playground. Near volleybal gound & ajacent to Barat Ghar.
3 Latherdewa Sheikh 440 In the field of Aslam s/o Mustafa, adjacent to the field of Sarbad s/o Musaraf. Along the road. VES point is around 550 m away from the J.H.S. School.
4 Nanhera Anandpur VES-1 430 In the sugarcane field of Sh. Omprakash Tyagi near Jaypee cement factory & pond – Dabur.
5 Nanhera Anandpur VES-2 170 At the corner of land, proposed for school.
6 Chudiala 450 In the field of Sh. Ram Nath, along the cart track.
7 Manakpur (Adampur) 440 In the Popular tree field of Sh. Raj Pal.
8 Latherdewa Hun VES-1 260 Under the Banyan tree, at the proposed site.
9 Latherdewa Hun VES-2 280 In the field of Sh. Bhagmal, along the canal, around 600 m away from VES-1.
10 Mundlana 240 Near the house of Najin & Feroz Munshi. About 100 m from the drilling site.
11 Ramnagar (Roorkee) - Site in urban area, park surrounded with houses having total spread of around 40 m.

43
The VES were conducted using the microprocessor based DDR – 4 M resistivity meter,
manufactured by IGIS, Hyderabad. The resistivity meter consists of ‘Battery Backup’ unit for
current supply and ‘Measuring Unit’ for feeding the positions of current electrodes,
potential electrodes and displaying the measurements. The measurements are directly
displayed as ‘Apparent Resistivity’. The details and location of VES point along with their
half-current electrode separation is given in Table 13.
Exploratory Drilling
The Central Ground Water Board has constructed 33 tube wells in the district. Out of which, twenty
six are exploratory wells, six are observatory wells and one is piezometer drilled at Roorkee
University. The hydrogeological details of the tube well drilled by CGWB is given in Table 14 and also
shown on the groundwater exploration map in Fig 6.

44
Table 14: Hydrogeological details of Exploratory Wells Drilled by CGWB, in Haridwar District Uttarakhand State
Sno Village Block Toposheet No.
Lat. Long. Type of Well
Depth (m)
Well Completion
Diameter(mm)
SWL (mbgl)
Discharge(lps)
Drawdown(m)
T (m2/day)
Sp. Capacity(lpm/m of dd)
1 Baleki Yusufpur Bhagwanpur 53 G/13 29.89 77.79 EW 201 195 200 18 36.6 4.43 408 496.6
2 Chauli Sahabuddinpur Roorkee 53 G/16 29.99 77.77 EW 201 185 200 16.4 26.6 5.72 176 622
3 Chudiala Bhagwanpur 53 G/13 29.91 77.77 EW 201 189 200 18 30 4.25 339 706
4 Dhandera Roorkee 53 G/13 29.84 77.90 EW 201 187 200 18 33.3 3.9 377 1346
5 Kisanpur Jamalpur Bhagwanpur 53 G/13 29.92 77.84 EW 201 190 200 14 35 4.45 299 472
6 Mahi gran Parao Roorkee 53 G/13 29.88 77.88 EW 201 185 200 21.66 3.49 626 1195
7 Nagal Piloni Roorkee 53 G/13 29.97 77.88 EW 200 175 200 15 35 8.63 577 185
8 Padli Gujjar Roorkee 53 G/13 29.84 77.87 EW 201 189 200 34.58 2.84 1822 767
Ramnagar Roorkee 53 G/13 29.87 77.88 EW 179 168 200 33.33 3.85 1648 459
10 Sigroda Roorkee 53 G/13 30.00 77.85 EW 200 172 200 35 9.99 307 223
11 Sikanderpur Bhainswal Bhagwanpur 53 G/13 29.96 77.77 EW 200 175 200 20 33.33 5.98 925 375
12 Sirchandi Bhagwanpur 53 G/13 29.93 77.76 EW 200 151 200 22 30 5.22 264 344
13 Raipur Bhagwanpur 53 G/13 29.95 77.80 EW 203 160 200 1 35 7.02 791 433
14 Lather deva hun Roorkee 53 G/13 29.79 77.81 EW 200 182 200 6.26
15 Manglaur Roorkee 54 G/13 29.79 77.88 EW 204 180 200
16 Lather deva hun Roorkee 55 G/13 29.84 77.83 OW 178 178 200
17 Bindu Khadak Bhagwanpur 51 G/13 29.86 77.73 EW 200 185 200
18 Bhagwanpur Bhagwanpur 52 G/13 29.94 77.81 EW 200 190 200
19 Manakpur Adampur Bhagwanpur 53 G/13 29.84 77.75 EW 200 185 200
20 Mundlana Gurkul Narsen 29.74 77.92 EW 201 171 200 46

45
21 Manglaur Gurkul Narsen 29.79 77.88 OW 185 180 200
22 Lather deva Sheikh Roorkee 53 G/13 29.84 77.83 EW 200 178 200 40
23 Lather deva Sheikh Roorkee OW 175 175 200
24 Sikanderpur Bhainswal Bhagwanpur OW 180 175 200
25 Lalwala Mazbata Bhagwanpur 53F/16 30.05 77.94 EW 65.9 18.1 16.01 8.83 298 108.8
26 Landhaura Roorkee 53G/13 29.81 77.93 EW 224 15.98 38.33 3.55 647.88
28 Landhaura–1 Roorkee 53G/13 29.81 77.93 OW
29 Landhaura–2 Roorkee 53G/13 29.81 77.93 OW
30 Roorkee Roorkee 53G/13 29.86 77.90 Pz 205 5.85
31 Jwalapur–1 Bahadrabad 53K 29.93 78.10 EW 36.6 26.4
32 Jwalapur–2 Bahadrabad 53K 29.96 78.11 EW 45.7 26
33 Jwalapur–3 Bahadrabad 53K 29.96 78.11 EW 85.3 20.61 34.36 1.71 19850 1207

46
Fig 6: Groundwater Exploration Map of Haridwar District

47
Chapter-3 Data Interpretation, Integration and Aquifer Mapping
Ground Water Exploration:
As far as ground water exploration is concerned Central Ground Water Board has
constructed 33 tube wells in the district. Out of which, twenty six are exploratory wells, six are
observatory wells and one is piezometer drilled at Roorkee University. The drilled depth of
these wells ranges between 36.58 to 223.96 m bgl. The water level in these tube wells ranges
between 5.85 to 26.40 m bgl with a discharge ranging 21.66 to 46lps with drawdown 1.71 to
9.99 m. The transmissivity range between 298 to 2300 lpm with drawdown 1.71 to 8.83 m. The
transmissivity ranges between 176 to 19850 m2/day. The exploratory well drilled falls under
Bhabar zone as well as in Indo Gangetic alluvial plain.
Chemical Qualities of Shallow Ground Water:
The water samples collected from phreatic zone were analyzed. The details of chemical
constituents found in shallow water are given in Table 12. The analysis reveals the following
characteristics:-
1) Electric Conductance (E.C.):- The E.C. Value of the ground water in phreatic zone of
Haridwar district varies from 262 at Bahadrabad to 1535 at Libberheri. The E.C. is slightly
higher in Laksar block while rest all other part it is in between 500 to 900
2) Hydrogen ion concentration: - The hydrogen ion concentration is indicative of acidic and
alkaline nature of water. The pH value should be measured at the spot itself. The Value
of pH has been determined only after bringing the sample in to laboratory. The pH value
in all the samples is in between 7.66 to 8.2 indicating that the ground water in Haridwar
district is alkaline in nature.
3) Carbonate and Bi-Carbonates: - Carbonate is not found in the water samples collected
from the phreatic zone. However, the Bicarbonates range between 128 mg/l, to 494
mg/l at Siwalik Hills.
4) Chlorides:- The Chloride concentration in phreatic aquifer over the entire district ranges
between 7.1 mg/l to 28.0 mg/l excepted at some villages like Jhabrera, Sultanpur,
Bhagwanpur, Teliwala, have concentration ranging from 70 mg/l to 96 mg/l whereas the
highest concentration of chloride is found at Libherheri and Laksar which is 128 mg/l.
The Chloride content shows the very good quality of ground water.

48
5) Sulphate: - The excess concentration of Sulphate increases the soil salinity, though
Sulphur is an essential element in plant nutrition and in the form of Sulphate it is readily
available to the plants. The concentration of Sulphate in the ground water of the district
ranges between 2 to 80 mg/l except at Laksar where the Sulphate value has been
determined to 310 mg/l.
6) Fluoride: - The Fluoride concentration in the phreatic ground water in the district is
negligible. It ranges between 0.01 mg/l to 0.52 mg/l. As such the ground water in the
district is safe for drinking and irrigation purpose.
7) Nitrate: - Nitrate concentration in this shallow ground water is either nil or well within
the permissible limit of 45 mg/l. However, the nitrate ranges from nil to 34 mg/l except
at Libberheri and Sultanpur where the nitrate concentration is beyond the permissible
limit having value of 86 mg/l and 49 mg/l respectively. Thus the water is suitable for
drinking and agriculture purpose.
8) Calcium: - Calcium is the most common constituent of natural water and is controlled by
dissolved cozgas. The absence of Calcium in drinking water may cause rickets and teeth
defectiveness while presence of excess Calcium may cause gaut and urinary problems.
However, the concentration of Calcium present in the ground water 28 mg/l to 108 mg/l
except at Teliwala and Laksar where it has raised up to 108 and 92 mg/l respectively.
The maximum desirable limit of Calcium is 75 mg/l and the maximum permissible limit is
200 mg/l. Thus the concentration of Calcium is well within the desirable limits as per BIS.
9) Magnesium: - Magnesium is one of the constituents that cause hardness in water. Its
lower concentration is not harmful but the higher concentration is laxative. The
desirable limit of Magnesium is 30 mg/l and permissible up to 100 mg/l for drinking
purpose. The concentration of Magnesium ranges between 7.3 mg/l to 95 mg/l.
10) Total Hardness as CaCo3:- The total hardness as CaCo3 in ground water ranges between
120 mg/l to 360 mg/l except at at some villages like at Liberheri and Sultanpur where it
is between 435 to 490 mg/l, whereas the highest concentration of 610 mg/l is found at
Laksar village. The concentration of CaCo3 shows that groundwater in the district is hard
in nature.
11) Sodium: - The high concentration of the Sodium in ground water may cause alkaline soil
and harmful for the persons suffering from hypertension, cardial, renal and other
vesicular ailments. However, the concentration of Sodium ranges from 5.3 gm/l to 92

49
mg/l. except at Laksar it has raised to 92 mg/l. The ground water is suitable for domestic
and agriculture purpose.
12) Potassium:-The concentration of Potassium in ground water was not determined. It
suitable for domestic and irrigation purpose.
Fig 7: Groundwater Samples of Haridwar District Plotted in Piper-Trilinear diagram
An overall view of the Chemical quality of ground water from phreatic aquifer as given in Table
12 indicates that, the quality of water is very good and all the chemical constituents present in
the water are well within the permissible limit. The all-chemical constituents in ground water at
some places have shown a little higher concentration, although it is also with in permissible
limit.
Piper diagrams (Fig 7) are an example of water quality diagrams which are probably the most
frequently used today. The subdivisions of the trilinear or piper diagram depict that Mg-HCO3

50
type of water was predominated in almost all the blocks of the Haridwar District except in
Khanpur block where NaCa-HCO3 type of water is dominated which causes infiltration problem
which is evident by the shallow water level prevailing in the block.
So, on the whole, ground water from phreatic aquifer in Haridwar district is generally
fresh, potable, and free from any type of contamination and thus fit for human consumption.
Geophysical Survey Results
In all a total of 10 VES were conducted at different sites. At these sites, VES points were
selected in such a way, that the maximum current electrode separation was achieved, so that
the deeper sub-surface information can be deciphered.
Interpretation:
The values of a were plotted against the related half-current electrode separation on double
logarithmic scale paper of moduli 62.5 mm. The curves were carefully smoothened for the
interpretation. Preliminary quantitative interpretation of VES curve was attempted by semi
empirical ‘Auxiliary Point’ method with the help of two-layer master curves and auxiliary point
charts of Orellana – Mooney (1966). The VES curves were also analyzed by indirect method of
curve break / kink for deciphering boulder beds depth. The details of VES interpreted results for
two representative sites are as follows:
The surveyed area comprises of a horizontally layered sequence of clay, silt, sand, gravels, pebbles and boulders.
The resistivity sounding curves obtained in the area are of QK, KA & H type. The interpreted true resistivity of the field VES curves indicates 7 to 16 sub-stratum geo-electrical layers.
The sub-surface geological formations in the area are characterized by resistivity value in the range from 2 Ohm-m to 12500 Ohm-m.
The resistivity values less than 10 Ohm-m indicates clay and resistivity values in the range of 10 Ohm-m to 25 Ohm-m indicates the formation comprising of clay mixed with silt, fine to medium sand.
The resistivity values in the range of 25 Ohm-m to 75 Ohm-m indicates ground water promising formation comprising of medium to coarse sand, gravel and pebbles.
The resistivity values above 75 Ohm-m, depending upon the consolidation and depth, indicates formation being semi-consolidated to hard boulder bed.

51
The thin granular / clay / boulder zones at deeper depths, sandwiched between two thick layers, were not picked up in interpretation - limitation of technique.
At the Mundlana drilling site, the boulder bed encountered in drilling at the depth of 86 m
bgl is in corroboration with the geophysical interpreted geo-electrical layer having the
resistivity of 840 Ohm-m in the depth range of 80 to 136 m bgl and also by the indirect
method depth range of 90 – 95 m bgl.
1) Bhagwanpur
At this site, one VES was conducted with AB/2 of 200 m at the corner of the field of Sh. Karam
Singh, adjacent to the Mango orchard, behind the B.D Inter College building & playground. The
electrode spread was restricted to AB/2 of 200 m due to the Roorkee – Dehradun road on
eastern side. The interpreted true resistivity of the field VES curves indicates 11 sub-stratum
geo-electrical layers. The resistivity-sounding curve obtained at this site is of QA type (Figure 1).
The interpretation of VES gives the sub-surface information upto the depth range of 213 m bgl.
The details of interpreted true layer resistivity and thickness are given in Table 15.
Table 15: The interpreted results of VES at Bhagwanpur.
True Resistivity
(Ohm-m)
Thickness
(m)
Depth Range
( m bgl )
Inferred Geology
102 0.76 0.0 – 0.76 Top surface soil.
31 0.46 0.76 – 1.22 Medium to fine sand.
39 6.6 1.22 – 7.82 Medium to coarse sand.
24 49.4 7.82 -57.2 Medium to fine sand.
82 8.4 57.2 – 65.6 Boulder gravel mixed fmt.
19 14.0 65.6 – 79.6 Medium to fine sand.
93 14.4 79.6 – 94.0 Boulder gravel mixed fmt.
21 30.0 94.0 – 124.0 Medium to fine sand.
280 52.0 124.0 – 176.0 Boulder gravel mixed fmt.
16 37.5 176.0 – 213.0 Medium to fine sand.
135 -- 213.0 - -- Boulder gravel mixed fmt.
The resistivity value in the range of 75 to 300 Ohm-m indicates sand, gravel mixed boulder bed.
There are four such interpreted layers in this VES at the depth ranges of 57 – 66, 80 – 94, 124 –
156 and below 213 m bgl.
2) Sikandarpur
At this site, one VES was conducted with AB/2 of 200 m at the corner of Junior High Secondary
School playground, near volleyball ground & adjacent to Baratghar. The electrode spread was

52
restricted to AB/2 of 200 m due to the irrigated field on eastern side. The interpreted true
resistivity of the field VES curves indicates 10 sub-stratum geo-electrical layers. The resistivity-
sounding curve obtained at this site is of KA type (Figure 1). The interpretation of VES gives the
sub-surface information upto the depth range of 101 m bgl. The details of interpreted true layer
resistivity and thickness are given in table 16.
Table 16: The interpreted results of VES at Sikandarpur.
True Resistivity
(Ohm-m)
Thickness
(m)
Depth Range
( m bgl )
Inferred Geology
36 1 0.0 – 1.0 Top surface soil.
18 1 1.0 – 2.0 Medium to fine sand.
77 1.6 2.0 – 3.6 Coarse sand with gravel pebbles.
780 0.59 3.6 - 4.2 Boulder formation / dry sand
280 8 4.2 – 12.2 Boulder gravel mixed fmt.
74 37.4 12.2 – 49.6 Coarse sand with gravel pebbles.
2 5.2 49.6 – 54.8 Clay
12 38.9 54.8 – 93.7 Clay mixed silt to fine sand.
345 7.56 93.7 – 101.3 Boulder gravel mixed fmt.
42 -- 101.3 - -- Medium to fine sand.
The resistivity value in the range of 75 to 780 Ohm-m indicates gravel mixed boulder bed. There
are two such interpreted layers at this site in the depth ranges of 4 to 49 and 94 to 101.3 m bgl.
Clay layer is also likely to be expected at the depth range of 50 to 55 m bgl.

53
Also, from the analysis of field curves (kinks & curve break) and interpreted layer parameters,
the expected depth/s ranges at which there is possibility of encountering the boulder beds for
the remaining Surveyed sites are summarized as below:
S. No. Site Name Depth in m bgl
1 Bhagwanpur 57 -66, 80 -94, 124- 156 and below 213 m bgl.
2 Sikandarpur 4-49 & 94-101.3 m bgl. Clay layer is also likely to be expected at the depth range of 50- 55 m bgl.
3 Latherdewa Sheikh 10-29,75,95,100-114,132-156,170,196-209 & 233-255 m bgl.
4 Nanhera Anandpur 9 – 23, 45, 60, 80, 90, 132 - 147 and 257 to 293 m bgl.
5 Chudiala 75, 110 and 160 and 194 - 224 m bgl.
6 Manakpur (Adampur) 35 & 100 m bgl.
7 Latherdewa Hun VES-1 26 to 29, 33 to 47, 59 to 62 and 98 to 118 m bgl
8 Latherdewa Hun VES-2 4 to 17, 25 – 35, 75 and 160 m bgl.
9 Mundlana 16 - 39, 52 - 57, 62 - 71, 80 – 136, 150 - 162 and 180 m bgl (90 - 95, 120 – 130 by curve break)
10 Ramnagar (Roorkee) Resistivity survey not possible.
Aquifer 3-D disposition and Lithological Cross Section of Study Area
Two numbers of subsurface geological cross sections and an Aquifer 3-D disposition maps
were prepared based on the lithologs of the tube wells drilled by tube well construction
division, Roorkee as shown in the Fig 9a & b and Fig 10. One in the Indo Gangetic plain
(Mohammadpur-Goverdhanpur-Raisi-Khanpur-Bhogpur) and second in bouldary formation
(ManakpurAdampur-PadliGujjar-MahigramPadao-Patheri-Shyampur-Mithiberi). Preview of the
subsurface lithological cross section shows that nature of alluvial sediment is complex and
there is alternation of fine to coarse sediments and also three tier aquifer system exists in the
indo-Gangetic belt of Hardwar district separated by clay layers.
The saturated aquifer system is comprised of fine to coarse-grained sand and gravels. In the
bouldery formation (Bhabar belt) the aquifer group has been intervened by thin clay layers
which at places are thick are mixed with boulders and cobble, pebble.
The Aquifer 3-D disposition map reveals that the first aquifer is encountered after sandy clay
layer between 5-25 m. The 1st and the 2nd Aquifer are separated by 10-20m thick clay layer. In
Bhabhar belt GW occurs under unconfined conditions. In Terai belt GW occurs under confined
conditions. In Gangetic alluvium the GW occurs in Semi-Confined/ Confined conditions.

54
Fig 9a: Lithological Cross Section-1 of Haridwar District

55
Fig 9b: Lithological Cross Section-2 of Haridwar District

56
Fig 10: Aquifer 3-D disposition Map of Haridwar District

57
Chapter-4 Ground Water Resources
The ground water resource potential of Haridwar district has been done broadly within the
guidelines and recommendations made by Ground Water Resource Estimation committee
norms 1997 (GEC’ 97). The principal source of recharge to aquifer is the rainfall. The return
seepage from irrigated field, seepage from canals, water bodies and flood plains are the
additional sources for recharge to an aquifer system. The gross annual ground water recharge
estimates are made for monsoon and non-monsoon period separately.
Based on the GEC norms the block wise characterization of Ground Water Potential in
district Haridwar, taking the database of 2011 has been calculated and given in the following
Table 17.
Assessment of Ground Water Resource Potential of Unconfined and Confined
Aquifer System
The groundwater available in the zone of water level fluctuation forms dynamic groundwater
resource, which is annually replenishable. Below the zone of water table fluctuation, the
groundwater which is available in the perennially saturated portion of the unconfined aquifer
forms the in-storage or static groundwater resource of the unconfined aquifer. The thickness of
the unconfined aquifer varies from place to place depending upon depositional history.
Computation of Static Ground Water Resource
The In-storage availability of groundwater resources in the unconfined aquifers below the zone
of fluctuation is computed based on groundwater storage concept using specific yield of the
aquifer, which is computed as per the equation 1;

58
Table 17: Block wise Ground Water Resource Potential of Haridwar (As on 31-03-2011)
S. No
Assessment Unit (Block)
Net Annual Ground Water Availability
Existing Gross Ground Water Draft for irrigation
Existing Gross Ground Water
Draft for domestic and
industrial water supply
Existing Gross Ground Water Draft for All uses
Provision for domestic, and industrial requirement supply to 2025
Net Ground Water Availability for future irrigation development
Stage of Ground Water Development (%)
Categorization
1 Bahadarabad 16036.61 7295.58 291.82 7587.40 454.59 7994.62 47.31 Safe
2 Bhagwanpur 8783.87 8202.84 328.11 8530.95 424.61 -- 97.12 Semi Critical
3 Narsan 15475.10 4611.20 161.39 4772.59 311.11 10391.39 47.63 Safe
4 Khanpur 5913.08 4611.20 161.39 4772.59 239.85 900.64 80.71 Semi Critical
5 Laksar 9163.41 7066.40 247.32 7313.72 556.08 1293.61 79.81 Semi Critical
6 Roorkee 15731.15 6316.81 221.08 6537.89 307.46 8885.79 41.56 Safe
Total 71103.22 38104.03 1411.11 39515.14 2293.7 29466.05 65.69 -

59
Equation 1. Estimation of In-storage Ground Water Resources of unconfined aquifer
In-storage Ground
Water Resources
= Total thickness of the
granular zones in the
aquifer below the zone
of water level
fluctuation of the
aquifer down to
exploitable limit.
X Areal extent
of the
aquifer
X Specific Yield
of the aquifer
In the process of computing the In-storage (static) ground water resources, the volume of
granular zones in the aquifer has been worked out on the basis of ground water exploration
carried out by Central Ground Water Board.
Specific yield values adopted for assessment of in-storage resources of the unconfined
aquifers have been multiplied by a factor of 0.6 in view of the inherent uncertainties associated
with the degree of compaction/consolidation with increasing depth and the inherent nature of
lithofacies variation within the aquifer.
Table 18: Parameter & Static Resources for Unconfined Aquifer- Haridwar
Name of District
Area (Sq. Km)
Av. RLGL
(mamsl)
Predominent DTW (mbgl)
Av. Bottom depth (mbgl)
Thickness of Grainular Zones in Un-confinned Aquifer (m)
Adopted Specific Yield %
Static GW resources in unconfined aquifer (MCM)
Fresh Saline Total Fresh Saline
Total
1 2 3 4 5 6 7 8 9 10 11 12
Haridwar 1568 0 1568 274 12.77 45 32 0.108 5459 0 5459
TOTAL (MCM) 1568 0 1568 0 5459 0 5459
TOTAL (BCM) 5.46 0 5.46
Confined Resource
Methodology and Assumption
A confined aquifer is a porous and permeable geological unit, which is sandwiched between two
relatively low permeability layers. The confined aquifers are generally extensive. The main
source of recharge to any aquifer is rainfall. The recharge zone of a confined aquifer is located
far apart and the ground water is under pressure. Under pre-development conditions within a

60
confined aquifer, there is a dynamic equilibrium between recharge and the discharge or outflow
from an aquifer. Water is under pressure and the total volume in storage remains relatively
constant.
Assessment of development potential of confined aquifers assumes importance, since
over-exploitation of these aquifers may lead to far more detrimental consequences that those
of shallow unconfined aquifers. If the piezometric surface of the confined aquifer is lowered
below the upper confining layer so that de-saturation of the aquifer occurs the coefficient of
storage is no longer related to the elasticity of the aquifer but to its specific yield.
The most widely used analytical techniques are based on lumped approach using flow-
rate concept and storage concepts. These methods are given below;
i. Ground water flow rate concept
The rate of flow of water through a confined area may be estimated by Darcy’s
law as follows:
Q = T I L
Where,
Q = Rate of flow through a cross of aquifer in m3/day
T = Transmissivity in m2/day
I = Hydraulic gradient m/km
L = Average width of Cross-section in km
Sample Calculation: Flow Rate concept District: Haridwar, Uttarakhand SECTION – 1 Q = T. I . L ( m2/ day.m/m.m) = m3/day
Where T = Transmissivity (m2/ day)
I = Hydraulic conductivity L = length of the section across which water flows (m) ∂ h = 100 m ∂ l = 16.2 cm = 16.2 X 2.50 km = 40.5 km = 40.5 X 1000 = 40500 m ∂ h / ∂ l = 100 / 40500 L = 6.3 cm = 6.3 X 2.5 = 15.75 km = 15.75 X 1000 = 15750 m
Volume of water flowing across Section – I = T I L = 2000 x 100 / 40500 x 15750 = 77777.0 m3/day

61
= 0.78 MCM/day Q1 = 0.078 X 365 = 28.38 MCM/year
SECTION – II T = 1985.0
∂ h = 100 m ∂ l = 18.3 cm = 18.3 X 2.5 X 1000 m = 45750 m ∂ h / ∂ l = 100 / 45750 L = 17 cm = 17 X 2.5 X 1000= 42500.0 m Volume of water flowing across Section – II = T I L
Q2 = 1985 x 100 / 45750 x 42500 = 184399.0 m3/day = 0.1844 MCM/day ~67.3 MCM/year Total volume of water flowing across the district = Q Q = Section – I + Section – II = 28.38 + 67.3 = 95.68 MCM / Yr
Table 19: Ground Water Resources based on Flow Rate Concept- District Haridwar
Section
T (m2/day) Contour Interval of the
Piezometric
Surface (m)
( ∂ h )
Length of the Flow Line (m)
( ∂ l )
Length of the
Section across which
groundwater
flows (km)
Hydraulic
Gradient
Groundwater flow through
the Section by
maintaining confined conditions (m3/day)
Groundwater flow per year (MCM)
I 2000 100 40.5x1000 15.75 100/405
00
77777.0 28.38
II 1985 100 45.75x100
0
42.50 100/457
50
184399.0 67.30
Total groundwater flow (flux) across the area 95.68
Ground water storage concept
The co-efficient of storage or storativity of an aquifer is defined as the volume of water it
releases or takes into storage per unit surface area of the aquifer per unit change in head.

62
Hence, the quantity of water added to or released from the aquifer (ΔV) can be calculated as
follows:
ΔV = S Δ h
If the areal extent of the confined aquifer is A then the total quantity of water Q is
Q = S Δ h X A
Where,
Q = Quantity of water the confined aquifer can release (m3)
S= Storativity
A Areal extent of the confined aquifer (m2)
Δh = Change in piezometric head
The quantity of water released in confined aquifer due to change in pressure can be computed
between piezometric head (h1) at any given time ‘t’ and the bottom of the confining layer (ho)by
using the following equation
Qp = S A Δ h
= S A (ho – h1)
Where,
Qp = Quantity of water under pressure (m3)
S= Storativity
A Areal extent of the confined aquifer (m2)
Δh = Change in piezometric head
Ht = Piezometric head at time ‘t’
ho = Bottom of the confining layers

63
Table 20: Ground water Resources based on Storativity Concept-District Haridwar, Uttarakhand
District Section Area km2 Storativity of the
confined aquifer
Average thickness of the granular
zone confined
aquifer (m)
Average depth of
the bottom of
the confined
layer
Time averaged
Piezometric Head
(mbgl)
Scenarios head loss (m )
Ground water resource released
form storage of the confined aquifer MCM
No. Head loss (m)
Har
idw
ar
I 844.38 3.85 x 10⁻³ 27.0 45.0 10.0 1 2 3
1.0 10.0 35.0
3.25 32.51
113.78
II 1350 3.85 x 10⁻³ 28.0 35.0 7.50 1 2 3
1.0 10.0 25.0
5.19 51.90
129.94
Total volume of ground water that may be released from the storage of confined aquifer 243.72

64
Sample Calculation Using Storativity Concept District: Haridwar SECTION – I:
Area of the section (l) = 19.3 X 2.5 = 48.25 km2 (b) = 7 X 2.5 = 17.25 km2
Area = 48.25 X 17.5 = 844.38 km2 Storativity = 3.85 X 10-3
= 0.00385 Average depth of bottom of first confining layer = 45.0 m Time averaged piezometric head (h1) = 10.0 m
Scenario – I: If piezometric surface is lowered by 1.0 m through pumping Pumping water level (h0) = 11.0 m Head loss ∂ h = h0 – h1 =11.0 – 10.0 = 1.0 m Ground water Resources Q = Area X Storativity X change in piezometric head (∂ h) = 844.38X 3.85 X 10-3 X 1.0 = 3.25 MCM
Scenario – II: If piezometric surface is lowered by 10.0 m through pumping Pumping water level (h0) = 20.0 m
Head loss ∂ h = h0 – h1 = 20.0 – 10.0 = 10.0 m Ground water Resources Q = Area X Storativity X change in piezometric head (∂ h) = 844.38X 3.85 X 10-3 X 10.0 = 32.51 MCM
Scenario – III: If piezometric surface is lowered up to the bottom of first confining layer
Head loss ∂ h = h0 – h1 = 45.0.0 – 10.0 = 35.0 m Ground water Resources Q = Area X Storativity X change in piezometric head (∂ h) = 844.38X 3.85 X 10-3 X 35.0 Maximum Q1 = 113.78 MCM
SECTION – II:
Area of the section (l) = 18 X 2.5X 1000= 45000 (b) = 7 X 2.5 X 1000= 30000
Area = 135 X 107 m2= 1350 km2 Storativity = 3.85 X 10-3= 0.0038
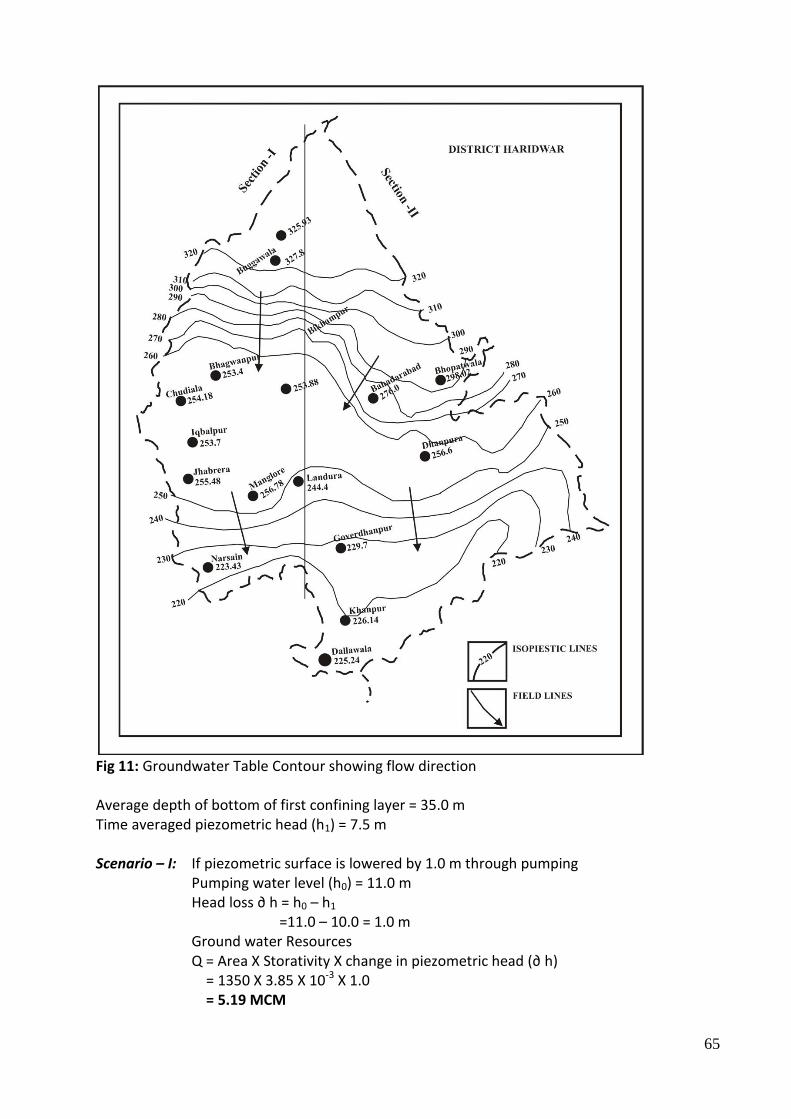
65
Fig 11: Groundwater Table Contour showing flow direction
Average depth of bottom of first confining layer = 35.0 m Time averaged piezometric head (h1) = 7.5 m
Scenario – I: If piezometric surface is lowered by 1.0 m through pumping
Pumping water level (h0) = 11.0 m Head loss ∂ h = h0 – h1 =11.0 – 10.0 = 1.0 m Ground water Resources Q = Area X Storativity X change in piezometric head (∂ h) = 1350 X 3.85 X 10-3 X 1.0 = 5.19 MCM

66
Scenario – II: If piezometric surface is lowered by 10.0 m through pumping Pumping water level (h0) = 20.0 m Head loss ∂ h = h0 – h1 = 20.0 – 10.0 = 10.0 m Ground water Resources Q = Area X Storativity X change in piezometric head (∂ h) = 1350 X 3.85 X 10-3 X 10.0 = 51.9 MCM
Scenario – III: If piezometric surface is lowered up to the bottom of first confining layer
Head loss ∂ h = h0 – h1 = 35.0.0 – 10.0 = 25.0 m Ground water Resources Q = Area X Storativity X change in piezometric head (∂ h) = 1350 X 3.85 X 10-3 X 25.0 Maximum Q1 = 129.94 MCM
Maximum water available in District Haridwar in confined aquifer by maintaining confining conditions
= 113.78 MCM + 129.94 MCM = 243.72 MCM
SUMMARISED AQUIFER WISE GROUNDWATER RESOURCES.
1. Unconfined Aquifer
a. Dynamic Zone
Net Groundwater Availability= 295 MCM
b. In Storage
Fresh Groundwater Resources= 5459 MCM
2. Confined Aquifer
a. Flow Rate Based Assessment= 95.68 MCM
b. Storativity Based Assessment= 243.72 MCM

67
Chapter-5 Ground Water Related Issues
Requirement of water are growing day by day due to increase in population, industrialization
and urbanization. The dynamic groundwater resources are becoming scarce due to
accelerated water demand and limited surface water availability in the unconfined aquifer. So
far CGWB has been estimating the dynamic resources and static groundwater resources. The
draft and water availability relationship indicate that many of the assessment units were
categorized as critical and or over exploited.
Declining Ground water Level:
The Ganga Alluvium comparatively covers a large area in Hardwar district, where maximum
agricultural activities are going on. The area has been extensively developed through shallow
tube wells. Being non-command area, there is an immense pressure on ground water. The
Ganga basin has deeper aquifers of large extension falling in Haridwar district. There is a
stress on the unconfined aquifer in the parts of Bhagwanpur block of district Haridwar where
declining water level trend are observed.
Groundwater Quality:
The chemical composition of natural water is affected by rock weathering and erosion.
Chemical analysis of water samples helps indicate the nature and importance of some of the
environmental factors to which water may be exposed in the hydrologic cycle. Hence,
periodic monitoring of water quality is important for establishing its suitability for various
purposes like drinking, domestic, agriculture and industrial and for deciphering the water
quality trends in space and time. Analysis of hyrochemical data also help in evaluating the
nature and extent of pollution, if any, and to ascertain the effectiveness of pollution control
measures already in existence.
An overall view of the Chemical quality of ground water from phreatic aquifer as given in
previous tables indicates that, the quality of water is very good and all the chemical
constituents present in the water are well within the permissible limit. The heavy metals
analysis in ground water at some places have shown higher concentration as given in the
below Table 21. The major heavy metals that are found above permissible limits are
Chromium (0.050 mg/l) and Lead (0.010 mg/l), also apart from these heavy metals Nitrate (45
mg/l) is also found in higher concentration at few locations.

68
Table 21: Summary of Heavy Metal Analysis from different location in Haridwar district.
S. No Location Nitrate (mg/l)
Chromium (mg/l)
Lead (mg/l)
1 Sahidwala Grant 147 0.094 --
2 Banjarewala -- 0.085 --
3 Ibrahimpur -- 0.070 0.060
4 Lamagrant -- 0.089 0.060
5 Roshanabad -- -- 0.080
6 Gangdaspur -- -- 0.070
7 Rawali Mehdood 100 0.062 0.070
8 Jamalpur Khurd 119 0.056 0.080
Permissible Limit 45 0.050 0.010
Remedial Measures
Apart from the decling groundwater level in the district the groundwater quality at few
locations given in the above table shows higher concentration of Nitrate and heavy metals
like chromium and Lead which makes the groundwater unfit for consumption. The main
contribution of nitrate in groundwater comes from decay of organic matter, sewage wastes
and application of nitrogeneous fertilizers. The mobile chromium in the groundwater could be
removed by pump and treat methods. However, if the geochemical equibilium is upset and
chromium is desorbed from the soil, then it would be very difficult to ever remove all of the
chromium by pump and treat. Traces of Lead in water, usually is the result of solution of lead
pipe through which the water has passed. Lead and the other metals are cation that can be
expected to undergo cation exchange with clays. Hence, the mobility of lead in groundwater
is limited. To remove the stress on the phreatic aquifer and to avoid the poor quality of
groundwater it is recommended to construct deep tubewells in these locations for
groundwater extraction and the well design for the deeper tubewells are given in the tables
and figure.

69
Well design for Zone 1
Depth of Well upto 140 m’s
Aquifer Tapped Sand along with pebbles/cobbles
Clay layer 40-50 m
Zonnes to be
Tapped B/W 60-100 m

70
Well design for Zone 2
Depth of Well
upto 100 m’s
Aquifer Tapped
Sand along with Boulders and pebbles/cobbles
Clay layer 35-45 m
Zonnes to be Tapped
B/W 50-80 m
Water Demand and Water Budgeting
Domestic Water Demand: Total population of Haridwar district is estimated to be 626313
(2015) which is projected to grow upto 701471 (2020) as per current population growth rate.
The gross water demand is estimated as 0.0730 BCM for domestic use (Table 22).
Crop Water Demand: Rice and wheat being major irrigated crop of the district, the total crop
water requirement is estimated as 1.2 m on hectare basis per year. Total sown area has been
calculated as 131883 hectare which includes 126764 hectare of irrigated area. Total annual
crop requirement has been estimated as 1.645 BCM while existing water potential is
estimated to be 1.316 BCM which creates a demand gap of 0.329 BCM. Thus it justifies the
strengthening of irrigation system in district through various interventions.
Livestock Water Demand As per Animal Census data , total livestock population of Haridwar
is 513693 and their annual water requirement has been estimated to be 0.067499BCM (2015)
which is projected to increase upto 0.067 by 2020. Keeping in view the future demand of
water for livestock, a water potential of 0.031 BCM need to be created (Table 22)
Industrial water requirement Industries are growing at a rapid pace in Haridwar especially in
Roorkee and adjoining area and water demand from industries is going to rise in future. It has
been estimated that current water requirement from industrial side is 0.013298BCM which is
projected to grow up to 0.013 BCM by 2020. This will also create further burden on existing
water potential of Haridwar (Table 22)

71
Water Demand for Power Generation: Since Uttarakhand is Power Surplus state as it supplies
power to various states, precise water requirement for power generation of Haridwar could
not be estimated.
Total Water Demand of the District for Various sectors: Overall, total water requirement of
Haridwar district for variety of stakeholders ranging from agricultural side to industrial use
has been estimated to be 1.798 BCM. This requirement has been further distributed as 0.073
(DOMESTIC), 1.645 (Crop), 0.067 (Livestock) and 0.013 (Industrial). It clearly indicates that
agricultural and related works are major sectors for water resource utilization.
Table 22 : Total Water Demand of the district for Various sectors S.No
. Block Components Total,BCM
Domestic Crop Livestock Industrial Power Generation
1 Bhagwanpur 0.013 0.274 0.013 0.003 0 0.304
2 Roorkee 0.014 0.220 0.010 0.003 0 0.245
3 Narsan 0.013 0.323 0.010 0.0023 0 0.348
4 Bahadrabad 0.0193 0.309 0.017 0.0043 0 0.350
5 Laksar 0.011 0.336 0.011 0.0013 0 0.358
6 Khanpur 0.003 0.183 0.006 0.00033 0 0.192
Total 0.073 1.644 0.067 0.0132 0 1.798
Water Budget Budgeting of water resources is an uphill task as it involves many static and
variable factors. Nevertheless, they are important for Haridwar district as it will enable to
formulate our water and irrigation schemes. Current water requirement of Haridwar district is
estimated to be 1.776 BCM (Table 23) which is projected to rise by 2.132 BCM by 2020. Thus
it would create a water gap of 0.426 BCM which need to be met to achieve our
developmental goals.
Table 23 : Water Budget Name of
Blocks Existing Water
availability (BCM) Total
(BCM) Water Demand (BCM) Water Gap (BCM)
surface water
Ground water
Present Projected (2020)
Present Projected (2020)
Bhagwanpur
0.02 0.92 0.94
0.023 0.028 0.005 0.006 Roorkee 0.014 0.017 0.003 0.003 Narsan 0.007 0.008 0.001 0.002 Bahadrabad 0.088 0.106 0.018 0.021 Laksar 0.000 0.000 0.000 0.000 Khanpur 0.000 0.000 0.000 0.000 Total 0.02 0.92 0.94 0.132 0.158 0.026 0.032

72
Chapter-6 Management Strategies
To achieve above objectives, there should be focus on end-to end solution in irrigation supply chain, viz. water sources, distribution network, efficient farm level applications, extension services on new technologies & information etc. Broadly, the focus of should be on:-
a) Creation of new water sources; repair, restoration and renovation of defunct water sources; construction of water harvesting structures, secondary µ storage, groundwater development, at village level.
b) Promotion of scientific moisture conservation and run off control measures to improve ground water recharge so as to create opportunities for farmer to access recharged water through shallow tube.
c) Promoting efficient water conveyance and field application devices within the farm viz, underground piping system, Drip & Sprinklers, pivots, rain-guns and other application devices etc.
d) Encouraging community irrigation through registered user groups/farmer producers’ organizations/NGOs.
e) Farmer oriented activities like capacity building, training and exposure visits, demonstrations, farm schools, skill development in efficient water and crop management practices (crop alignment) including large scale awareness on more crop per drop of water through field days, and extension activities.

73
Conclusions
Haridwar district having a geographical area of 2360 km2 lies in the southwestern part of
the Uttarakhand state. It has three tehsils viz. Roorkee, Bhagwanpur and Laksar and six
development blocks with a population of 1890422 (census 2011). The district forms a part of
Indo-Gangetic alluvial plain having master slope towards south. The district is bounded by
river Ganga in the east which forms the major drainage system of the district Solani river
along with its tributaries are the other major drainage system of the area which drains the
central part of the Haridwar district. The average normal annual rainfall in Haridwar district is
1174.3 mm. The district Haridwar can broadly be divided in to four geomorphologic units, the
structural hills consisting of middle and upper Siwaliks, the foothills of Siwaliks forming the
Bhabar formation. The Bhabar formation is characterized by boulders, cobbles, pebbles,
sands of various grade and the clays. As the northern part receives copious amount of rainfall
that give rise to seasonal nallas and they carry loads with them from middle and upper
Siwaliks and depositing them in the forms in gradational fashion. This process has given rise
to the Bhabar formation. These Bhabar are the recharging zone for the aquifer system of the
indo gangetic plain. The water level in the entire district generally follows its topography.
Bhabar being the recharge zone, here the water levels are very deep. The deepest water level
measured here is around 69 meters below ground level in the tube wells drilled in this
formation. This Bhabar further south of it is separated by swampy and marshy land where the
water is oozing out in the nallas, called spring line, the later merging interceptibly in to the
gangatic alluvium. The spring line is sporadic in the Haridwar district. The southern part can
be called as older alluvial plain (upper piedmont plain PPU) and the younger alluvium plain
(lower piedmont plain PPL). Ground water generally occurs under water table condition in the
Bhabar belt although the deeper aquifer in the peripheral portions of this belt may occur
under low confined condition due to intercalations of confining clay that usually taped off up
with water table rests between 65.92 to 121.95 meters below ground level have yield ranging
from 961 lpm to 2730 lpm of water at economic drawdown.
The ground water in the Bhabar belt has presently experiences acute water scarcity; can
be developed by using latest techniques. The southern part of the district contains a good
thickness of granular material sediments of older alluvium as well as younger alluvium.
Science, the aquifer system has three-tier system, each of this aquifer group contains
considerable thickness of sand. Sand percentage ranging from 50 to 60% can yield a good

74
amount of water at economic drawdown. Tapping any of the aquifer group, it is quite safe to
tap second and third aquifer below 150 meter for further development in the southern part.
The upper most aquifer group should be left for shallow borings for the local farmers to use.
Some of the areas like Bahadrabad and Roorkee blocks showing deep water level and decline
in the water table, here ground water should be utilized precisely by tapping deeper aquifers
and further development should be done under planned way and scientific manner.
In Bahadrabad and Bhagwanpur block, Roorkee and Landaura area where the water level
is quite deep, rainwater harvesting practice should be adopted in a scientific and planned
manner, As it has been observed that around Bhagwanpur township the industrial activities
area going on and there are a number of sugar mills in Laksar and Chudiala areas the
industrialist should be advised to adopt the root top rainwater harvesting system and waste
sewerage treatment plant, so that it may not contaminate the ground water.