Embed Size (px)
Citation preview

1
Hardware Monitors for Dynamic Page Migration
Mustafa M. TikirठJeffrey K. Hollingsworth San Diego Supercomputer Center
9500 Gilman Drive, 0505 La Jolla, CA 92093
Computer Science Department University of Maryland
College Park, MD 20742 [email protected] [email protected]
‡ This work was done while a student at the University of Maryland, College Park. § Correspondence for the manuscript. Tel: (858) 822-0886 Fax: (858) 534-5117
2
Abstract
In this paper, we first introduce a profile-driven online page migration scheme and investigate its
impact on the performance of multithreaded applications. We use centralized lightweight, inexpensive
plug in hardware monitors to profile the memory access behavior of an application, and then migrate
pages to memory local to the most frequently accessing processor. We also investigate the use of
several other potential sources of data gathered from hardware monitors and compare their
effectiveness to using data from centralized hardware monitors. In particular, we investigate the
effectiveness of using cache miss profiles, Translation Lookaside Buffer (TLB) miss profiles and the
content of the on-chip TLBs using the valid bit information. Moreover, we also introduce a modest
hardware feature, called Address Translation Counters (ATC) and compare its effectiveness with other
sources of hardware profiles.
Using the Dyninst runtime instrumentation combined with hardware monitors, we were able to
add page migration capabilities to a Sun Fire 6800 server without having to modify the operating
system kernel, or to re-compile application programs. Our dynamic page migration scheme reduced
the total number of non-local memory accesses of applications by up to 90% and improved the
execution times up to 16%. We also conducted a simulation based study and demonstrated that cache
miss profiles gathered from on-chip CPU monitors, which are typically available in current micro-
processors, can be effectively used to guide dynamic page migrations in applications.
Keywords
Dynamic Page Migration, Hardware Performance Monitors, cc-NUMA Systems, Multiprocessor
Systems, OpenMP Applications, High Performance Computing, Address Translation Counters,
Runtime Optimization, Full System Simulation
3
1. Introduction
The dominant architecture for current shared-memory multiprocessor systems is cache-coherent non-uniform
memory access (cc-NUMA). In cc-NUMA systems, processors have a faster access to the memory units
local to them compared to the remote memory units. For example, the remote and local latencies in mid-
range Sun Fire 6800 servers is around 300ns and 225ns[6], respectively where as the remote and local
latencies in a 512 processor Altix 3000 is around 605ns and 145ns, respectively[21]. Traditionally cc-NUMA
systems use physical first-touch page placement where memory pages are placed into the memory that is
local to the processors that touch the page first. However, first-touch placement may result in non-local
placement of a page relative to the processor that accesses it the most, which may have a significant impact
on memory performance of the memory intensive applications running on cc-NUMA servers.
In this paper, we first introduce a user-level memory page migration scheme, namely dynamic page
migration. In this page migration scheme, applications are profiled to determine the preferred locations of the
memory pages in the memory units using hardware monitors. Then system calls are used to request the
kernel to migrate the memory pages to the specific memory units. In this dynamic page migration scheme,
both profiling and page migrations are conducted during the same run of the applications. The access
frequencies of the memory pages by the processors are gathered continuously at runtime using hardware
monitors and the pages are migrated local to the most frequently accessed processors at fixed time intervals.
Although page migration has been extensively studied in prior research, our dynamic page migration
approach demonstrates several novel features. First, our goal is not to introduce a new page placement
policy. Instead, we demonstrate that the combinations of in-expensive plug in hardware monitors that sample
information about interconnect transactions and a simple page migration policy can be used effectively to
improve the performance of real scientific applications. Second, even on multiprocessor systems with small
remote to local memory latency ratios, optimizing page placement still provides substantial benefit to some
applications. The remote to local memory latency ratio of the Sun Fire system we used is 1.33:1. We believe
our page migration scheme will be more effective on systems with large remote to local latency ratios.

4
The hardware performance monitors we used to gather page access profiles for our actual dynamic page
migration scheme are centralized external pug-in monitors. These monitors listen to all address transactions
on the system interconnect in the cc-NUMA server. However, such monitors are not available in most
systems. Moreover, for non-bus based multiprocessors that do not use a common address and data bus, it is
difficult to implement such centralized monitors that need to listen to all transactions on the system
interconnect. Alternatively, many processors now include on chip hardware support for performance
monitoring such as MIPS R10000[22], Compaq Alpha[7], Itanium from Intel[10], Sun UltraSPARC[17].
In this paper, we also investigate the use of several other potential sources of profiles gathered from
hardware monitors in dynamic page migration and compare their effectiveness to using profiles from
centralized hardware monitors. In particular, we investigate the effectiveness of using cache miss profiles
and TLB miss profiles from on-chip CPU monitors, and sampling the content of the processor TLBs. If such
sources of information can provide sufficiently accurate information, it would mean software based
migration could be performed on systems without the need for dedicated hardware monitors. We also
introduce a simple hypothetical modest hardware feature, called Address Translation Counters (ATC), which
is specifically designed to gather profiles for dynamic page migration and compare its effectiveness with
other sources of profiles. The ATC hardware is a set of additional counters included in the TLBs of a
processor and gathers accurate information on access frequencies to the memory pages by the processor.
To evaluate the effectiveness of our dynamic page migration scheme, we implemented our page
migration scheme for a Sun Fire 6800 server with Sun Fire Link[13] hardware monitors for the Sun Fireplane
system interconnect. To evaluate the effectiveness of using each source of profiles in dynamic page
migration, we conducted a simulation based study using a full system simulator, Simics[12]. We present the
results of our studies in terms of the number of page migrations triggered, reduction in the number of non-
local memory accesses, and improvement in execution times of the applications. We present the results for
OpenMP C implementation of the NAS Parallel Benchmark suite[15] for both our actual page migration
scheme and our simulation study.

5
2. Hardware and Software Components for Dynamic Page Migration Scheme
In this section, we describe the hardware and software components used in our actual dynamic page
migration scheme. We first describe the architecture of the Sun Fire servers. We next describe the centralized
Sun Fire Link hardware monitors. Finally, we give a brief explanation about the system calls that we used.
2.1 Sun Fire Servers
The Sun Fireplane interconnect is Sun’s fourth generation of Symmetric Multiprocessor Systems (SMP)
interconnect. The Sun Fireplane interconnect is implemented with up to four levels of interconnect logic
depending on the number of processors in the server[6]. In medium and large-sized Sun Fire servers,
processors and memory units are grouped together on system boards (locality groups)[17]. Each system
board contains 4 processors and 4 memory units local to the processors.
In Sun Fire servers, the transfer time to move a data block from a memory unit to the requesting device is
non-uniform depending on the system boards the memory unit and requesting processor are on. Processors
on a system board have faster access to the memory banks on the same board (local memory) compared to
the memory banks on another board (non-local memory). For example, back-to-back latency measured by a
pointer-chasing benchmark in a Sun Fire 6800 server with 750MHz CPUs is around 225ns if the memory is
local and 300ns if the memory is non-local.
The Sun Fire 6800 server is a mid-range cc-NUMA architecture based on UltraSPARC III processors
and Sun Fireplane interconnect. It supports up to 24 processors and 24 memory units. The processors and
memory units in these servers are grouped into 6 system boards. Each processor has its own on-chip and
external caches. Mid-range Sun Fire systems use a single snooping coherence domain that spans all the
devices connected to a single Fireplane address bus.
2.2 Sun Fire Link Hardware Monitors
For our actual dynamic page migration scheme, we use the Sun Fire Link hardware monitors[14] to gather
profiling information for page migration. The Sun Fire Link hardware monitor counts and samples the
transactions on the address bus of the Sun Fireplane interconnect. These monitors were developed as part of
a system to cluster multiple systems together, thus they listen to the address bus of the system interconnect.
6
The Sun Fire Link Monitors consist of two 32-bit counter registers, a programmable control register that
activates the counters, two registers to filter transactions based on transaction type, and two sets of mask and
match registers to filter transactions based on other parameters, such as physical address range and the device
identifier. In addition to counter registers, the Sun Fire Link Bus Analyzer has an 8-deep FIFO that records a
limited sequence of consecutive interconnect address transactions. Each recorded transaction includes the
requested physical address, the requestor device id, and the transaction type. The bus analyzer is configured
with mask and match registers to select specific address ranges, processors or transaction types.
Even though the Sun Fire Link monitors provide useful information about the addresses and requesting
processors, the information is at the level of physical addresses. To accurately evaluate the memory
performance of an application, the address transactions have to be associated with virtual addresses used by
the application. This requires us to reverse map physical addresses back to virtual addresses. We used the
meminfo system call in Solaris 9 to create a mapping between physical and virtual pages in the applications.
2.3 System Calls in the Solaris 9 Operating System
To ensure the reusability of local caches in the processors, each application thread should be scheduled on
the same processor, if possible, throughout its execution[16]. To ensure the reusability of local caches and to
accurately count page access frequencies by processors independent of thread scheduling, we explicitly bind
application threads to the processors in the system. We bind application threads to the processors in a round
robin fashion using the processor_bind system call in Solaris.
Solaris places each physical memory page into the memory that is local to the first processor that touches
the page. To move pages in our dynamic page migration scheme, we use the move-on-next-touch feature of
the madvise system call in Solaris 9. Using the move-on-next-touch feature, we request the operating system
to move a range of virtual memory onto the local memory of the processor that next touches the range.
3. Dynamic Page Migration Methodology
Our dynamic page migration algorithm consists of two different modules. The first module gathers profiling
information using the Sun Fire Link monitors. The second module moves memory pages using the profiling
information gathered by the first module. In our approach, we insert instrumentation code into the application
7
to gather profiling information, to migrate the memory pages, to bind application threads to processors and to
detect the application termination.
We used Dyninst[2] to insert instrumentation code into applications. Dyninst is a library that permits the
insertion of code into a running program. The Dyninst library provides a machine independent interface to
permit the creation of tools and applications that use runtime code patching.
For our dynamic page migration algorithm, instrumentation code is inserted at the entry of the main
function, exit point(s) of thr_create function, and the entry of exit function. The instrumentation code that is
inserted at main loads a shared library that creates additional helper threads for gathering profiling
information and migrating memory pages. The instrumentation code inserted at the exit point(s) of thr_create
calls the processor_bind system call to explicitly bind the newly created application threads to available
processors in a round robin fashion. The helper threads are bound to dedicated processors and the remaining
processors are used to bind the other threads in the application. The instrumentation code inserted at the entry
to exit function detects the application termination and cleans up the hardware monitors.
Our dynamic page migration algorithm is a two-phase algorithm. It creates two helper threads, one for
profiling and another for page migration. The profiling thread samples the interconnect transactions and
updates the access frequencies of the memory pages for each system board. The migration thread stops the
execution of all other application threads at fixed time intervals and triggers page migration based on the
profiling information gathered. To trigger migration on a page, our scheme uses the move-on-next-touch
feature of the madvise system call on the page. In addition, to prevent memory pages ping-ponging between
memory units, we freeze memory pages that have been migrated recently for a fixed number of page
migration iterations (We freeze a page for 3 consecutive iterations after migration). Thus, the memory pages
are migrated at fixed time intervals and a page may be migrated more than once throughout application
execution.
Our migration algorithm does not use a minimum access frequency threshold to trigger the migration of a
page. At every migration interval, regardless of the number of accesses to a page, the page is considered as
candidate for migration. Alternatively, we could limit migration to the pages with a minimum number of

8
accesses or cache misses and thus migration overhead would potentially be eliminated for pages with little
contribution to the application's memory time.
Our dynamic migration scheme does not have a particular mechanism for cache coherency but rather
relies on the cache coherency mechanism the underlying operation system uses since our approach is
designed for cache coherent NUMA systems that already have cache coherency mechanism implemented.
Instead, we advise the underlying OS to move the page to a different location in physical memory and cache
coherency is maintained by the OS by updating the TLB entries and invalidating the cache lines that are
indexed using the physical addresses. Moreover, in our scheme, when migration is triggered for a page, we
do not have a control whether a victim page will be evicted from the target physical memory if there is no
available page for the migration to succeed. We instead rely on the mechanisms used in the underlying OS3.
In our page migration scheme, the two helper threads are bound to dedicated processors. However, these
helper threads are mostly idle other than gathering profiling information and triggering page migrations at
fixed time intervals. To isolate the impact of page migration on non-local memory accesses, we chose to bind
these threads to dedicated processors. Instead, these threads could run on the processors the application
threads run and make use of idle cycles. Alternatively, these threads can be pushed to the OS level by adding
two more threads to the OS. More importantly, considering the impact of chip-level multiprocessor
architecture on processor costs, additional dedicated processors can be included to the HPC systems for
application profiling and page migration.
4. Other Sources of Hardware Profiles for Dynamic Page Migration
In our actual page migration scheme on the Sun Fire server, we use the centralized Sun Fire Link monitors to
identify the preferred locations of memory pages for dynamic page migration. However, such monitors are
not available in many systems. Moreover, for non-bus based multiprocessors that do not use a common
address and data bus, it is difficult to implement such centralized monitors that need to listen to all
3 In the underlying OS we used for this research, page migration fails if there is no available physical page on the target memory. However, we have not seen a case where migration was denied since we track how much memory is used by the application and don’t move pages if we run short on memory. In practice, this constraint never caused us to fail to make a desired migration.
9
transactions on the system interconnect. Alternatively, many processors now include on chip hardware
monitors for performance tuning. In this section, we describe other potential sources of profiles that can be
used to generate page access frequencies. Later in the experiments section, we present the results of our
simulation based study to investigate the effectiveness of these other sources of profiles.
4.1 Profiles from Distributed On-Chip CPU Monitors
Profiles of page access frequencies by processors in an application running on a cc-NUMA system can be
gathered by using information about the cache or TLB misses by each processor in the system. If the
information about the number of cache or TLB misses on each page by a processor is known, the access
frequency of the page by the processor can be approximated. However, for such information to be available,
the addresses associated with the cache and TLB misses are needed.
Many processors include hardware support to count events for performance monitoring. Moreover, they
often provide mechanisms to trigger an interrupt when a given number of events occur. More recently, an
increasing number of processors provide the ability to capture the memory addresses and/or instructions
involved in performance critical events. (Note that some monitors may provide approximate information
about the instruction(s) involved due to the difficulty of associating information with specific events when
many instructions are in flight. However, even approximate information still provides valuable insight for
dynamic tuning of applications). For example, the Itanium 2 processor provides a set of event address
registers (EARs) that record the instruction and data addresses of data cache misses, the instruction and data
addresses of data TLB misses, and the instruction addresses of instruction TLB and cache misses[10]. Thus,
by distributed sampling of the addresses associated with the cache or TLB miss events, profiles of page
access frequencies by processors can be generated. Moreover, since cache miss events are generally
distributed throughout the execution and provide information on fine grain behavior, profiles of page access
frequencies gathered from cache miss events may be more representative. Compared to cache misses, the
number of TLB miss events is generally lower and these events may not correspond to the pages that are
frequently accessed due to the fact that applications tend to keep frequently accessed pages in TLBs. In this
paper, we investigate the use of cache and TLB miss information from on-chip CPU hardware.
10
4.2 Profiles from Valid Bit Information in TLB Entries
Hardware tries to keep virtual-physical page translation entries of the frequently accessed pages in the
processor TLBs. Thus, the contents of the valid TLB entries in a processor potentially provide information
on the pages that are mostly accessed by the processor. By sampling the content of the TLBs periodically, it
is possible to approximate page access frequencies by the processor. Similarly, the information from each
processor can be combined and page access frequencies by processors can be generated to guide migrations
in a dynamic page migration scheme.
To sample the contents of valid TLB entries of a processor, the underlying operating system needs to
provide a software sampling mechanism. In particular, the operating system needs to provide a means to
query the list of valid entries and the virtual addresses of the pages for each valid TLB entry. In our research,
we assume the underlying operating system provides a system call that returns the list of virtual page
addresses in the valid TLB entries for a given processor.
4.3 Address Translation Counters
To further evaluate the effectiveness of sources of profiles in dynamic page migration, we designed a
dedicated hardware monitor that gathers accurate page frequencies and compared the effectiveness of other
sources of profiles with the dedicated monitors.
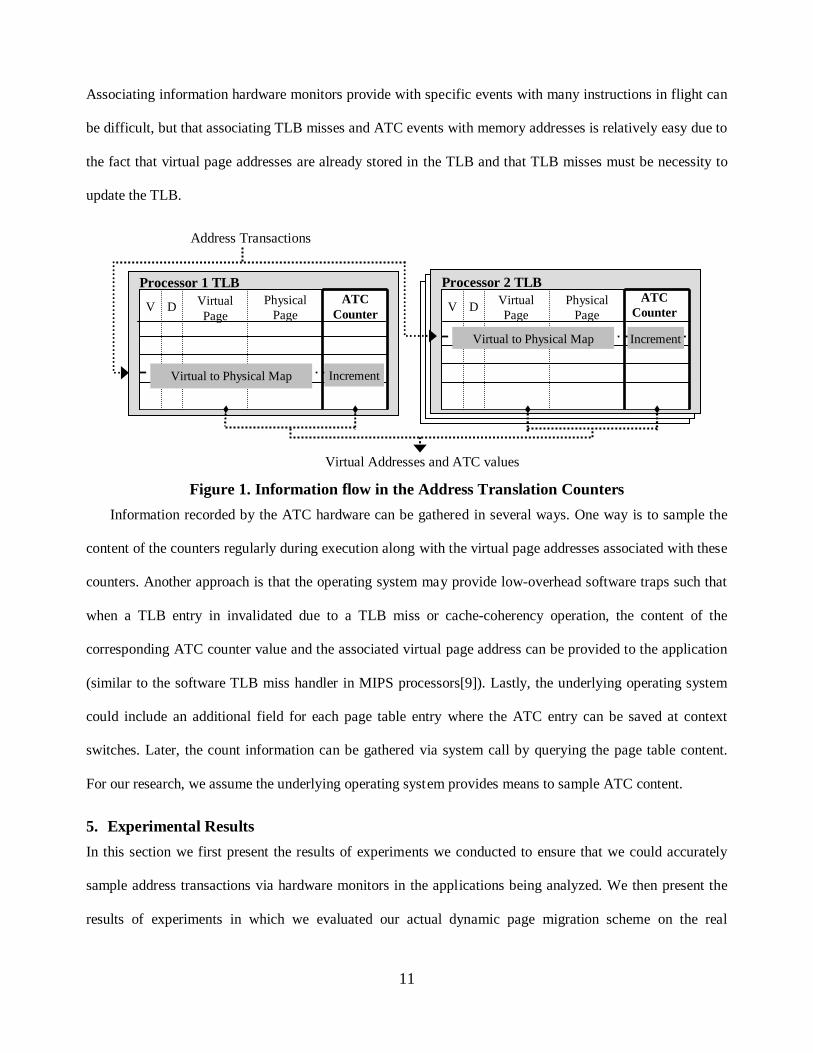
The hypothetical hardware feature we use, Address Translation Counters (ATC), is a set of additional
counters that is included in the TLBs of the processors. In ATC, a counter is included for each TLB entry in a
processor (Shown in Figure 1) and incremented when a virtual to physical address translation is satisfied by
the corresponding TLB entry. Moreover, when the content of a TLB entry is evicted due to a TLB miss or
invalidated due to other reasons such as cache coherency operations, the counter associated with the TLB
entry is cleared. The ATC is included in each processor and counts the number of accesses to the memory
pages by the processor using the virtual to physical address translations requested while the memory pages
are actively accessed. Note that the main reason for introducing these counters is to evaluate the effectiveness
of other sources of profiles by comparing them to this hardware feature as ATC counters are more likely to
capture page access frequencies more accurately compared to other more indirect sources of profiles.
11
Associating information hardware monitors provide with specific events with many instructions in flight can
be difficult, but that associating TLB misses and ATC events with memory addresses is relatively easy due to
the fact that virtual page addresses are already stored in the TLB and that TLB misses must be necessity to
update the TLB.
Figure 1. Information flow in the Address Translation Counters
Information recorded by the ATC hardware can be gathered in several ways. One way is to sample the
content of the counters regularly during execution along with the virtual page addresses associated with these
counters. Another approach is that the operating system may provide low-overhead software traps such that
when a TLB entry in invalidated due to a TLB miss or cache-coherency operation, the content of the
corresponding ATC counter value and the associated virtual page address can be provided to the application
(similar to the software TLB miss handler in MIPS processors[9]). Lastly, the underlying operating system
could include an additional field for each page table entry where the ATC entry can be saved at context
switches. Later, the count information can be gathered via system call by querying the page table content.
For our research, we assume the underlying operating system provides means to sample ATC content.
5. Experimental Results
In this section we first present the results of experiments we conducted to ensure that we could accurately
sample address transactions via hardware monitors in the applications being analyzed. We then present the
results of experiments in which we evaluated our actual dynamic page migration scheme on the real
V D ATC
Counter
Processor 2 TLB
V D Virtual Page
Physical Page
Virtual to Physical Map
Virtual Addresses and ATC values
Virtual to Physical Map Increment
Increment
ATC Counter
Virtual Page
Physical Page
Processor 1 TLB
Address Transactions

12
hardware and simulation based study where we compared the effectiveness of other sources of profiles to the
centralized plug in hardware monitors we used in our actual migration scheme.
5.1 Interconnect Transaction Sampling Experiments
We sample the interconnect transactions using hardware monitors and approximate the access frequencies for
the memory pages. However, for sampling to be effective, the sampling technique has to be representative of
all transactions that occurred during the execution of the application being analyzed.
One approach to sample interconnect transactions via hardware monitors is to continuously sample at the
maximum speed of the interconnect instrumentation software. We refer to this sampling scheme as
maximum-rate sampling. Maximum-rate sampling does not capture a compete set of transactions, but it tries
to sample as many transactions as possible. Alternatively, transactions can be sampled at fixed time intervals
or at every Nth transaction occurrence, where N is a constant that defines the interval of sampling[3]. We refer
to sampling at every Nth transaction occurrence as interval sampling.
We conducted a series of experiments to compare how representative the maximum-rate and interval
sampling techniques are of all transactions. To objectively compare the two sampling techniques we
designed a distance metric D that given a set of transactions and a set of samples from the set, measures the
percent difference between the values of a property for these sets. The property we used in our experiments is
the ratio of transactions requested by a specific processor to the total number of transactions. This metric
indicates how much a set of transactions deviate from another set of transactions in terms of memory
behavior. Thus, the closer the value of our distance metric is to 0, the more representative the set of sampled
transactions is of the set of all transactions.
For this study, we used the Sun Fire Link counters. Since the Sun Fire Link counters can accurately
count the number of transactions as well as the number of transactions from a given processor, we counted
both of these values and compared them with samples taken via Sun Fire Link bus analyzer to approximate
the sampling error of sampling techniques.
For each experiment, we configured one of the two counters in the Sun Fire Link hardware monitors to
count the number of transactions requested by a selected processor P, denoted CP. The other counter is

13
configured to count all transactions, CA. Using the Sun Fire Link bus analyzer we also sampled interconnect
transactions and recorded the number of transactions sampled, denoted SA. In the set of sampled transactions,
we count the number of transactions that are requested by processor P, denoted SP. We calculate the ratios
for the set of sampled transactions and the set of all transactions as RSample = SP/SA and RAll = CP/CA,
respectively. We define the distance as D = ABS(RSample - RAll) / RAll. That is, the distance metric gives an
insight as to how far the set of sampled transactions deviate from the set of all transactions.
We conducted a series of experiments for a set of processors while running an OpenMP version of the
CG benchmark from NAS Parallel benchmark suite[15]. We ran CG with 6 threads using the input set of size
B. We repeated the experiments with different sampling intervals in which samples taken at every 64, 256,
1024 and 4096 transactions.
Table 1 presents the results of the experiments conducted to compare how representative the sampled
transactions are of all transactions with respect to our distance measure. In Table 1, the second column gives
the distance values for maximum-rate sampling, the third to sixth columns give results for interval sampling
with different interval values. The rows that are labeled with processor identifiers give the distance between
the set of all transactions and the set of sampled transactions with respect to that processor.
Max-Rate Sampling
Interval Sampling 4K 1K 256 64
Processor 0 0.51 0.03 0.03 0.03 0.09 Processor 1 0.61 0.04 0.04 0.04 0.09 Processor 2 0.47 0.01 0.02 0.02 0.23 Processor 3 0.58 0.00 0.01 0.01 0.02 Processor 4 0.65 0.02 0.02 0.02 0.12 Processor 5 0.57 0.03 0.02 0.03 0.15 Average Dist. 0.56 0.02 0.02 0.02 0.11 % Sampled 17.56 0.19 0.78 3.07 9.75
Table 1. Distance values for maximum-rate sampling and interval sampling
Table 1 shows that even though the maximum-rate sampling can sample about 18% of all transactions,
the distance metric is significantly higher compared to interval sampling for all processors. Moreover, for
maximum-rate sampling, the average distance over all processors is 0.56, which shows that the set of
sampled transactions is quite different from the set of all transactions.

14
During maximum-rate sampling, the maximum number of transactions the instrumentation software can
record bounds the number of samples that can be taken for a processor. Thus, if a processor requests
transactions faster than the maximum rate the instrumentation software can read, many transactions for the
processor are not recorded. Similarly, if a processor requests transactions slower than the rate of
instrumentation software, almost all of its transactions will be recorded as samples. Thus, maximum-rate
sampling results in a skewed distribution of sampled transactions with respect to the level of memory system
activity on processors and the sample set does not accurately represent all transactions.
Table 1 also shows that for interval sampling, the distance values depend on the sampling rate. The
distance values are low and similar to each other except for the experiments where transactions are sampled
at every 64 transactions. In particular, if the samples are taken at every 256 transactions or more, the set of
sampled transactions is fairly representative of all transactions. Table 1 also suggests that if the rate of
interval sampling exceeds 5% of all transactions, the set of sampled transactions becomes less representative.
To further investigate how representative the samples for larger sampling interval values, we also
conducted experiments varying the sampling interval up to every-128M address transactions. In addition, for
each experiment, we also recorded the number of distinct pages that are included in the set of sampled
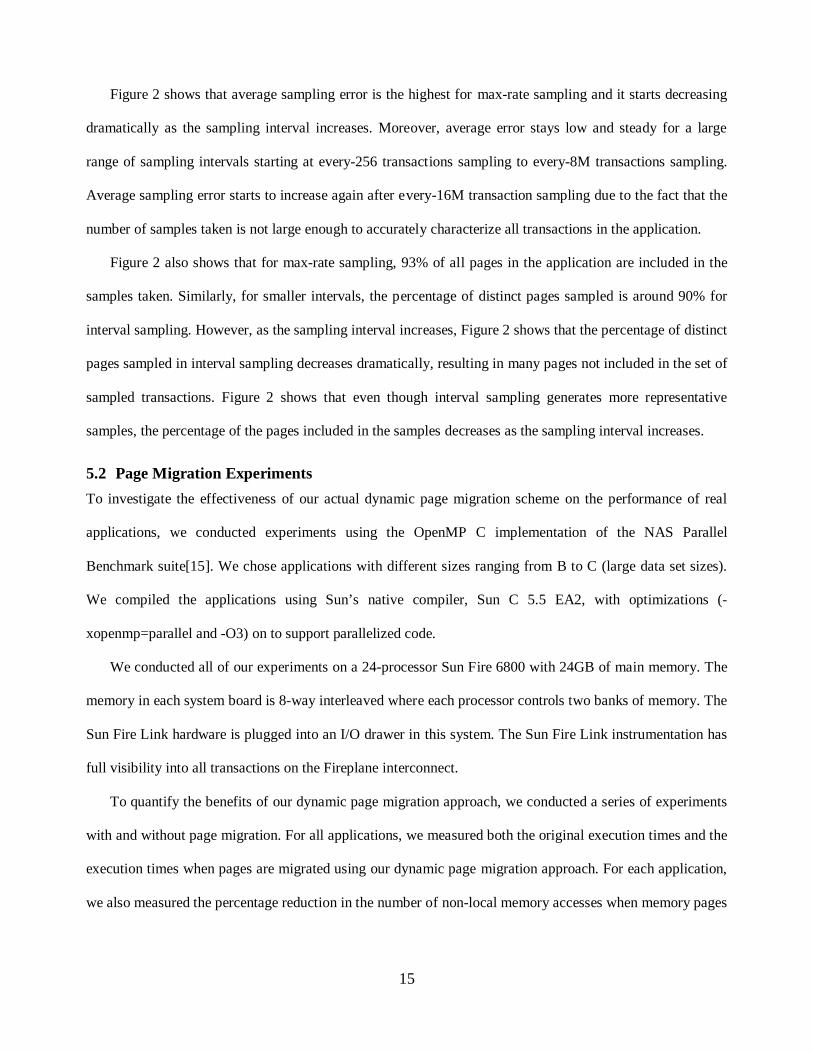
transactions. Figure 2 presents the average sampling error (left y-axis) and the percentage of distinct pages
sampled (right y-axis) in the application for the intervals we tested.
0.00
0.12
0.24
0.36
0.48
0.60
max-rate
6 8 10 12 14 16 18 20 22 23 24 25 26 27
Sampling Interval (log2 Scale)
Ave
rage
Sam
pling E
rror
(D) .
0%
20%
40%
60%
80%
100%%
Dis
tinct
Pag
es S
ample
d .Average Sampling Error
% Distinct Pages Sampled
Figure 2. Average distance and percentage of pages sampled in CG (B)
15
Figure 2 shows that average sampling error is the highest for max-rate sampling and it starts decreasing
dramatically as the sampling interval increases. Moreover, average error stays low and steady for a large
range of sampling intervals starting at every-256 transactions sampling to every-8M transactions sampling.
Average sampling error starts to increase again after every-16M transaction sampling due to the fact that the
number of samples taken is not large enough to accurately characterize all transactions in the application.
Figure 2 also shows that for max-rate sampling, 93% of all pages in the application are included in the
samples taken. Similarly, for smaller intervals, the percentage of distinct pages sampled is around 90% for
interval sampling. However, as the sampling interval increases, Figure 2 shows that the percentage of distinct
pages sampled in interval sampling decreases dramatically, resulting in many pages not included in the set of
sampled transactions. Figure 2 shows that even though interval sampling generates more representative
samples, the percentage of the pages included in the samples decreases as the sampling interval increases.
5.2 Page Migration Experiments
To investigate the effectiveness of our actual dynamic page migration scheme on the performance of real
applications, we conducted experiments using the OpenMP C implementation of the NAS Parallel
Benchmark suite[15]. We chose applications with different sizes ranging from B to C (large data set sizes).
We compiled the applications using Sun’s native compiler, Sun C 5.5 EA2, with optimizations (-
xopenmp=parallel and -O3) on to support parallelized code.
We conducted all of our experiments on a 24-processor Sun Fire 6800 with 24GB of main memory. The
memory in each system board is 8-way interleaved where each processor controls two banks of memory. The
Sun Fire Link hardware is plugged into an I/O drawer in this system. The Sun Fire Link instrumentation has
full visibility into all transactions on the Fireplane interconnect.
To quantify the benefits of our dynamic page migration approach, we conducted a series of experiments
with and without page migration. For all applications, we measured both the original execution times and the
execution times when pages are migrated using our dynamic page migration approach. For each application,
we also measured the percentage reduction in the number of non-local memory accesses when memory pages
16
are dynamically migrated compared to its original execution. We sampled interconnect transactions at every
1024 transactions for experiments with page migration.
We ran all applications with 12 threads on 6 system boards of the Sun Fire 6800 server where each board
executed 2 threads rather than running the applications with 24 threads where each processor is assigned a
thread. This is due to the fact that we noticed a form of intra-board locality in the Sun Fire servers [18] that
can mislead the benefits of page migration in isolation. We observed the choice of the processor from the
group of processors on the same system board can also have an impact on the execution times of
applications. We implemented a simple benchmark and measured the execution time of this benchmark when
different processors in the same system board are used to execute the application. In each execution, to
eliminate the effect of memory page placements, all memory pages in the benchmark are explicitly placed
locally. We observed that our simple benchmark took up to 11% more time to execute when it is bound to the
second processor of the system board compared to when it is bound to the first processor even though the
array pages are placed local to the processors [18]. The intra-board variations can be partially explained by
resource sharing contention among processors, bookkeeping operations running on processors by OS and
whether the array pages are placed on the memory banks controlled by the processor running the application
or on the memory banks controlled by another processor in the same system board. To eliminate any possible
contention due to resource sharing among processors, we scheduled only two threads on each system board
rather than four threads such that we would isolate the benefits of page migration alone for our experiments
and the gain due to the page migrations is not overcome by the intra-board variations.
As explained in Section 3, we insert instrumentation code into the application using the Dyninst library.
For each application, the instrumentation overhead is a one-time overhead since the Dyninst library has a
capability of saving instrumented executables for later reuse. Moreover, the instrumentation overhead for our
page migration approach is independent from the execution times of the applications we analyzed. We
measured the instrumentation overhead for all applications for our dynamic page migration approach and it is
typically around 2 seconds.
17
For the experiments with page migration, the migration interval is given as a parameter to our dynamic
page migration scheme. To investigate the impact of migration intervals and choose the migration interval
for the experiments, we conducted a sensitivity analysis in which we ran each application under different
migration intervals ranging from 1 second to 50 seconds. Our experiments showed that migration interval
used does not have a major impact on the performance of the applications except MG. For MG, migration
interval has a significant impact due to the fact that MG is a short running program and when migration is
triggered at a slower rate, MG does not benefit from page migrations. Thus, for our page migration
experiments, we chose to trigger page migration at every 5 seconds. We chose 5 seconds as the migration
interval such that we would trigger enough number of migrations in all applications to benefit from dynamic
page migration but still keep a slower rate of migrations in the other applications for a lower overhead.
5.2.1 Reduction in Non-Local Memory Accesses due to Page Migrations
To quantify the benefits of our dynamic page migration approach, we counted the total number of non-local
memory accesses for all applications with and without using dynamic page migration. We used the Sun Fire
Link hardware monitors to measure the total number of non-local memory accesses in the applications.
Table 2 presents the percentage reduction in the total number of non-local memory accesses when
dynamic page migration is used compared to when memory pages are not migrated. In the second column,
we give the total number of address transactions requested by each application during its execution. The third
column gives the percentage of non-local memory accesses without our page migration approach and the
fourth column shows the percentage of non-local memory accesses when memory pages in the application
are migrated using our dynamic page migration approach. The fifth column lists the percentage reduction in
the total number of non-local memory accesses when dynamic page migration is used.
Table 2 shows that for all applications, our dynamic page migration approach was able to reduce the
number of non-local memory accesses by 19.7-89.6% (The average reduction for applications is 58.3%).
Table 2 also shows that for MG, a significant number of non-local memory accesses were eliminated when
memory pages were migrated. This is due to the fact that the first-touch policy in the underlying operating

18
system placed pages poorly in a single memory unit and our migration policy was able to migrate pages to
several memory units according to their access pattern.
# of Address Transactions
(Millions)
Percentage of Non-local Accesses %
Reduction w/o Page Migration
Page Migration
BT (B) 38,507 40.9 25.3 38.0 CG (C) 15,721 80.9 15.3 81.0 EP (C) 42 85.4 28.2 67.0 FT (B) 2,329 64.2 29.6 54.0 LU (C) 48,682 41.2 33.1 19.7 MG (B) 841 80.5 8.3 89.6 SP (C) 116,116 55.0 22.7 58.8
Table 2: Reduction in non-local memory accesses due to page migration
Unlike MG, for LU our dynamic page migration approach was not able to reduce the number of non-
local memory accesses significantly. For LU, first-touch policy placed memory pages better. Moreover,
system boards uniformly access the majority of the memory pages that our dynamic approach was able to
migrate. That is, while migrating those pages to a system board reduces the number of non-local memory
accesses requested by the processors in that system board, the number of non-local memory accesses by the
processors in all other system boards increases. Our dynamic page migration approach uses a simple decision
mechanism that identifies the preferred location of a memory page as the system board that accesses it most.
It does not take the access frequencies by other system boards into consideration. The access frequencies by
other system boards may also be used to better decide whether a page should be migrated[19].
5.2.2 Impact of Page Migration on Cache Usage
The UltraSPARC III processors in the Sun Fire servers use physical addresses to index their external caches.
Since page migration changes the physical addresses of the memory pages in an application, it is also
necessary to ensure that our page migration approach does not have a significant impact on the cache
behavior of applications. To quantify the cache usage of the applications, we counted the number of conflict
and capacity misses (i.e. non-compulsory misses) during the execution of the applications with and without
dynamic page migration using the Sun Fire Link monitors. The Sun Fire Link monitors measure non-
compulsory misses by measuring the number of write-back (WB) transactions requested. A WB transaction
19
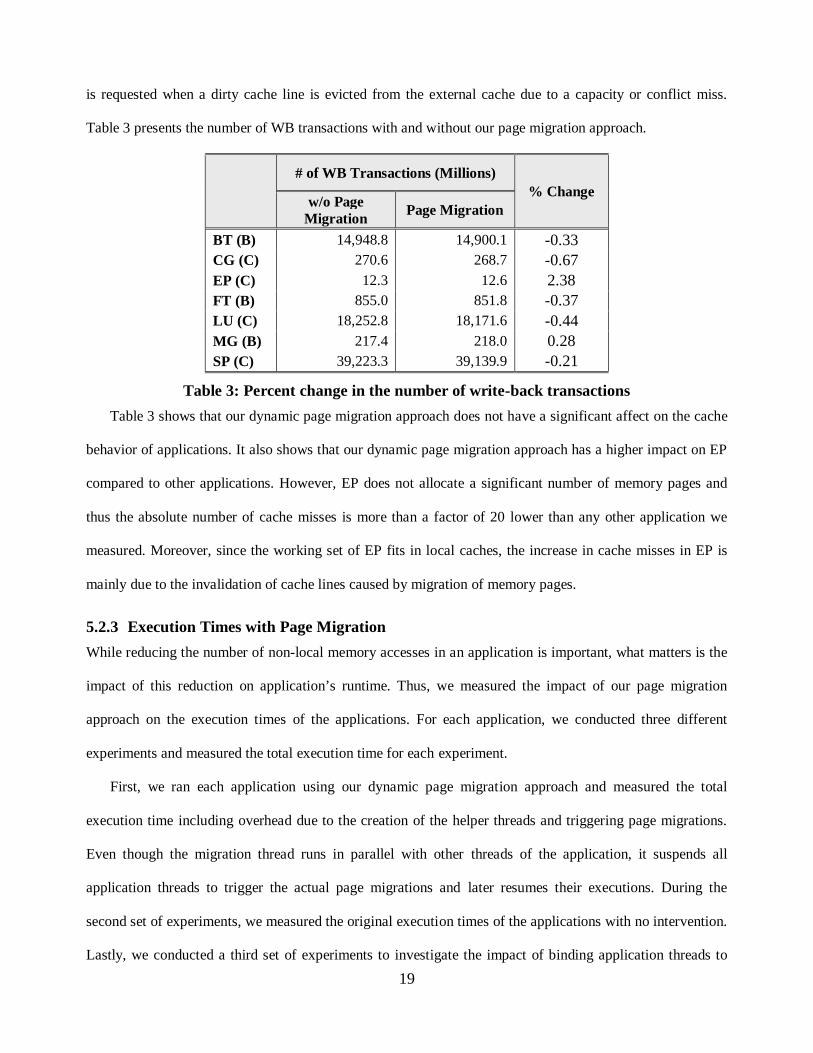
is requested when a dirty cache line is evicted from the external cache due to a capacity or conflict miss.
Table 3 presents the number of WB transactions with and without our page migration approach.
# of WB Transactions (Millions)
% Change w/o Page
Migration Page Migration
BT (B) 14,948.8 14,900.1 -0.33 CG (C) 270.6 268.7 -0.67 EP (C) 12.3 12.6 2.38 FT (B) 855.0 851.8 -0.37 LU (C) 18,252.8 18,171.6 -0.44 MG (B) 217.4 218.0 0.28 SP (C) 39,223.3 39,139.9 -0.21
Table 3: Percent change in the number of write-back transactions
Table 3 shows that our dynamic page migration approach does not have a significant affect on the cache
behavior of applications. It also shows that our dynamic page migration approach has a higher impact on EP
compared to other applications. However, EP does not allocate a significant number of memory pages and
thus the absolute number of cache misses is more than a factor of 20 lower than any other application we
measured. Moreover, since the working set of EP fits in local caches, the increase in cache misses in EP is
mainly due to the invalidation of cache lines caused by migration of memory pages.
5.2.3 Execution Times with Page Migration
While reducing the number of non-local memory accesses in an application is important, what matters is the
impact of this reduction on application’s runtime. Thus, we measured the impact of our page migration
approach on the execution times of the applications. For each application, we conducted three different
experiments and measured the total execution time for each experiment.
First, we ran each application using our dynamic page migration approach and measured the total
execution time including overhead due to the creation of the helper threads and triggering page migrations.
Even though the migration thread runs in parallel with other threads of the application, it suspends all
application threads to trigger the actual page migrations and later resumes their executions. During the
second set of experiments, we measured the original execution times of the applications with no intervention.
Lastly, we conducted a third set of experiments to investigate the impact of binding application threads to
20
fixed processors, and therefore the impact of dynamic page migration in isolation. During these experiments,
we ran each application with page migration disabled but bound the threads to the processors in the system.
For each application and experiment, we repeated the experiment seven times and recorded the minimum
of the execution times among all runs. We used the minimum execution time since we noticed higher
variation in the original execution times for some applications. We suspect the higher variation in the original
execution times of those applications is due to differences in the initial page placements and thread
scheduling by the operating system.
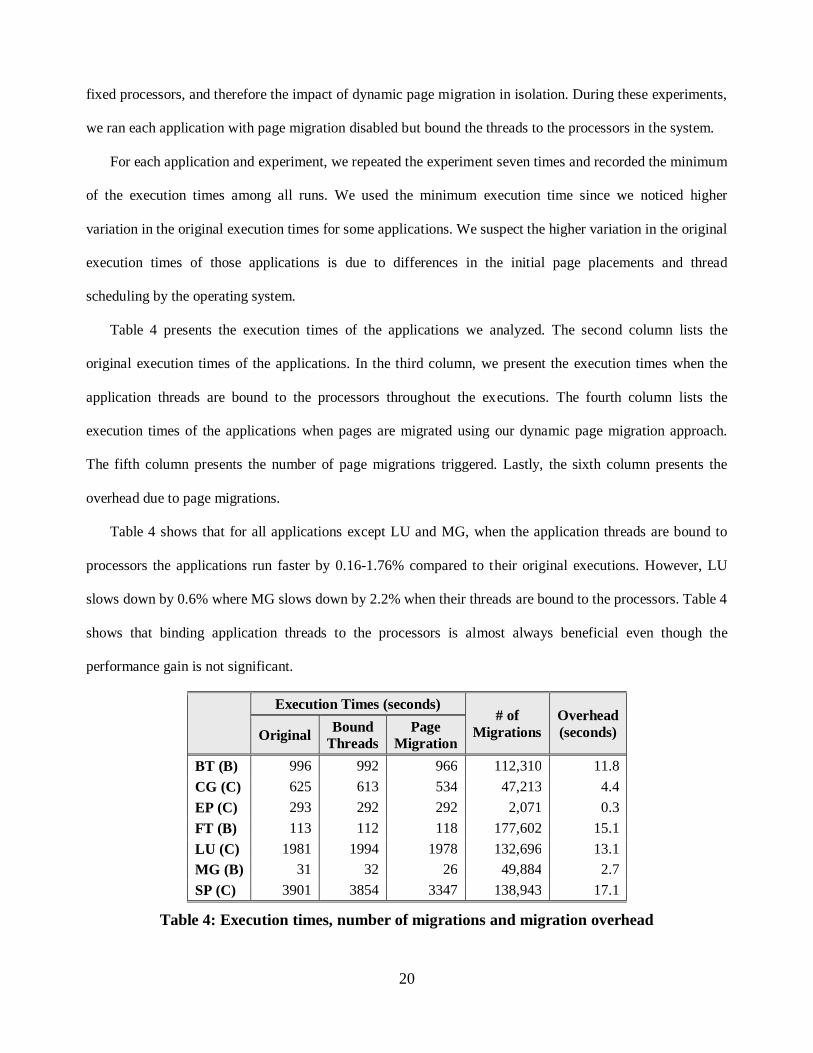
Table 4 presents the execution times of the applications we analyzed. The second column lists the
original execution times of the applications. In the third column, we present the execution times when the
application threads are bound to the processors throughout the executions. The fourth column lists the
execution times of the applications when pages are migrated using our dynamic page migration approach.
The fifth column presents the number of page migrations triggered. Lastly, the sixth column presents the
overhead due to page migrations.
Table 4 shows that for all applications except LU and MG, when the application threads are bound to
processors the applications run faster by 0.16-1.76% compared to their original executions. However, LU
slows down by 0.6% where MG slows down by 2.2% when their threads are bound to the processors. Table 4
shows that binding application threads to the processors is almost always beneficial even though the
performance gain is not significant.
Execution Times (seconds)
# of Migrations
Overhead (seconds) Original Bound
Threads Page
Migration
BT (B) 996 992 966 112,310 11.8
CG (C) 625 613 534 47,213 4.4
EP (C) 293 292 292 2,071 0.3
FT (B) 113 112 118 177,602 15.1
LU (C) 1981 1994 1978 132,696 13.1
MG (B) 31 32 26 49,884 2.7
SP (C) 3901 3854 3347 138,943 17.1
Table 4: Execution times, number of migrations and migration overhead
21
Table 4 also shows that the overhead due to page migration is mainly proportional to the number of page
migrations requested and it ranges up to 12.8% compared to the original execution times of the applications.
To guarantee that the migration thread touches the page next before other threads, all other threads have to be
suspended. If the operating system instead provided a system call that would allow applications to indicate
the target locations of the memory pages, it would permit migration of pages to their target locations during
the next available opportunity, and thus partially reduce the page migration overhead.
Figure 3 presents the performance improvement when our page migration approach is used compared to
both the original execution time and the execution time when the threads of the applications are bound to
processors. Under the label of each application on the x-axis, Figure 3 also presents the migration overhead
percentage with respect to the original execution time of the application. The migration overhead includes
time spent for the suspension of all threads and moving pages to their target memory location. Figure 3
shows that our dynamic page migration approach was able to improve the execution performance of the
applications except FT by up to 15.9% compared to their original executions. However, FT runs slower
under dynamic page migration.
Our dynamic page migration approach improved the performance of CG and SP by 14.5% and 14.2%,
respectively, compared to their original execution times. CG and SP request many memory accesses and our
dynamic page migration approach was able to eliminate many of the non-local memory accesses (see Table
2). In addition, dynamic page migration improved the execution performance of CG and SP by 12.8% and
13.2% respectively, compared to the executions where application threads are bound.
Like CG and SP, our dynamic page migration approach was also able to improve the performance of MG
by 15.9% compared to its original execution time. Even though MG does not request many memory
accesses, our page migration approach was still able to reduce the number of non-local memory accesses
significantly (see Table 2). Compared to the execution of MG when its threads are bound to the processors,
dynamically migrating memory pages in MG improved the execution performance by 18.1%.
Figure 3 also shows that our dynamic page migration approach improved the execution performance of
BT by 2.9% compared to its original execution and by 2.6% compared to execution where its threads are
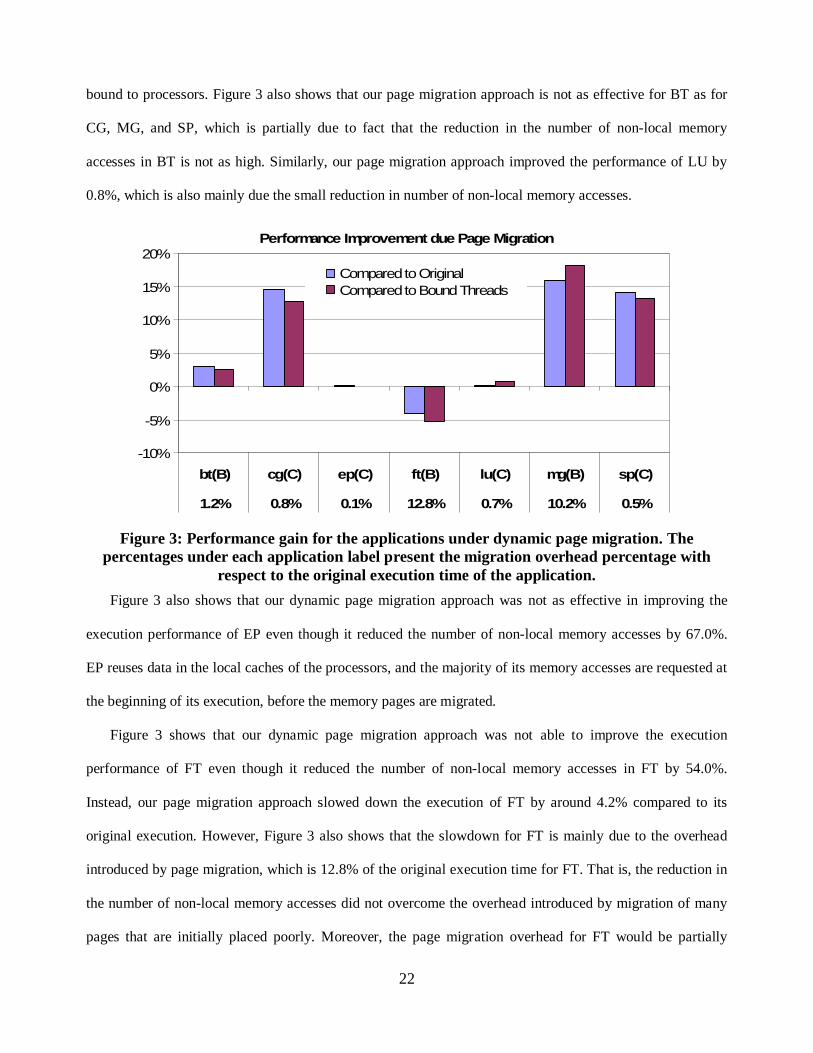
22
bound to processors. Figure 3 also shows that our page migration approach is not as effective for BT as for
CG, MG, and SP, which is partially due to fact that the reduction in the number of non-local memory
accesses in BT is not as high. Similarly, our page migration approach improved the performance of LU by
0.8%, which is also mainly due the small reduction in number of non-local memory accesses.
Performance Improvement due Page Migration
-10%
-5%
0%
5%
10%
15%
20%
bt(B) cg(C) ep(C) ft(B) lu(C) mg(B) sp(C)
1.2% 0.8% 0.1% 12.8% 0.7% 10.2% 0.5%
Compared to OriginalCompared to Bound Threads
Figure 3: Performance gain for the applications under dynamic page migration. The percentages under each application label present the migration overhead percentage with
respect to the original execution time of the application.
Figure 3 also shows that our dynamic page migration approach was not as effective in improving the
execution performance of EP even though it reduced the number of non-local memory accesses by 67.0%.
EP reuses data in the local caches of the processors, and the majority of its memory accesses are requested at
the beginning of its execution, before the memory pages are migrated.
Figure 3 shows that our dynamic page migration approach was not able to improve the execution
performance of FT even though it reduced the number of non-local memory accesses in FT by 54.0%.
Instead, our page migration approach slowed down the execution of FT by around 4.2% compared to its
original execution. However, Figure 3 also shows that the slowdown for FT is mainly due to the overhead
introduced by page migration, which is 12.8% of the original execution time for FT. That is, the reduction in
the number of non-local memory accesses did not overcome the overhead introduced by migration of many
pages that are initially placed poorly. Moreover, the page migration overhead for FT would be partially

23
reduced if the operating system did not require suspending application threads to trigger the actual migrations
by touching pages and instead provided a mechanism to directly request migration.
Overall, our dynamic page migration approach reduced the total number of non-local memory accesses
of applications by up to 90% and improved the execution times up to 16%. To investigate the effectiveness
of our approach, however, we also conducted experiments to measure how dynamic page migration
compares to ideal static page placement in terms of reduction in non-local memory accesses and performance
improvement. We modified our scheme to run in two phases where during the first phase, profiling
information is collected and during the second phase, application is run with ideal static placement where
pages are placed at application start using the profiling information and move-on-next touch feature of the
underlying OS. Even though our experiments showed that ideal static page placement also resulted in a
reduction of non-local memory accesses compared to the original execution, it was not as effective compared
to our dynamic page migration scheme. For profile-driven static page placement, reduction in non-local
memory accesses was 28.6% less in the average compared to using dynamic page migration except FT. For
FT, ideal static page placement was able to reduce non-local memory accesses up to 68% where the
reduction is only 54% when dynamic page migration is used (Note that this partially explains why dynamic
page migration overhead is higher for FT.). More importantly, the improvement in performance of
applications was only 0.02-7.9% when static page placement is used, indicating that the dynamic page
migration is more effective in both reducing the number non-local memory accesses and improving the
execution performance of applications compared to using profile-driven static page placement scheme.
To briefly investigate the impact of suspending all application threads on the overall migration overhead,
we also ran experiments where application threads were kept running hoping that the right processor touches
the pages that are to be migrated next. This would also give us some insight on the benefits of using an
operating system with a system call that does not require suspension of application threads for page
migration. However, our experiments showed that the reduction in the number of non-local memory was not
as high when application threads are not suspended and resulted in 17-26% more non-local memory accesses
compared to when application threads are suspended. This is mainly due to the fact that majority of the pages
24
are accessed by multiple processors throughout the execution (even though with different frequencies) and
some of the pages for migration are touched by other processors than the one running on its target location.
More importantly, the reduction in the overall migration overhead was insignificant compared to original the
execution times. Thus, Table 4 and these results indicate that the overhead of actual moving pages to their
target locations (between two physical memories) dominates the overall migration overhead. Hence, a new
system call that would not require suspension of threads to correctly migrate pages to their preferred
locations would only reduce the overall migration overhead by a small amount.
5.2.4 Graphical User Interface for Dynamic Page Migration
To visualize the page placement in the applications, we implemented a Graphical User Interface (GUI) that
presents the locations of the virtual memory pages in terms of the memory units (system boards) in the
underlying CC-NUMA server. Our dynamic page migration GUI also presents additional information such as
the number of page migrations triggered for each migration interval, the stack percentage bars indicating the
percentages of pages migrated to each memory unit for the latest migration interval.
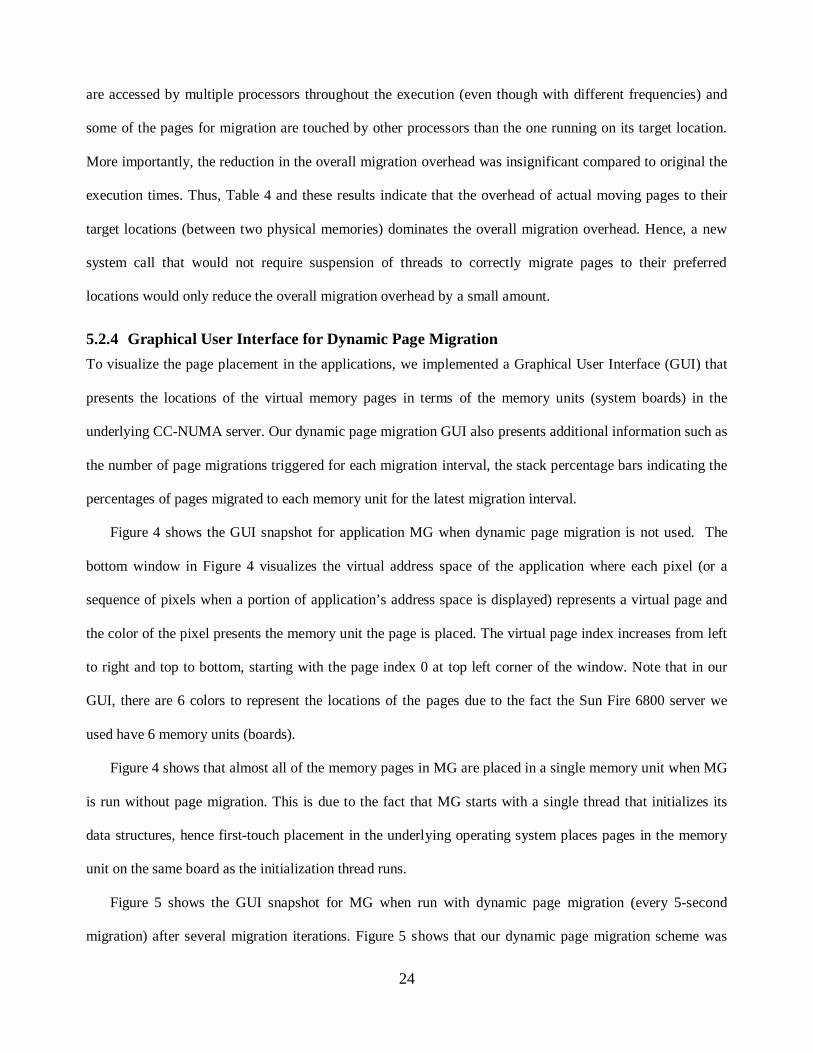
Figure 4 shows the GUI snapshot for application MG when dynamic page migration is not used. The
bottom window in Figure 4 visualizes the virtual address space of the application where each pixel (or a
sequence of pixels when a portion of application’s address space is displayed) represents a virtual page and
the color of the pixel presents the memory unit the page is placed. The virtual page index increases from left
to right and top to bottom, starting with the page index 0 at top left corner of the window. Note that in our
GUI, there are 6 colors to represent the locations of the pages due to the fact the Sun Fire 6800 server we
used have 6 memory units (boards).
Figure 4 shows that almost all of the memory pages in MG are placed in a single memory unit when MG
is run without page migration. This is due to the fact that MG starts with a single thread that initializes its
data structures, hence first-touch placement in the underlying operating system places pages in the memory
unit on the same board as the initialization thread runs.
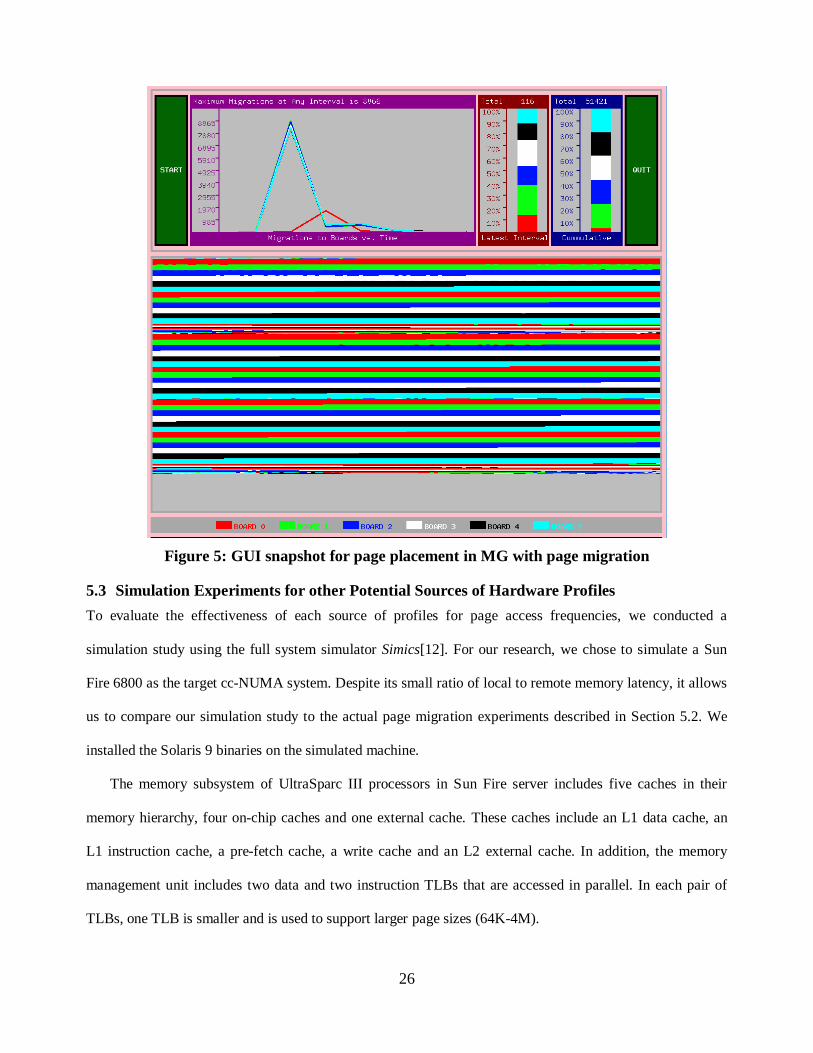
Figure 5 shows the GUI snapshot for MG when run with dynamic page migration (every 5-second
migration) after several migration iterations. Figure 5 shows that our dynamic page migration scheme was
25
able to accurately move pages local to the processors accessing them most. Even though Figure 5 shows
some imperfections in the placement of the pages due page migration, it clearly indicates the stride-access
pattern in MG. We believe imperfections are caused by the fact that information on some memory pages is
not included in the profiles gathered from performance monitors due to use of interval sampling.
Figure 4: GUI snapshot for page placement in MG without page migration
In addition to locations of the memory pages in an application, our dynamic page migration GUI also
presents detailed information on page migrations triggered when run with dynamic page migration. The
window at the top-left corner in Figure 5 displays the number of page migrations triggered to each memory
unit for each migration interval. The top middle window displays the stack percentage bar that presents the
percentages of migrations triggered to each memory unit for the latest migration interval in addition to the
total number of pages migrated for the interval. Similarly, the top right window displays the stack percentage
bar that presents the percentages of migrations triggered to each memory unit since the application start in
addition to the total number of pages migrated.
26
Figure 5: GUI snapshot for page placement in MG with page migration
5.3 Simulation Experiments for other Potential Sources of Hardware Profiles
To evaluate the effectiveness of each source of profiles for page access frequencies, we conducted a
simulation study using the full system simulator Simics[12]. For our research, we chose to simulate a Sun
Fire 6800 as the target cc-NUMA system. Despite its small ratio of local to remote memory latency, it allows
us to compare our simulation study to the actual page migration experiments described in Section 5.2. We
installed the Solaris 9 binaries on the simulated machine.
The memory subsystem of UltraSparc III processors in Sun Fire server includes five caches in their
memory hierarchy, four on-chip caches and one external cache. These caches include an L1 data cache, an
L1 instruction cache, a pre-fetch cache, a write cache and an L2 external cache. In addition, the memory
management unit includes two data and two instruction TLBs that are accessed in parallel. In each pair of
TLBs, one TLB is smaller and is used to support larger page sizes (64K-4M).
27
By default, Simics does not model any cache system or memory subsystem. It uses its own internal
memory representation where the memory is always up to date with the latest CPU and device transactions.
However, the functionality of Simics can be extended by user-written modules[20]. To simulate the memory
subsystem of UltraSparc III processors, we both modified the already available Simics modules and
implemented a new timing module. We also implemented a separate module to simulate the on-chip TLBs.
In addition to the memory subsystem, we also implemented a monitoring module for the data collection
methods we want to evaluate. These include on-chip hardware performance monitors to gather cache miss
and TLB miss information, centralized Sun Fire Link monitors to gather interconnect transactions, and our
hypothetical ATC hardware to gather page access frequencies.
To investigate the effectiveness of each source of profiles in dynamic page migration, we conducted
simulation experiments using the OpenMP C implementation of the NAS Parallel Benchmark suite. We
chose applications with different sizes from A to B such that each application would have a similar memory
footprint. Moreover, we modified the number of iterations in each application to keep the simulation time
manageable. We compiled the applications using Sun’s native compiler with optimizations (-
xopenmp=parallel) on an actual Sun Fire server and copied them to the simulated Sun Fire server.
For all experiments, as the target machine, we booted a 24-processor Sun Fire 6800 in the simulator with
12GB of main memory where each locality group contains 2GB main memory. The default processor type in
the simulated machine is an UltraSPARC III. Since we used interactive mode to set up the simulated
machine including installing the operating system, copying the compiled executables to the simulated disk,
we used the default processor settings.
To quantify the benefits of using each source of profiles on dynamic page migration, we ran a series of
experiments with and without page migration using the simulator. For each application, we ran the
application with dynamic page migration several times varying the source of profiles. Additionally, to
investigate the impact of accurate page access frequencies on the effectiveness of dynamic page migration,
we also ran each application where pages are migrated based on perfect profiles. Perfect profiles are gathered
by having the simulator use a full memory access history to find the references for all page references during
28
the next migration interval. This allows us to quantify the cost of the less than perfect profiles produced by
sampling of all page references up to the migration intervals. For the experiments with page migration, we
triggered page migration at every 5 seconds like the experiments in Section 5.2.
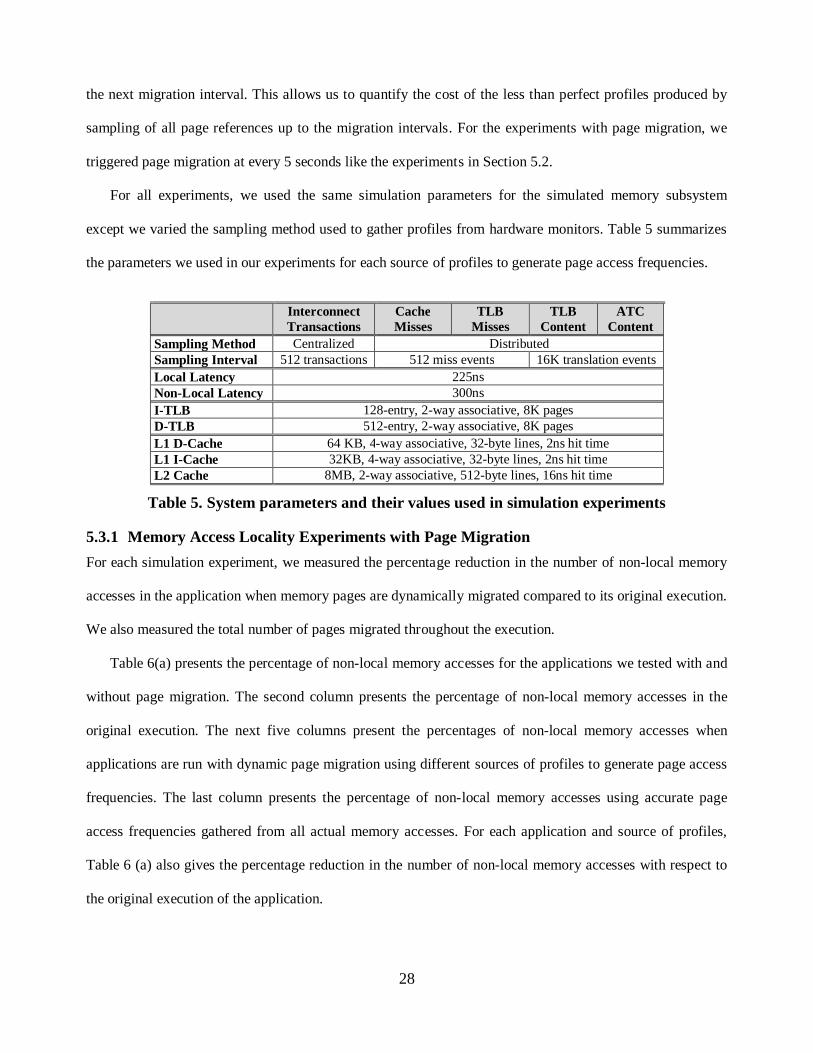
For all experiments, we used the same simulation parameters for the simulated memory subsystem
except we varied the sampling method used to gather profiles from hardware monitors. Table 5 summarizes
the parameters we used in our experiments for each source of profiles to generate page access frequencies.
Interconnect Transactions
Cache Misses
TLB Misses
TLB Content
ATC Content
Sampling Method Centralized Distributed Sampling Interval 512 transactions 512 miss events 16K translation events Local Latency 225ns Non-Local Latency 300ns I-TLB 128-entry, 2-way associative, 8K pages D-TLB 512-entry, 2-way associative, 8K pages L1 D-Cache 64 KB, 4-way associative, 32-byte lines, 2ns hit time L1 I-Cache 32KB, 4-way associative, 32-byte lines, 2ns hit time L2 Cache 8MB, 2-way associative, 512-byte lines, 16ns hit time
Table 5. System parameters and their values used in simulation experiments
5.3.1 Memory Access Locality Experiments with Page Migration
For each simulation experiment, we measured the percentage reduction in the number of non-local memory
accesses in the application when memory pages are dynamically migrated compared to its original execution.
We also measured the total number of pages migrated throughout the execution.
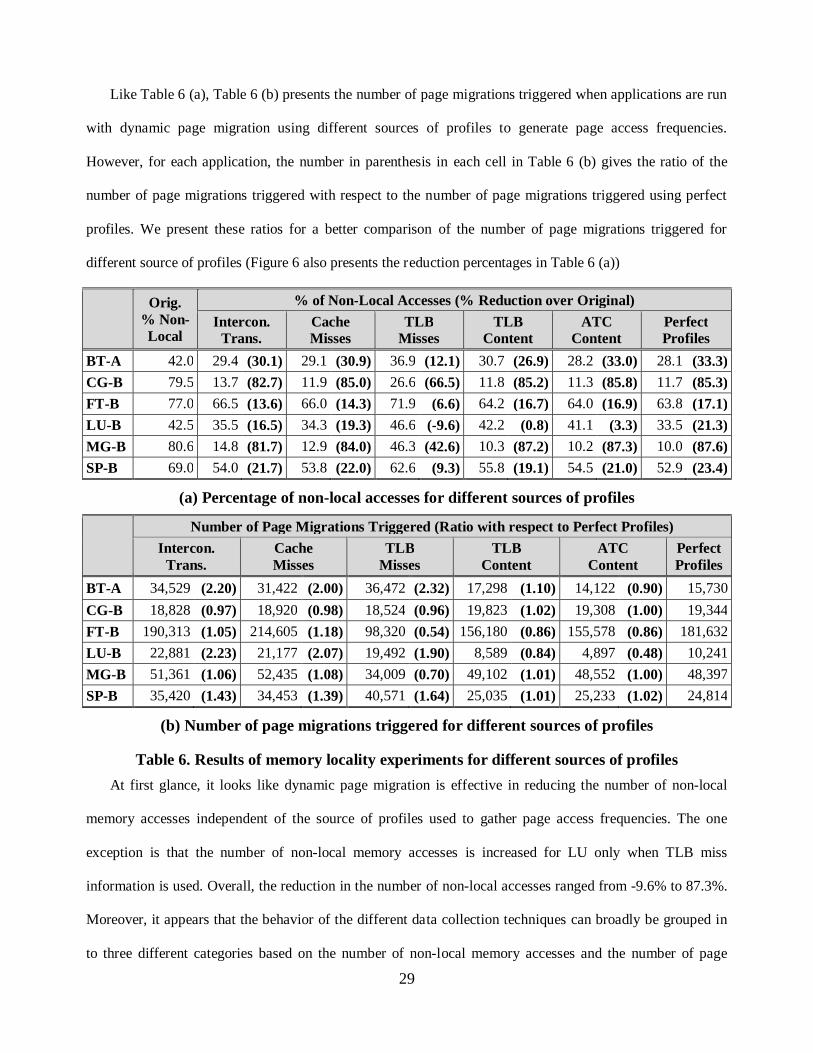
Table 6(a) presents the percentage of non-local memory accesses for the applications we tested with and
without page migration. The second column presents the percentage of non-local memory accesses in the
original execution. The next five columns present the percentages of non-local memory accesses when
applications are run with dynamic page migration using different sources of profiles to generate page access
frequencies. The last column presents the percentage of non-local memory accesses using accurate page
access frequencies gathered from all actual memory accesses. For each application and source of profiles,
Table 6 (a) also gives the percentage reduction in the number of non-local memory accesses with respect to
the original execution of the application.
29
Like Table 6 (a), Table 6 (b) presents the number of page migrations triggered when applications are run
with dynamic page migration using different sources of profiles to generate page access frequencies.
However, for each application, the number in parenthesis in each cell in Table 6 (b) gives the ratio of the
number of page migrations triggered with respect to the number of page migrations triggered using perfect
profiles. We present these ratios for a better comparison of the number of page migrations triggered for
different source of profiles (Figure 6 also presents the reduction percentages in Table 6 (a))
Orig. % Non- Local
% of Non-Local Accesses (% Reduction over Original)
Intercon. Trans.
Cache Misses
TLB Misses
TLB Content
ATC Content
Perfect Profiles
BT-A 42.0 29.4 (30.1) 29.1 (30.9) 36.9 (12.1) 30.7 (26.9) 28.2 (33.0) 28.1 (33.3)
CG-B 79.5 13.7 (82.7) 11.9 (85.0) 26.6 (66.5) 11.8 (85.2) 11.3 (85.8) 11.7 (85.3)
FT-B 77.0 66.5 (13.6) 66.0 (14.3) 71.9 (6.6) 64.2 (16.7) 64.0 (16.9) 63.8 (17.1)
LU-B 42.5 35.5 (16.5) 34.3 (19.3) 46.6 (-9.6) 42.2 (0.8) 41.1 (3.3) 33.5 (21.3)
MG-B 80.6 14.8 (81.7) 12.9 (84.0) 46.3 (42.6) 10.3 (87.2) 10.2 (87.3) 10.0 (87.6)
SP-B 69.0 54.0 (21.7) 53.8 (22.0) 62.6 (9.3) 55.8 (19.1) 54.5 (21.0) 52.9 (23.4)
(a) Percentage of non-local accesses for different sources of profiles
Number of Page Migrations Triggered (Ratio with respect to Perfect Profiles)
Intercon. Trans.
Cache Misses
TLB Misses
TLB Content
ATC Content
Perfect Profiles
BT-A 34,529 (2.20) 31,422 (2.00) 36,472 (2.32) 17,298 (1.10) 14,122 (0.90) 15,730
CG-B 18,828 (0.97) 18,920 (0.98) 18,524 (0.96) 19,823 (1.02) 19,308 (1.00) 19,344
FT-B 190,313 (1.05) 214,605 (1.18) 98,320 (0.54) 156,180 (0.86) 155,578 (0.86) 181,632
LU-B 22,881 (2.23) 21,177 (2.07) 19,492 (1.90) 8,589 (0.84) 4,897 (0.48) 10,241
MG-B 51,361 (1.06) 52,435 (1.08) 34,009 (0.70) 49,102 (1.01) 48,552 (1.00) 48,397
SP-B 35,420 (1.43) 34,453 (1.39) 40,571 (1.64) 25,035 (1.01) 25,233 (1.02) 24,814
(b) Number of page migrations triggered for different sources of profiles
Table 6. Results of memory locality experiments for different sources of profiles
At first glance, it looks like dynamic page migration is effective in reducing the number of non-local
memory accesses independent of the source of profiles used to gather page access frequencies. The one
exception is that the number of non-local memory accesses is increased for LU only when TLB miss
information is used. Overall, the reduction in the number of non-local accesses ranged from -9.6% to 87.3%.
Moreover, it appears that the behavior of the different data collection techniques can broadly be grouped in
to three different categories based on the number of non-local memory accesses and the number of page

30
migrations triggered. In particular, the results show that using interconnect transactions performs similar to
using cache misses, and using ATC content performs similar to using TLB content, and using TLB misses
performs poorly compared to the others.
-20%
0%
20%
40%
60%
80%
bt.A cg.B ft.B lu.B mg.B sp.B
Red
uctio
n in
Non
-Loc
al A
cces
ses
.
Intercon. Trans.
Cache Miss
TLB Miss
TLB Content
ATC Content
Perfect Profiles
Figure 6: Percentage reduction in non-local accesses wrt. original executions
Table 6 (a) shows that when perfect profiles are used, dynamic page migration reduces the number of
non-local memory accesses in the applications by 17.1-87.6%. Table 6 (a) also shows that page migration
using interconnect transactions reduces the number of non-local memory accesses by 13.6% to 82.7%.
For some applications the reduction in the number of non-local memory accesses is slightly lower
compared to the reduction percentages presented in Section 5.2.1. This is mainly due the fact that we
modified the number of iterations in the applications to obtain manageable simulation times. Most of the
page migrations are triggered early in the execution of these applications and during the rest of the execution
they benefit from these page migrations. Thus, by reducing the number of iterations in an application, the
application does not fully benefit from dynamic page migrations. However, Table 6 (a) also shows that the
reduction using interconnect transactions are comparable to using perfect profiles, which indicates that using
interconnect transactions is effective in approximating the actual page access frequencies.
Table 6 (a) and (b) show that using cache miss information in dynamic page migration performs slightly
better compared to using interconnect transactions in terms of the reduction in the number of non-local
memory accesses and the number of page migrations triggered. For the majority of applications, using cache
miss information reduces the number of non-local memory accesses slightly more and triggers slightly fewer
31
page migrations compared to using interconnect transactions. Moreover, the results show that using cache
miss information performs closer to using perfect profiles compared to using interconnect transaction in
terms of the reduction in the number of non-local memory accesses. Thus, by distributed sampling of cache
misses from on-chip CPU hardware monitors in a multiprocessor, dynamic page migration can accurately
generate page access frequencies in an applications and can be as effective as centralized sampling of
interconnect transactions.
Table 6 (a) and (b) also show that using TLB and ATC content in dynamic page migration perform
similar and they are comparable in terms of the reduction in the number of non-local memory accesses to
using cache miss and interconnect transaction information for all applications except LU. In LU, they are not
as effective in reducing the number of non-local memory accesses even though they trigger significantly
fewer page migrations. In terms of the number of page migrations triggered, using TLB and ATC content
tend to trigger fewer page migrations compared to using cache miss information and interconnect
transactions. However, for CG and MG where dynamic page migration is highly effective, they trigger
comparable number of page migrations.
Table 6 (a) and (b) show dynamic page migration using TLB miss information is not as effective as other
sources of profiles. Even though using TLB miss information triggers fewer migrations, it is not as effective
since the page access frequencies gathered from TLB miss information is not representative of page access
frequencies in the applications. Moreover, dynamic page migration using TLB miss information increases the
number of non-local memory accesses for LU by around 10%.
Table 6 (a) also shows that using ATC content for CG performs slightly better (0.5%) compared to using
perfect profiles, which indicates that perfect profiles may not always be a perfect predictor of the future.
Perfect profiles are generated using all memory accesses. If an application occasionally exhibits different
memory behavior during different intervals compared to the overall behavior, perfect profiles will include
profiles from these intervals which may reduce the accuracy of prediction. However, Table 6 (a) overall
shows that using sources of profiles other than TLB misses performs comparable to perfect profiles, which
32
also indicates that sampling of transactions does not have a significant impact on the accuracy of page access
frequencies generated.
Overall, Table 6 (a) and (b) show that the sources of profiles other than using TLB miss information
perform similar in terms of the reduction in the number of non-local memory accesses. More importantly,
they show that cache miss profiles gathered from on-chip hardware monitors can be effectively used to guide
page migrations in an application. This is particularly encouraging since such on-chip counters are included
in many recent processors, and instrumentation software to access these counters are publicly available. Thus
using cache miss information via distributed sampling in dynamic page migration is an easy and effective
approach. Even though using TLB and ATC content performs slightly better for some applications, their use
requires new hardware and system calls.
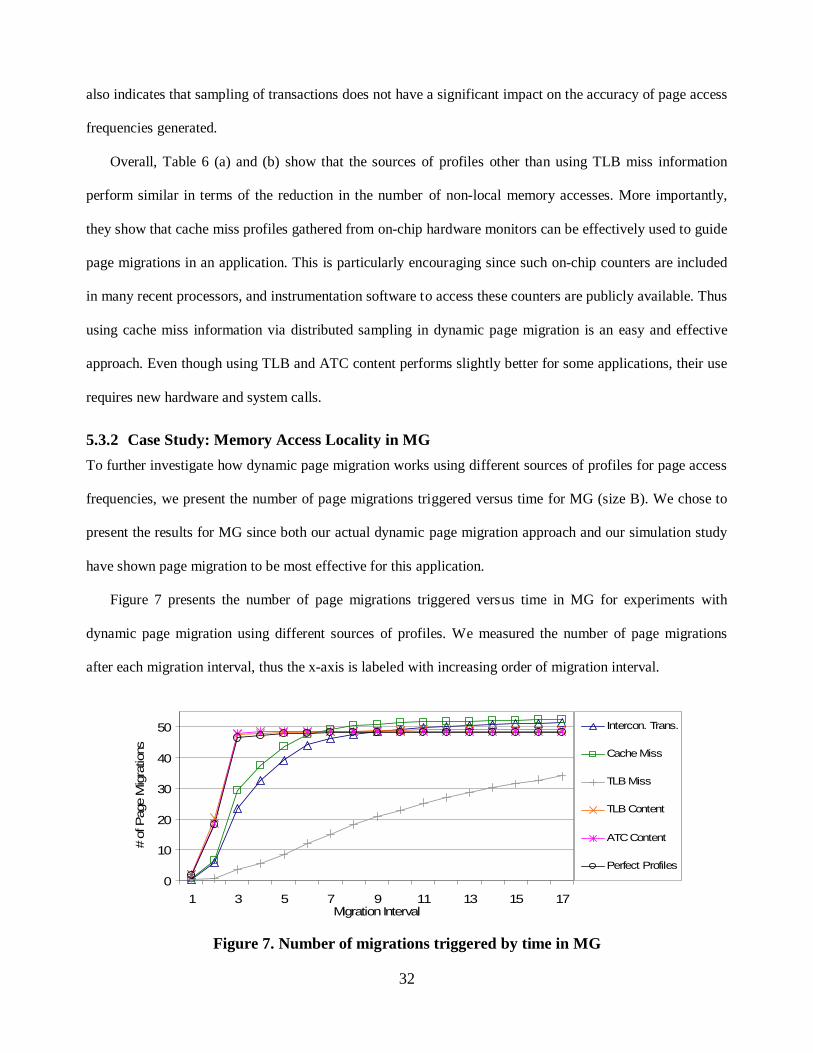
5.3.2 Case Study: Memory Access Locality in MG
To further investigate how dynamic page migration works using different sources of profiles for page access
frequencies, we present the number of page migrations triggered versus time for MG (size B). We chose to
present the results for MG since both our actual dynamic page migration approach and our simulation study
have shown page migration to be most effective for this application.
Figure 7 presents the number of page migrations triggered versus time in MG for experiments with
dynamic page migration using different sources of profiles. We measured the number of page migrations
after each migration interval, thus the x-axis is labeled with increasing order of migration interval.
0
10
20
30
40
50
1 3 5 7 9 11 13 15 17Migration Interval
# of
Pag
e M
igra
tions
(K
) Intercon. Trans.
Cache Miss
TLB Miss
TLB Content
ATC Content
Perfect Profiles
Figure 7. Number of migrations triggered by time in MG

33
Figure 7 shows that when MG is run with dynamic page migration using sources of profiles other than
TLB miss information, the majority of the page migrations are triggered early in the execution. Using TLB
and ATC information triggers more migrations during the first seven migration intervals compared to using
interconnect transactions and cache miss information but the latter sources of profiles trigger slightly more
migrations in total. Overall, the number of migrations triggered in MG is comparable for all sources of
profiles other than using the TLB misses. Dynamic page migration using TLB miss information triggers page
migrations throughout the execution and triggers significantly fewer overall page migrations.
More importantly, Figure 7 shows that using profiles other than TLB miss information triggers a similar
number of page migrations compared to using perfect profiles. However, using TLB and ATC content
matches the behavior of using perfect profiles slightly better compared to using other sources of profiles.
Overall, Figure 7 shows that using TLB content and ATC content is initially more effective in reducing
the number of non-local memory accesses in MG compared to using cache misses and interconnect
transactions. However, by the end of execution, all sources of profiles except TLB miss information provide
comparable information.
5.3.3 Execution Times
To investigate the impact of the reduction in the number of non-local memory accesses in the execution
times of the applications, we also measured the total number of cycles spent to execute each application
using different sources of profiles in the simulator. For each simulation experiment, we measured the total
number of cycles spent to satisfy memory accesses.
Our simulation experiments showed that even though the total number of cycles to satisfy memory
accesses is reduced by up to 16% for the applications, the impact of this reduction on the total number of
cycles to execute the applications was not significant (typically about a 0.5% improvement). This is due to
the fact that even though our simulator can simulate instructions executed by an application accurately, it
lacks the ability to properly simulate the contention for the memory units. Moreover, in such a simulation
environment it is also difficult to accurately simulate simultaneous out-of-order issue of multiple instructions
by multiple processors. Thus, since our workload exhibits very low cache miss behavior, the performance
34
improvement in actual memory accesses did not have a significant impact on the overall performance of the
applications when the simulator executes one instruction at a time. We believe this limitation contributes to
conclusions reached by previous researches that indicated limited benefit to page migration in cc-NUMA
systems[4,13,19].
To verify this claim, we conducted experiments where we ran MG (size B) under different page
placement scenarios on an actual machine to isolate the impact of memory contention and the impact of the
reduction in the number of non-local memory accesses on its execution performance.
Originally, almost all pages in MG are placed into a single memory unit which results in 80.5% of non-
local memory accesses in its execution. Since the majority of the pages are placed on a single memory unit,
the contention for this memory unit during execution is very high. To investigate the impact of memory
contention on the execution performance of MG, we ran MG under two different page placement scenarios
on an actual Sun Fire 6800 server. In the first scenario, its memory pages are placed uniformly on all
memory boards and in the second scenario, all of its pages are placed in a single memory unit. We measured
the percentage of non-local memory accesses in MG for each run using the Sun Fire Link counters and the
fraction of non-local memory accesses remained around 80%. Our experiments show that by placing the
pages in MG uniformly to all memory boards, the execution performance of MG improved by 10.2%
compared to its execution where all pages are placed in a single memory unit. This indicates that simply
reducing the memory contention to a single memory unit improved the execution performance of MG by
10.2%. Thus, the lack of ability to accurately capture memory contention in the simulated machine partially
explains why our simulation experiments did not yield improvement in the time to run the applications.
To investigate the impact of the reduction in the number of non-local memory accesses on the execution
performance, we also ran MG on an actual Sun Fire server and placed all pages local to processors accessing
them most at the beginning of the execution. We did this placement based on the data gathered during
execution of MG using our dynamic page migration scheme. Our experiments showed that the execution
performance of MG improved by 10.3% when the pages are placed in their preferred locations compared to
when all pages are placed uniformly over all memory units. This improved placement resulted in an 81%
35
reduction in the number of non-local memory accesses. The difficulty to accurately simulate the actual
memory subsystem and latency hiding in the instruction executions using in-order cache modules in the
simulator also partially explains why our simulation experiments did not yield an improvement in the total
number of cycles in the applications despite the reduction in the number of non-local memory accesses.
To better evaluate the impact of the reduction in the number of non-local memory accesses on the
execution times of the application, we adopted a different approach. In this approach, during simulation
experiments, we recorded the actual page migrations triggered in each simulation experiment to a log file and
used the log file to trigger page migrations using our dynamic page migration scheme on the actual machine.
We modified our page migration system not to gather profiles from hardware monitors but instead use log
files generated during simulation to guide page migrations. For each application and source of profiles, we
recoded the page migrations and ran the application on the Sun Fire 6800 server where page migrations are
triggered at fixed time intervals using the recoded migration entries.
Table 7 presents the percentage improvement in the execution times of the applications we tested with
migration on the actual Sun Fire 6800 server using the migration logs generated during simulations. Starting
with the second column, the next five columns present the percentage improvement in the applications when
they are run with dynamic page migration using different sources of profiles to generate page access
frequencies. The last column presents the percentage improvement using accurate page access frequencies
gathered from all actual memory accesses. For each application and source of profiles in Table 7, the positive
improvements in the execution performance of applications are shown in bold.
At first glance, Table 7 shows that dynamic page migration is effective at improving the execution
performance of applications CG, MG and SP independent of the source of profiles used to gather page
access. Dynamic page migration slightly slowed down the execution of FT for all sources of profiles and
slowed down the execution of BT and LU for profiles other than TLB and ATC information. The
improvement in runtime for all applications ranged from -1.8% to 18.3%. Moreover, similar to Table 6 (a)
and (b), Table 7 shows that the behavior of dynamic page migration can broadly be grouped in to three
different groups in terms of the improvement in the execution times of the applications. That is, Table 7
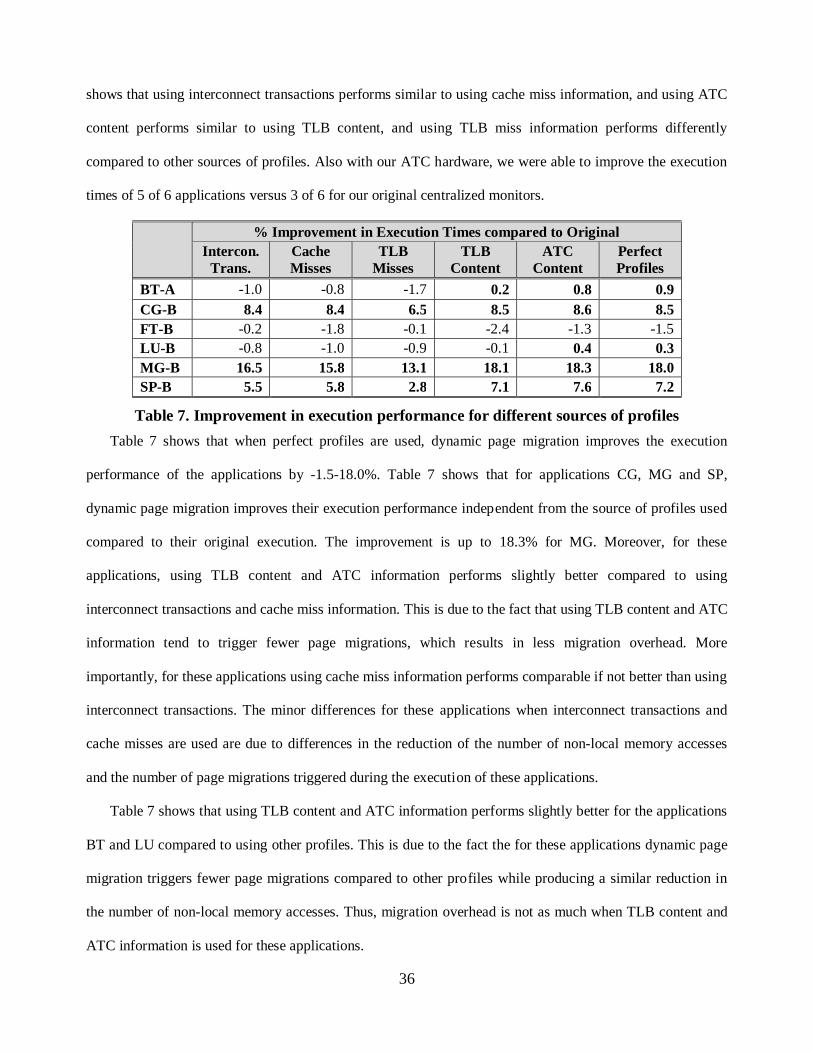
36
shows that using interconnect transactions performs similar to using cache miss information, and using ATC
content performs similar to using TLB content, and using TLB miss information performs differently
compared to other sources of profiles. Also with our ATC hardware, we were able to improve the execution
times of 5 of 6 applications versus 3 of 6 for our original centralized monitors.
% Improvement in Execution Times compared to Original
Intercon. Trans.
Cache Misses
TLB Misses
TLB Content
ATC Content
Perfect Profiles
BT-A -1.0 -0.8 -1.7 0.2 0.8 0.9 CG-B 8.4 8.4 6.5 8.5 8.6 8.5 FT-B -0.2 -1.8 -0.1 -2.4 -1.3 -1.5 LU-B -0.8 -1.0 -0.9 -0.1 0.4 0.3 MG-B 16.5 15.8 13.1 18.1 18.3 18.0 SP-B 5.5 5.8 2.8 7.1 7.6 7.2
Table 7. Improvement in execution performance for different sources of profiles
Table 7 shows that when perfect profiles are used, dynamic page migration improves the execution
performance of the applications by -1.5-18.0%. Table 7 shows that for applications CG, MG and SP,
dynamic page migration improves their execution performance independent from the source of profiles used
compared to their original execution. The improvement is up to 18.3% for MG. Moreover, for these
applications, using TLB content and ATC information performs slightly better compared to using
interconnect transactions and cache miss information. This is due to the fact that using TLB content and ATC
information tend to trigger fewer page migrations, which results in less migration overhead. More
importantly, for these applications using cache miss information performs comparable if not better than using
interconnect transactions. The minor differences for these applications when interconnect transactions and
cache misses are used are due to differences in the reduction of the number of non-local memory accesses
and the number of page migrations triggered during the execution of these applications.
Table 7 shows that using TLB content and ATC information performs slightly better for the applications
BT and LU compared to using other profiles. This is due to the fact the for these applications dynamic page
migration triggers fewer page migrations compared to other profiles while producing a similar reduction in
the number of non-local memory accesses. Thus, migration overhead is not as much when TLB content and
ATC information is used for these applications.
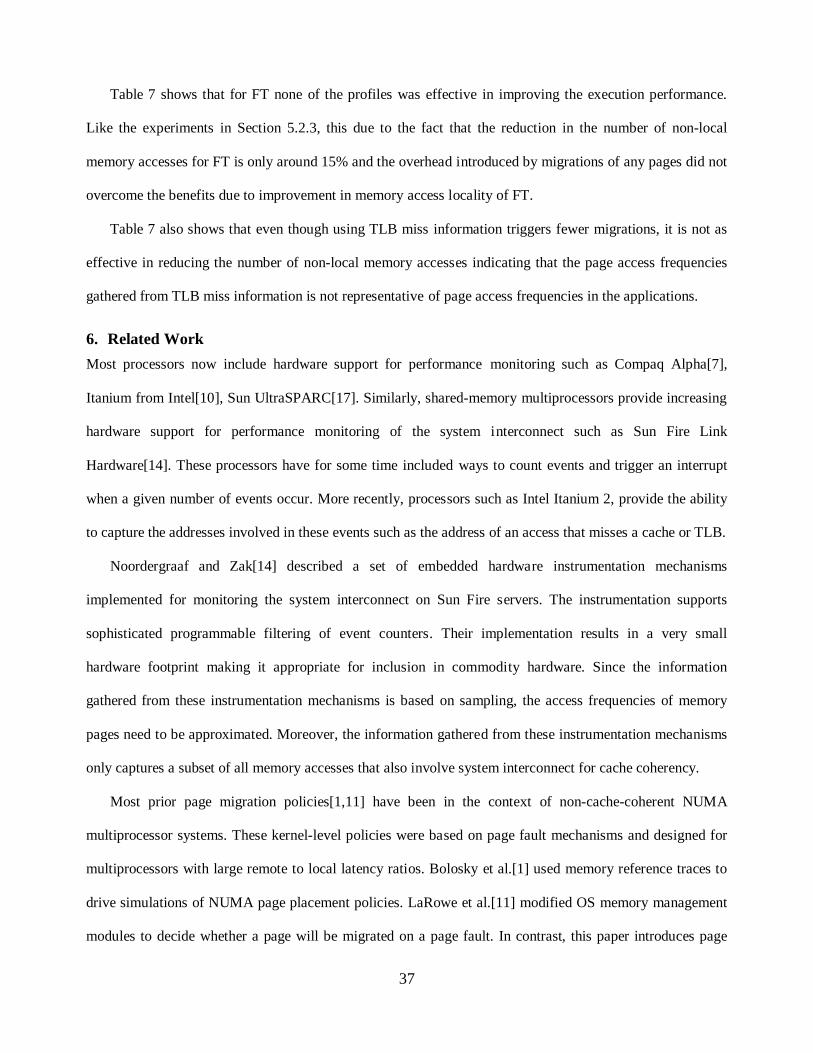
37
Table 7 shows that for FT none of the profiles was effective in improving the execution performance.
Like the experiments in Section 5.2.3, this due to the fact that the reduction in the number of non-local
memory accesses for FT is only around 15% and the overhead introduced by migrations of any pages did not
overcome the benefits due to improvement in memory access locality of FT.
Table 7 also shows that even though using TLB miss information triggers fewer migrations, it is not as
effective in reducing the number of non-local memory accesses indicating that the page access frequencies
gathered from TLB miss information is not representative of page access frequencies in the applications.
6. Related Work
Most processors now include hardware support for performance monitoring such as Compaq Alpha[7],
Itanium from Intel[10], Sun UltraSPARC[17]. Similarly, shared-memory multiprocessors provide increasing
hardware support for performance monitoring of the system interconnect such as Sun Fire Link
Hardware[14]. These processors have for some time included ways to count events and trigger an interrupt
when a given number of events occur. More recently, processors such as Intel Itanium 2, provide the ability
to capture the addresses involved in these events such as the address of an access that misses a cache or TLB.
Noordergraaf and Zak[14] described a set of embedded hardware instrumentation mechanisms
implemented for monitoring the system interconnect on Sun Fire servers. The instrumentation supports
sophisticated programmable filtering of event counters. Their implementation results in a very small
hardware footprint making it appropriate for inclusion in commodity hardware. Since the information
gathered from these instrumentation mechanisms is based on sampling, the access frequencies of memory
pages need to be approximated. Moreover, the information gathered from these instrumentation mechanisms
only captures a subset of all memory accesses that also involve system interconnect for cache coherency.
Most prior page migration policies[1,11] have been in the context of non-cache-coherent NUMA
multiprocessor systems. These kernel-level policies were based on page fault mechanisms and designed for
multiprocessors with large remote to local latency ratios. Bolosky et al.[1] used memory reference traces to
drive simulations of NUMA page placement policies. LaRowe et al.[11] modified OS memory management
modules to decide whether a page will be migrated on a page fault. In contrast, this paper introduces page
38
migration techniques for cache-coherent NUMA multiprocessor systems. Moreover, the page migration
techniques in this paper work at user level and migrate pages using the page access frequencies gathered
from embedded hardware monitors.
Chandra et al.[5] investigated the effects of different OS scheduling and page migration policies for
cache-coherent NUMA systems using Stanford DASH multiprocessors. Although they mainly focused on OS
scheduling policies, they also investigated page migration policies based on TLB misses. Chandra et al.
reported that page migration did not improve the response time for the workloads used due to overhead
incurred by the operating system.
Verghese et al.[19] studied the operating system support for page migration and replication in cache-
coherent NUMA multiprocessors. They introduced a decision tree to select the action to be taken on memory
pages upon cache misses. The actions taken for a page include replication, migration and freeze, depending
on the threshold values used in the decision tree. Using the thresholds that gave the best results they
evaluated their approach using a simulator for SGI Origin2000 multiprocessors and workload traces of cache
misses in the applications. The multiprocessor system they used also had large remote to local memory
latency ratios. They reported that dynamic page placements did not yield performance gains due to overhead
introduced by the operating system.
Kernel-level dynamic page placement schemes are also extensively studied in the Sun WildFire
systems[4,8,13]. The Sun WildFire system is a prototype cache-coherent NUMA architecture that is built
from small number of large SMP nodes and has large remote to local latency ratios. Hagersten and Koster[8]
evaluated the impact of coherent page replication and hierarchical affinity scheduling on TPC-C execution.
They used excess-remote-cache-miss counts to guide page placements. Noordergraaf and Pas[13] also
evaluated page migration and replication using a simple HPC application. To identify memory pages for
migration, they used excess misses that indicate conflict and capacity misses in a local node’s cache. They
reported that using a replication-only policy yielded much better performance than policies that included
migration.
39
More recently, Bull and Johnson[4] studied the interactions between data distribution, migration and
replication for the OpenMP applications. Although they particularly focused on a data distribution extension
for OpenMP, they also studied the impact of page migration and replication. Their study also showed that
page replication is more beneficial than migration. In contrast, this paper introduces a user-level page
migration approach for cc-NUMA servers with small remote to local memory latency (1.34:1). Moreover,
our page migration approach focuses on applications that are more likely to benefit from page migrations
rather than trying to increase the overall system performance.
Most similar to our work, Marathe et al.[23] introduced a user-space hardware-assisted page placement
scheme based on automated profiling. Similar to our work, the placement scheme allocates pages near
processors that most frequently access that page and leverages performance monitoring capabilities of
microprocessors to extract an approximate trace of memory accesses. This information is used to decide page
affinity. Unlike our work, their work requires a separate profiling phase where the profiling information is
gathered, which later is used to decide page affinity for the optimized run. In addition, Marathe et al. uses
long-latency loads or DTLB misses as profile source using the ability of the hardware monitors to time load
accesses. Similar to our results, Marathe et al. has shown that information from hardware monitors can be
efficiently used to improve page placement and application performance can be improved over 20% with
around 2.7% initial profiling cost.
Nikolopoulos et al.[24] introduced a user-level dynamic page migration scheme on multi-programmed
NUMA shared memory multiprocessors. The algorithms exploited the idea of correlating the scheduling
actions of the operating system with information obtained from dynamic monitoring of memory references.
For profiling information, Nikolopoulos et al. used the per-page hardware reference counters already
embedded in the underlying SGI system. These counters capture the frequency of accesses from each node to
a particular page. Unlike our work, their scheme intercepts preemptions and thread migrations at user-level
and uses these events as triggers for activating page migration algorithms that associate reference counting
information with the nodes to or from which threads migrate. Unlike our research, their algorithms assume
compiler support for identifying hot memory areas, that is, memory areas which are likely to concentrate
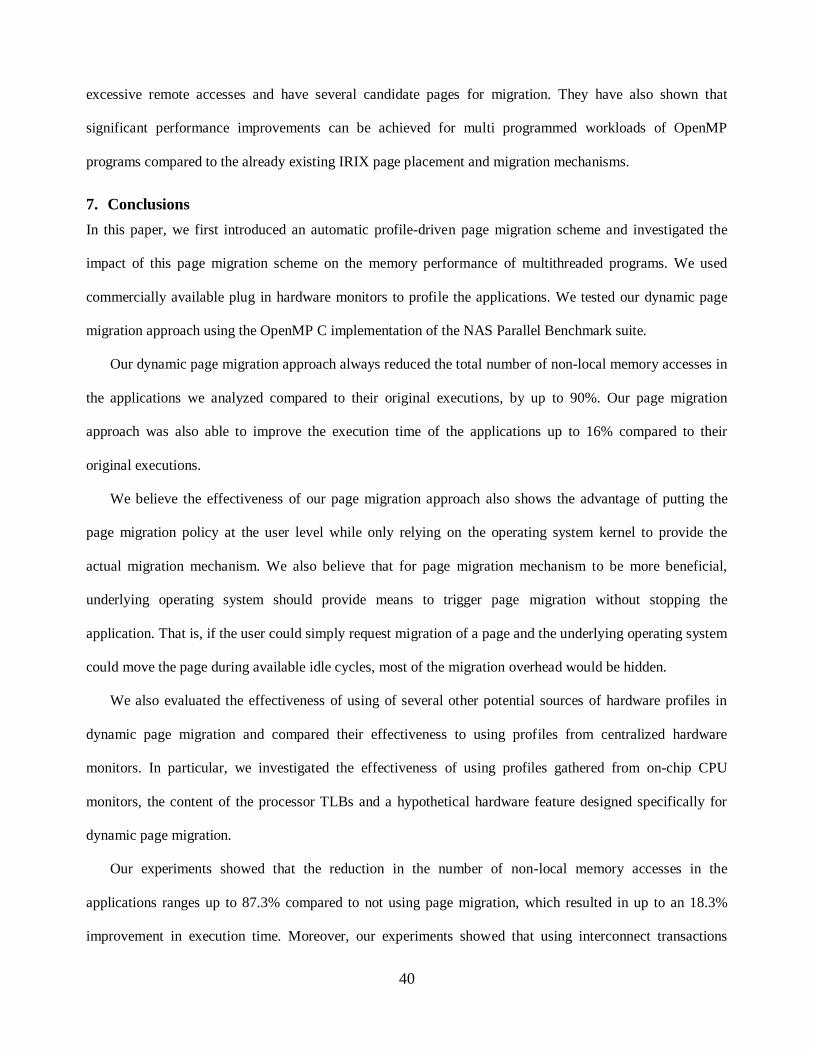
40
excessive remote accesses and have several candidate pages for migration. They have also shown that
significant performance improvements can be achieved for multi programmed workloads of OpenMP
programs compared to the already existing IRIX page placement and migration mechanisms.
7. Conclusions
In this paper, we first introduced an automatic profile-driven page migration scheme and investigated the
impact of this page migration scheme on the memory performance of multithreaded programs. We used
commercially available plug in hardware monitors to profile the applications. We tested our dynamic page
migration approach using the OpenMP C implementation of the NAS Parallel Benchmark suite.
Our dynamic page migration approach always reduced the total number of non-local memory accesses in
the applications we analyzed compared to their original executions, by up to 90%. Our page migration
approach was also able to improve the execution time of the applications up to 16% compared to their
original executions.
We believe the effectiveness of our page migration approach also shows the advantage of putting the
page migration policy at the user level while only relying on the operating system kernel to provide the
actual migration mechanism. We also believe that for page migration mechanism to be more beneficial,
underlying operating system should provide means to trigger page migration without stopping the
application. That is, if the user could simply request migration of a page and the underlying operating system
could move the page during available idle cycles, most of the migration overhead would be hidden.
We also evaluated the effectiveness of using of several other potential sources of hardware profiles in
dynamic page migration and compared their effectiveness to using profiles from centralized hardware
monitors. In particular, we investigated the effectiveness of using profiles gathered from on-chip CPU
monitors, the content of the processor TLBs and a hypothetical hardware feature designed specifically for
dynamic page migration.
Our experiments showed that the reduction in the number of non-local memory accesses in the
applications ranges up to 87.3% compared to not using page migration, which resulted in up to an 18.3%
improvement in execution time. Moreover, our experiments showed that using interconnect transactions
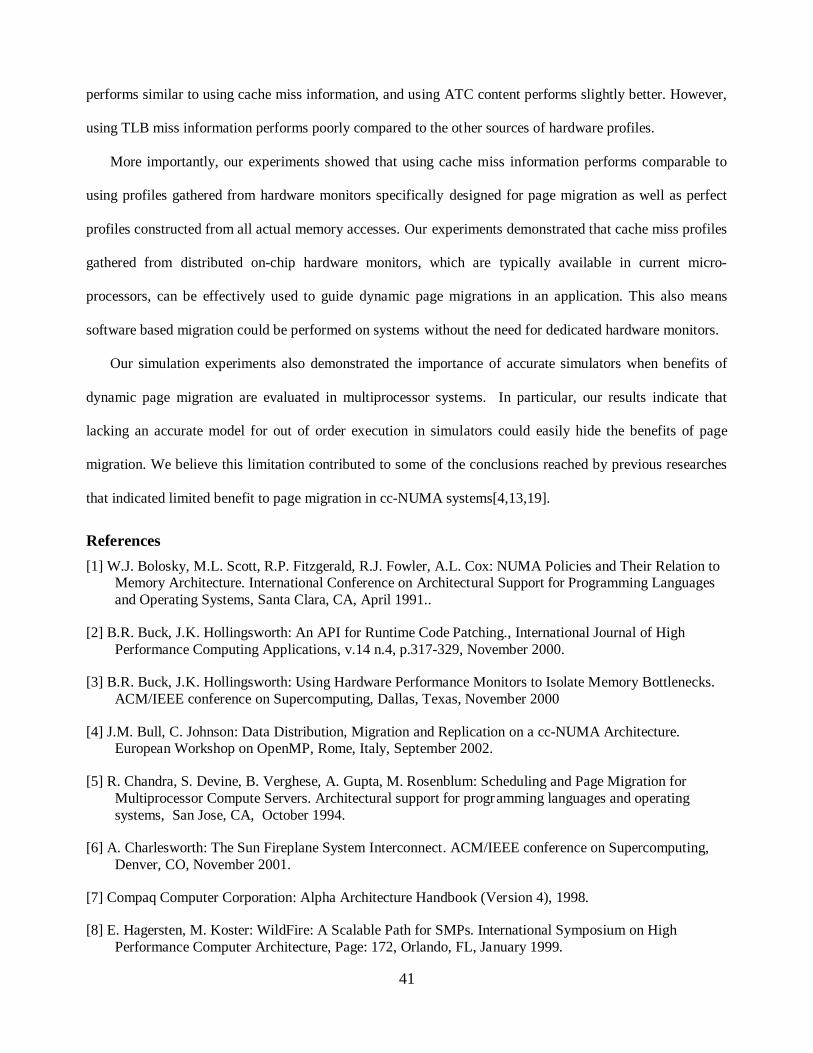
41
performs similar to using cache miss information, and using ATC content performs slightly better. However,
using TLB miss information performs poorly compared to the other sources of hardware profiles.
More importantly, our experiments showed that using cache miss information performs comparable to
using profiles gathered from hardware monitors specifically designed for page migration as well as perfect
profiles constructed from all actual memory accesses. Our experiments demonstrated that cache miss profiles
gathered from distributed on-chip hardware monitors, which are typically available in current micro-
processors, can be effectively used to guide dynamic page migrations in an application. This also means
software based migration could be performed on systems without the need for dedicated hardware monitors.
Our simulation experiments also demonstrated the importance of accurate simulators when benefits of
dynamic page migration are evaluated in multiprocessor systems. In particular, our results indicate that
lacking an accurate model for out of order execution in simulators could easily hide the benefits of page
migration. We believe this limitation contributed to some of the conclusions reached by previous researches
that indicated limited benefit to page migration in cc-NUMA systems[4,13,19].
References
[1] W.J. Bolosky, M.L. Scott, R.P. Fitzgerald, R.J. Fowler, A.L. Cox: NUMA Policies and Their Relation to Memory Architecture. International Conference on Architectural Support for Programming Languages and Operating Systems, Santa Clara, CA, April 1991..
[2] B.R. Buck, J.K. Hollingsworth: An API for Runtime Code Patching., International Journal of High Performance Computing Applications, v.14 n.4, p.317-329, November 2000.
[3] B.R. Buck, J.K. Hollingsworth: Using Hardware Performance Monitors to Isolate Memory Bottlenecks. ACM/IEEE conference on Supercomputing, Dallas, Texas, November 2000
[4] J.M. Bull, C. Johnson: Data Distribution, Migration and Replication on a cc-NUMA Architecture. European Workshop on OpenMP, Rome, Italy, September 2002.
[5] R. Chandra, S. Devine, B. Verghese, A. Gupta, M. Rosenblum: Scheduling and Page Migration for Multiprocessor Compute Servers. Architectural support for programming languages and operating systems, San Jose, CA, October 1994.
[6] A. Charlesworth: The Sun Fireplane System Interconnect. ACM/IEEE conference on Supercomputing, Denver, CO, November 2001.
[7] Compaq Computer Corporation: Alpha Architecture Handbook (Version 4), 1998.
[8] E. Hagersten, M. Koster: WildFire: A Scalable Path for SMPs. International Symposium on High Performance Computer Architecture, Page: 172, Orlando, FL, January 1999.

42
[9] J. Heinrich: MIPS R10000 Microprocessor User’s Manual (v2.0). MIPS Technologies, 1996.
[10] Intel Corporation: Intel Itanium 2 Processor Reference Manual for Software Development and Optimization, 2002.
[11] R.P. LaRowe, C.S. Ellis, L.S. Kaplan: The Robustness of NUMA Memory Management. ACM Symposium on Operating System Principles , Pacific Grove, CA, October, 1991
[12] P.S. Magnusson, M. Christensson, J. Eskilson, D. Forsgren, G. Hållberg, J. Högberg, F. Larsson, A. Moestedt, B. Werner: Simics: A Full System Simulation Platform. IEEE Computer, 35(2): 50-58, 2002.
[13] L. Noordergraaf, R. van der Pas: Performance Experiences on Sun's WildFire Prototype. ACM/IEEE conference on Supercomputing, Portland, OR, November 1999.
[14] L. Noordergraaf, R. Zak: SMP System Interconnect Instrumentation for Performance Analysis. ACM/IEEE conference on Supercomputing, Baltimore, MD, November 2002.
[15] Omni OpenMP Compiler Project: NAS Parallel Benchmarks OpenMP C Versions. http://phase.hpcc.jp/Omni/benchmarks/NPB, 2000.
[16] M.S. Squillante, E.D. Lazowska: Using Processor-cache Affinity in Shared Memory Multiprocessor scheduling. IEEE Transactions on Parallel and Distributed Systems, 4(2), 1993.
[17] Sun Microsystems: UltraSPARC III Cu User's Manual (version 1.0), 2002.
[18] M.M. Tikir, J.K. Hollingsworth: Using Hardware Counters to Automatically Improve Memory Performance. ACM/IEEE Conference on Supercomputing, Pittsburgh, PA, November 2004.
[19] B. Verghese, S. Devine, A. Gupta, M. Rosenblum: Operating System Support for Improving Data Locality on CC-NUMA Compute Servers. International Conference on Architectural Support for Programming Languages and Operating Systems, Cambridge, MA, October 1996.
[20] VirtuTech Corporation: Simics Programming Guide (v2.2.4). http://www.virtutech.com/products/, 2005.
[21] M. Woodacre, D. Robb, D. Roe, K. Feind: The SGI Altix 3000 Global Shared-memory Architecture. SGI White paper, Mountain View, CA, 2003.
[22] M. Zagha, B. Larson, S. Turner, M. Itzkowitz: Performance Analysis Using the MIPS R10000 Performance Counters. ACM/IEEE Conference on Supercomputing, Pittsburg, PA, November 1996.
[23] J. Marathe and F. Mueller. Hardware Profile Guided Automatic Page Placement for cc-NUMA Systems Symposium on Principles and Practice of Parallel Programming, New York, NY, March 2006. [24] D. Nikolopoulos, T. Papatheodorou, C. Polychronopoulos, J. Labarta, and E. Ayguade. User-level Dynamic Page Migration for Multi-programmed Shared-memory Multiprocessors. International Conference on Parallel Programming, pages 95-103, Toronto, Canada, August 2000.