Embed Size (px)
Citation preview

HandelsbankenHandelsbanken
AT1 Investor PresentationFebruary 2015eb ua y 0 5

Handelsbanken: Key highlightsHandelsbanken: Key highlights
• Scalable and repeatable business model, unchanged and proven by 43 years of stable track record
Proven business model
• 15% annual average growth in equity plus dividends since the beginning of the financial crisis
• No central bank support, no government support and no rights issues made
• No bonus and no volume targets
• Strong local retail presence with more than 800 branches in Sweden, UK, Denmark, Finland, Norway and the Netherlands
• Branches have the full responsibility for all customers within a close geographical areaStrong, cost-efficient retail
bank
• Branches have the full responsibility for all customers within a close geographical area
• Local responsibility ensures high customer satisfaction and close monitoring of credit quality
• Local presence secures superior information
• Flat organization ensures high cost efficiency
• Focus only on credit risk with the aim to minimise all other risksConservative risk
profile
y
• Conservative risk profile and underwriting standards result in sustained low loan losses
• Annual average loan losses of 5 bps since 1997
2

Handelsbanken: Key highlights continuedHandelsbanken: Key highlights - continued
• Financial goal: To have a higher RoE than average of the bank’s peers
High and stable profitability
• For the past 43 consecutive years, the bank has reached this financial goal through:• More satisfied customers than peers• Lower operating costs, funding costs and loan losses than peers
• RoE above 12% in every year since the beginning of the financial crisis
• Q4 2014: CRD IV Common Equity Tier 1 ratio of 20.4%, CRD IV Total capital ratio of 25.6%
• RoE above 12% in every year since the beginning of the financial crisis
Strong capitalisation
• Proven track record of prudent capital management
• High capital generation of 3.2%1
• Significant capital buffers • 12.4% or SEK60bn distance to 8% trigger, plus earningsgg p g• 9.9% or SEK47.5bn distance to 10.5% MDA , plus earnings
S l bl b i d l ith ll t i th t i h k t t id S d• Scalable business model with excellent organic growth prospects in home markets outside Sweden
• No deviation in underwriting standards or ethos to achieve growth
• Increased geographic diversification through organic growth with 35% of pre-provision profits coming from markets outside of Sweden
Low risk organic growth
3
1Based on 2014 net income divided by 2014 REA

Handelsbanken’s proposed transactionHandelsbanken s proposed transaction
CRD IV-eligible Additional Tier 1 Capital issued by Svenska Handelsbanken AB (publ) Transaction
Perpetual maturity, callable after 6 years and every 5 years thereafter at the outstanding principal amount
8% fully loaded CRD IV CET1 trigger at Handelsbanken Group and 5.125% at the Bank
Maturity
Trigger y gg p
Temporary write-down loss absorption mechanism
gg
Loss absorption
Discretionary, non-cumulative coupons
Expected Baa3/BBB/BBB (Moody’s/S&P/Fitch)
Coupon
Rating
Benchmark size
Reg-S USD
Size
Market
4

Transaction rationaleTransaction rationale
• Handelsbanken aims to combine the lowest risk with top of the class capitalisationCapital Structure
p p
• Proposed transaction provides additional buffer on top of already very high CET1 position
• Handelsbanken has a strong excess CET1 position with regards to capital requirements, which results in no need at present for issuance of AT1
• Under Handelsbanken’s current understanding of capital regulations, a maximum of USD 1.2bn of AT1 One of its kindwould be beneficial from a capital structure perspective, however Handelsbanken’s current capital needs are met with CET1
5

Table of contentsTable of contents
- Handelsbanken business position- Handelsbanken business position
- Handelsbanken capital position
Proposed transaction- Proposed transaction
Appendix A: Handelsbanken additional information
A di B H d l b k dditi l it l i f tiAppendix B: Handelsbanken additional capital information

Handelsbanken Business PositionHandelsbanken Business Position

15% average annual growth in equity (including dividends)15% average annual growth in equity (including dividends)High and stable profitability with high growth and low volatility, without any need of support from
central banks, government or shareholders
300
325Adjusted equity per share Accumulated dividends since 2008SEK / share
g
200
225
250
275
125
150
175
200
25
50
75
100
0
25
Q30
7
Q40
7
Q10
8
Q20
8
Q30
8
Q40
8
Q10
9
Q20
9
Q30
9
Q40
9
Q11
0
Q21
0
Q31
0
Q41
0
Q11
1
Q21
1
Q31
1
Q41
1
Q11
2
Q21
2
Q31
2
Q41
2
Q11
3
Q21
3
Q31
3
Q41
3
Q11
4
Q21
4
Q31
4
Q41
4
8
Dividends reinvested in ROE per quarterCAGR = Compounded Annual Growth Rate

Total return during the financial crisisTotal return during the financial crisis
Total return since 30 June 2007
167
150%
200%
50%
100%
(50)%
0%
(63)(100)%
bank
enD
NB
Nor
dea
wed
bank
SE
BH
SB
Can
kint
ernt
ande
r an
Cha
rD
ansk
eB
NP
Nat
ixis
BB
VA
Inte
saob
anca
KB
CA
gric
ole
arcl
ays
ING
Sab
adel
ldi
Ban
ItE
rste
X B
anks
ll'Em
ilia
t Sui
sse
Son
drio
Soc
Gen
euts
che
Lloy
dsU
BS
i Mila
noU
nicr
edit
Pop
Esp
aiffe
isen
Pop
Soc
RB
Sco
Com
.er
zban
kha
Ban
kfI
rela
nd P
asch
iP
iraeu
s G
reec
eed
Iris
h ur
oban
k
Han
dels Sw Ba
San Sta D
Med
i
Cre
dit A B
a
Ban
co d
e S
Uni
one
d
Eur
o S
TOX
XB
anca
Pop
de
Cre
dit
Ban
ca P
op d
i S S De
Ban
ca P
op d
i UB
anco
P Ra
Ban
co P
Ban
cC
omm
eA
lph
Ban
k of
M
onte
dei P
Ban
k of
A
llie
Eu
9
Source: Factset 31 December 2014
B B

Earnings stability in an unstable environmentEarnings stability in an unstable environment
RoE has not been below 12% any year since the start of the financial crisis
16%
18%
12%
14%
6%
8%
10%
2%
4%
6%
1
0%
2%
2008 2009 2010 2011 2012 2013 2014
10

Consistent operational and risk management excellenceConsistent operational and risk management excellence
Cost-to-income and loan loss average (2008-2013)
Commerzbank
Deutsche Bank
RBS80%
85%
Barclays
Commerzbank
LloydsKBC
Société Générale70%
75%
8-20
13
Barclays
Crédit Agricole
Erste Bank RZBSEB60%
65%
Rat
io A
ve 2
00
BBVA Santander
StanChart HSBCDanske Bank
DNB
Nordea Swedbank50%
55%C/I
R
DNB
Handelsbanken
40%
45%
0 0% 0 2% 0 4% 0 6% 0 8% 1 0% 1 2% 1 4% 1 6% 1 8%
11
0,0% 0,2% 0,4% 0,6% 0,8% 1,0% 1,2% 1,4% 1,6% 1,8%Loan Loss Ratio Ave 2008-2013
Source: SNL

Consistently low and stable loan losses
1 10
Consistently low and stable loan losses
Historical loan losses 1997 – 2014
0,90
1,10Handelsbanken
Other Nordic banks
1/4 of the average loan losses for Nordic peers in 1997 – 2014Annual average other Nordic banksAnnual average SHB
20bp5bp
1
0,70
0,50
0,10
0,30
(0,10)1997 1998 1999 2000 2001 2002 2003 2004 2005 2006 2007 2008 2009 2010 2011 2012 2013 2014
12
1 Arithmetic mean of loan loss ratio for other listed Nordic banks: SEB, Nordea (Nordbanken), Swedbank, Danske Bank and DNB.

Increasingly diversified income from organic growth in markets outside Sweden
Proportion of operating profit before loan losses from home markets outside Sweden1
36%
38%
40%
32%
34%
26%
28%
30%
22%
24%
26%
22% to 35% in 3 years
20%Q4
2011Q1
2012Q2
2012Q3
2012Q4
2012Q1
2013Q2
2013Q3
2013Q4
2013Q1
2014Q2
2014Q3
2014Q4
2014
13
1 Twelve-month rolling

Handelsbanken Capital PositionHandelsbanken Capital Position

15% average annual growth in equity (including dividends)15% average annual growth in equity (including dividends)High and stable profitability with high growth and low volatility, without any need of support from
central banks, government or shareholders
300
325Adjusted equity per share Accumulated dividends since 2008SEK / share
g
200
225
250
275
125
150
175
200
25
50
75
100
0
25
Q30
7
Q40
7
Q10
8
Q20
8
Q30
8
Q40
8
Q10
9
Q20
9
Q30
9
Q40
9
Q11
0
Q21
0
Q31
0
Q41
0
Q11
1
Q21
1
Q31
1
Q41
1
Q11
2
Q21
2
Q31
2
Q41
2
Q11
3
Q21
3
Q31
3
Q41
3
Q11
4
Q21
4
Q31
4
Q41
4
15
Dividends reinvested in ROE per quarterCAGR = Compounded Annual Growth Rate

Continuous improvement of core capitalContinuous improvement of core capital
Common Equity Ratio, Basel II Common Equity Ratio, CRD IV
% % 7.3%
17.9
%
18.0
%
18.2
%
19.3
%
19.2
%
20%
25%
7.5%
17.8
%
18.8
%
18.9
%
19.5
%
20.1
%
20.7
%
20.4
%
20%
25%
1)
% 0.3% 11
.1%
11.9
%
12.1
%
12.3
%
13.1
%
13.8
%
14.5
%
14.8
%
14.7
%
15.6
%
15.8
%
16.1
% 17 1 1
15%
17 1
15%
1)
9.4% 10
5%
10%
5%
10%
0%Q1
2009Q2
2009Q3
2009Q4
2009Q1
2010Q2
2010Q3
2010Q4
2010Q1
2011Q2
2011Q3
2011Q4
2011Q1
2012Q2
2012Q3
2012Q4
2012Q1
2013Q2
2013Q3
2013Q4
20130%
Q113 Q213 Q313 Q413 Q114 Q214 Q314 Q414
Common equity tier 1 ratio, Basel II CET1 ratio, CRD IV
Handelsbanken’s Core Tier 1 ratio has consistently improved quarter by quarter since 2009 and more than doubled in terms of percentage points
16
1) After deduction of the proposed dividend of SEK 17.50 per share, corresponding to 73% payout ratio
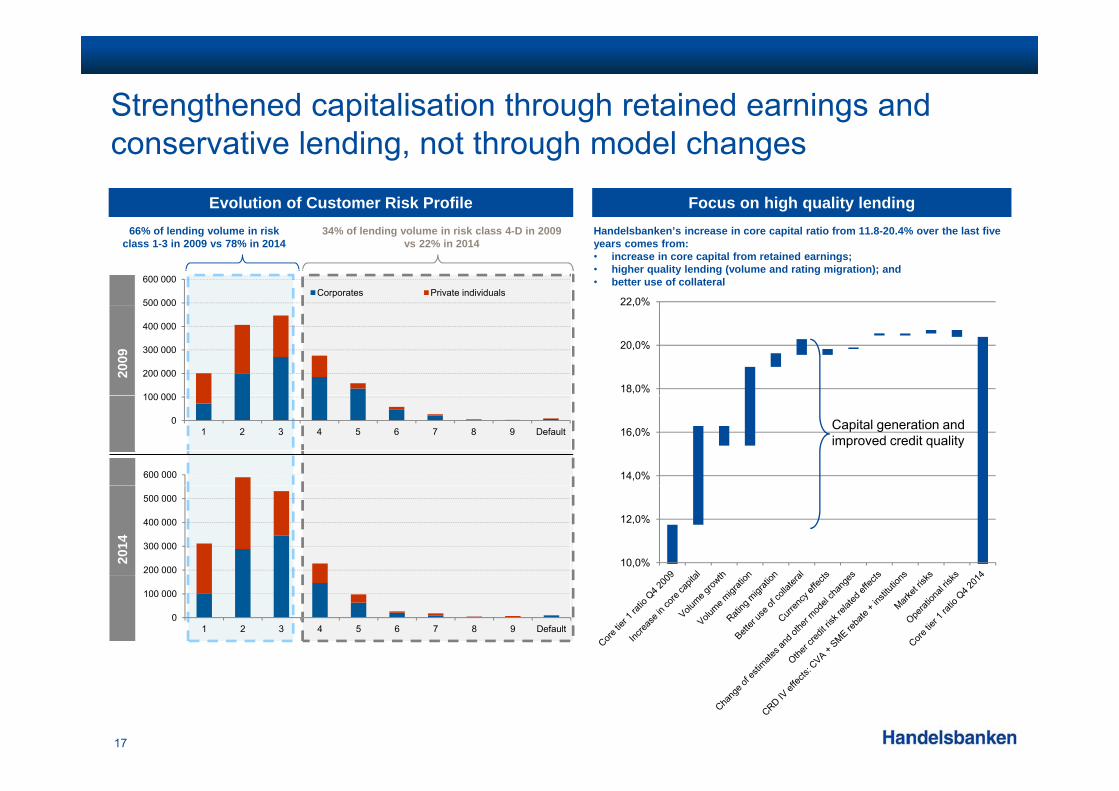
Strengthened capitalisation through retained earnings and conservative lending, not through model changes
Evolution of Customer Risk Profile Focus on high quality lending
22,0%
66% of lending volume in risk class 1-3 in 2009 vs 78% in 2014
34% of lending volume in risk class 4-D in 2009 vs 22% in 2014
Handelsbanken’s increase in core capital ratio from 11.8-20.4% over the last five years comes from:• increase in core capital from retained earnings; • higher quality lending (volume and rating migration); and• better use of collateral
500 000
600 000Corporates Private individuals
18,0%
20,0%
,
2009
100 000
200 000
300 000
400 000
500 000
14,0%
16,0%0
100 000
1 2 3 4 5 6 7 8 9 Default
600 000
Capital generation and improved credit quality
10,0%
12,0%
200 000
300 000
400 000
500 000
2014
0
100 000
1 2 3 4 5 6 7 8 9 Default
17

Handelsbanken best in class in the EBA stress test 2014Handelsbanken best in class in the EBA stress test 2014
CET1 ratios in 2016 with adverse scenario stress test
16.9%
14%
16%
18%
8%
10%
12%
2%
4%
6%
0%
2%
18
Source: EBA

Handelsbanken core capital position significantly in excess of SFSA’s requirements
Handelsbanken’s buffer to minimum core capital and combined buffer requirements (Q4 ’14) (excluding pre-provision profit generation)
7.2 %2.7 %
20.4 %20%
(excluding pre provision profit generation)
9.9 %3.6 %
1.5 %
15%
0.5 %
2.5 %
10.5 % 2.0 %
10%
Pillar 2 not a formal requirement and therefore
4.5 %
3.0 %10.5 %5%
not an MDA requirement under SFSA’s memorandum
0%Pillar 1 Pillar 2 CET1
CRD IV minimum SIFI Pillar 1 Countercyclical Buffer
Buffer to Pillar 1 Requirement
Buffer to Capital Requirement According to SFSA
Actual CET1
19
Capital Conservation Buffer Buffer to Pillar 1 Requirement SIFI Pillar 2Mortgage Risk Weightfloors Additional Pillar 2 Requirements Buffer to Capital Requirement According to SFSA

Pillar 2 capital requirement not part of MDA restrictionsPillar 2 capital requirement not part of MDA restrictions
2.8.6.2: “….As stated in the legal basis, neither the Pillar 2 basic requirement nor the capital planning buffer affect the g , q p p gautomatic restrictions on distributions, as long as a formal decision on a specific own funds requirement has not been made. Hence, in such a situation, a firm may freely choose, in the framework of other applicable regulations and under FI’s review, the most suitable way of restoring the capital in that specific situation. For example, the firm is not obliged to halt or limit dividends or interest payments on Tier 1 capital contributions, if the firm can identify other and more appropriate ways of restoring the capital sufficiently quickly. (This applies as long as there is no shortfall from the combined buffer requirement under the Pillar 1 rules, i.e. excluding the q y ( pp g q gspecific own funds requirement).”
2.8.7: “Chapter 4, sections 4 and 5 of the supervision act expresses that FI shall agree with authorities from other countries included in the international supervisory college on a suitable level for the group’s own funds with due consideration for the group’s financial situation and risk profile, and the level of own funds required to apply Chapter 2, section 1 of the mentioned Act to both individual units and the group as a whole. The agreement referred to is binding for FI, as it is for the other authorities concerned. FI intends to apply it to firms in the way described above in the section on FI’s decision-making. In FI’s opinion, the decision on the group’s combined own funds made in the framework of the supervisory college is not binding for the firms in the group because it is not a formal decision made according to Chapter 2, section 1 of the supervision act. In other words, it is not a formal decision in the sense referred to in FI’s position in section 2.8.3.”
Kapitalkrav for Svenska Banker, 8-Sep-2014
Handelsbanken intends to maintain the capital structure hierarchy in terms of distributions
20

Considerable buffers at hand in the unlikely event of stress yfor the bank
2014 profit before tax,
Income taxesSEK 4.1bn
IT investmentsSEK 1.6bn
Tools that are availableto directlycounteractp ,
Oktogonen and expensed IT-investments:
SEK 21.6bnDividend/Buy-backsP t ti 73%
SEK 11.1bn
OktogonenSEK 0.8bn
counteractany negative impact of a severedownturn for the bankPayout ratio 73%
SEK 4.0bn
Reinvested in profitable business with low risks
C/I ratio 45.2%
Efficient capital use and high ROE of 13.4%
Strong capitalisationsupported by strong profits
21
supported by strong profitsCET1 ratio 20.4%

Total capital ratios far exceeding regulatory minimaTotal capital ratios far exceeding regulatory minima
Current total capital position (Q4 ’14)Capital requirement (SFSA Release November 2014) Capital targetTotal capital requirement (SFSA Release November 2014)
3.5 %
25.6 %
%
Under normal circumstances, Handelsbanken’s common equity tier 1 ratio should be between 1 and 3 percentage points above the combined
1.7 %
Tier 20.4 %
3.5 %
22.7 %
Minimum additional Tier 1 and Tier 2 capital requirement
25% risk weight floor on Norwegian Mortgages
common equity tier 1 capital requirement received by the Bank from the SFSA. In addition, the tier 1 ratio and the total capital ratio must exceed the levels for these ratios received by the Bank from the
Tier 1
2.0 %
2.0 %
4.3 %
10.5 %
25% risk weight floor on Swedish Mortgages
Own fund requirement in Pillar 2 excluding risk weight floor on Swedish Mortgages and systemic risks
SFSA by at least one percentage point.
The SFSA’s memorandum indicated :
— CET1 of 17.7%Total capital20.4 %
CET1
3.0 %
0.5 %
2.5 %
Capital conservation buffer
Countercyclical buffer
Swedish systemic risk buffer in Pillar 2
— Total capital requirement of 22.7%
Reported
4.5 %
Pillar 1 + other buffers Pillar 2
Swedish systemic risk buffer
Minimum common equity Tier 1 requirement
22

Negligible historical loan losses in the context of expected buffer to trigger
Annual loan losses, 2010–2014 (SEKm)
Loan loss ratio (%)
1800
2000
Total buffer to 8% trigger of SEK60bn equals 45 times the annual average
loan losses0.100.070.080.050.10
Total buffer to 10.5% MDA of SEK47.5bn
1200
1400
1600 equals 36 times the annual average
loan losses
SE
K(m
)
400
600
800
1000
0
200
400
2010 2011 2012 2013 2014 Average
• Assuming average annual loan losses of SEK1310m (2010 2014) and a buffer to trigger of SEK60bn Handelsbanken has a• Assuming average annual loan losses of SEK1310m (2010-2014) and a buffer to trigger of SEK60bn, Handelsbanken has a multiple of 45 annual average loan losses (assuming zero capital generation) to hit the trigger. Assuming a buffer to MDA of SEK47.5bn, Handelsbanken has a multiple of 36x annual average loan losses to MDA
• Annual earnings capacity of SEK21.6bn before loan losses, Oktogonen, tax and IT-investments provides further buffer
23
• Total buffer to trigger including one year’s earnings SEK81.6 bn a multiple of 62 annual average loan losses

Capital requirement vs annual loan lossesCapital requirement vs. annual loan losses
Historical loan losses Model Risk weights and capital requirement
H d l b k ’ it l i t f3740
Capital requirement for credit risk as a multiple of annual loan losses1
Handelsbanken’s capital requirement for
credit risk equals 37 times annual loan loss
level1
25
30
35
... versus 16 times on average for peers
1615
20
25
5
10
0Handelsbanken Peer average**2
24
1 Capital requirement for credit risk and CVA in 2014 divided the average loan loss ratio in 1997 – 2014 multiplied by current lending2 Peer banks include Danske Bank, DNB, Nordea, SEB and Swedbank

Proposed TransactionProposed Transaction

Summary of the Terms & ConditionsSummary of the Terms & Conditions
Issuer Svenska Handelsbanken AB (publ) (the “Bank”)
Expected ratings of the Notes • Expected Baa3/BBB/BBB (Moody’s/S&P/Fitch)
Status • Deeply subordinated• Senior only to share capital and other obligations of the Bank ranking, or expressed to rank junior to the Notesy p g g, p j
Maturity • Perpetual
Interest
• Fixed until the First Reset Date, reset every 5 years thereafter (non-step)• First Reset Date: [●] 2021Interest [ ]• Payable annually in arrear• Fully discretionary non-cumulative, subject to sufficient distributable items and MDA
• Optional redemption on the First Reset Date and every 5 years thereafter at the outstanding principal amountOptional Redemption • Optional Redemption upon a Capital Event (full loss of Tier 1 treatment) or a Tax Event at the outstanding principal
amount
Loss Absorption • Temporary write-down upon breach of 8% CET1 at the Group level or 5.125% at the Bank level• Discretionary reinstatement and write-up of the outstanding principal amount of the Notes as further set out in the
Mechanism conditions to the Notes • Subject to Statutory PONV
Substitution or Variation Instead of R d ti
• Following the occurrence of a Capital Event or Tax Event, possibility to substitute all or vary the terms of the Notes without any requirement for the consent or approval of the noteholders, so that the Notes become or remain
26
Redemption Qualifying Additional Tier 1 Securities as further set out in the conditions to the Notes

Equity dividend distribution versus indicative AT1 couponEquity dividend distribution versus indicative AT1 coupon
Dividend paid, 2012–20141 (SEKm) 3Y avg. dividend vs indicative AT1 coupons (SEKm)
8,000
9,000
10,000
10,000
12,000
5,000
6,000
7,000
,
6,000
8,000
2,000
3,000
4,000
2 000
4,000
0
1,000
3Y avg dividend AT1 annual coupons2 0
2,000
2012 2013 2014
Based on historical levels, AT1 coupons are expected to be very modest in comparison to Handelsbanken’s total equity dividend distributions
27
1 Proposed dividend for 2014 2 For indicative purpose, AT1 coupons based on USD1bn size and proxy 5% annual coupons

Handelsbanken enjoys one of the largest CET1 buffer of all AT1 issues to date…
20,4%21,2%
20,0%
25,0%
12,4% 13,2%
8 2% %
16,2%15,3% 15,2% 14,7%
12,9% 12,6%11,6% 11,3% 10 9%
15,0%
CET
11
8,2%
10,2%7,2%
7,7%
7,8%5,6%
6,5%4,3%
5,8%3,3%
5,2% 2,6%4,5%
, 10,9% 10,3% 10,3%9,6% 9,6%
5 0%
10,0%
C
8,0% 8,0% 8,0%5,1%
8,0% 7,0%5,1%
7,0%5,1%
7,0%5,1%
7,0%5,1%
7,0%5,1%
0,0%
5,0%
TWD ConvTWD TWD TWDConv TWDConv ConvTWD TWDConv TWD ConvTWD
Trigger Buffer Loss Absorption Mechanism
28
Note: Based on the latest issuance by any Issuer. Includes: Barclays, BBVA, Danske, DB, KBC, HSBC, Lloyds, Nordea , Rabobank, Santander, SEB, SocGen, Swedbank and Unicredit1 As reported in the Offering Circular or marketing material. If Unavailable based on financial disclosure prior to the issuance.

… As well as one of the highest buffer to Pillar 1 and MDA restrictions
20,4%21,2%
20,0%
25,0%
9,9% 10,6%
5 8%
16,2%15,3% 15,2% 14,7%
12,9% 12,6%
15,0%
CET
11
5,8%6,3%
5,0% 4,4%
5,9%2,6% 1,2%
1,7%2,9%
3,3% 2,3% 1,6%
,6%11,6% 11,2% 10,9%
10,3% 10,3% 9,6%9,6%10,0%
C
10,5% 10,6% 10,4%9,0%
10,2% 10,3%
7,0%
10,0% 10,4% 9,5%8,0% 7,0% 8,0%
10,4%8,0%
5,0%
0,0%
MDA Trigger Buffer2
29
Note: Based on the latest issuance by any Issuer. Includes: Barclays, BBVA, Danske, DB, KBC, HSBC, Lloyds, Nordea , Rabobank, Santander, SEB, SocGen, Swedbank and Unicredit1 As reported in the Offering Circular or marketing material. If Unavailable based on financial disclosure prior to the issuance.2 As reported in the Offering Circular or marketing material. If Unavailable based on assumption regarding buffer requirements.

St i it l ti i t tStrong organic capital generation in contextLowest Full Year Net Income (2007 to Date) / Q3 2014 RWA2
3,0%
4,0%
Swedish banks Other European banks
2,1 %
1,6 %1,0 %
0,9 % 0,7 %1 0%
2,0%
3,0%
0,5 % 0,3 %0,2 % 0,1 % 0,0 %
-1 0%
0,0%
1,0%
(1,0)% (1,1)%
(1,7)%
(2 8)%3 0%
-2,0%
-1,0%
(2,8)%
(3,4)%-4,0%
-3,0%
30
Note: Based on IBES, financial disclosure. Includes: Barclays, BBVA, Danske, DB, KBC, HSBC, Lloyds, Nordea , Rabobank, Santander, SEB, Swedbank, SocGen and Unicredit1 Based on 2014 NI / 2014 REA for Handelsbanken, SEB, Swedbank and Nordea.2 Based on lowest NI (2007 to date) / Q4 2014 REA for Handelsbanken, SEB, Swedbank and Nordea.

Investment considerationsInvestment considerations
• Scalable and repeatable business model, unchanged and proven by 43 years of track record
Proven business model with extremely conservative
risk profile
Scalable and repeatable business model, unchanged and proven by 43 years of track record
• Increased geographic diversification through organic growth with 35% of operating profits before
• 15% annual average growth in equity plus dividends since the beginning of the financial crisis
A l l l i 1997 f 5b• Annual average loan losses since 1997 of 5bps
• Q4 2014: CRD IV Common Equity Tier 1 ratio of 20.4%, CRD IV Total capital ratio of 25.6%
• Capital (CET1) generation of 320bps1Best in class capital
position
Capital (CET1) generation of 320bps
• Buffer to trigger of 12.4% / SEK60bn. This is 45 times the annual average loan losses
• Buffer to trigger including pre-provision earnings is SEK81.6 bn 62 times annual average loan losses
Extremely low non-payment risk
• Buffer to MDA of 9.9% / SEK47.5bn. This is 36 times the annual average loan losses
• Estimated AT1 coupons only 4.4% of 3yr average dividends
H d l b k ’ i t i t d t i t i th it l hi h di t ib ti• Handelsbanken’s senior management intends to maintain the capital hierarchy on distributions
31
1Based on 2014 net income divided by 2014 REA

Appendix A: Handelsbanken Additional Business Position / Macro Information

Loan losses for Swedish residential mortgages have been lowLoan losses for Swedish residential mortgages have been low – low even during the severe banking crisis of the 1990’s
Stable loan book, tested in severe crisesRobust housing market dynamics
Loan loss ratio for Stadshypotek’s private market Loan loss levels are very low for Swedish mortgages due to several factors The borrower can not get out of debt by transferring the
collateral to the bank, full recourse
1,00%
Personal bankruptcy does not mean debt is written off
A negative credit history of the borrower will be reported to the independent credit agency, which impairs the borrower’s access to additional credit
S f
0,60%
0,80%
Swedish welfare system protects people substantially when unemployed
Buying homes to let is rare, as it is legally restricted in order to protect the tenant. No tax incentives either to own more h th
0,20%
0,40%Handelsbanken acquiresStadshypotek
homes than you occupy
Regulation of rents for the rental housing market has diminished speculative building
As a result, housing prices and prices for tenant-owned (0,20)%
0,00%
91 92 93 94 95 96 97 98 99 00 01 02 03 04 05 06 07 08 09 10 11 12 13 14
Swedish 1990’s crisis was severe for households though losses were still at comparatively low levels
units have been supported by an increasing demand vs. a limited supply
199
199
199
199
199
199
199
199
199
200
200
200
200
200
200
200
200
200
200
201
201
201
201
201
33

UK business testament to Handelsbanken’s conservative risk profile and focused organic growth strategy
Continued expansion and increased availability
188 branches including appointed branch managers
More than 1,750 employees in the UK
Earnings increased by 28% in local currency in January – December
Income and expense trend in branches in the UK1Branch locations Income and expense trend in branches in the UKBranch locations
45
50
SEK m per branch
~ 55% of branches ~ 45% of branches
25
30
35
40less than 4years old more than 4 years old
10
15
20
25
0
5
0 year 1 yr 2 yrs 3 yrs 4 yrs 5 yrs 6 yrs 7 yrs 8 yrs 9 yrs 10 yrs
Income Costs Income profile 5 years ago Cost profile 5 years ago
34
1 Stable explanation variable for earnings growth
Years of operation

Appendix B: Handelsbanken Additional Capital InformationAppendix B: Handelsbanken Additional Capital Information

Summary of the Terms & ConditionsSummary of the Terms & ConditionsIssuer Svenska Handelsbanken AB (publ) (the “Bank”)The Notes • Additional Tier 1 Notes
Expected ratings of the Notes • Expected Baa3/BBB/BBB (Moody’s/S&P/Fitch)
Maturity • Perpetual
Rate of Interest• Fixed until the First Reset Date, reset every 5 years thereafter (non-step)• First Reset Date: [●] 2021• Payable annually in arrear, subject to Cancellation of Interest
Step-up • NoneCancellation of Interest • Fully discretionary non-cumulative, subject to sufficient distributable items and MDA as further set out in the conditions to the Notes
Optional Redemption • Optional redemption on the First Reset Date and every 5 years thereafter at the outstanding principal amount• Optional Redemption upon a Capital Event or a Tax Event at the outstanding principal amount
Capital Event • The Notes are fully excluded from the Tier 1 capital of the Bank or the Group
Tax Event • As a result of change in law, government action or change in interpretation, (a) the Bank will become subject to additional amounts or (b) the Notes cease to be tax deductible
T i E t • The CET1 Ratio of Bank or the Group, as the case may be, is less than the Trigger LevelTrigger Event p, y , gg• Group: The Bank together with its subsidiaries and other consolidated entities
Trigger Level • 8.0% at the Group level, 5.125% at the Bank level
W it D
• Upon the occurrence of a Trigger Event, write-down of the outstanding principal of the notes by the Write Down Amount• Write Down Amount: The amount that together with the prior write down or conversion of any Higher Trigger Loss Absorbing Instruments and pro rata
with the write-down or conversion of other Equal Trigger Loss Absorbing Instruments to restore the CET1 ratio of the Bank and / or the Group to at least th T i L lWrite Down the Trigger Level
• Higher Trigger Loss Absorbing Instrument: Loss absorbing instrument that is, or has been, subject to write-down or conversion at a CET1 that is higher than the Trigger Level
• Equal Trigger Loss Absorbing Instrument: Loss absorbing instrument that is, or has been, subject to write-down or conversion at the Trigger Level
Reinstatement• If a positive Net Profit of the Bank or the Group is recorded at any time following a Write Down, the Bank may, at its sole and absolute discretion,
reinstate all or any part of any Write-Down Amount and increase the outstanding principal amount of the Notes subject to MDA as further set out in the conditions to the Notes
Non Viability • Statutory, see Risk Factors for details
Substitution or Variation Instead of Redemption
• Following the occurrence of a Capital Event or Tax Event, possibility to substitute all or vary the terms of the Notes without any requirement for the consent or approval of the noteholders, so that the Notes become or remain Qualifying Additional Tier 1 Securities as further set out in the conditions to the Notes
Listing • Irish Stock Exchange
36
Listing g
Governing Law • English law, except that the subordination provisions contained in the conditions are governed by, and shall be construed in accordance with, Swedish
law
Denominations • [$200k]

Disclaimer (1/2)Disclaimer (1/2) THIS DOCUMENT AND ITS CONTENTS ARE CONFIDENTIAL AND IS BEING PROVIDED TO YOU SOLELY FOR YOUR INFORMATION AND FOR USE AT A PRESENTATION TO BE HELD IN CONNECTION WITH THE PROPOSED OFFER OF SECURITIES REFERRED TO HEREIN AND MAY NOT BE REPRODUCED IN ANY FORM OR FURTHER DISTRIBUTED TO ANY OTHER PERSON IN ANY MANNER OR PUBLISHED, IN WHOLE OR IN PART, FOR ANY PURPOSE. FAILURE TO COMPLY WITH THIS RESTRICTION MAY CONSTITUTE A VIOLATION OF APPLICABLE SECURITIES LAWS. IF THE DOCUMENT HAS BEEN RECEIVED IN ERROR, THEN IT MUST BE RETURNED IMMEDIATELY. NOTHING IN THIS PRESENTATION IS, NOR MAY BE RELIED ON AS, A PROMISE OR REPRESENTATION AS TO THE FUTURE.
By attending the meeting where this presentation is made, or by reading the presentation slides, you agree to be bound by the following instructions and limitations. This presentation does not constitute an offer to sell, or a solicitation of an offer to subscribe for, the securities referred to herein (the “Notes”) of Svenska Handelsbanken AB (publ) (the “Issuer”) in any jurisdiction in which such offer or solicitation is unlawful. References herein to the “Group” are to the Issuer, together with its subsidiaries.
This presentation is not for distribution, directly or indirectly, in or into Australia, South Africa, Canada, the United States or Japan or any other state or jurisdiction in which it would be unlawful to do so. This presentation does not constitute or form a part of any offer or solicitation to purchase or subscribe for any Notes or other securities in the United States.
The Notes have not been, and will not be, registered under the United States Securities Act of 1933 (the “Securities Act”) and may not be offered or sold in the United States absent registration or an applicable exemption from the registration requirements of the Securities Act. There will be no public offer of the Notes in the United States.q p
This presentation does not constitute or form part of, and should not be construed as, an offer or invitation to sell securities, or the solicitation of an offer to subscribe for or purchase securities, and nothing contained herein shall form the basis of or be relied on in connection with any contract or commitment whatsoever.
This presentation should always be read in conjunction with a preliminary offering circular (the “Preliminary Offering Circular”) dated [] 2015 (including any documents incorporated into the Preliminary Offering Circular by reference) and this presentation is in full qualified by the contents thereof. The Preliminary Offering Circular is subject to completion and amendment and is furnished on a confidential basis only for the use of the intended recipient. The Preliminary Offering Circular shallnot constitute an offer to sell or the solicitation of an offer to buy any securities. The Preliminary Offering Circular constitutes an advertisement for the purposes of the Prospectus (Directive 2003/71/EC) Regulations 2005 of Ireland and is not a prospectus and prospective investors should not subscribe for any Notes except on the basis of information contained in the final form of the Preliminary Offering Circular (including the information incorporated by reference therein) to be prepared in connection with the offering of the Notes. Copies of the Preliminary Offering Circular are, subject to applicable securities laws, available to investors from the managers appointed by the Issuer in respect of the proposed offer of the Notes (the “Joint L d M ”) Th P li i Off i Ci l i l d d i ti f t i i k l t d t i t t i th N t d it i d d th t ti i t d d f ll th i k Th t dLead Managers”). The Preliminary Offering Circular includes descriptions of certain risks related to an investment in the Notes and it is recommended that prospective investors read and carefully assess those risks. The summary terms and conditions contained in this presentation are indicative of the terms and conditions of the proposed Notes. Prospective investors are required to make their own independent investigations and appraisals of the business and financial condition of the Issuer, the Group and the nature of the Notes before taking any investment decision with respect to the Notes. Investors should make their investment decision solely on the basis of the offering circular in final form and not rely on these summary terms and conditions as being a complete and accurate representation of the full terms and conditions of the Notes. Prospective investors should, either individually or through their advisers, have sufficient investment expertise to understand the risks involved in any purchase or sale of any financial instrument discussed herein.
This presentation may only be communicated to persons in the United Kingdom in circumstances where section 21(1) of the Financial Services and Markets Act 2000 would not, if the Issuer was not an authorised person, apply to the Issuer.
Restriction on marketing and sales to Retail InvestorsThe Notes referred to in this presentation are complex financial instruments and are not a suitable or appropriate investment for all investors In some jurisdictions regulatory authorities have adopted or published laws regulations orThe Notes referred to in this presentation are complex financial instruments and are not a suitable or appropriate investment for all investors. In some jurisdictions, regulatory authorities have adopted or published laws, regulations or guidance with respect to the offer or sale of securities such as the Notes to retail investors. In particular, in August 2014, the United Kingdom Financial Conduct Authority (the FCA) published the Temporary Marketing Restriction (Contingent Convertible Securities) Instrument 2014 (as amended or replaced from time to time, the TMR) which took effect on 1 October 2014. Under the rules set out in the TMR (as amended or replaced from time to time, the TMR Rules), certain contingent write-down or convertible securities, such as the Notes, must not be sold to retail clients in the European Economic Area (the “EEA”) and nothing may be done that would or might result in the buying of such securities or the holding of a beneficial interest in such securities by a retail client in the EEA (in each case within the meaning of the TMR Rules), other than in accordance with the limited exemptions set out in the TMR Rules.Potential investors should inform themselves of and comply with any applicable laws, regulations or regulatory guidance with respect to any resale of the Notes, including the TMR Rules, as the case may be. By purchasing, or making or accepting an offer to purchase any Notes from the Issuer and/or any of the Joint Lead Managers, you represent, warrant, agree with and undertake to the Issuer and each of the Joint Lead Managers that:
(1) you are not a retail client in the EEA (as defined in the TMR Rules);( ) y ( )(2) whether or not you are subject to the TMR Rules, you will not sell or offer the Notes to retail clients in the EEA or do anything (including the distribution of the Prospectus) that would or might result in the buying of the Notes or the holding of a beneficial interest in the Notes by a retail client in the EEA (in each case within the meaning of the TMR Rules), other than (i) in relation to any sale of or offer to sell Notes to a retail client in or resident in the United Kingdom, in circumstances that do not and will not give rise to a contravention of the TMR Rules by any person and/or (ii) in relation to any sale of or offer to sell Notes to a retail client in any EEA member state other than the United Kingdom, where (a) you have conducted an assessment and concluded that the relevant retail client understands the risks of an investment in the Notes and are able to bear the potential losses involved in an investment in the Notes and (b) you have at all times acted in relation to such sale or offer in compliance with the Markets in Financial Instruments Directive (2004/39/EC) ("MiFID") to the extent it applies to you or, to the extent MiFID does not apply to you, in a manner which would be in compliance with MiFID if it were to apply to you; and (3) you will at all times comply with all applicable local laws, regulations and regulatory guidance (whether inside or outside the EEA) relating to sales of instruments such as the Notes, including any such laws, regulations and regulatory guidance relating to determining the appropriateness and/or suitability of an investment in the Notes by investors in any relevant jurisdiction.
Wh ti t b h lf f di l d di l d li t h h i ki ti ff t h N t f th J i t L d M th f i t ti ti t d
37
Where acting as agent on behalf of a disclosed or undisclosed client when purchasing, or making or accepting an offer to purchase, any Notes from the Joint Lead Managers, the foregoing representations, warranties, agreements and undertakings will be given by and be binding upon both the agent and its underlying client.

Disclaimer (2/2)Disclaimer (2/2) This presentation and its contents are confidential and should not be distributed, published or reproduced (in whole or in part) or disclosed by recipients to any other person. The distribution of this presentation and/or any other documents related to the proposed offering of the Notes into any jurisdiction may be restricted by law. Persons into whose possession this presentation comes should inform themselves about and observe any such restrictions. Any failure to comply with these restrictions may constitute a violation of the securities laws of any such jurisdiction.
The information in this presentation has been provided by the Issuer or obtained from publicly available sources References herein to (i) the full year end 31 December 2014 numbers or (ii) to the quarterly numbers for the three month period endedThe information in this presentation has been provided by the Issuer or obtained from publicly available sources. References herein to (i) the full year end 31 December 2014 numbers or (ii) to the quarterly numbers for the three month period ended 31 December 2014 are references to unaudited numbers. This presentation speaks as at the date hereof and has not been independently verified. None of the Issuer, any Group member, their respective advisers or any other party is under any duty to update or inform any recipient of any changes to information in this presentation, provide any recipient with access to any additional information or to correct any inaccuracies in any such information which may become apparent. No representation or warranty (express or implied) is given by the Issuer, any member of the Group or any of their respective affiliates, agents, directors, partners and employees or any other party that the information in this presentation is correct or complete, and to the fullest extent permitted by applicable law none of them accepts any liability whatsoever for any loss or damage howsoever arising from any use of this presentation or otherwise arising in connection therewith.
This presentation has been issued by and is the sole responsibility of the Issuer. None of the Joint Lead Managers or their respective affiliates, agents, directors, partners and employees accepts any responsibility whatsoever for, or any liability for anyloss howsoever arising, directly or indirectly, from this presentation or its contents, or makes any representation or warranty, express or implied, as to the contents of this presentation or for any other statement made or purported to be made by it, oron its behalf, including (without limitation) information regarding the Issuer, the Group or the Notes and no reliance should be placed on such information. To the fullest extent permitted by applicable law, each of the Joint Lead Managers accordingly disclaims any and all responsibility and/or liability, whether arising in tort, contract or otherwise, which it might otherwise have in respect of this presentation or any such statement. y p y y, g , , g p p y
This presentation is published solely for information purposes and does not constitute investment advice. Recipients should consult with their own legal, regulatory, tax, business, investment, financial and accounting advisors to the extent that they deem it necessary, and make their own investment, hedging and trading decisions (including decisions regarding the suitability of the Notes) based upon their own judgement as so advised, and not upon any information herein.Is this because the presentation may be published before the annual financial statements become available and thus the numbers are treated as not being audited?
This presentation includes certain “forward-looking statements”. Statements that are not historical facts, including statements about the beliefs and expectations of the Issuer, the Group and their respective directors or management, are forward-looking statements. Words such as “believes”, “anticipates”, “estimates”, “expects”, “intends”, “plans”, “aims”, “potential”, “will”, “would”, “could”, “considered”, “likely”, “estimate” and variations of these words and similar future or conditional expressions, are intended to identify forward-looking statements but are not the exclusive means of identifying such statements. By their nature, forward-looking statements involve risk and uncertainty because they relate to events and depend upon future circumstances that may or may not occur, many of which are beyond the control of the Issuer or the Group and all of which are based on current beliefs and expectations about future events. Such forward-looking statements involve known and
k i k t i ti d th f t hi h th t l lt f hi t f th I th G th f f t i d t lt t b t i ll diff t f f t ltunknown risks, uncertainties and other factors, which may cause the actual results, performance or achievements of the Issuer or the Group, the performance of any assets or industry results to be materially different from any future results, performance or achievements expressed or implied by such forward-looking statements. In addition, even if the Issuer’s or the Group’s financial position, business strategy, plans and objectives of management for future operations are consistent with the forward-looking statements contained in this presentation, those results or developments may not be indicative of results or developments in future periods. Such forward-looking statements are not guarantees of future performance and are based on numerous assumptions regarding the present and future business strategy of the Issuer and the environment in which the Issuer and the Group will operate in the future. These forward-looking statements speak only as at the date of this presentation and the Issuer and the Group expressly disclaim any obligation or undertaking to provide any updates or revisions to any forward-looking statements contained in this presentation. Any projections, valuations and statistical analyses are provided to assist the recipient in the evaluation of matters described herein. They may be based on subjective assessments and assumptions and may use one among alternative methodologies that produce different results and to the extent they are based on historical information, they should not be relied upon as an accurate prediction of future performance. Market data and certain economics and industry data and forecasts used, and statements made herein regarding the Issuer's position in the industry, were estimated or derived based upon assumptions the Issuer deems reasonable and from the Issuer's own research, surveys or studies conducted at the Issuer's request for it by third parties or derived from publicly available sources, industry or general publications such as newspapers.
38