Embed Size (px)
Citation preview

Half-yearly Financial Report at 30 June 2021

Half-yearly Financial Report at 30 June 2021
Half-yearly Financial Report at 30 June 2021

CONTENTS
INFORMATION ABOUT THE COMPANY AND INFORMATION FOR SHAREHOLDERS
GROUP STRUCTURECORPORATE BODIESDIRECTORS’ REPORT ON OPERATIONS Foreword Group performance and analysis of the results for the first half of the year 2021Investments Research and developmentAdditional information Principal risks and uncertaintiesInter-group and related party transactionsSignificant events occurring in the first half of 2021 Events subsequent to the close of the periodBusiness outlook CONDENSED CONSOLIDATED INTERIM FINANCIAL STATEMENTS AT 30 JUNE 2021 Consolidated statement of assets and liabilities*Consolidated income statement*Comprehensive consolidated income statementProspectus of changes in consolidated shareholders’ equityConsolidated statement of cash flows* EXPLANATORY NOTES TO THE CONDENSED INTERIM CONSOLIDATED FINANCIAL STATEMENTS AT 30 JUNE 2021 1. General information2. Summary of the accounting standards adopted
4
5
6
7
77
1313131414151515171718192021
222222
Half-yearly Financial Report at 30 June 2021
26272731313242474747515151525252
5354
54
55
56
5758
3. Recently issued accounting standards4. Estimates and assumptions5. Management of financial risk6. Information on operating segments7. Business combinations8. Notes to the consolidated statement of assets and liabilities9. Notes to the consolidated income statement10. Non-recurring revenues and operating costs11. Hyperinflation12. Transactions with related parties13. Commitments and risks14. Directors’ and auditors’ fees15. Independent auditor’s fees16. Research and development17. Positions or transactions resulting from atypical and/or unusual transactions18. Events of significance following the close of the financial period19. Approval of the condensed interim consolidated financial statements and authorisation for publicationATTACHED TABLESConsolidated statement of financial position, with indication of the amounts of positions with related parties.Consolidated statement of cash flows, with indication of the amounts of positions with related parties.Consolidated income statement, with indication of the amounts deriving from non-recurring transactionsCERTIFICATION OF THE CONSOLIDATED FINANCIAL STATEMENTS PURSUANT TO ARTICLE 154 BIS OF LEGISLATIVE DECREE 58/98 AUDITING COMPANY REPORT

INFORMATION ABOUT THE COMPANY AND INFORMATION FOR SHAREHOLDERS
REGISTERED OFFICEGVS S.P.AVia Roma 5040069 Zola PredosaBOLOGNA – ITALIATel. +39 051 6176311Fax + 39 051 6176200www.gvs.com
LEGAL INFORMATIONCapitale sociale: Euro 1.750.000 Codice fiscale 03636630372Partita Iva 00644831208REA di Bologna 0305386R.I di Bologna 45539
INVESTOR RELATIONSE-mail: [email protected]
Half-yearly Financial Report at 30 June 2021
GROUP STRUCTURE*
*For information on the company name, registered office, the currency in which the Company operates, share capital of the GVS Group companies and the stake held by GVS SpA, please see the Explanatory Notes.
GVS SUD
GVS MICROFILTRAZIONE
GVS MALESIA
GVS RUSSIA
GVS TURKEY
GVS PATRIMONIO
FENCHURCH ENVIRONMENTAL
GVS UK
GVS ARGENTINA
GVS PUERTORICO
GVS NA HOLDINGS
GVS DO BRASIL
GVS THAILAND
GVS MEXICO
GVS NORTHAMERICA
GVS FILTRATION
GVS JAPAN
GVS FORTUNE
GVS INDIA
GVS SUZHOUTRADING
GVS KOREA
GVS SUZHOU
YIBO MEDICALDEVICE

CORPORATE BODIES
Board of DirectorsChair Grazia Valentini (2)
Chief Executive Officer Massimo ScagliariniAmministratori esecutivi Marco Scagliarini
Mario SacconeMatteo Viola
Executive Directors Nadia Buttignol (1)
Arabella Caporello (1) Alessandro Nasi (2)
Michela Schizzi (1) (2)
Board of Statutory AuditorsPresidente Patrizia Lucia Maria RivaStanding auditors Francesca Sandrolini
Stefania GraziaSubstitute auditors Daniela Baesi
Mario Difino
Manager responsible for the preparation of the Company’s accounting documents Emanuele Stanco
Independent auditors PricewaterhouseCoopers SpA
(1) (Member of the Control, Risk and Sustainability Committee(2) Member of the Nominations and Remuneration Committee
Half-yearly Financial Report at 30 June 2021

DIRECTORS’ REPORT ON OPERATIONS
HALF-YEARLY FINANCIAL REPORT AT 30 JUNE 2021

7
DIRECTORS’ REPORT ON OPERATIONS
Foreword
The Interim Report on Operations of GVS SpA (hereinafter “GVS”, the “Company” or the “Parent Company” and together with its subsidiaries the “GVS Group” or the “Group”) is presented together with the condensed interim consolidated financial statements at 30 June 2021.
The Interim Report on Operations is intended to provide information on the situation of the GVS Group and on operations as a whole and in the various sectors in which it operates, including through subsidiaries.
The tables below have been prepared on the basis of the consolidated financial statements at 30 June 2021, to which reference should be made. The latter were prepared in accordance with the International Financial Reporting Standards (“IFRS”) issued by the International Accounting Standards Board (“IASB”) and approved by the European Union, as well as with measures issued in implementation of Article 9 of Legislative Decree no. 38/2005.
Group performance and analysis of the results for the first half of the year 2021.
The GVS Group is one of the world’s leading suppliers of filter solutions for applications in the following industries: Healthcare & Life Sciences, Energy & Mobility and Health & Safety.
The table below breaks down revenues from contracts with customers by division in the half years ending on 30 June 2020 and 30 June 2021.
(in thousands of Euro) Half Year closed at 30 June
2021 2020
Healthcare Liquid 48,988 34,829 Healthcare Air & Gas 25,973 22,805 Laboratory 19,106 10,351
Healthcare & Life Sciences 94,067 67,984
Powertrain & Drivetrain 15,549 13,473 Safety & Electronics 12,001 8,780 Sport & Utility 11,460 8,649
Energy & Mobility 39,011 30,902
Personal Safety 53,528 44,241 Air Safety 3,115 3,205
Health & Safety 56,643 47,446
Revenue from customer contracts 189,721 146,333
In the first half of 2021, GVS achieved consolidated revenues of Euro 189.7 million, up 29.7% from Euro 146.3 million in the same period of 2020. This result is mainly attributable to the performance of the Healthcare & Life Sciences division, due to the resumption of a sustained growth trend in the Laboratory business and the Healthcare Liquid business, which also benefited from the effects of the acquisitions completed in 2020. In addition, in the period, both these divisions benefited from revenues of €3 million and €3.8 million, respectively, following agreements reached with customers, for the early closure of a supply order and for the achievement of a minimum level of guaranteed turnover. The Energy & Mobility division shows a growth rate of 26.2% compared to the same period in 2020, mainly for the Safety &
8
Electronics and Sport & Utility businesses, thus confirming the return to a level of orders prior to the pandemic. At the same time, Personal Safety and the Healthcare Air & Gas business maintained excellent sales levels, despite the expected decline in products affected by health emergencies and the delay in the transition from disposable products to products less related to the emergency.
Financial statements for the first half closing at 30 June 2021 are shown below in comparison with those of the same period of the previous year, reclassified on the basis of current practice in financial analysis.
Analysis of reclassified financial position
Half Year closed at 30 June
(in thousands of Euro) 2021
of which non-
recurring
2021 from ordinary
operations % 2020
of which non-
recurring
2020 from ordinary
operations %
Revenues from sales and services 189,721 189,721 100.0% 146,333 146,333 100.0%
Other revenues and proceeds 2,932 2,122 810 0.4% 698 698 0.5%
Total revenues 192,653 2,122 190,531 100.4% 147,031 147,031 100.5% Cost of raw materials purchases and variations in inventories (46,587) (46,587) -24.6% (35,273) (35,273) -24.1%
Services (18,047) (991) (17,056) -9.0% (16,775) (4,481) (12,294) -8.4%
Various operating costs (3,563) (1,441) (2,122) -1.1% (1,280) (1,280) -0.9%
Added value 124,456 (310) 124,766 65.8% 93,702 (4,481) 98,183 67.1%
Cost of labour (52,897) (52,897) -27.9% (44,045) (972) (43,073) -29.4%
EBITDA 71,559 (310) 71,869 37.9% 49,658 (5,453) 55,111 37.7%
Amortisation and depreciation (10,306) (1,817) (8,489) -4.5% (9,040) (1,984) (7,056) -4.8%
Provisions and writedowns (248) (248) -0.1% (122) (122) -0.1%
EBIT 61,005 (2,127) 63,132 33.3% 40,495 (7,437) 47,932 32.8%
Financial proceeds and charges 1,439 1,439 0.8% (4,579) (4,579) -3.1%
Pre-tax result 62,444 (2,127) 64,571 34.0% 35,916 (7,437) 43,353 29.6%
Income tax (14,286) 274 (14,560) -7.7% (8,909) 1,690 (10,599) -7.2%
Group’s and minority shareholders’ net profit or loss 48,158 (1,852) 50,010 26.4% 27,008 (5,747) 32,755 22.4%
The consolidated economic results of operations of the first half closing at 30 June 2021 were as follows: total revenues from ordinary operations amounted to Euro 190.5 million (Euro 147 million in 2020); EBITDA from ordinary operations amounted to Euro 71.9 million (Euro 55.1 million in 2020); EBIT from ordinary operations came to Euro 63.1 million (Euro 47.9 million in 2020).
The trend in revenues from contracts with customers (+29.7% over 2020) is the result of sales trends in individual customer categories, as stated in the analysis above.
The percentage incidence of the first margin (total revenues, less cost of goods purchased plus change in inventories) on revenues from sales and services worsened slightly compared to the same period last year (-0.5 percentage point). Other revenues and proceeds from ordinary operations primarily represent contributions for operating expenses, recovery and chargeback of costs and insurance refunds. The balance of the item increased by Euro 112 thousand, compared to the same period of the previous year, mainly due to higher contributions received during the period.
The “Value added” margin as a percentage of revenues from sales and services decreased in 2021 (-1.3 percentage points), compared to the same period of last year, due to the effect of the change in the mix of products sold, which led to a higher incidence of raw material costs, and to the greater importance of short-term service and rental costs, compared to the first half of 2020.

9
The increase in absolute value of personnel costs in the period ended 30 June 2021 compared to the same period of the previous year is due to the acquisitions completed in 2020 and to the strengthening of the Group’s structure, even through fixed-term and temporary employment contracts, although the latter have dropped from the last quarter of the previous year, due to the effects of automation of production lines. The percentage impact of personnel costs on revenues from sales and services dropped from the previous year, from 29.4% in 2020 to 27.9% in 2021.
The increase in absolute value of the item amortisation, depreciation and write-downs for the period ended 30 June 2021 compared with the same period of the previous financial year is mainly due to the acceleration of the investment plans implemented by the Group during 2020 to meet the increase in production capacity which was necessary.
Net financial charges (net of profits on exchanges amounted to Euro 2,541 thousand in the first half of 2021 and losses on exchanges of Euro 2,663 thousand recorded in 2020) decreased in the period under examination, from Euro 1,916 thousand in the period ending on 30 June 2020 to Euro 1,102 thousand in the period ending on 30 June 2021, primarily as a result of a reduction of interest on loans following a decrease in residual debt and the closing and signing of new loans at more advantageous economic conditions, that took place during the second half of 2020.
The pre-tax result of recurrent activities reached Euro 64.5 million in 2021, Euro 21.2 million higher than the 2020 figure of Euro 43.4 million, due to the effect of the factors described above.
Non-recurrent proceeds and charges in the period ending on 30 June 2021 represent: (i) the capital gain realised following the sale of the Suzhou production site to the Chinese government (€1,911 thousand); (ii) contributions obtained from the Chinese government for the relocation of the same production site(€211 thousand); (iii) one-off 2021 CONSOB supervisory costs paid in relation to the IPO procedure(€991 thousand); (iv) costs allocated to the above-mentioned fund for the relocation of the Chineseproduction site, and the production site in England (coming to €1,441 thousand) and (v) amortisationof intangible and tangible assets recorded following the purchase price allocation of the Kuss group(€1,817 thousand), net of the related tax effect.
Non-recurrent proceeds and charges in the period ending on 30 June 2020 represent: (i) amortisation of intangible assets recorded following the purchase price allocation of the Kuss group (Euro 1,984 thousand), (ii) consultancy costs and one-off bonuses paid to personnel in relation to the IPO procedure concluded on 19 June 2020 (Euro 5,019 thousand), (iii) consultancy costs for purchase of the shareholding in Puerto Rico (Euro 259 thousand) and (iv) personnel reorganisation costs (Euro 176 thousand), net of the related tax effect.
Analysis of reclassified equity position
(in thousands of Euro) At 30 June 2021 At 31 December 2020
Net intangible assets 92,716 90,979
Net usage rights 9,791 8,438
Net tangible assets 73,098 68,925
Shareholdings in other companies 1,072 967
Other fixed assets 4,522 4,568
Fixed capital (A) 181,199 173,877
Net trade receivables 52,168 52,084
Inventories 56,151 46,048
Payables to suppliers (24,202) (25,585)
Net commercial working capital (B) 84,117 72,548
Other current assets 17,175 10,253
Other current liabilities (28,047) (36,933)
Total current assets/liabilities (C) (10,873) (26,680)
10
Net working capital (D)= (B) + (C) 73,244 45,867
Other non-current liabilities (E) (3,926) (3,167)
Employee termination indemnity and end of service indemnity (F) (4,553) (4,499)
Provisions for risks and charges (G) (2,463) (1,000)
Net invested capital (H) = (A+D+E+F+G) 243,502 211,078
Shareholders’ equity (273,622) (242,698)
Consolidated shareholders’ equity (I) (273,622) (242,698)
(Short-term financial indebtedness)/Liquidity 98,839 106,925
(Net medium/long term financial indebtedness) (68,719) (75,306)
Net financial indebtedness (L) 30,120 31,619
Own funds and net financial indebtedness (M) = (I+L) (243,502) (211,078)
Fixed capital as of 30 June 2021 showed an increase of Euro 7,322 thousand, mostly as a result of the increase in net intangible assets and net usage rights totalling Euro 3,089 thousand, and tangible assets of Euro 4,174 thousand.
The balance of trade net working capital at 30 June 2021 showed an increase of Euro 11,569 thousand, compared to 31 December 2020, with an increase in inventories of Euro 10,102 thousand net trade receivables of Euro 84 thousand and a decrease in trade payables of Euro 1,383 thousand.
The increase in other current assets at 30 June 2021, amounting to €6,922 thousand, was mainly due to the increase in receivables for direct and indirect taxes, advances to suppliers and prepaid expenses.
The decrease in other current liabilities at 30 June 2021 compared to 31 December 2020, amounting to €8,886 thousand, was mainly due to the decrease in current tax payables for €8,593 thousand and payables to employees and directors for €1,342 thousand.
Shareholders’ equity at 30 June 2021 increased by €30,925 thousand, mainly due to the overall result for the period of €52,376 thousand, reduced by dividends resolved for €22,750 thousand.
The reader is referred to the next section for information on changes in net financial indebtedness.
Analysis of net financial indebtedness and net financial position
Trends in net financial indebtedness and net financial position are analysed below.
(in thousands of Euro) At 30 June 2021 At 31 December 2020 (A) Cash on hand 119,475 125,068 (B) Cash equivalents - - (C) Other current financial assets 5,162 5,026 (D) Liquidity (A)+(B)+(C) 124,637 130,093
(E) Current financial indebtedness 4,391 4,063 (F) Current portion of non-current indebtedness 21,407 19,106 (G) Current financial indebtedness (E)+(F) 25,798 23,168
(H) Net current financial indebtedness (D)-(G) 98,839 106,925
(I) Non-current financial indebtedness 68,693 75,199 (J) Debt instruments 26 107 (K) Trade payables and other non-current payables - - (L) Non-current financial indebtedness (I)+(J)+(K) 68,719 75,306
(M) Total net financial indebtedness (H)-(L) 30,120 31,619

11
The change in net financial indebtedness at 30 June 2021 as compared to 31 December 2020, totalling Euro 1,499 thousand, is primarily due to the combined effect of cash generated from operating activities net of investments made and cash used to pay dividends and financial expenses. The decrease in current and non-current financial indebtedness, amounting to €3,957 thousand, was mainly due to the repayment of the current portion of long-term financial payables. Not that a number of financial agreements require the GVS Group to comply with certain financial parameters, which were met as of 30 June 2021.
The Group’s net financial position (excluding non-current active derivatives and net current and non-current leasing liabilities, measured in accordance with the provisions of IFRS 16 and equal to a total of Euro 10,194 thousand at 30 June 2021 and Euro 8,815 thousand at 31 December 2020 respectively), amounted to positive Euro 40,335 thousand and positive Euro 40,435 thousand as of these dates.
(in thousands of Euro) At 30 June 2021 At 31 December 2020 (M) Total net financial indebtedness 30,120 31,619
Non-current active derivative financial instruments 21 - Financial payables for leasing (net) 10,194 8,815 Total net financial position 40,335 40,435
Cash flow statement
The cash flow statement appears below.
(in thousands of Euro) Half Year closed at 30 June 2021 2020
Pre-tax result 62,444 35,916 - Adjustment for: Amortisation, depreciation and writedowns 10,306 9,040 Capital losses / (capital gains) from sale of assets (1,937) (28) Financial charges / (proceeds) (1,439) 4,579 Other non-monetary variations 2,938 606
Cash flow generated / (absorbed) by operations before variations in net working capital 72,312 50,113
Variation in inventories (7,039) (10,878) Variation in trade receivables (1,993) (13,892) Variation in trade payables (2,259) 21,366 Variation in other assets and liabilities (2,503) 3,059 Use of provisions for risks and charges and for employee benefits (449) (440) Taxes paid (24,746) (3,618)
Net cash flow generated / (absorbed) by operations 33,323 45,709
Investments in tangible assets (9,325) (13,459) Investments in intangible assets (2,210) (1,336) Disposal of tangible assets 3,554 108 Investment in financial assets - (1,219) Disinvestment in financial assets 17 - Payment for purchase of business unit net of cash on hand acquired - (10,532)
Net cash flow generated / (absorbed) by investment (7,964) (26,438)
Opening of long-term financial payables 87 503 Repayment of long-term financial payables (6,264) (14,366) Repayment of leasing liabilities (1,798) (2,027) Financial charges paid (1,836) (1,775) Financial proceeds collected 79 75 Net fee for IPO - 79,794
12
Dividends paid (22,403) (1,681)
Net cash flow generated/(absorbed) by financial assets (32,134) 60,523
Total variation in cash on hand (6,775) 79,795 -
Cash on hand at the start of the period 125,068 58,542 Total variation in cash on hand (6,775) 79,795 Conversion differences on cash on hand 1,182 (791) Cash on hand at the end of the period 119,475 137,546
During the period ending on 30 June 2021, operations generated Euro 22,200 thousand more liquidity than in the same period of the previous year, primarily as a result of increased EBITDA; to the contrary, cash flows absorbed by working capital were Euro 34,586 thousand higher.
In the first half of 2021, on the other hand, net investment activity (ordinary and for extraordinary acquisition transactions) showed a lower absorption of liquidity, compared to the same period of the previous year, for €18,474 thousand following the collection of the sale price of the factory in China; the sale took place in the first months of 2021, against the significant investments made in the first half of 2020, due to the COVID emergency and the consideration for company acquisitions.
Financial assets show a higher absorption of cash, compared to the same period of the previous year, for €92,657, following the payment of dividends in June 2021, against the cash contribution obtained in the first half of 2020, following the capital increase.
Indicators
The Group’s principal economic and financial indicators and other indicators at 30 June 2020 and 30 June 2021 are listed below.
Half Year closed at 30 June
(in thousands of Euro) At 30 June 2021 At 30 June 2020
ROE (net profit/total net shareholders’ equity) 35% 27% ROI (EBIT from ordinary operations/net invested capital) 52% 46% ROS (EBIT from ordinary operations/total revenues) 33% 33% EBITDA 71,559 49,658 EBITDA from ordinary operations 71,869 55,111 Net interest payable (excluding profits/losses on exchanges, Interest on actualisation of funds and proceeds due to sale of derivatives) (1,102) (1,916) Net Financial Debt 30,120 (9,208) Net financial position 40,335 852 Total intangible fixed assets/Total fixed assets 51% 57% Total intangible fixed assets/Total assets 21% 24% Acid test (short-term assets/short-term liabilities) 1.3 0.9 Net interest payable/net financial indebtedness 1.2% 1.3% Indebtedness ratio (net financial indebtedness/shareholders’ equity) (0.11) 0.05 Net financial position/shareholders’ equity (0.15) (0.00) EBITDA/Interest 64.93 25.92 EBITDA from ordinary operations/Interest 65.21 28.77 Net financial position/EBITDA (0.28) (0.01) Net financial position/EBITDA from ordinary operations (0.28) (0.01) Net financial debt / EBITDA (0.21) 0.09 Net financial indebtedness/EBITDA from ordinary operations (0.21) 0.08

13
Investments
The Group’s investment policy aims to achieve diversification in terms of product range and creation of new technological solutions for integration into the range of products it offers for sale. The development of new products is important for the Group, in order to continuously increase the satisfaction of its customers. Moreover, in the period under examination here, the Group has invested in improvement of the efficiency of production through reinforcement and boosting of automation processes and adaptation of its productive capacity to ensure immediate flexibility in response to a possible increase in activity and adaptability to emerging trends.
Investments for the half year ended 30 June 2021 is mainly attributable to the expansion of production capacity for the Healthcare & Life Sciences division, as well as for the Health & Safety division for the expansion of the product range.
Furthermore, it should be noted that, with reference to the period ended 30 June 2021, the main investments concerned the production plants in Italy, the plants in the United States of America and the GVS sites in the United Kingdom and Mexico.
Research and development
With research and development centres all over the world, GVS offers an extremely efficient service tailored to respond to its customers’ requests: from product conception and design to validation and mass production.
The Group’s R&D work aims to introduce new products and implement new production processes. These activities are divided into a number of different phases, from conception and start of the process of designing and new product process to large-scale industrial production. The main indicators for the period under review compared with the same period of the previous year are shown below.
Half Year closed at 30 June (in thousands of Euro) At 30 June 2021 At 30 June 2020 Research and development costs 10,073 9,053 Research and development costs/revenues from contracts with customers 5.3% 6.2%
Additional information
The Company does not own, and never has owned, stocks or shares in its parent company, even through an intermediary, and therefore did not buy or sell any such stocks or shares in 2021.
As of 30 June 2021, the Company did not hold treasury shares in its portfolio.
The Group did not conduct any atypical or unusual transactions during the period.
Principal risks and uncertainties
In conducting its business, the Company is exposed to financial risk, as described in the Explanatory Notes, representing:
• market risk, deriving from oscillating exchange rates between the Euro and the other currenciesin which the Group operates, and of interest rates;
• credit risk, deriving from the possibility of a counterpart defaulting;
• liquidity risk, deriving from insufficiency of financial resources to fulfil financialcommitments.
14
The Group’s goal is to maintain balanced management of its financial exposure over the years in order to guarantee a debt structure that is balanced with the composition of the company’s assets and capable of guaranteeing the necessary flexibility in operations through use of liquidity generated by current operations and resort to bank loans.
The capacity of characteristic management to generate liquidity and the capacity for indebtedness allow the Group to adequately satisfy the requirements of its operations and financing of operative working capital and investment capital, and to fulfil its financial obligations.
The Group’s financial policy and management of financial risk are guided and monitored at the central level. In particular, the central finance function assesses and approves provisional financial requirements, monitors trends and applies appropriate corrective actions where necessary.
For more details, refer to the “Management of financial risk” section of the Explanatory Notes.
Inter-group and related party transactions
With regard to relations with subsidiary, associated, parent and affiliated companies, please see the analytical indications given in the explanatory notes to these interim consolidated financial statements. The following is a summary of the types of transactions that have taken place:
Company Type of transaction
Subsidiaries – GVS Group Srl Financial, consolidated fiscal
Subsidiaries Commercial, performance of services and financial
Subsidiaries – Companies in the GVS Group Services
GVS SpA and its Italian subsidiary GVS Sud S.r.l. participate in the optional national tax consolidation system under GVS Group S.r.l. Transactions with subsidiaries are primarily commercial (sale of raw materials and finished goods, and providing of services for production) and financial (providing infragroup loans) in nature and are conducted under the conditions normally in effect on the market. The Company and a number of its subsidiaries have stipulated contracts for the leasing of real estate properties with companies directly or indirectly controlled by GVS Group S.r.l., under the conditions normally in effect on the market.
With regard to transactions with related parties, including inter-group transactions, it should be noted that these were neither atypical nor unusual and are part of the normal course of business of Group companies. They were carried out in compliance with internal procedure that contains rules aimed at ensuring their transparency and fairness, pursuant to the CONSOB Regulation No. 17221/2010.
In the notes to the consolidated financial statements, the Company provides the disclosures required pursuant to Art. 154-ter of the TUF as indicated by the CONSOB Regulation No. 17221 of 12 March 2010 and subsequent CONSOB Resolution No. 17389 of 23 June 2010. The disclosure on transactions with related parties required by the CONSOB Communication of 28 July 2006 is presented in the attached tables.
For more details, refer to the section entitled “Transactions with related parties” in the Explanatory Notes.

15
Significant events occurring in the first half of 2021
In the month of January 2021, the subsidiary GVS Technology (Suzhou) Co. Ltd. transferred ownership of its production site in Suzhou to the Chinese Public Authority and recorded an extraordinary capital gain of approximately Euro 1,911 thousand. At the same time, if on the one hand contributions obtained from the Chinese government for the relocation of the same production site for €211 thousand were recorded on the consolidated income statement, on the other hand a provision for charges for the relocation of the same factory was recorded for €922 thousand. According to the agreements reached, the company will continue to operate there, free of charge, until relocation to a new production site is completed. The timings of the investment in the new production site and the relocation of production and warehousing will be agreed between the parties at a later stage, in order to avoid disruption of the manufacture and marketing of products.
The period closing at 30 June 2021 was another one highly influenced by the COVID-19 pandemic (commonly known as Coronavirus). Like in the previous fiscal year, the Group continued to implement organisational measures and procedures to ensure the continuation of production and management activities, so as to guarantee respect for commitments made to customers, while fully respecting the health of its employees and collaborators.
Events subsequent to the close of the period
On 28 July 2021, the Board of Directors resolved to sell the shareholding in GVS Patrimonio immobiliare Srl, held by GVS Microfiltration to GVS Real Estate Srl. This transaction will be financed by GVS Real Estate Srl, which will pay the sale price and provide GVS Patrimonio Immobiliare with the amount necessary to extinguish its current debt position with GVS S.p.A.
On 31 August 2021, the GVS Group acquired 100% of the share capital of the RPB Group, which specialises in the design and manufacture of respiratory protection, including compressed air respirators and powered air-purifying respirators. In particular, GVS NA Holding Inc. (100% owned by GVS S.p.A.) acquired 100% of the share capital of the American companies Goodman Brands LLC andAbretec Group LLC, while GVS S.p.A. acquired 100% of the share capital of RPB Safety Limited (aNew Zealand company). The purchase price was set at a maximum of USD 194.4 million. Thetransaction provides for an upfront payment of approximately $150 million for the acquisition of 100%of the share capital, and a possible earn-out of $44.4 million (maximum value), the payment of which,expected in 2022, will be proportionally related to the achievement of the RPB group’s 2021 AdjustedEBITDA targets. In order to finance the transaction, GVS signed a 5-year loan agreement for 150million Euro with a pool of lending banks: Mediobanca - Banca di Credito Finanziario S.p.A., whichalso acts as agent, Unicredit S.p.A. and Crédit Agricole Italia S.p.A. GVS S.p.A. then made availableto GVS NA Holding Inc. the funds necessary for the purchase of the two American companies throughan intra-group loan at market conditions.
Business outlook
For the rest of 2021, the GVS Group will continue to strive for an organic consolidation of the results achieved to date, thanks to a rebalancing of the product portfolio mix that will enable it to consolidate the extraordinary growth occurring in 2020 and in the first quarter of 2021, keeping its focus high for timeliness in responding to market and client demands with an increasing sensitivity to active management of ESG issues. Following the results of the first half of 2021 and, depending on the amount of revenues from contracts with customers already realised and the order backlog acquired to date, current expectations for the year-end are in the range of €340 - 350 million, including the four-month contribution from RPB, acquired on 31 August 2021, which will offset part of the delay due to a slower transition of the Health & Safety division compared to initial forecasts. The EBITDA margin achieved in the first half of 2021 is expected to move towards normalisation in the second half, with the overall result expected to be in the range of 32% to 35%. The above forecasts are linked to orders already in

HALF-YEARLY FINANCIAL REPORT AT 30 JUNE 2021
CONDENSEDCONSOLIDATED INTERIMFINANCIAL STATEMENTSAT 30 JUNE 2021

17
CONDENSED CONSOLIDATED INTERIM FINANCIAL STATEMENTS AT 30 JUNE 2021
Consolidated statement of assets and liabilities*
(in thousands of Euro) Notes At 30 June 2021 At 31 December 2020
ASSETS Non-current assets Intangible assets 8.1 92,716 90,979 Assets represented by usage rights 8.2 9,791 8,438 Tangible assets 8.3 73,098 68,925 Advance tax assets 8.4 4,501 4,568 Non-current financial assets 8.5 1,072 968 Non-current derivative financial instruments 8.16 21 - Total non-current assets 181,199 173,878 Current assets Inventories 8.6 56,151 46,048 Trade receivables 8.7 52,168 52,084 Assets from contracts with customers 8.8 2,867 1,753 Current tax receivables 8.9 2,962 202 Other receivables and current assets 8.10 11,347 8,299 Current financial assets 8.5 5,162 5,026 Cash on hand 8.11 119,475 125,068 Total current assets 250,132 238,480 TOTAL ASSETS 431,331 412,358 SHAREHOLDERS’ EQUITY AND LIABILITIES Share capital 1,750 1,750 Reserves 223,685 162,854 Net income 48,154 78,063 Group net shareholders’ equity 273,589 242,667 Shareholders’ equity attributable to non-controlling interests 33 30
Total shareholders’ equity 8.12 273,622 242,697 Non-current liabilities Non-current financial liabilities 8.13 61,903 69,728 Non-current leasing liabilities 8.2 6,790 5,471 Deferred tax liabilities 8.4 3,926 3,167 Provisions for employee benefits 4,553 4,499 Provisions for risks and charges 8.15 2,463 1,000 Non-current derivative financial instruments 8.16 26 107 Total non-current liabilities 79,661 83,972 Current liabilities Current financial liabilities 8.13 22,322 19,673 Current leasing liabilities 8.2 3,476 3,495 Trade payables 8.17 24,202 25,585 Liabilities from contracts with customers 8.8 5,547 4,894 Current tax payables 8.9 5,892 14,485 Other current payables and liabilities 8.18 16,609 17,557 Total current liabilities 78,048 85,689 TOTAL LIABILITIES AND SHAREHOLDERS’ EQUITY 431,331 412,358
(*) Pursuant to the CONSOB Resolution no. 15519 of 27 July 2016, the effects of transactions with related parties on the consolidated statement of assets and liabilities are highlighted in the attached tables and are further described in Note 12.
18
Consolidated income statement*
(in thousands of Euro) Notes Half Year closed at
30 June 2021 2020
Revenue from customer contracts 9.1 189,721 146,333 Other revenues and proceeds 9.2 2,932 698 Total revenues 192,653 147,031 Purchases and consumption of raw materials, semi-products and finished products 9.3 (46,587) (35,273) Personnel costs 9.4 (52,897) (44,045) Service costs 9.5 (18,047) (16,775) Other operating costs 9.6 (3,563) (1,280) EBITDA 71,559 49,658 Net writedowns of financial assets 9.7 (248) (122)Amortisation, depreciation and writedowns 9.8 (10,306) (9,040)EBIT 61,005 40,495 Financial proceeds 9.9 2,620 75 Financial charges 9.9 (1,181) (4,654) Pre-tax result 62,444 35,916 Income tax 9.10 (14,286) (8,909) Net income 48,158 27,008 Group’s share 48,154 27,002 Minority share 4 5 Basic net profit per share 9.11 0.28 0.27 Diluted net profit per share 9.11 0.27 0.27
(*) Pursuant to the CONSOB Resolution no. 15519 of 27 July 2016, the effects of transactions with related parties on the consolidated income statement are highlighted in the attached tables and are further described in Note 12.

19
Comprehensive consolidated income statement
(in thousands of Euro) Notes Half Year closed at 30 June
2021 2020 Net income 48,158 27,008
Other components of the comprehensive income statement which will be reclassified in the income statement in subsequent years
Profits (losses) on cash flow hedges, net of tax effect 8.12 (5) -
Difference due to conversion of financial statements in foreign currency 8.12 4,223 (3,645) 4,218 (3,645)
Other components of the comprehensive income statement which will not be reclassified in the income statement in subsequent years
Actuarial profit (loss) due to employee defined benefit plans net of tax effect - -
- -
Total other components in the comprehensive income statement 4,218 (3,645) Comprehensive net profit 52,376 23,363 Group’s share 52,373 23,362 Minority share 3 1
20
Prospectus of changes in consolidated shareholders’ equity
(in thousands of Euro) Share capital
Reserves
Net incom
e G
roup net shareholders’
equity
Shareholders’ equity
attributable to non-controlling
interests
Total shareholders’
equity Share prem
ium
reserve Legal reserve
Extraordinary reserve
Translation reserve
Negative
reserve for treasury shares
Actuarial profits and
losses reserve
Profit (loss) carried over and
other reserves
At 31 D
ecember 2019
1,650 13,247
329 25,745
(3,040) (10,981)
(51) 34,240
33,083 94,222
18 94,240
Net incom
e -
- -
- -
- -
- 27,002
27,002 5
27,008 Total other com
ponents in the comprehensive incom
e statement
- -
- -
(3,641) -
- -
- (3,641)
(4) (3,645)
Com
prehensive net profit -
- -
- (3,641)
- -
- 27,002
23,361 1
23,363
Allocation of net profit from
previous year -
- -
15,114 -
- -
17,969 (33,083)
- -
- C
ancellation of treasury shares -
- -
(10,981) -
10,981 -
- -
- -
- C
apital increase 100
81,400 -
- -
- -
- -
81,500 -
81,500 A
ccessory costs to the capital increase -
(2,694) -
- -
- -
- -
(2,694) -
(2,694) Taxes relating to capital increase costs
- 753
- -
- -
- -
- 753
- 753
At 30 June 2020
1,750 92,706
329 29,878
(6,681) -
(51) 52,209
27,002 197,142
19 197,162
(in thousands of Euro) Share capital
Reserves
Net incom
e G
roup net shareholders’
equity
Shareholders’ equity
attributable to non-controlling
interests
Total shareholders’
equity Share prem
ium
reserve Legal reserve
Extraordinary reserve
Translation reserve
Negative
reserve for treasury shares
Actuarial profits and
losses reserve
Profit (loss) carried over and
other reserves
At 31 D
ecember 2020
1,750 92,770
329 30,485
(11,636) -
(187) 51,093
78,063 242,667
30 242,698
Net incom
e -
- -
- -
- -
48,154 48,154
4 48,158
Total other components in the com
prehensive income statem
ent -
- -
- 4,224
- -
(5) -
4,219 (1)
4,218
Com
prehensive net profit -
- -
- 4,224
- -
(5) 48,154
52,373 3
52,376
Allocation of net profit from
previous year -
- 21
4,537 -
- -
73,505 (78,063)
- -
- Increase in reserves for long-term
incentives -
- -
- -
- -
1,298 -
1,298 -
1,298 D
ividends distributed -
- -
- -
- -
(22,750) -
(22,750) -
(22,750)
At 30 June 2021
1,750 92,770
350 35,022
(7,412) -
(187) 103,141
48,154 273,589
33 273,622

21
Consolidated statement of cash flows*
(in thousands of Euro) Notes Half Year closed at 30 June
2021 2020 Pre-tax result 62,444 35,916 - Adjustment for: Amortisation, depreciation and writedowns 9.8 10,306 9,040 Capital losses / (capital gains) from sale of assets 9.2 - 9.6 (1,937) (28) Financial charges / (proceeds) 9.9 (1,439) 4,579 Other non-monetary variations 2,938 606
Cash flow generated / (absorbed) by operations before variations in net working capital 72,312 50,113
Variation in inventories 8.6 (7,039) (10,878) Variation in trade receivables 8.7 (1,993) (13,892) Variation in trade payables 8.17 (2,259) 21,366 Variation in other assets and liabilities 8.10 - 8.18 (2,503) 3,059 Use of provisions for risks and charges and for employee benefits (449) (440) Taxes paid 9.10 (24,746) (3,618)
Net cash flow generated / (absorbed) by operations 33,323 45,709
Investments in tangible assets 8.3 (9,325) (13,459) Investments in intangible assets 8.1 (2,210) (1,336) Disposal of tangible assets 8.3 3,554 108 Investment in financial assets 8.5 - (1,219) Disinvestment in financial assets 8.5 17 - Payment for purchase of business unit net of cash on hand acquired 7 - (10,532)
Net cash flow generated / (absorbed) by investment (7,964) (26,438)
Opening of long-term financial payables 8.13 87 503 Repayment of long-term financial payables 8.13 (6,264) (14,366) Repayment of leasing liabilities 8.2 (1,798) (2,027) Financial charges paid 9.9 (1,836) (1,775) Financial proceeds collected 9.9 79 75 Net fee for IPO 8.12 - 79,794 Dividends paid 8.12 (22,403) (1,681)
Net cash flow generated/(absorbed) by financial assets (32,134) 60,523
Total variation in cash on hand (6,775) 79,795 -
Cash on hand at the start of the period 125,068 58,542 Total variation in cash on hand (6,775) 79,795 Conversion differences on cash on hand 1,182 (791) Cash on hand at the end of the period 119,475 137,546
(*) Pursuant to the CONSOB Resolution no. 15519 of 27 July 2016, the effects of transactions with related parties on consolidated cash flows are highlighted in the attached tables.
22
EXPLANATORY NOTES TO THE CONDENSED INTERIM CONSOLIDATED FINANCIAL STATEMENTS AT 30 JUNE 2021
1 General information
1.1 Foreword
GVS S.p.A. (hereinafter referred to as “GVS”, the “Company” or the “Parent Company” and, with its subsidiaries, as the “GVS Group” or simply the “Group”) is a company established and domiciled in Italy, with registered offices in Zola Predosa (BO), Via Roma 50, organised according to the law of the Republic of Italy.
GVS is owned by the company GVS Group S.r.l. (hereinafter the “GVS Group”), which directly holds 60% of the share capital. There is no other entity exercising direction and coordination of the Company.
The GVS Group is a leading supplier of advanced filtering solutions for highly critical applications and offers advanced filtering solutions for a multitude of applications in a number of highly regulated sectors, organised into the following business divisions: Healthcare & Life Sciences, Energy & Mobility and Health & Safety.
2 Summary of the accounting standards adopted
2.1 Preparation basis
The Half-Yearly Financial Report at 30 June 2021 has been prepared in accordance with IAS 34, concerning interim reporting. IAS 34 allows for the preparation of financial statements in “condensed” form, i.e. on the basis of a level of disclosure significantly lower than that required for annual financial statements under IFRS, where a complete set of financial statements prepared under IFRS has previously been made available to the public. These half-yearly condensed financial statements therefore do not include all the information required for the annual financial statements and must be read together with the annual financial statements prepared for the year ended 31 December 2020.
The principal criteria and accounting standards applied in preparation of the condensed interim consolidated financial statements are listed below.
2.2 Declaration of conformity with international accounting standards
The condensed interim consolidated financial statements have been prepared in accordance with the International Financial Reporting Standards, issued by the International Accounting Standards Board. Adopted by the European Union and endorsed by the European Commission (the “International Accounting Standards”) they were in force at 30 June 2021. The term EU-IFRS refers to all “International Financial Reporting Standards”, all “International Accounting Standards” (IAS) and all interpretations of the “International Financial Reporting Interpretations Committee” (IFRIC), previously known as the “Standing Interpretations Committee” (SIC).
These Interim Consolidated Financial Statements were approved by the Company’s Board of Directors on 10 September 2021 and subjected to limited auditing by independent auditor PricewaterhouseCoopers S.p.A.

23
2.3 General principles of preparation
The condensed interim consolidated financial statements consist of the financial statements obligatorily required under standard IAS 1, and that is, the consolidated statement of financial position, consolidated statement of profit and loss, consolidated comprehensive statement of profit and loss, consolidated statement of changes in equity and statement of cash flows, as well as explanatory notes.
The Group chose to represent its statement of profit and loss according to the nature of the expense, while the assets and liabilities in the statement of financial position are divided into current and non-current. The statement of cash flows is prepared by the indirect method. The schemes employed are those that best represent the Group’s economic and financial standing.
An asset is classified as current when:
• it may be supposed that the asset will be sold, or is owned for sale or consumption, during thecourse of the company’s regular operating cycle;
• it is owned primarily for the purpose of sale;
• it is supposed that it will be sold within twelve months of the end of the year;
• it consists of liquid assets or cash equivalents (unless it is forbidden to trade it or use it to paya liability for at least twelve months from the end of the year).
All other assets are classified as non-current. Standard IAS 1 includes tangible assets, intangible assets and long-term financial assets among non-current assets.
A liability is classified as current when:
• it is expected to be extinguished in the course of the company’s regular operating cycle;
• it is owned primarily for the purpose of sale;
• it will be extinguished within twelve months of the end of the year;
• there is no unconditional right to defer payment of the liability for at least twelve months afterthe end of the year. Clauses of a liability that could, if the counterpart so wishes, give rise to itsextinction through issuing of instruments representing capital do not affect its classification.
The company has classified all other liabilities as non-current.
The operating cycle is the amount of time that passes between acquisition of goods for the production process and cashing them in as liquid assets or cash equivalents. When the regular operating cycle is not clearly identifiable, its duration is assumed to be twelve months.
The consolidated interim financial statements are prepared in Euro, the currency in which the Company operates. The statement of financial position, statement of profit and loss, the explanatory notes and the tables illustrating them are expressed in thousands of Euro, unless otherwise specified.
The condensed consolidated financial statements have been prepared as follows:
• on the basis of EU-IFRS, taking into account best practice in the field; any future orientationsand updated interpretations will be reflected in subsequent years, on the basis of the methodsspecified in the applicable accounting standards;
• with a view to business continuity, on an accrual accounting basis, in compliance with theprinciple of the relevance and significance of the information and the prevalence of substanceover form, and with a view to promoting consistency with future presentations. Assets andliabilities, costs and revenues are not compensated against one another unless this is permittedor required under International Accounting Standards;
24
• on the basis of the conventional criterion of historical cost, with the exception of assessmentof financial assets and liabilities in cases in which it is obligatory to apply the fair valuecriterion, and for the financial statements of companies operating in economies subject tohyperinflation, which are prepared on the basis of the current cost criterion.
With reference to the prospect of business continuity, it should be noted that, in view of the spread of COVID-19 globally during 2020 and 2021, the Group’s economic and financial performance in the period ended 30 June 2021 was higher than previously expected in the budget. It should also be noted that cash and cash equivalents at 30 June 2021, amounting to Euro 119.5 million, the credit lines currently available and the cash flows that will be generated by operations, are considered more than sufficient to meet the Group’s obligations and finance its operations.
With regard to the performance in the first half of 2021, please read the Directors’ Report on Operations.
2.4 Consolidation criteria and methods
The condensed interim consolidated financial statements include the statement of financial position and the statement of profit and loss of the Company and its subsidiaries, approved by their respective administrative bodies, prepared on the basis of their accounting situations and, where applicable, opportunely corrected to ensure that they conform to EU-IFRS.
The table below lists information on the company name, registered offices, currency of operation, share capital and portion thereof owned directly by the Group for all GVS’s subsidiaries.
Company name Registered offices Currency Share capital at 30 June 2021 Direct owner
Percentage of control
At 30 June 2021 At 31 December 2020
GVS Sud Srl Italy - Zola Predosa (BO) EUR 10,000 GVS SpA 100.00% 100.00%
YUYao Yibo Medical Device Co. Ltd China - Yuyao CNY 5,420,000 GVS Technology (Suzhou) Co. Ltd. 100.00% 100.00%
GVS Technology (Suzhou) Co. Ltd. China - Suzhou (RPC) CNY 25,297,047 GVS SpA 100.00% 100.00%
Suzhou GVS Trading Co. Ltd. China - Ningbo CNY 250,000 GVS Technology (Suzhou) Co.Ltd. 100.00% 100.00%
GVS Fortune Holding Ltd Hong Kong (RPC) HKD 1 GVS SpA 100.00% 100.00%
GVS North America Inc USA - Sanford (MA) USD N/A GVS North America Holdings Inc 100.00% 100.00%
GVS Filtration Inc USA - Findlay (OH) USD 10 GVS North America Holdings Inc 100.00% 100.00%
GVS North America Holdings Inc USA - Sanford (MA) USD 0.10 GVS SpA 100.00% 100.00%
Fenchurch Environmental Group Ltd United Kingdom - Morecambe GBP 1,469 GVS SpA 100.00% 100.00%
GVS Filter Technology UK Ltd United Kingdom - Morecambe GBP 27,000 Fenchurch Environmental Group Ltd 100.00% 100.00%
GVS do Brasil Ltda Brazil - Municipio de Monte Mor, Campinas BRL 20,755,226 GVS SpA 99.95% 99.95%
GVS Argentina Sa Argentina - Buenos Aires ARS 1,510,212 GVS SpA 94.12% 94.12%
GVS Filter Technology de Mexico Mexico - Nuevo Leon MXN 50,000 GVS SpA 99.90% 99.90%
GVS Korea Ltd Korea - Seoul KRW 100,000,000 GVS SpA 100.00% 100.00%
GVS Microfiltrazione Srl Romania - Ciorani RON 1,600 GVS SpA 100.00% 100.00%
GVS Patrimonio immobiliare Srl Romania - Ciorani RON 300 GVS Microfiltrazione Srl 100.00% Na
GVS Japan KK Japan - Tokyo JPY 1,000,000 GVS SpA 100.00% 100.00%
GVS Russia LLC Russia - Moscow RUB 10,000 GVS SpA 100.00% 100.00%
GVS Filtre Teknolojileri Turkey - Istanbul TRY 100,000 GVS SpA 100.00% 100.00%
GVS Puerto Rico LLC Puerto Rico - Fajardo USD N/A GVS SpA 100.00% 100.00%
GVS Filtration SDN. BHD. Malaysia - Petaling Jaya MYR 1 GVS SpA 100.00% 100.00%
GVS Filter India Private Limited India - Mumbai INR 100,000 GVS SpA 99.98% Na
GVS Filtration Co., Ltd. Thailand - Bangkok THB 3,000,000 GVS SpA 100.00% Na

25
Note that as of the date of the condensed interim consolidated financial statements, all companies included in the consolidation area are consolidated using the full consolidation method.
In the six months ended 30 June 2021, the scope of consolidation changed from the previous year, following the establishment of GVS Patrimonio Immobiliare Srl and two commercial companies in India and Thailand respectively.
The table below lists the exchange rates used for conversion of the financial statements of companies operating in a currency other than the Euro for the periods indicated:
Currency At 30 June 2021 At 31 December 2020 Half Year closed at 30 June 2021 (average) 2020 (average)
Brazilian Real 5.9050 6.3735 6.4902 5.4269 Argentine Peso 113.6435 103.2494 110.0405 71.0544 Chinese Renminbi 7.6742 8.0225 7.7960 7.7543 American Dollar 1.1884 1.2271 1.2053 1.1037 Hong Kong Dollar 9.2293 9.5142 9.3551 8.5557 Japanese Yen 131.4300 126.4900 129.8681 119.2359 Korean Won 1,341.4100 1,336.0000 1,347.5387 1,330.0166 Russian Ruble 86.7725 91.4671 89.5502 76.6692 Turkish Lira 10.3210 9.1131 9.5226 7.1492 Mexican Peso 23.5784 24.4160 24.3270 23.8430 Romanian Ron 4.9280 4.8683 4.9016 4.8178 British Pound 0.8581 0.8990 0.8680 0.8633 Malaysian Ringgit 4.9336 4.9340 4.9387 N/A Indian Rupee 88.3240 N/A 88.4126 N/A Thai Baht 38.1180 N/A 37.1531 N/A
For the criteria used for the definition of subsidiaries and for the conversion of items in foreign currency, as well as for the recording of transactions with minority shareholders, please read the consolidated financial statements closing at 31 December 2020.
2.5 Accounting standards and assessment criteria
The accounting standards adopted for the condensed interim consolidated financial statements are the same as those used to prepare the consolidated financial statements closing at 31 December 2020, to which reference should be made for further details, with the exception of the following:
• accounting standards, or amendments to existing accounting standards, effective from 01 January2021 (see note 3 for more details), and
• income taxes, recognised on the basis of the best estimate of the weighted average tax rate expectedfor the entire year, in line with the provisions of IAS 34.
2.6 Seasonality
The market in which the Group operates is not characterised by marked seasonal phenomena that could lead to a certain lack of uniformity in sales and operating costs over the different months. Consequently, the economic results for the first half of the year could represent a proportional share of the entire financial year. Even from a financial point of view, the half-yearly figures should not be affected by seasonal factors.
26
3 Recently issued accounting standards
a) IFRS accounting standards, amendments and interpretations effective from 1 January 2021
The following IFRS accounting standards, amendments and interpretations were applied for the first time by the Group from 1 January 2021.
On 27 August 2020, in light of the interbank interest rate reform such as IBOR, the IASB published the document “Interest Rate Benchmark Reform-Phase 2” which contains amendments to the following standards:
• IFRS 9 Financial Instruments;• IAS 39 Financial Instruments: Recognition and Measurement;• IFRS 7 Financial Instruments: Disclosures;• IFRS 4 Insurance Contracts;• IFRS 16 Leases.
All amendments entered into force on 1 January 2021. The adoption of this amendment had no impact on the Group’s consolidated financial statements.
b) IFRS and IFRIC accounting standards, amendments and interpretations endorsed by the EuropeanUnion, not yet mandatorily applicable and not adopted early by the Group at 30 June 2021
On 14 May 2020, the IASB published the following amendments entitled: • Amendments to IFRS 3 Business Combinations: the purpose of the amendments is to update
the reference in IFRS 3 to the Conceptual Framework in the revised version, without thisresulting in any changes to the provisions of the standard.
• Amendments to IAS 16 Property, Plant and Equipment: the purpose of the amendments is notto allow the deduction from the cost of property, plant and equipment of the amount receivedfrom the sale of goods produced in the test phase of the asset. These sales revenues and relatedcosts will therefore be recognised on the income statement.
• Amendments to IAS 37 Provisions, Contingent Liabilities and Contingent Assets: theamendment clarifies that when estimating whether a contract is onerous, all costs directlyattributable to the contract shall be considered. Accordingly, the assessment of whether acontract is onerous includes not only incremental costs (such as the cost of the material used inthe processing), but also all costs that the enterprise cannot avoid because it has entered intothe contract (such as, for example, the depreciation of machinery used to perform the contract).
• Annual Improvements 2018-2020: amendments were made to IFRS 1 First-time Adoption ofInternational Financial Reporting Standards, IFRS 9 Financial Instruments, IAS 41 Agricultureand the Illustrative Examples of IFRS 16 Leases.
All amendments will enter into force on 1 January 2022. The directors do not expect that the adoption of these amendments will have any meaningful effect on the Group’s consolidated financial statements.
c) IFRS accounting standards, amendments and interpretations not yet endorsed by the EuropeanUnion
As of the reference date of this document, the competent European Union bodies have not yet concluded the approval process required for adoption of the amendments and standards described below.
• On 23 January 2020, the IASB published an amendment entitled ‘Amendments to IAS 1Presentation of Financial Statements: Classification of Liabilities as Current or Non-current’.The document aims to clarify how to classify debts and other short-term or long-term liabilities.The amendments enter into force on 1 January 2023; however, earlier application is permitted.The directors do not expect that the adoption of this amendment will have any meaningful effecton the Group’s consolidated financial statements.

27
• On 12 February 2021, the IASB published two amendments entitled ‘Disclosure of AccountingPolicies-Amendments to IAS 1 and IFRS Practice Statement 2’ and ‘Definition of AccountingEstimates-Amendments to IAS 8’. The amendments are intended to improve the disclosure ofaccounting policies so as to provide more useful information to investors and other primaryusers of financial statements and to help companies distinguish changes in accounting estimatesfrom changes in accounting policies. The amendments will apply from 1 January 2023, butearlier application is permitted. The directors are currently evaluating the possible effects of theintroduction of these amendments on the Group’s consolidated financial statements.
• On 7 May 2021, the IASB published an amendment entitled ‘Amendments to IAS 12 IncomeTaxes: Deferred Tax related to Assets and Liabilities arising from a Single Transaction”. Thedocument clarifies how deferred taxes should be accounted for on certain transactions that maygenerate assets and liabilities of equal amounts, such as leases and decommissioningobligations. The amendments will apply from 1 January 2023, but earlier application ispermitted. The directors do not expect that the adoption of this amendment will have anymeaningful effect on the Group’s consolidated financial statements.
4 Estimates and assumptions
Preparation of financial statements requires directors to apply accounting standards and methods which, in certain circumstances, are based on difficult and subjective measurements and estimates which are based on historical experience and on assumptions which may or may not be considered reasonable and realistic, depending on their circumstances.
Application of these estimates and assumptions influences the amounts appearing in the accounts in the financial statements, such as the statement of financial position, the income statement, the overall income statement, the financial report and the explanatory information supplied. The final results of items in the financial statements determined on the basis of estimates and assumptions may differ, in some cases significantly, from those appearing in financial statements which report the effects of the occurrence of the event estimated, due to the uncertainty characteristic of assumptions and the conditions on which estimates are based.
For a more detailed description of the valuation processes relevant to the Group, please read the corresponding section of the Consolidated Financial Statements for the year ended 31 December 2020.
5 Management of financial risk
In the area of business risk, the principal risks identified, monitored and, to the extent specified below, actively managed by the Group are as follows:
• market risk, deriving from oscillating exchange rates between the Euro and the other currenciesin which the Group operates, and of interest rates;
• credit risk, deriving from the possibility of counterparts defaulting;• liquidity risk, deriving from insufficiency of financial resources to fulfil financial
commitments.
The Group’s goal is to maintain balanced management of its financial exposure over the years in order to guarantee a debt structure that is balanced with the composition of the company’s assets and capable of guaranteeing the necessary flexibility in operations through use of liquidity generated by current operations and resort to bank loans.
The capacity of characteristic management to generate liquidity and the capacity for indebtedness allow the Group to adequately satisfy the requirements of its operations and financing of operative working capital and investment capital, and to fulfil its financial obligations.
28
The Group’s financial policy and management of financial risk are guided and monitored at the central level. In particular, the central finance function assesses and approves provisional financial requirements, monitors trends and applies appropriate corrective actions where necessary.
The following note supplies qualitative information on the impact of these risks on the Group.
5.1 Market risk
Exchange rate risk
Exposure to exchange rate risk is a result of the Group’s commercial activities conducted in currencies other than the Euro. Revenues and costs in foreign currency may be influenced by exchange rate fluctuation with an impact on sales margins (economic risk), just as trade payables and receivables in foreign currency may be affected by the exchange rate used, with an impact on economic results (transaction risk). Finally, fluctuating exchange rates also have an impact on consolidated profit or loss and on shareholders’ equity, because the financial statements of a number of Group companies are prepared in currencies other than the Euro and then converted (translation risk).
Revenues from contracts with customers are normally in Euro or Dollars, or indexed to the Euro. The Group does not adopt instruments to hedge exchange rate fluctuations. For exchange rate risk management purposes, the Group monitors that, at an aggregate level, the ratio between purchases of raw materials and revenues denominated in a single currency does not exceed 30%, since exceeding this ratio, determined at an aggregate level, would indicate the Group’s overexposure to the exchange rate risk associated with the individual currency.
Interest rate risk
The Group uses external financial resources in the form of debts and, where considered appropriate, invests available liquidity in money market instruments. Variations in interest rates influence the cost and yield of various forms of financing and investment, and therefore have an impact on the level of consolidated net financial charges. The Group is exposed to the risk of interest rate fluctuations, in view of the fact that some of its debts have variable interest rates. The Group’s policy aims to limit/eliminate the risk of interest rate fluctuation by subscribing contracts hedging the risk of interest rate variation.
5.2 Credit risk
The Group deals with exposure to the credit risk inherent in the possibility of insolvency (defaulting) and/or deterioration of the creditworthiness of its customers through instruments for assessing each individual counterpart through a dedicated organisational structure equipped with adequate tools for constant daily monitoring of customers’ behaviour and creditworthiness.
The Group is currently structured to implement a process of ongoing monitoring of credits, modulated with different degrees of reminders, varying on the basis of specific knowledge of the customer and of the number of days by which payment is delayed, in order to optimise working capital and minimise this form of risk.
5.3 Liquidity risk
Liquidity risk represents the possibility of the Group becoming incapable of obtaining the financial resources necessary to guarantee current operations and fulfilment of obligations falling due, or that these resources might be available only at a high cost.
In order to mitigate this risk, the Group: (i) periodically determines forecast financial requirements on the basis of the operative needs, in order to act promptly to obtain any additional resources that may be necessary, (ii) performs all actions required to obtain such resources, (iii) ensures adequate composition in terms of due dates, instruments and degree of availability.

29
The Group believes the lines of credit currently available, combined with the cash flows generated by current operations, to be sufficient to meet financial requirements for and repayment of loans on their due dates.
5.4 Capital management
The Group’s capital management aims to guarantee a solid credit rating and appropriate levels of capital indicators to support the Group’s investment plans and fulfil contractual commitments to financial backers. The Group has the capital necessary to finance its requirements for growth of its business lines and for its operations; sources of financing represent a balanced mix of risk capital and debt capital, in order to guarantee a balanced financial structure and minimise the total cost of capital, benefiting all stakeholders. Remuneration of risk capital is monitored on the basis of market trends and business performance, once all other obligations, such as service of the Group’s debt, have been fulfilled; in order to ensure adequate remuneration of capital, safeguarding of business continuity and growth of lines of business, the Group constantly monitors the evolution of its level of indebtedness in relation to shareholders’ equity, business trends, and forecast short, medium and long-term cash flows.
5.5 Categories of financial assets and liabilities and information on fair value
Categories of financial assets and liabilities The tables below break down financial assets and liabilities by category according to IFRS 9 at 31 December 2020 and 30 June 2021.
(in thousands of Euro)
Book value
At 30 June 2021 At 31 December 2020
FINANCIAL ASSETS:
Financial assets measured at amortised cost:
Non-current financial assets 1,057 964 Trade receivables 52,168 52,084 Other receivables and current assets 5,959 5,240 Current financial assets 71 509 Cash on hand 119,475 125,068 178,730 183,865
Financial assets measured at fair value entered in the income statement:
Non-current financial assets 15 4 Current financial assets 5,091 4,517
5,106 4,521
Non-current derivative financial instruments 21 -
TOTAL FINANCIAL ASSETS 183,857 188,386
30
Book value
At 30 June 2021 At 31 December 2020
FINANCIAL LIABILITIES: Financial liabilities measured at amortised cost:
Non-current financial liabilities 61,903 69,728 Non-current leasing liabilities 6,790 5,471 Current financial liabilities 22,322 19,673 Current leasing liabilities 3,476 3,495 Trade payables 24,202 25,585 Other current liabilities 15,976 17,285 134,669 141,237
Non-current derivative financial instruments 26 107
TOTAL FINANCIAL LIABILITIES 134,695 141,344
In view of the nature of short-term financial assets and liabilities, the book value of the majority of these items is considered to represent a reasonable approximation of fair value. Non-current financial assets and liabilities are regulated or measured at market rates, and their fair value is therefore considered to be substantially in line with their current book value.
Information on fair value
IFRS 13 requires the value of assets and liabilities measured at fair value in the company’s financial position to be classified on the basis of a hierarchy of levels reflecting the significance of the input used to determine fair value. The fair value of financial instruments is classified on the basis of the following hierarchic levels:
• Level 1: fair value determined with reference to listed prices (not adjusted) on active markets for identical financial instruments. In Level 1 the emphasis is therefore placed on determination of the following elements: (a) the principal market for the asset or liability, or, in the absence of a principal market, the most advantageous market for the asset or liability; (b) the possibility of the entity conducting a transaction in the asset or liability at the price in effect on that market as of the measurement date.
• Level 2: fair value determined with reference to assessment techniques referring to variables that may be observed on active markets. The input for this level includes: (a) prices listed for similar assets or liabilities in active markets; (b) prices listed for identical or similar assets or liabilities in inactive markets; (c) figures other than the listed prices that may be observed for the assets or liabilities, such as interest rates or yield curves which may be observed at commonly listed intervals, implicit volatility, credit spread, or input conformed by the market.
• Level 3: fair value determined on the basis of assessment techniques referring to market variables that cannot be observed.

31
The tables below list financial assets and liabilities measured at fair value, divided on the basis of their levels in the hierarchy at 31 December 2020 and 30 June 2021:
(in thousands of Euro) At 30 June 2021 Level 1 Level 2 Level 3
Non-current financial assets - - 15 Current financial assets - 5,091 - Non-current derivative financial instruments - 21 - Total assets measured at fair value - 5,112 15
(in thousands of Euro) At 30 June 2021 Level 1 Level 2 Level 3
Non-current derivative financial instruments - 26 - Total liabilities measured at fair value - 26 -
(in thousands of Euro) At 31 December 2020 Level 1 Level 2 Level 3
Non-current financial assets - - 4 Current financial assets - 4,517 - Total assets measured at fair value - 4,517 4
(in thousands of Euro) At 31 December 2020 Level 1 Level 2 Level 3
Non-current derivative financial instruments - 107 - Total liabilities measured at fair value - 107 -
There have been no transfers among different levels in the fair value hierarchy in the financial years under consideration here.
6 Information on operating segments
Information on operating segments has been prepared on the basis of IFRS 8 “Operating segments” (hereinafter “IFRS 8”), which requires the information to be presented consistently with the methods adopted by the directors in making operative decisions.
The Group bases its management on a matrix structure divided by product line, distribution channel and geographic area, an organisation which identifies a unified strategic vision of the business in a synthetic view. This structure is reflected in the way in which management monitors and strategically guides the Group’s activities. Top management reviews the Group’s economic performance as a whole, so individual operating segments may not be identified. The Group’s activity has therefore been represented as a single segment for the purposes of reporting under IFRS 8.
Details of revenues from contracts with customers by product line, distribution channel and geographic area appear in note 9.1.
7 Business combinations
There were no business combinations during the period under review.
32
8 Notes to the consolidated statement of assets and liabilities
8.1 Intangible assets
The table below reports the composition of, and movement in, intangible assets in the half year ending on 30 June 2021.
(in thousands of Euro) Development costs Goodwill Customer
relationship
Industrial patent rights and rights to
use intellectual property
Concessions, licenses,
trademarks, and similar
rights
Other fixed assets Assets in progress Total
Historical cost as of 31 December 2020 8,805 65,413 21,954 10,755 5,598 3,793 1,882 118,200
Investments 1,405 - - 25 32 9 739 2,210
Reclassification - - - - 1,311 - (1,668) (357)
Conversion reserves 342 1,914 715 272 98 - 53 3,394
Historical cost as of 30 June 2021 10,552 67,327 22,669 11,052 7,039 3,802 1,006 123,447
Provision for amortisation and depreciation as of 31 December 2020 (4,041) - (9,376) (5,004) (5,007) (3,793) - (27,221)
Amortisation and depreciation (813) - (1,396) (477) (164) (5) - (2,855)
Conversion reserves (160) - (324) (99) (72) - - (655)
Provision for amortisation and depreciation as of 30 June 2021 (5,014) - (11,096) (5,580) (5,243) (3,798) - (30,731)
Net book value as of 31 December 2020 4,764 65,413 12,578 5,751 591 - 1,882 90,979
Net book value as of 30 June 2021 5,538 67,327 11,573 5,472 1,796 4 1,006 92,716
Intangible assets with a defined useful lifespan
Customer relationship reflects the value of business relations measured following allocation of the consideration paid for the KUSS takeover.
Patent rights primarily reflect the value measured at the time of allocation of the consideration paid for the KUSS takeover, in addition to filing of new patent applications.
Concessions, licences and similar rights represent the purchase and customisation of industrial management and programming software.
Investment in intangible assets in the half year ending on 30 June 2021, amounting to Euro 2,210 thousand, was primarily attributable to the cost of development and fixed assets in progress and reflects amounts paid for development of new products and the corresponding production processes. Investment in fixed assets in progress also includes investment in software and applications supporting production processes.
At 30 June 2021, the Group had not found any indicators of impairment of intangible assets.
Intangible assets with an indefinite useful lifespan
Goodwill
At 30 June 2021 the value of goodwill, equal to Euro 67,327 thousand (Euro 65,413 thousand at 31 December 2020), mainly refers to the acquisition of the KUSS Group on 28 July 2017, as well as other previous business combinations. The change in the period is due to the exchange rate effect.
In accordance with the requirements of IAS 36, the Group verified the absence of impairment indicators at 30 June 2021 with reference to goodwill recognised in intangible assets. In particular, the Group has not found any indicators of impairment in view of: (i) economic and financial performance in line with budget forecasts; (ii) medium/long-term growth rates in line with those determined in previous

33
estimates; (iii) no interruptions or slowdowns in its operations that had a noteworthy impact on its economic or financial performance; (iv) investment forecasts unchanged, in terms of overall values, with respect to what was planned and (v) no changes in its business model.
It should also be noted that interest rates have not increased to such an extent that the discount rate used may be increased in such a way as to reduce the recoverable value of goodwill significantly.
At the reporting date of these condensed consolidated interim financial statements, based on the above, the Group’s management did not find any reasons that could change the results obtained with reference to the impairment test carried out at 31 December 2020.
The main assumptions used to determine the recoverable value, as well as the outcome of the impairment test carried out at 31 December 2020, are illustrated in the Consolidated Financial Statements for the year ended 31 December 2020, to which reference should be made.
8.2 Assets represented by usage rights and current and non-current leasing liabilities
The principal items of capital information regarding the Group’s leasing contracts, primarily as tenant, appear in the table below.
(in thousands of Euro) At 30 June 2021 At 31 December 2020
Net book value of assets represented by usage rights (real estate) 8,576 7,253 Net book value of assets represented by usage rights (automobiles) 1,039 1,095 Net book value of assets represented by usage rights (machinery) 175 90 Total net book value of assets represented by usage rights 9,791 8,438
Current leasing liabilities 3,476 3,495 Non-current leasing liabilities 6,790 5,471 Total leasing liabilities 10,265 8,966
The table below shows the principal economic and financial information on the Group’s leasing contracts.
(in thousands of Euro) Half Year closed at 30 June 2021 2020
Amortisation of assets represented by usage rights (real estate) 1,682 1,748 Amortisation of assets represented by usage rights (automobiles) 184 152 Amortisation of assets represented by usage rights (machinery) 34 31 Total amortisation of assets represented by usage rights 1,900 1,931
Interest payable on leases 123 125 Total outgoing cash flows due to leasing 1,921 2,152
Assets represented by usage rights relating to real estate, as at 30 June 2021, refer mainly to leasing: (i) two production sites in North America; (ii) two production sites in Italy; and (iii) one production site located in Mexico.
As of 30 June 2021, the Group had not identified any indicators of lasting impairment of assets corresponding to usage rights.
For information on the valuations made for the purposes of determining the discount rate, please read note 8.2 of the Consolidated Financial Statements for the year ended 31 December 2020.
34
8.3 Tangible assets
The table below shows the breakdown and movements of tangible assets in the years ending on 30 June 2021.
(in thousands of Euro) Land and buildings
Plants and machinery
Industrial and commercial equipment
Other assets Improvements on third party assets
Tangible assets in progress
and advances Total
Historical cost as of 31 December 2020 6,170 87,419 55,661 8,567 5,920 10,608 174,344
Investments 12 1,331 69 387 329 7,197 9,325
Disposal (1,960) (629) (23) (133) - (251) (2,996)
Reclassification 41 3,080 2,585 79 503 (5,931) 357
Conversion reserves 141 2,956 616 188 191 279 4,371
Historical cost as of 30 June 2021 4,404 94,157 58,908 9,088 6,943 11,902 185,401
Provision for amortisation and depreciation as of 31 December 2020 (2,075) (55,358) (38,102) (6,776) (3,108) - (105,419)
Amortisation and depreciation (72) (3,028) (1,868) (318) (265) - (5,551)
Disposal 1,061 201 8 109 - - 1,379
Conversion reserves (82) (1,950) (437) (150) (93) - (2,712)
Provision for amortisation and depreciation as of 30 June 2021 (1,168) (60,135) (40,399) (7,135) (3,466) - (112,303)
Net book value as of 31 December 2020 4,095 32,061 17,559 1,791 2,812 10,608 68,925
Net book value as of 30 June 2021 3,236 34,022 18,509 1,953 3,477 11,902 73,098
Tangible assets refer primarily to capital goods, such as plant, machinery, moulds and equipment used in the production process.
Capital expenditure on tangible assets for the half year ended 30 June 2021, amounting to € 9,325 thousand, mainly related to the expansion of production capacity for the Healthcare & Life Sciences division, as well as for the Health & Safety division for the expansion of the product range.
The net value of tangible assets disposed of during the six months ended 30 June 2021 mainly relates to the disposal by the subsidiary GVS Technology (Suzhou) Co. Ltd. of the ownership of its Suzhou production site to the Chinese Public Authority.
As of 30 June 2021, no indications of possible impairment of tangible assets arose.
As of 30 June 2021, there were no real estate assets or capital goods burdened by any kind of guarantee provided to a third party.
8.4 Advance tax assets and deferred tax liabilities
Advanced tax assets, amounting to Euro 4,501 thousand at 30 June 2021 (Euro 4,568 thousand at 31 December 2020), include the tax charge corresponding to temporary differences arising between pre-tax result and taxable profit in relation to deferred deductibility items. The allocation of advance tax assets was made by assessing the existence of the conditions for the recoverability of these assets in future on the basis of expected results.
Deferred tax liabilities at 30 June 2021 totalled Euro 3,926 thousand (Euro 3,167 thousand at 31 December 2020) and refer to temporary differences arising between the result for the period and taxable profit in relation to deferred deductibility items.

35
8.5 Financial assets (current and non-current)
The table below reports details of current and non-current financial assets as of 31 December 2020 and 30 June 2021.
(in thousands of Euro) At 30 June 2021 At 31 December 2020
Security deposits 1,057 964 Capital instruments 15 4 Non-current financial assets 1,072 968 Investment funds 5,091 4,517 Term deposits - 358 Current leasing assets 71 151 Current financial assets 5,162 5,026 Total financial assets 6,234 5,994
Security deposits, classified as financial assets measured at amortised cost: on the basis of IFRS 9, represent sums paid under existing leasing agreements.
Leasing assets refer to a sub-leasing contract assessed as a financial asset on the basis of the requirements of IFRS 16. The sub-lease, identified under a contract with a customer, regards a portion of a production site in North America.
Investment funds, classified as financial assets measured at fair value entered in the income statement on the basis of IFRS 9, represent excess liquidity invested in unlisted securities representing investment funds, primarily linked with the course of interbank interest rates on the Brazilian market.
8.6 Inventories
The table below reports details of inventories as of 31 December 2020 and 30 June 2021.
(in thousands of Euro) At 30 June 2021 At 31 December 2020
Finished products and goods 24,011 21,345 Raw materials, subsidiary materials and consumables 28,775 22,423 Products in progress and semi-products 5,475 4,802 Spare parts 1,848 1,799 Gross inventories 60,109 50,369 Provision for writedown of inventory (2,589) (3,004) Provision for write-downs of spare parts (1,369) (1,317) Inventories 56,151 46,048
Net uses to the provision for writedown of inventory amounted to Euro 415 thousand for the half year ended 30 June 2021.
36
8.7 Trade receivables
The table below reports details of trade receivables as of 31 December 2020 and 30 June 2021.
(in thousands of Euro) At 30 June 2021 At 31 December 2020
Trade receivables from customers 53,380 53,044 Trade receivables from related parties 16 - Trade receivables (gross) 53,396 53,044 Provision for writedown of trade receivables (1,228) (960) Trade receivables 52,168 52,084
The book value of trade receivables is considered to approximate their fair value. During the reporting period, there were no significant changes with respect to the balance of this item in the previous year.
The table below reports movements in the provision for writedown of trade receivables in the half year ending on 30 June 2021.
(in thousands of Euro) Provision for writedown of trade receivables
At 31 December 2020 960 Net provisions 248 Use 0 Conversion reserves 19 At 30 June 2021 1,228
Net provisions to the provision for writedown of receivables appear in the income statement under the item net writedowns of financial assets (see note 9.7).
8.8 Assets and liabilities deriving from contracts with customers
Assets from contracts with customers, equal to Euro 2,867 thousand at 30 June 2021 (Euro 1,753 thousand at 31 December 2020), primarily represented the right to obtain a consideration for goods transferred to customers in relation to the production of moulds and equipment, primarily for the Energy & Mobility division.
Liabilities from contracts with customers, worth Euro 5,547 thousand at 30 June 2021 (Euro 4,894 thousand at 31 December 2020) represent advances received from customers for contractual obligations not yet met.
Assets and liabilities from contracts with customers are shown net in the statement of assets and liabilities if they refer to the same contractual obligation to the same customer. The table below shows the gross amount of assets and liabilities from contracts with customers, and how they are compensated, as of 31 December 2020 and 30 June 2021.
(in thousands of Euro) At 30 June 2021 At 31 December 2020
Gross assets from contracts with customers 4,482 3,231 Compensation with liabilities from contracts with customers (1,615) (1,478) Assets from contracts with customers 2,867 1,753
Gross liabilities from contracts with customers 7,162 6,372 Compensation with assets from contracts with customers (1,615) (1,478) Liabilities from contracts with customers 5,547 4,894

37
8.9 Current tax receivables and payables
Current tax receivables at 30 June 2021 amounted to Euro 2,962 thousand (Euro 202 thousand at 31 December 2020).
Current tax payables at 30 June 2021 amounted to Euro 5,892 thousand (Euro 14,485 thousand at 31 December 2020).
The changes in the net balances of the assets and liabilities in question for the six months ended 30 June 2021 mainly concern the allocation of current income taxes of Euro 13,263 thousand and payments of Euro 24,746 thousand respectively.
8.10 Other receivables and current assets
The table below reports details of other receivables and current assets as of 31 December 2020 and 30 June 2021.
(in thousands of Euro) At 30 June 2021 At 31 December 2020
Advances and instalments 2,553 2,378 Tax receivables 5,489 4,687 Prepaid expenses 2,196 681 Receivables from government agencies 639 - Receivable from employees 209 62 Other receivables 261 491 Other receivables and current assets 11,347 8,299
The increase in other current assets at 30 June 2021 compared to 31 December 2020 is mainly due to the increase in tax receivables, mainly due to VAT receivables, and prepaid expenses, with particular reference to the prepayment of insurance costs. At 30 June 2021, a receivable from the Chinese public authority was recorded for the portion not yet collected of the consideration relating to the sale of the Suzhou production site.
8.11 Cash on hand
The table below reports details of cash on hand as of 31 December 2020 and 30 June 2021.
(in thousands of Euro) At 30 June 2021 At 31 December 2020
Bank and postal accounts 119,446 125,034 Cash and cash equivalents on hand 29 34 Cash on hand and cash equivalents 119,475 125,068
As of 30 June 2021, cash on hand was not subject to any restrictions or limitations.
The financial report shows variations in cash on hand during the periods under examination.
38
8.12 Shareholders’ equity
The table below reports details of shareholders’ equity as of 31 December 2020 and 30 June 2021.
(in thousands of Euro) At 30 June 2021 At 31 December 2020
Share capital 1,750 1,750 Share premium reserve 92,770 92,770 Legal reserve 350 329 Extraordinary reserve 35,022 30,485 Translation reserve (7,412) (11,636) Actuarial profits and losses reserve (187) (187) Profit (loss) carried over and other reserves 103,141 51,093 Net income 48,154 78,063 Shareholders’ equity attributable to non-controlling interests 33 30 Total shareholders’ equity 273,622 242,697
The statement of variations in consolidated shareholders’ equity appears in the note on this topic.
Movements in shareholders’ equity for the half year ended 30 June 2021 related to the recording of (a) the comprehensive net profit for the period of €52,376 thousand, (b) the shareholders’ resolution to distribute dividends of €22,750 thousand (c) the increase in reserves following the long-term incentive plan of €1,298 thousand.
Share capital
As of 30 June 2021, the Company’s fully subscribed and paid-in share capital amounted to Euro 1,750 thousand, and are divided into 175,000,000 ordinary shares without any face value.
Translation reserve The translation reserve includes all differences resulting from translation into Euro of the financial statements of subsidiaries included in the consolidation perimeter expressed in foreign currency. Actuarial profits and losses reserve The actuarial profits and losses reserve includes profits and losses deriving from changes to the actuarial hypotheses in relation to defined benefit plans. Cash flow hedge reserve At 30 June 2021, this item amounted to a negative €5 thousand and was related to interest rate hedging contracts entered into to specifically hedge variable rate loan agreements. Reserve from first adoption of EU-IFRS The reserve for first adoption of EU-IFRS, included among other reserves, has a negative balance of Euro 1,532 thousand, and represents the effects of conversion from Italian accounting standards to EU-IFRS standards.

39
8.13 Financial liabilities (current and non-current)
The table below reports details of current and non-current financial liabilities as of 31 December 2020 and 30 June 2021.
(in thousands of Euro) At 30 June 2021 At 31 December 2020
Current portion
Non-current portion
Current portion
Non-current portion
2014 Bond Loan 4,174 8,350 4,035 12,145 2017 Bond Loan 7,980 23,940 7,967 23,935
Total bonded loans 12,154 32,290 12,002 36,080
Mediobanca loan (2020) 4,436 15,529 2,213 17,712 Unicredit loan (2020) 3,978 13,997 3,954 15,936 Accrued payables 840 - 937 - Total financial payables to banks 9,254 29,526 7,103 33,649
Loan under special terms Horizon tender (GVS Sud) - 87 - - Payable to shareholders for dividends 348 - - - Loans under special terms Invitalia 502 - 502 - Education Ministry (MIUR) loan under special terms (GVS SpA) 65 - 65 - Total other financial payables 915 87 567 -
Total financial liabilities 22,322 61,903 19,673 69,728
It should be noted that during the half year ended 30 June 2021 no new loans were taken out, with the exception of the subsidised loan linked to the Horizon call for tenders made to GVS Sud, for a total amount of Euro 87 thousand; the loan will be repaid starting from the 2024 financial year and has a charge of 0.16% on an annual basis.
As of 30 June 2021, resolved dividends amounting to €348 thousand had not been paid, due to the choice of some shareholders.
For a description of the main items making up the Group’s financial liabilities as at 30 June 2021, please read the relevant notes to the consolidated financial statements as at 31 December 2020.
As at 30 June 2021, the financial parameters (Covenants) of an equity, economic and financial nature set out in the various contracts, calculated on the data resulting from these Financial Statements, were complied with.
The table below reports, for the half year under examination, variations in financial liabilities resulting from cash flows generated and/or absorbed by financing, and deriving from non-monetary elements, as required by IAS 7.
(in thousands of Euro) At 01
January 2021
Opening Reclassification Repayment
Variation in accrued
payables on interest
Amortised cost
(Profits) losses on
exchanges
At 30 June 2021
Non-current financial liabilities 69,728 435 (2,700) (6,264) - - 704 61,903
Current financial liabilities 19,673 - 2,700 (97) 46 22,322
Total financial liabilities 89,401 435 - (6,264) (97) 46 704 84,225
40
8.14 Net financial indebtedness and net financial position
The following table shows the net financial indebtedness prepared in accordance with the format required by CONSOB communication No. DEM/6064293 of 28 July 2006, updated with the provisions of ESMA guideline 32-382-1138 of 4 March 2021 as implemented by CONSOB warning No. 5/21 of 29 April 2021.
(in thousands of Euro) At 30 June 2021 At 31 December 2020 (A) Cash on hand 119,475 125,068 (B) Cash equivalents - -
Term deposits - 358 Shares held for trading 5,091 4,517 Financial receivables due to leasing 71 151
(C) Other current financial assets 5,162 5,026 (D) Liquidity (A)+(B)+(C) 124,637 130,093
Financial payables to other companies in the GVS Group due to leasing 980 965 Financial payables for leasing 2,496 2,530 Other financial payables 915 567
(E) Current financial indebtedness 4,391 4,063 (F) Current portion of non-current indebtedness 21,407 19,106 (G) Current financial indebtedness (E)+(F) 25,798 23,168
(H) Net current financial indebtedness (D)-(G) 98,839 106,925
Non-current bank debts 29,526 33,649 Non-current bonded loans 32,290 36,079 Other financial payables 87 - Financial payables to other companies in the GVS Group due to leasing 1,682 2,146 Non-current financial payables for leasing 5,108 3,325
(I) Non-current financial indebtedness 68,693 75,199 Passive derivative financial instruments 26 107
(J) Debt instruments 26 107 (K) Trade payables and other non-current payables - - (L) Non-current financial indebtedness (I)+(J)+(K) 68,719 75,306
(M) Total net financial indebtedness (H)-(L) 30,120 31,619
On the basis of the above considerations, the above scheme may be subject to changes in light of further clarifications of interpretation by the regulators.
For further details on the composition of the items in the table, see Note 8.11 and Note 8.13.
The Group’s net financial position (excluding non-current active derivatives and net current and non-current leasing liabilities, measured in accordance with the provisions of IFRS 16 and equal to a total of Euro 10,194 thousand at 30 June 2021 and Euro 8,815 thousand at 31 December 2020 respectively), amounted to positive Euro 40,335 thousand and positive Euro 40,435 thousand as of these dates.
(in thousands of Euro) At 30 June 2021 At 31 December 2020 (M) Total net financial indebtedness 30,120 31,619
Non-current active derivative financial instruments 21 - Financial payables for leasing (net) 10,194 8,815 Total net financial position 40,335 40,435

41
8.15 Provisions for risks and charges
The table below shows the movements of provisions for risks and charges in the half year ending on 30 June 2021. (in thousands of Euro) Provisions for risks and charges
Balance as of 31 December 2020 1,000
Allocation 1,441
Use -
Conversion reserves 22 Balance as of 30 June 2021 2,463
In 2018 the Parent Company underwent a verification by the Italian tax authorities (Agenzia delle Entrate) for the 2015 fiscal year, as a result of which a formal report of verification was issued. During December 2020, the Company settled the refutations relating to the same report of verification by means of verification with acceptance procedure. Some of the refutations made by the Revenue Agency in the report of verification could be repeated in relation to transactions carried out by the Company in subsequent tax periods and consequently, supported by its consultants, the Company has prudently made a provision of € 1,000 thousand in the previous year.
During the period, the sum of €1,441 thousand was allocated to the provision for the relocation of production sites in China and England for €519 thousand and €922 thousand, respectively, to cover the costs and incidental expenses that the Group will incur to transfer production to the new facilities.
8.16 Non-current derivative financial instruments
Non-current active and passive financial derivative instruments amount to € 21 thousand and € 26 thousand respectively. The balance of this item is entirely the result of the fair value of two IRS (Interest rate Swaps) derivative contracts hedging the risk of changes in interest rates of contracts entered into with Unicredit and Mediobanca during 2020. Derivative financial instruments, having a nominal value equal to the nominal value of the hedged items, guarantee a fixed interest rate for the entire duration of the loan entered into with Mediobanca and Unicredit.
In accordance with the provisions of IFRS 9, the derivatives contracts were designated as a financial instrument hedging interest rates. Consequently, changes in the fair value of derivatives are accounted for in a separate equity reserve.
8.17 Trade payables
The table below reports details of trade payables as of 31 December 2020 and 30 June 2021.
(in thousands of Euro) At 30 June 2021 At 31 December 2020
Trade payables to suppliers 24,202 25,585 Trade payables to related parties - - Trade payables 24,202 25,585
Trade payables primarily regard transactions for the purchase of raw materials, components and services. The decrease in payables is closely linked to the decrease in raw material purchases and investments made in the last months of the period compared to the last months of the previous year.
The book value of trade payables is considered to approximate their fair value.
42
8.18 Other current payables and liabilities
The table below reports details of other payables and current liabilities as of 31 December 2020 and 30 June 2021.
(in thousands of Euro) At 30 June 2021 At 31 December 2020
Payable to employees 10,107 10,811 Payable to social security institutions 2,479 2,594 Tax payables 2,561 2,398 Accrued payables 45 58 Deferred income 588 214 Payable to directors 721 1,360 Other 108 122 Other current payables and liabilities 16,609 17,557
Payables to employees primarily reflect salaries payable and deferred charges such as holidays, leave and bonuses. Payables to social security institutions primarily represent payment of contributions owned to pension and social security institutions. Tax payables as of 30 June 2021 primarily include tax payables for taxes not correlated to income, consisting primarily of VAT and other indirect taxes payable and withholding tax on employees’ pay.
9 Notes to the consolidated income statement
9.1 Revenue from customer contracts
The table below breaks down revenues from contracts with customers by division in the half years ending on 30 June 2020 and 30 June 2021.
(in thousands of Euro) Half Year closed at 30 June 2021 2020
Healthcare Liquid 48,988 34,829 Healthcare Air & Gas 25,973 22,805 Laboratory 19,106 10,351 Healthcare & Life Sciences 94,067 67,984 Powertrain & Drivetrain 15,549 13,473 Safety & Electronics 12,001 8,780 Sport & Utility 11,460 8,649 Energy & Mobility 39,011 30,902 Personal Safety 53,528 44,241 Air Safety 3,115 3,205 Health & Safety 56,643 47,446 Revenue from customer contracts 189,721 146,333
The increase in revenues for the half year ended 30 June 2021 compared to the half year of the previous year is mainly attributable to the performance of the Healthcare & Life Sciences division, due to the resumption of a sustained growth trend in the Laboratory business and the Healthcare Liquid business, which, in addition to absorbing the effects of the acquisitions realised in 2020, recorded a recovery in the activities that had suffered most from the contractions related to the effects of the pandemic.
The table below breaks down revenues from contracts with customers by type of sale in the half years ending on 30 June 2020 and 30 June 2021.
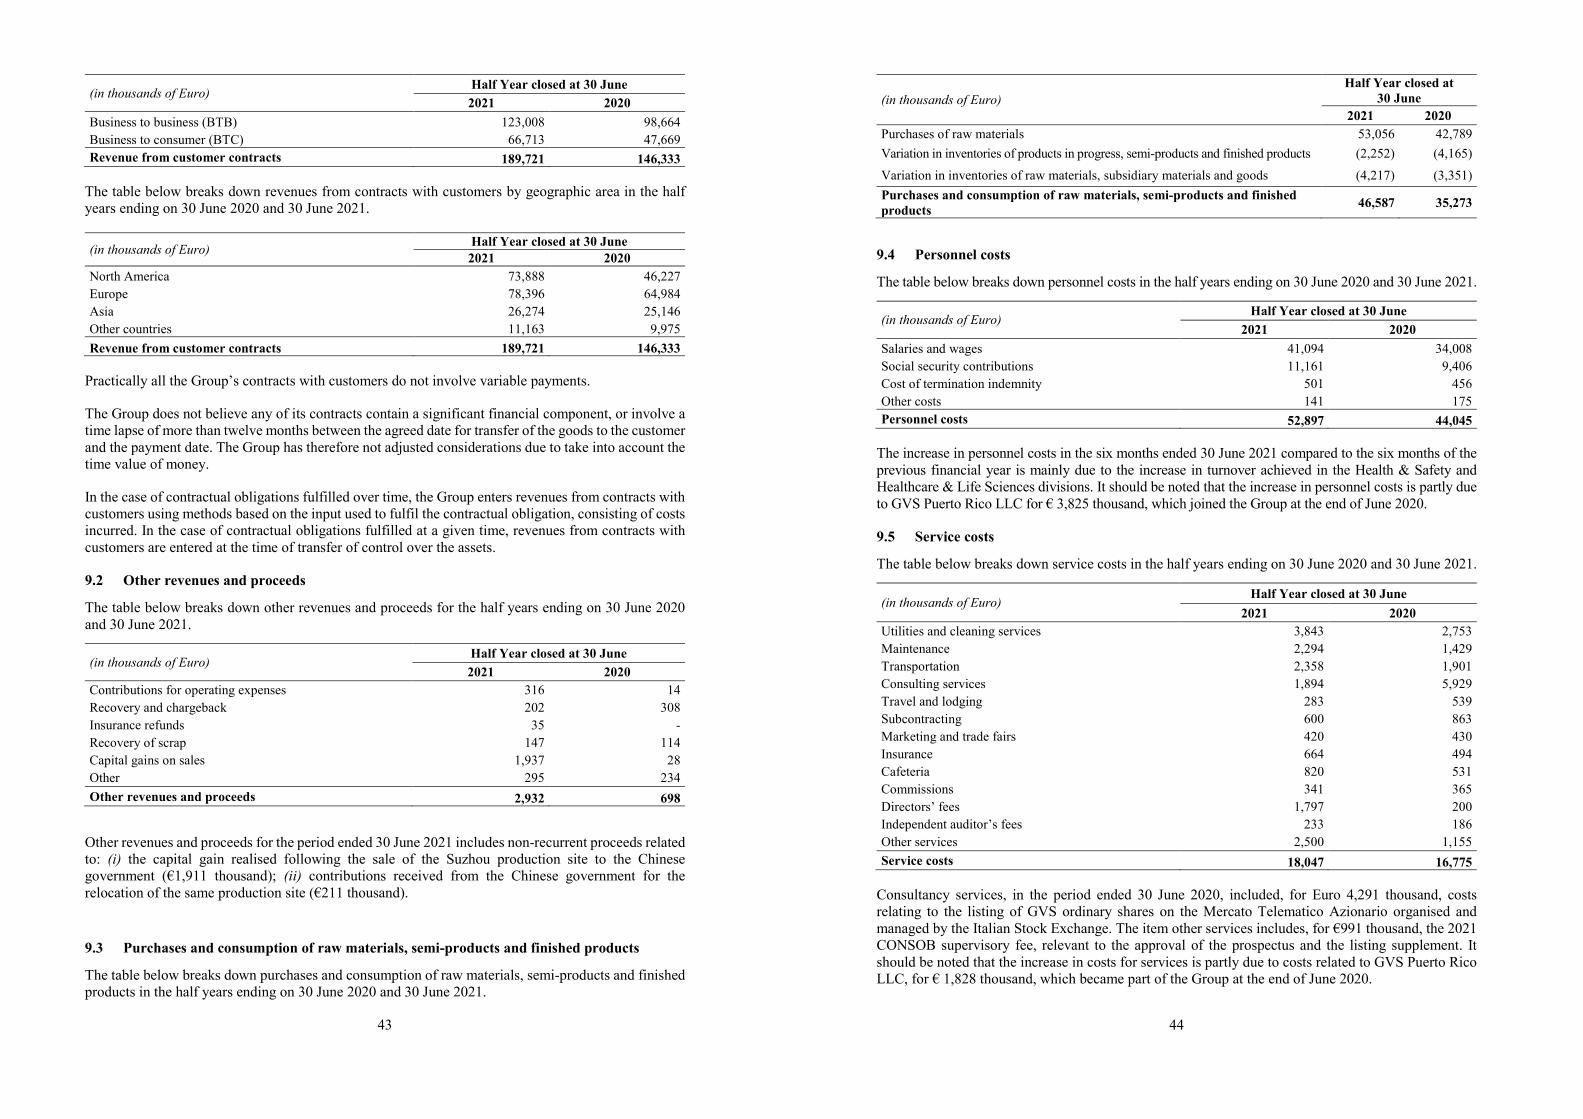
43
(in thousands of Euro) Half Year closed at 30 June 2021 2020
Business to business (BTB) 123,008 98,664 Business to consumer (BTC) 66,713 47,669 Revenue from customer contracts 189,721 146,333
The table below breaks down revenues from contracts with customers by geographic area in the half years ending on 30 June 2020 and 30 June 2021.
(in thousands of Euro) Half Year closed at 30 June 2021 2020
North America 73,888 46,227 Europe 78,396 64,984 Asia 26,274 25,146 Other countries 11,163 9,975 Revenue from customer contracts 189,721 146,333
Practically all the Group’s contracts with customers do not involve variable payments.
The Group does not believe any of its contracts contain a significant financial component, or involve a time lapse of more than twelve months between the agreed date for transfer of the goods to the customer and the payment date. The Group has therefore not adjusted considerations due to take into account the time value of money.
In the case of contractual obligations fulfilled over time, the Group enters revenues from contracts with customers using methods based on the input used to fulfil the contractual obligation, consisting of costs incurred. In the case of contractual obligations fulfilled at a given time, revenues from contracts with customers are entered at the time of transfer of control over the assets.
9.2 Other revenues and proceeds
The table below breaks down other revenues and proceeds for the half years ending on 30 June 2020 and 30 June 2021.
(in thousands of Euro) Half Year closed at 30 June 2021 2020
Contributions for operating expenses 316 14 Recovery and chargeback 202 308 Insurance refunds 35 - Recovery of scrap 147 114 Capital gains on sales 1,937 28 Other 295 234 Other revenues and proceeds 2,932 698
Other revenues and proceeds for the period ended 30 June 2021 includes non-recurrent proceeds related to: (i) the capital gain realised following the sale of the Suzhou production site to the Chinese government (€1,911 thousand); (ii) contributions received from the Chinese government for the relocation of the same production site (€211 thousand).
9.3 Purchases and consumption of raw materials, semi-products and finished products
The table below breaks down purchases and consumption of raw materials, semi-products and finished products in the half years ending on 30 June 2020 and 30 June 2021.
44
(in thousands of Euro) Half Year closed at
30 June 2021 2020
Purchases of raw materials 53,056 42,789 Variation in inventories of products in progress, semi-products and finished products (2,252) (4,165) Variation in inventories of raw materials, subsidiary materials and goods (4,217) (3,351) Purchases and consumption of raw materials, semi-products and finished products 46,587 35,273
9.4 Personnel costs
The table below breaks down personnel costs in the half years ending on 30 June 2020 and 30 June 2021.
(in thousands of Euro) Half Year closed at 30 June
2021 2020 Salaries and wages 41,094 34,008 Social security contributions 11,161 9,406 Cost of termination indemnity 501 456 Other costs 141 175 Personnel costs 52,897 44,045
The increase in personnel costs in the six months ended 30 June 2021 compared to the six months of the previous financial year is mainly due to the increase in turnover achieved in the Health & Safety and Healthcare & Life Sciences divisions. It should be noted that the increase in personnel costs is partly due to GVS Puerto Rico LLC for € 3,825 thousand, which joined the Group at the end of June 2020.
9.5 Service costs
The table below breaks down service costs in the half years ending on 30 June 2020 and 30 June 2021.
(in thousands of Euro) Half Year closed at 30 June
2021 2020 Utilities and cleaning services 3,843 2,753 Maintenance 2,294 1,429 Transportation 2,358 1,901 Consulting services 1,894 5,929 Travel and lodging 283 539 Subcontracting 600 863 Marketing and trade fairs 420 430 Insurance 664 494 Cafeteria 820 531 Commissions 341 365 Directors’ fees 1,797 200 Independent auditor’s fees 233 186 Other services 2,500 1,155 Service costs 18,047 16,775
Consultancy services, in the period ended 30 June 2020, included, for Euro 4,291 thousand, costs relating to the listing of GVS ordinary shares on the Mercato Telematico Azionario organised and managed by the Italian Stock Exchange. The item other services includes, for €991 thousand, the 2021 CONSOB supervisory fee, relevant to the approval of the prospectus and the listing supplement. It should be noted that the increase in costs for services is partly due to costs related to GVS Puerto Rico LLC, for € 1,828 thousand, which became part of the Group at the end of June 2020.

45
9.6 Other operating costs
The table below breaks down other operating costs in the half years ending on 30 June 2020 and 30 June 2021.
(in thousands of Euro) Half Year closed at 30 June 2021 2020
Leasing costs 900 514 Indirect taxation 477 392 Membership fees and charity contributions 187 79 Allocation to provision for risks 1,441 - Other minor costs 558 295 Other operating costs 3,563 1,280
The item other operating expenses, for the period ended 30 June 2021, included non-recurrent charges related to costs allocated to the provision for the relocation of the Chinese production site and the English production site for a total amount of €1,441 thousand.
Leasing costs include: (i) leasing fees for properties of modest value, for which the Group avails itself of the exemption permitted under IFRS 16, (ii) variable components of a number of leasing fees and (iii) costs connected with use of property under leasing agreements not subject to IFRS 16.
9.7 Net writedowns of financial assets
Net writedowns of financial assets, entered on the basis of the requirements of IFRS 9, totalled Euro 248 thousand and Euro 122 thousand in the half years ending on 30 June 2021 and 2020, respectively, and represent writedown of trade receivables.
A breakdown of movements in the provision for writedown of receivables for the half year ending on 30 June 2021 appears in note 8.7 - “Trade receivables”.
9.8 Amortisation, depreciation and writedowns
The table below breaks down amortisation, depreciation and writedowns in the half years ending on 30 June 2020 and 30 June 2021.
(in thousands of Euro) Half Year closed at 30 June 2021 2020
Amortisation and writedowns of intangible assets 2,855 2,929 Depreciation and writedowns of tangible assets 5,551 4,180 Amortisation and writedowns of assets represented by usage rights 1,900 1,931 Amortisation, depreciation and writedowns 10,306 9,040
A breakdown of the composition of, and movements in, intangible assets and tangible assets for the half year ending on 30 June 2021 is provided in notes 8.1 and 8.3. Information on assets represented by usage rights appears in note 8.2.
9.9 Financial proceeds and charges
The table below breaks down financial proceeds in the years ending on 30 June 2020 and 2021.
(in thousands of Euro) Half Year closed at 30 June 2021 2020
Net profits on exchanges 2,541 - Other financial proceeds 79 75 Financial proceeds 2,620 75
46
The table below breaks down financial charges in the half years ending on 30 June 2020 and 30 June 2021.
(in thousands of Euro) Half Year closed at 30 June 2021 2020
Interest on bonded loans 849 1,100 Interest on loans 143 615 Net losses on exchanges - 2,663Interest on leasing liabilities 123 125Amortised cost 46 122 Other financial charges 20 29 Financial charges 1,181 4,654
Financial income and charges include in the half year ended 30 June 2020 net losses on exchanges and in the half year ended 30 June 2021 net profits on exchanges mainly related to unrealised losses and profits deriving from the adjustment in Euro of the dollar-denominated bonded loan and the intercompany loan granted in dollars by GVS to the subsidiary GVS NA Holdings Inc.
9.10 Annual income tax
The table below breaks down annual income tax in the half years ending on 30 June 2020 and 30 June 2021.
(in thousands of Euro) Half Year closed at 30 June 2021 2020
Current taxes 13,263 9,158 Deferred taxes 796 (154) Taxes pertaining to previous financial years 227 (95) Income tax 14,286 8,909
Income taxes, in accordance with the provisions of IAS 34, are recognised on the basis of management’s estimate of the weighted average expected annual effective tax rate for the entire year, equal to 22.9% for the half year ended 30 June 2021 (24.8% for the half year ended 30 June 2020).
9.11 Net profit per share
The table below reports net profit per share, calculated as the ratio between net profit and the weighted average number of ordinary shares in circulation in the period, excluding treasury shares.
Half Year closed at 30 June 2021 2020
Group’s share of net profit (in thousands of Euro) 48,154 27,002 Weighted average number of shares in circulation 175,000,000 100,029,540 Profit per share (in Euro) 0.28 0.27
Diluted earnings per share at 30 June 2021 was positive at 0.27 calculated by dividing the result attributable to the shareholders of GVS SpA by the weighted average number of shares in circulation, adjusted to take into account the effects of all potential ordinary shares with dilutive effect. As potential ordinary shares with dilutive effect, those linked to the performance shares plan have been considered.
Diluted net profit per share at 30 June 2020 was equal to net profit per share, as there are no financial instruments with potential diluting effects.

47
10 Non-recurring revenues and operating costs
It should also be noted that, in compliance with the provisions of the CONSOB Resolution 15519 of 27 July 2006 and CONSOB Communication No. DEM/6064293 of 28 July 2006, the consolidated income statement has been presented as an annex with separate indication of the amounts of costs and revenues deriving from non-recurring operations.
Non-recurrent proceeds and charges in the period ending on 30 June 2021 represent: (i) the capital gain realised following the sale of the Suzhou production site to the Chinese government (€1,911 thousand); (ii) contributions obtained from the Chinese government for the relocation of the same production site(€211 thousand); (iii) one-off CONSOB supervisory costs paid in relation to the IPO procedure (€991thousand); (iv) costs allocated to the above-mentioned fund for the relocation of the Chinese productionsite, and the production site in England (coming to €1,441 thousand) and (v) amortisation of intangibleand tangible assets recorded following the purchase price allocation of the Kuss group (€1,817thousand), net of the related tax effect.
Non-recurrent proceeds and charges in the period ending on 30 June 2020 represent: (i) amortisation of intangible assets recorded following the purchase price allocation of the Kuss group (Euro 1,984 thousand), (ii) consultancy costs and one-off bonuses paid to personnel in relation to the IPO procedure concluded on 19 June 2020 (Euro 5,019 thousand), (iii) consultancy costs for purchase of the shareholding in Puerto Rico (Euro 259 thousand) and (iv) personnel reorganisation costs (Euro 176 thousand), net of the related tax effect.
11 Hyperinflation
On the basis of the provisions of EU-IFRS regarding the entry and exit criteria for inflation accounting, the Argentinian subsidiary GVS Argentina S.A. adopted inflation accounting beginning in the year ending on 31 December 2018; it is the only Group company to operate in a situation of high inflation. The price index used for the purpose is the national consumer price index (IPC) published by Argentina’s National Statistics and Census Institute (INDEC). Also, in consideration of the immateriality of the subsidiary’s contribution compared to the Group’s balances, the effects on the income statement for the half year ended 30 June 2021 were not significant.
12 Transactions with related parties
Transactions with related parties identified on the basis of the criteria set forth in IAS 24 are primarily of a commercial and financial nature, and are conducted under regular market conditions.
The tables below provide details of economic and capital relations with related parties. The companies indicated have been identified as related parties because they are directly or indirectly linked to the Group’s reference shareholders.
It should also be noted that, in compliance with the provisions of the CONSOB Resolution 15519 of 27 July 2006 and CONSOB Communication no. DEM/6064293 of 28 July 2006, the consolidated income statement, the consolidated balance sheet and the consolidated statement of cash flows are attached, with separate indication of transactions with related parties and an indication of their percentage weight on individual balances.
The table below sums up the Group’s payables and receivables in relation to related parties at 31 December 2020 and 30 June 2021.
48
(in thousands of Euro)
Parent company
Companies subject to parent company’s control Top
management Total
Total item in the
financial statement
Impact on the
financial statement GVS Group GVS Real
Estate GVS Real Estate US
GVS Real Estate UK
Tangible assets
At 30 June 2021 - - - - 25 25 73,098 0.0%
At 31 December 2020 - - - - - - 68,925 0.0%
Assets represented by usage rights
At 30 June 2021 - 2,100 427 - - 2,527 9,791 25.8%
At 31 December 2020 - 2,412 541 - - 2,953 8,438 35.0%
Trade receivables
At 30 June 2021 5 5 - 6 - 16 52,168 0.0%
At 31 December 2020 - - - - - 52,084 0.0%
Current tax receivables
At 30 June 2021 1,885 - - - - 1,885 2,962 63.6%
At 31 December 2020 - - - - - - 202 0.0%
Non-current leasing liabilities
At 30 June 2021 - 1,522 240 - - 1,762 6,790 25.9%
At 31 December 2020 - 1,839 307 - - 2,146 5,471 39.2%
Provisions for employee benefits
At 30 June 2021 - - - - 1,641 1,641 4,553 36.0%
At 31 December 2020 - - - - 1,617 1,617 4,499 35.9%
Current leasing liabilities
At 30 June 2021 - 631 267 - - 898 3,476 25.8%
At 31 December 2020 - 627 338 - - 965 3,495 27.6%
Current tax payables
At 30 June 2021 - - - - - - 5,892 0.0%
At 31 December 2020 5,041 - - - - 5,041 14,485 34.8%
Other current payables and liabilities
At 30 June 2021 - - - - 1,483 1,483 16,609 8.9%
At 31 December 2020 - - - - 2,885 2,885 17,557 16.3%
The table below lists the Group’s economic relations with related parties for the half years ending on 30 June 2020 and 30 June 2021.
(in thousands of Euro)
Parent company
Companies subject to parent company’s control
Top Management Total
Total item in the
financial statement
Impact on the
financial statement GVS
Group GVS Real
Estate GVS Real Estate US
GVS Real Estate UK
Other revenues and proceeds
Half year ended 30 June 2021 5 5 5 5 - 20 2,932 0.7%
Half year ended 30 June 2020 - - - - - - 698 0.0%
Personnel costs
Half year ended 30 June 2021 - - - - 1,796 1,796 52,897 3.4%
Half year ended 30 June 2020 - - - - 1,468 1,468 44,045 3.3%
Service costs
Half year ended 30 June 2021 - - - - 1,797 1,797 18,047 10.0%
Half year ended 30 June 2020 - - - - 200 200 16,775 1.2% Amortisation, depreciation and writedowns
Half year ended 30 June 2021 - 312 157 - - 469 10,306 4.5%
Half year ended 30 June 2020 - 312 167 - - 479 9,040 5.3%
Financial charges
Half year ended 30 June 2021 - 13 5 - - 17 1,181 1.5%
Half year ended 30 June 2020 - 16 8 - - 24 4,654 0.5%

49
Transactions with the GVS Group
The Company and its Italian subsidiary GVS Sud S.r.l. participate in the optional national tax consolidation system under GVS Group.Current tax receivables at 30 June 2021 and payables at 31 December 2020 refer exclusively to this case. The trade receivable from GVS Group refers to the fact that GVS SpA manages the bookkeeping of GVS Group Srl.
Transactions with GVS Real Estate
On 5 March 2018 GVS stipulated a leasing agreement with GVS Real Estate, expiring on 28 January 2024, for two production facilities, one of which includes the Company’s registered offices in Zola Predosa (BO). On the basis of this lease contract, at 30 June 2021, the Group recorded assets represented by usage rights and relative leasing liabilities for Euro 1,028 thousand and Euro 1,052 thousand respectively (Euro 1,221 thousand and Euro 1,246 thousand at 31 December 2020), as well as depreciation and financial charges, for the half year ended 30 June 2021, for Euro 193 thousand and Euro 7 thousand respectively.
On 11 December 2019, the Group company GVS Sud S.r.l. signed an agreement with GVS Real Estate for the sale of land and buildings pertaining to a production facility in Italy (Avellino). The parties subsequently signed a lease agreement under which GVS Real Estate leased the property sold back to the Group. The leasing agreement for the land and buildings sold involved entry, as of 30 June 2021, of assets represented by usage rights and leasing liabilities of Euro 1,072 thousand and Euro 1,101 thousand respectively (Euro 1,191 thousand and Euro 1,221 thousand, respectively at 31 December 2020), and of amortisation, depreciation and writedowns and financial charges for the half year ending on 30 June 2021 of Euro 119 thousand and Euro 6 thousand respectively.
Transactions with GVS Real Estate US
On 3 September 2019, the Group company GVS Filtration Inc signed two sales agreements with GVS Real Estate US Inc for sale of land and buildings pertaining to two production facilities in Ohio and Wisconsin. At the same time as the sale, the parties signed two lease agreements under which GVS Real Estate US leased the properties sold back to the Group. The leasing agreements for the real estate properties sold as described above resulted in entry as of 30 June 2021 of assets represented by usage rights amounting to Euro 427 thousand and Euro 507 thousand respectively (Euro 506 thousand and the corresponding leasing liabilities amounting to Euro 609 thousand at 31 December 2020), as well as amortisation, depreciation and writedowns and financial charges in the half year ending on 30 June 2021 amounting to Euro 157 thousand and Euro 4 thousand respectively.
Transactions with GVS Real Estate UK
GVS Real Estate UK Limited does not currently have any active lease agreements with companies in the GVS Group. The company’s bookkeeping is looked after by the subsidiary of GVS SpA operating in the United Kingdom; the costs for this service are periodically re-invoiced.
Transactions with Top Management
As of the date of this Statement the following persons are considered members of the Group’s Top Management: • the chief executive officer;
• the chief financial officer;
• the chief operation officer;
50
• the managers of the (i) Healthcare & Life Sciences; (ii) Health & Safety; (iii) Energy & Mobilityand (iv) Science & Development divisions.
• the chairman of the board of directors and the other members of the board of directors
The table below provides details of fees payable to members of Top Management in the half years ending on 30 June 2020 and 30 June 2021.
(in thousands of Euro) Half Year closed at 30 June
2021 2020 Fees for office held 589 541 Bonuses and other incentives 1,120 795 Other fees 86 132 Directors’ fees 1,797 200 Total 3,593 1,668
Other related parties
Please note that:
• other current payables and liabilities as of 30 June 2021 include payables to directors for fees notyet paid totalling Euro 721 thousand (Euro 1,360 thousand at 31 December 2020);
• provisions for employee benefits as of 30 June 2021 include the value of end of service indemnityfor directors totalling Euro 1,641 thousand (Euro 1,617 thousand at 31 December 2020);
• costs for services for the half year ended 30 June 2021 include directors’ fees, expenses tied to theperformance share plan and allocations to the provisions for end of service indemnity for a totalamount of Euro 1,797 thousand (Euro 200 thousand for the half year ended 30 June 2020).
Allocation of end of service indemnity to a number of directors was resolved by the Company’s shareholders’ meeting on 15 January 2015, with reference to the 2015-2017 three-year period, and renewed by the shareholders’ meeting on 23 May 2018 for the 2018-2020 three-year period. It should be noted that with effect from the date of commencement of trading of GVS’s ordinary shares on the Mercato Telematico Azionario organised and managed by the Italian Stock Exchange, on 17 April 2020, the Board of Directors of GVS ordered the termination of the provisions for termination indemnity relating to one of the directors who ceased to be an executive director from the negotiation start date.
13 Commitments and risks
Sureties and guarantees granted to third parties
At 30 June 2021, the Group had sureties and guarantees in place for a total amount of Euro 100 thousand.
Potential liabilities
Given that the Group operates internationally, it is exposed to legal risks primarily due to professional, corporate and tax liability. Disbursements relating to ongoing or future proceedings cannot be expected with certainty and it is possible that court outcomes may result in costs not covered or not fully covered by insurance claims having effects on the Group’s financial situation and results. On the other hand, where it is likely to be due to an outlay of resources to meet obligations and this amount can be reliably estimated, the Group made specific allocations to the provision for risks and charges.
Current tax receivables at 30 June 2021 and payables at 31 December 2020 refer exclusively to this case.
Current tax receivables at 30 June 2021 and payables at 31 December 2020 refer exclusively to this case.

51
14 Directors’ and auditors’ fees
Emoluments for the 2021 half-year in question due to directors (including bonuses, charges related to the performance shares plan, provisions for severance indemnity and related contributions) and statutory auditors amounted to €1,797 thousand and €48 thousand, respectively.
The following table gives details of the remuneration for executive directors and non-executive directors for the first half of 2021.
(in thousands of Euro) 2021
Chairman of the Board of Directors 130 Executive Directors 1,592 Non-executive directors 75 Total cost 1,797
No loans or advances were granted to directors or shareholders during the period under examination.
15 Independent auditor’s fees
The fees due to the independent auditors for the half year ended 30 June 2021 amounted to Euro 162 thousand, of which Euro 148 thousand for auditing services and Euro 14 thousand for services other than auditing.
16 Research and development
The Group’s R&D work aims to introduce new products and implement new production processes. These activities are divided into a number of different phases, from conception and start of the process of designing and new product process to large-scale industrial production.
The table below reports research and development costs entered among operating costs in the half years ending on 30 June 2020 and 30 June 2021.
(in thousands of Euro) Half Year closed at 30 June
2021 2020 Research and development costs 10,073 9,053 Capitalised development costs (1,812) (1,168) Amortisation of capitalised development costs 813 684 Research and development costs entered as operating costs 9,074 8,569
17 Positions or transactions resulting from atypical and/or unusual transactions
Pursuant to the CONSOB communication no. 6064293 of 28 July 2006, it should be noted that during the first half of 2021 there were no atypical and/or unusual transactions with respect to the normal management of the company that could give rise to doubts regarding the correctness and completeness of the information in the financial statements, conflicts of interest, the safeguarding of the company’s assets, or the protection of minority shareholders.
52
18 Events of significance following the close of the financial period
On 28 July 2021, the Board of Directors resolved to sell the shareholding in GVS Patrimonio immobiliare Srl, held by GVS Microfiltration to GVS Real Estate Srl. This transaction will be financed by GVS Real Estate Srl, which will pay the sale price and provide GVS Patrimonio Immobiliare with the amount necessary to extinguish its current debt position with GVS S.p.A.
On 31 August 2021, the GVS Group acquired 100% of the share capital of the RPB Group, which specialises in the design and manufacture of respiratory protection, including compressed air respirators and powered air-purifying respirators. In particular, GVS NA Holding Inc. (100% owned by GVS S.p.A.) acquired 100% of the share capital of the American companies Goodman Brands LLC and Abretec Group LLC, while GVS S.p.A. acquired 100% of the share capital of RPB Safety Limited (a New Zealand company). The purchase price was set at a maximum of USD 194.4 million. The transaction provides for an upfront payment of approximately $150 million for the acquisition of 100% of the share capital, and a possible earn-out of $44.4 million (maximum value), the payment of which, expected in 2022, will be proportionally related to the achievement of the RPB group’s 2021 Adjusted EBITDA targets. In order to finance the transaction, GVS signed a 5-year loan agreement for 150 million Euro with a pool of lending banks: Mediobanca - Banca di Credito Finanziario S.p.A., which also acts as agent, Unicredit S.p.A. and Crédit Agricole Italia S.p.A. (“Financing”). GVS S.p.A. then made available to GVS NA Holding Inc. the funds for the two American companies through an intra-group loan at market conditions.
19 Approval of the condensed interim consolidated financial statements and authorisation for publication
The condensed interim consolidated financial statements ending on 30 June 2021 were approved on 10 September 2021 by the Board of Directors, which authorised their publication within the legal deadline.

53
ATTACHED TABLES
Consolidated statement of financial position, with indication of the amounts of positions with related parties.
(in thousands of Euro) At 30 June 2021
of which with
related parties
percen-tage
At 31 Decem-ber 2020
of which with
related parties
percentage
ASSETS
Non-current assets
Intangible assets 92,716 90,979
Assets represented by usage rights 9,791 2,527 25.8% 8,438 2,953 35.0% Tangible assets 73,098 25 0.0% 68,925
Advance tax assets 4,501 4,568
Non-current financial assets 1,072 968
Non-current derivative financial instruments 21 -
Total non-current assets 181,199 173,878 Current assets
Inventories 56,151 46,048
Trade receivables 52,168 16 0.0% 52,084
Assets from contracts with customers 2,867 1,753
Current tax receivables 2,962 1,885 63.7% 202
Other receivables and current assets 11,347 8,299
Current financial assets 5,162 5,026
Cash on hand 119,475 125,068
Total current assets 250,132 238,480 TOTAL ASSETS 431,331 412,358 SHAREHOLDERS’ EQUITY AND LIABILITIES
Share capital 1,750 1,750
Reserves 223,685 162,854
Net income 48,154 78,063
Group net shareholders’ equity 273,589 242,667 Shareholders’ equity attributable to non-controlling interests 33 30
Total shareholders’ equity 273,622 242,697 Non-current liabilities
Non-current financial liabilities 61,903 69,728
Non-current leasing liabilities 6,790 1,762 25.9% 5,471 2,146 39.2% Deferred tax liabilities 3,926 3,167
Provisions for employee benefits 4,553 1,641 36.0% 4,499 1,617 35.9% Provisions for risks and charges 2,463 1,000
Non-current derivative financial instruments 26 107
Total non-current liabilities 79,661 83,972 Current liabilities
Current financial liabilities 22,322 19,673
Current leasing liabilities 3,476 898 25.8% 3,495 965 27.6% Trade payables 24,202 25,585 Liabilities from contracts with customers 5,547 4,894 Current tax payables 5,892 14,485 5,041 34.8% Other current payables and liabilities 16,609 1,483 8.9% 17,557 2,855 16.3% Total current liabilities 78,048 85,689 TOTAL LIABILITIES AND SHAREHOLDERS’ EQUITY
431,331 412,358
54
Consolidated income statement, with indication of the amounts of positions with related parties.
(in thousands of Euro)
Half Year closed at 30 June
2021
of which with
related parties
percen-tage 2020
of which with
related parties
percen-tage
Revenue from customer contracts 189,721 146,333
Other revenues and proceeds 2,932 20 0.7% 698
Total revenues 192,653 147,031 Purchases and consumption of raw materials, semi-products and finished products (46,587) (35,273)
Personnel costs (52,897) (1,796) 3.4% (44,045) (1,468) 3.3% Service costs (18,047) (1,797) 10.0% (16,775) (200) 1.2% Other operating costs (3,563) (1,280)
EBITDA 71,559 49,658 Net writedowns of financial assets (248) (122)
Amortisation, depreciation and writedowns (10,306) (469) 4.5% (9,040) (479) 5.3% EBIT 61,005 40,495 Financial proceeds 2,620 75
Financial charges (1,181) (17) 1.5% (4,654) (24) 0.5% Pre-tax result 62,444 35,916 Income tax (14,286) (8,909)
Net income 48,158 27,008 Group’s share 48,154 27,002
Minority share 4 5

55
Conto economico consolidato, con indicazione degli ammontari delle posizioni con parti correlate.
(In migliaia di Euro)
Semestre chiuso al 30 giugno
2021
di cui con
parti correlate
incidenza % 2020
di cui con
parti correlate
incidenza %
Ricavi da contratti con i clienti 189.721 146.333Altri ricavi e proventi 2.932 20 0,7% 698Ricavi totali 192.653 147.031Acquisti e consumi di materie prime, semilavorati e prodotti finiti (46.587) (35.273)Costi per il personale (52.897) (1.796) 3,4% (44.045) (1.468) 3,3%Costi per servizi (18.047) (1.797) 10,0% (16.775) (200) 1,2%Altri costi operativi (3.563) (1.280)Margine operativo lordo (EBITDA) 71.559 49.658Svalutazioni nette di attività finanziarie (248) (122)Ammortamenti e svalutazioni (10.306) (469) 4,5% (9.040) (479) 5,3%Risultato operativo (EBIT) 61.005 40.495Proventi finanziari 2.620 75Oneri finanziari (1.181) (17) 1,5% (4.654) (24) 0,5%Risultato prima delle imposte 62.444 35.916Imposte sul reddito (14.286) (8.909)Risultato netto 48.158 27.008di cui Gruppo 48.154 27.002di cui Terzi 4 5
56
Consolidated income statement, with indication of the amounts deriving from non-recurring transactions.
(in thousands of Euro)
Half Year closed at 30 June
2021 of which
non-recurring
2021 from
ordinary operations
percentage 2020 of which
non-recurring
2020 from
ordinary operations
percentage
Revenue from customer contracts 189,721 189,721 146,333 146,333
Other revenues and proceeds 2,932 2,122 810 698 698
Total revenues 192,653 2,122 190,531 147,031 - 147,031Purchases and consumption of raw materials, semi-products and finished products
(46,587) (46,587) (35,273) (35,273)
Personnel costs (52,897) (52,897) 0.0% (44,045) (972) (43,073) 2.2%
Service costs (18,047) (991) (17,056) 5.5% (16,775) (4,482) (12,293) 26.7%
Other operating costs (3,563) (1,441) (2,122) (1,280) - (1,280)
EBITDA 71,559 (310) 71,869 49,658 (5,454) 55,112
Net writedowns of financial assets (248) (248) (122) (122)
Amortisation, depreciation and writedowns (10,306) (1,817) (8,489) 17.6% (9,040) (1,984) (7,056) 21.9%
EBIT 61,005 (2,127) 63,132 40,495 (7,438) 47,933
Financial proceeds 2,620 2,620 75 75
Financial charges (1,181) (1,181) (4,654) (4,654)
Pre-tax result 62,444 (2,127) 64,571 35,916 (7,438) 43,354
Income tax (14,286) 274 (14,560) -1.9% (8,909) 1,690 (10,599) -19.0%
Net income 48,158 (1,852) 50,010 27,008 (5,748) 32,756


REVIEW REPORT ON CONSOLIDATED CONDENSED INTERIM FINANCIAL STATEMENTS
To the Shareholders of GVS SpA
Foreword
We have reviewed the accompanying consolidated condensed interim financial statements of GVS SpA (hereinafter, also the “Company” and together with its subsidiaries the “GVS Group”) as of 30 June 2021 which comprise the consolidated statement of financial position, the consolidated income statement, the consolidated statement of comprehensive income, the consolidated statement of changes in equity, the consolidated statement of cash flows and the related explanatory notes. The Directors of the Company are responsible for the preparation of the consolidated condensed interim financial statements in accordance with International Accounting Standard 34 applicable to interim financial reporting (IAS 34) as adopted by the European Union. Our responsibility is to express a conclusion on these consolidated condensed interim financial statements based on our review.
Scope of review
We conducted our work in accordance with the criteria for a review recommended by Consob in Resolution No. 10867 of 31 July 1997. A review of consolidated condensed interim financial statements consists of making enquiries, primarily of persons responsible for financial and accounting matters, and applying analytical and other review procedures. A review is substantially less in scope than a full-scope audit conducted in accordance with International Standards on Auditing (ISA Italia) and, consequently, does not enable us to obtain assurance that we would become aware of all significant matters that might be identified in an audit. Accordingly, we do not express an audit opinion on the consolidated condensed interim financial statements.
2 of 2
Conclusion
Based on our review, nothing has come to our attention that causes us to believe that the consolidated condensed interim financial statements of GVS Group as of 30 June 2021 are not prepared, in all material respects, in accordance with International Accounting Standard 34 applicable to interim financial reporting (IAS 34) as adopted by the European Union.
Bologna, 13 September 2021
PricewaterhouseCoopers SpA
Signed by Giuseppe Ermocida (Partner)
This report has been translated into English from the Italian original solely for the convenience of international readers

www .gvs. com