Embed Size (px)
Citation preview

Half Year Report2012JPMorgan Indian
Investment Trust plcHalf Year Report & Accounts for the six months ended 31st March 2012

Features
Contents
About the Company
1 Half Year Performance2 Chairman’s Statement3 Investment Managers’ Report
Investment Review
5 List of Investments6 Group Portfolio Analysis
Accounts
7 Group Income Statement8 Group Statement of Changes in Equity9 Group Balance Sheet10 Group Cash Flow Statement11 Notes to the Group Accounts
Shareholder Information
13 Interim Management Report14 Details of Subscription Shares15 Glossary of Terms and Definitions17 Information about the Company
Objective
Capital growth from investments in India.
Investment Policies
- To invest in a diversified portfolio of equity and equity-related securities of Indiancompanies.
- To invest also in companies which earn a material part of their revenues from India. - The Company will not invest in the other countries of the Indian sub-continent nor inSri Lanka.
- To invest no more than 15% of gross assets in other listed investment companies(including investment trusts).
- To use gearing when appropriate to increase potential returns to shareholders; theCompany’s gearing policy is to use short-term gearing for tactical purposes, up to amaximum level of 15% of shareholders’ funds.
Benchmark
MSCI India Index expressed in sterling terms.
Risk
Investors should note that there can be significant economic and political risksinherent in investing in a single emerging economy such as India. As such, the Indianmarket can exhibit more volatility than developed markets and this should be takeninto consideration when evaluating the suitability of the Company as a potentialinvestment.
Capital Structure
At 31st March 2012, the Company’s issued share capital comprised 119,857,221Ordinary shares of 25p each, including 3,991,788 shares held in Treasury, and6,156,322 Subscription shares of 1p each.
Continuation Vote
The Company’s Articles of Association require that, at the Annual General Meeting tobe held in 2014 and at every fifth year thereafter, the Directors will propose aresolution that the Company continues as an investment trust.
Management Company
The Company employs JPMorgan Asset Management (UK) Limited (‘JPMAM’ or ‘theManager’) to manage its assets.
JPMorgan Indian Investment Trust plc. Half Year Report & Accounts 2012 1
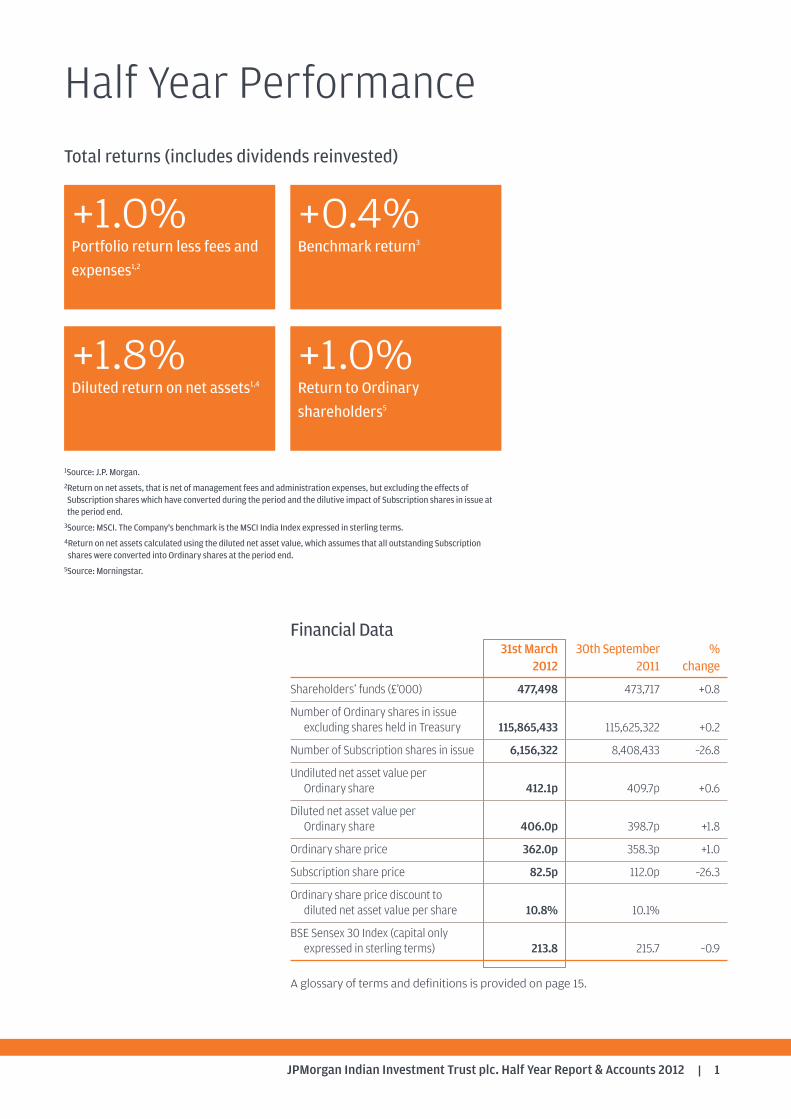
Half Year PerformanceTotal returns (includes dividends reinvested)
+1.0%Portfolio return less fees and
expenses1,2
+0.4%Benchmark return3
Financial Data31stMarch 30th September %
2012 2011 change
Shareholders’ funds (£’000) 477,498 473,717 +0.8
Number of Ordinary shares in issue excluding shares held in Treasury 115,865,433 115,625,322 +0.2
Number of Subscription shares in issue 6,156,322 8,408,433 –26.8
Undilutednet asset valueperOrdinary share 412.1p 409.7p +0.6
Diluted net asset value per Ordinary share 406.0p 398.7p +1.8
Ordinary share price 362.0p 358.3p +1.0
Subscription share price 82.5p 112.0p –26.3
Ordinary share price discount to diluted net asset value per share 10.8% 10.1%
BSE Sensex 30 Index (capital only expressed in sterling terms) 213.8 215.7 –0.9
A glossary of terms and definitions is provided on page 15.
+1.0%Return to Ordinary
shareholders5
+1.8%Diluted return on net assets1,4
1Source: J.P. Morgan.2Return on net assets, that is net of management fees and administration expenses, but excluding the effects ofSubscription shares which have converted during the period and the dilutive impact of Subscription shares in issue atthe period end.3Source: MSCI. The Company's benchmark is the MSCI India Index expressed in sterling terms.4Return on net assets calculated using the diluted net asset value, which assumes that all outstanding Subscriptionshares were converted into Ordinary shares at the period end.
5Source: Morningstar.

JPMorgan Indian Investment Trust plc. Half Year Report & Accounts 20122
Chairman’s Statement
Performance
The returns for the six months to 31st March 2012 belie the volatile nature of themarkets over the period. Your Company saw an increase in diluted net assets of 1.8%,outperforming the return of the Company’s benchmark, the MSCI India Index(in sterling terms), which rose by 0.4%. On an undiluted basis, the Company returned0.6%. The Company’s share price total return was 1.0%, reflecting the widening of thediscount from 10.1% to 10.8%. The background against which the Companyperformed is discussed in more detail in the Investment Managers’ Report onpages 3 and 4.
Gearing
The Company is finalising a one year floating rate US$25 million loan facility with RBSto provide the investment managers with the flexibility to gear the portfolio shouldcircumstances permit. As at the date of this report, the Company is ungeared.
Discount Management
The Board has guidelines in place with regard to the management of any discount/premium that may develop between the Company’s share price and its net assetvalue per share. The Company currently holds 4,394,788 Ordinary shares in treasuryand, under current guidelines, these may only be reissued at a premium to theprevailing net asset value at the time of reissue.
India/Mauritius Double Tax Treaty
The Indian government is in the process of introducing new tax legislation, includingGeneral Anti-Avoidance Rules, which could impose additional costs or obligations onthe activities of the Company’s Mauritian subsidiary and have adverse consequencesif the Mauritian subsidiary ceased to qualify for the benefits under the India/MauritiusDouble Tax Treaty. The Board and its advisors are monitoring developments closely.
Share Capital
In November 2008, the Company issued 21,001,937 Subscription shares toshareholders on the basis of one Subscription share for every five Ordinary sharespreviously held. Each Subscription share confers the right (but not the obligation)to subscribe for one Ordinary share on any business day during the period from2nd January 2009 to 2nd January 2014, after which the rights under the Subscriptionshares will lapse.
As at the date of this statement, 14,864,680 of the original 21,001,937 Subscriptionshares (70.8%) have been converted, raising proceeds in excess of £35.4 million.
Further details of the Subscription shares, including the subscription periods andtheir respective prices and the bonus cost for the calculation of taxation, can be foundon page 14 and on the Company’s website at www.jpmindian.co.uk.
Outlook
Our Managers remain positive as to the prospects for Indian equities over the mediumto long term, however over the short term, returns are expected to remain volatile.
Hugh BollandChairman 24th May 2012

JPMorgan Indian Investment Trust plc. Half Year Report & Accounts 2012 3
Investment Managers’ Report
Market Review
The first half of the Company’s financial year was a remarkable period, with the finalquarter of 2011 witnessing a ‘risk off’ led sell off and the first quarter of 2012 staging adramatic turnaround with a ‘risk on’ led rally in risk assets. The MSCI India Index rosearound 9% during the review but the fall in the Rupee detracted most of those gains.These extreme macro led moves were evident in portfolio flows, with foreigninstitutions investing a record US$9 billion during January to March 2012 after sellingUS$360 million during October to December 2011.
However, throughout this period, news flow out of India continued to be singularlymiserable. The central government continued to be paralysed by a seemingly endlessstream of corruption scandals that severely affected legislative activity for the betterpart of 2011. Besides, the dismal show of the Congress Party in the crucial stateelections, where they were decisively marginalised in three out of the five (especiallyin Uttar Pradesh), has significantly worsened the political stalemate. The possibility ofpolicy momentum picking up after the state elections, which encouraged the rally inJanuary and February, now appears remote. In fact, the change in the politicalequation was evident in the equivocation over the railway budget in which theminister (belonging to the TMC, which is a coalition partner) was fired by his ownparty chief for raising passenger tariffs. He was replaced by another representative ofthe same party who promptly rolled back most of the increases. The Union budgetwas also a disappointment. In fact, certain proposals with regard to the taxability offoreign investments spooked the market and though the Finance Minister tried toallay the concerns of portfolio investors, confusion reigned supreme.
On the positive side, the Reserve Bank of India eased monetary policy for the firsttime in 18 months by cutting policy rates by 0.5% in April and the cash reserveratio (CRR) twice in January and in March by a cumulative 1.25%. However, thecommentary continued to be hawkish, implying that further loosening was unlikelyin the very short term. This was mainly due to worrying signs of inflation risingin early 2012 after easing materially in late 2011. Meanwhile, growth momentum inthe economy continued to decelerate with GDP for the fourth quarter of 2011 growingbelow expectations at 6.1% with Gross Fixed Capital Formation (GFCF) decliningyear-on-year for a second straight quarter. Year-on-year trade data deterioratedsignificantly in March, with exports showing a decline for the first time in over twoyears while imports rose 24%, leading to a jump of over 300% in the trade deficit.The resulting deterioration in the balance of payments further added to the concernson the Rupee.
Earnings for the review period were a mixed bag, with a few high profiledisappointments (notably Infosys) and hardly any positive surprises. However, thethin silver lining is that earnings forecasts have stabilised, after being steadily cutthrough 2011.
Rajendra Nair
Rukhshad Shroff
JPMorgan Indian Investment Trust plc. Half Year Report & Accounts 20124
Performance Review
The Company outperformed the benchmark in the fourth quarter of 2011 as thequality bias embedded in the portfolio contributed to relative performance. The sameattribute hurt performance in the first quarter of 2012 as low quality high beta stocksoutperformed. However, for the review period as a whole the Company modestlyoutperformed the benchmark.
Outlook and Fund Strategy
The near term outlook remains extremely fluid and depends almost entirely ondomestic and global macro factors. The move to defer the implementation of someof the controversial tax proposals should help sentiment and spur a relief rally in thecurrency and equity markets. However, much more would be required by way ofpolicy action to sustain any such rally, which looks extremely unlikely in the uncertainpolitical climate in India.
Rukhshad ShroffRaj NairInvestment Managers 24th May 2012
Investment Managers’ Reportcontinued
JPMorgan Indian Investment Trust plc. Half Year Report & Accounts 2012 5
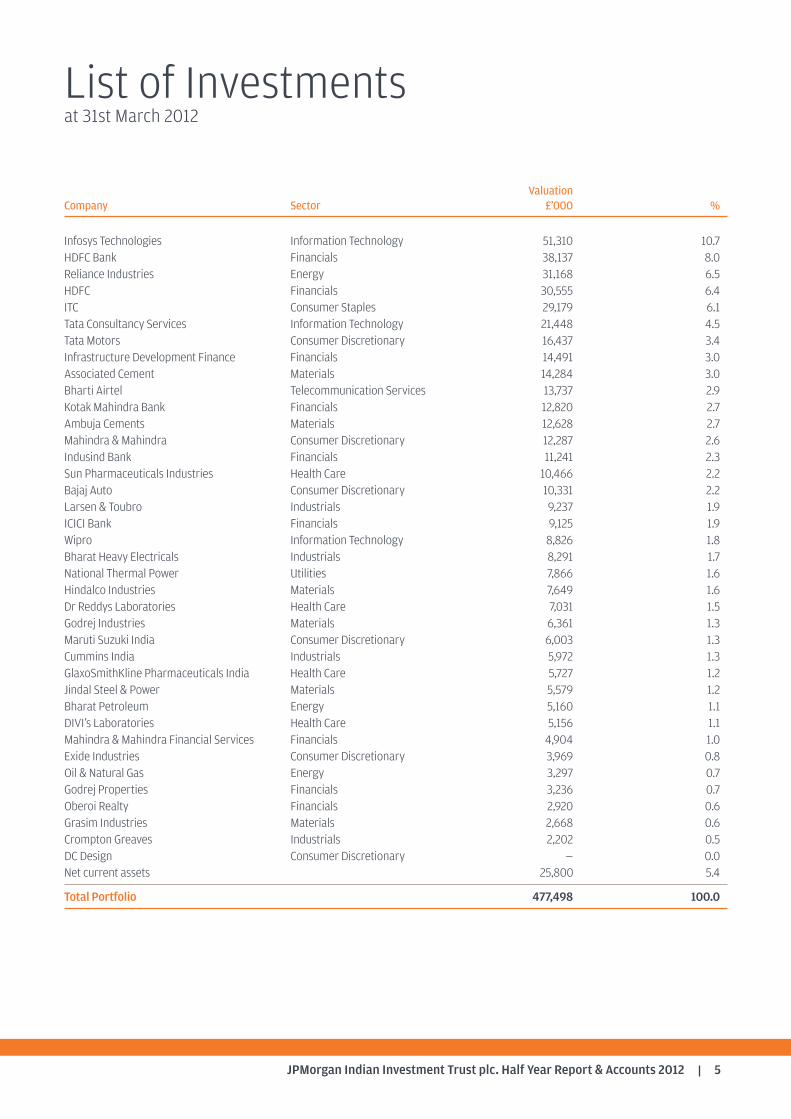
List of Investmentsat 31st March 2012
ValuationCompany Sector £’000 %
Infosys Technologies Information Technology 51,310 10.7HDFC Bank Financials 38,137 8.0Reliance Industries Energy 31,168 6.5HDFC Financials 30,555 6.4ITC Consumer Staples 29,179 6.1Tata Consultancy Services Information Technology 21,448 4.5Tata Motors Consumer Discretionary 16,437 3.4Infrastructure Development Finance Financials 14,491 3.0Associated Cement Materials 14,284 3.0Bharti Airtel Telecommunication Services 13,737 2.9Kotak Mahindra Bank Financials 12,820 2.7Ambuja Cements Materials 12,628 2.7Mahindra & Mahindra Consumer Discretionary 12,287 2.6Indusind Bank Financials 11,241 2.3Sun Pharmaceuticals Industries Health Care 10,466 2.2Bajaj Auto Consumer Discretionary 10,331 2.2Larsen & Toubro Industrials 9,237 1.9ICICI Bank Financials 9,125 1.9Wipro Information Technology 8,826 1.8Bharat Heavy Electricals Industrials 8,291 1.7National Thermal Power Utilities 7,866 1.6Hindalco Industries Materials 7,649 1.6Dr Reddys Laboratories Health Care 7,031 1.5Godrej Industries Materials 6,361 1.3Maruti Suzuki India Consumer Discretionary 6,003 1.3Cummins India Industrials 5,972 1.3GlaxoSmithKline Pharmaceuticals India Health Care 5,727 1.2Jindal Steel & Power Materials 5,579 1.2Bharat Petroleum Energy 5,160 1.1DIVI’s Laboratories Health Care 5,156 1.1Mahindra & Mahindra Financial Services Financials 4,904 1.0Exide Industries Consumer Discretionary 3,969 0.8Oil & Natural Gas Energy 3,297 0.7Godrej Properties Financials 3,236 0.7Oberoi Realty Financials 2,920 0.6Grasim Industries Materials 2,668 0.6Crompton Greaves Industrials 2,202 0.5DC Design Consumer Discretionary — 0.0Net current assets 25,800 5.4
Total Portfolio 477,498 100.0
JPMorgan Indian Investment Trust plc. Half Year Report & Accounts 20126
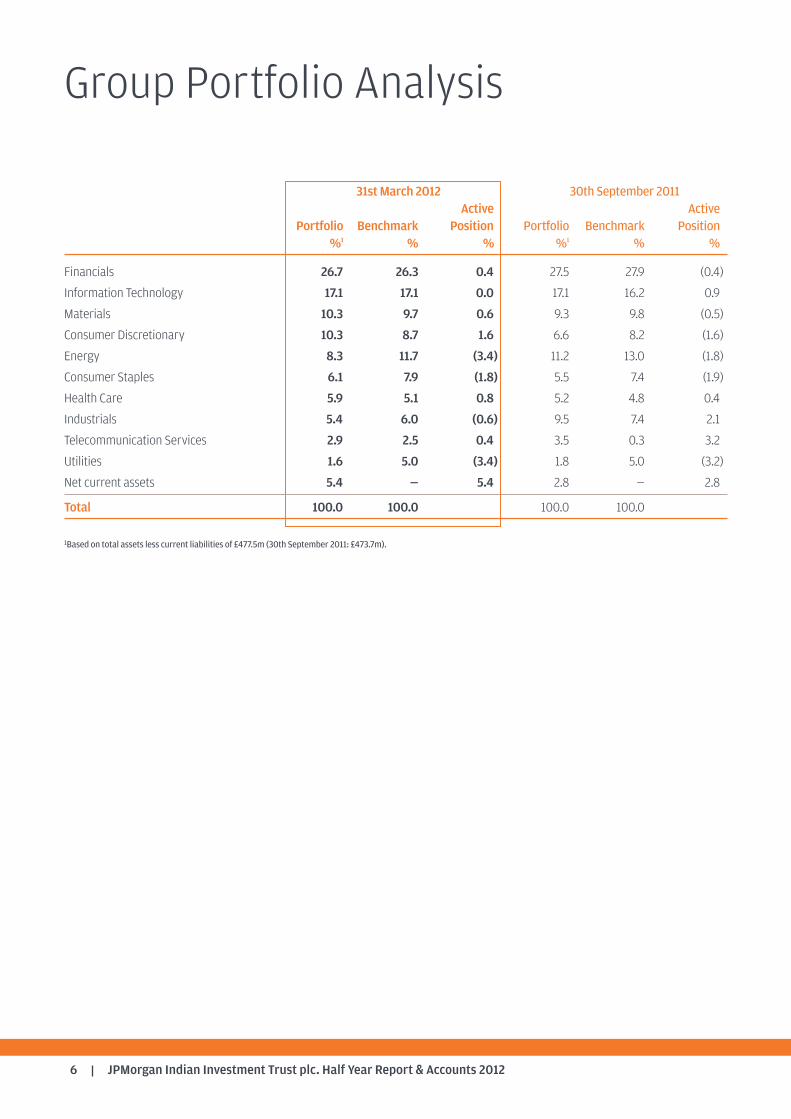
31st March 2012 30th September 2011Active Active
Portfolio Benchmark Position Portfolio Benchmark Position%1 % % %1 % %
Financials 26.7 26.3 0.4 27.5 27.9 (0.4)
Information Technology 17.1 17.1 0.0 17.1 16.2 0.9
Materials 10.3 9.7 0.6 9.3 9.8 (0.5)
Consumer Discretionary 10.3 8.7 1.6 6.6 8.2 (1.6)
Energy 8.3 11.7 (3.4) 11.2 13.0 (1.8)
Consumer Staples 6.1 7.9 (1.8) 5.5 7.4 (1.9)
Health Care 5.9 5.1 0.8 5.2 4.8 0.4
Industrials 5.4 6.0 (0.6) 9.5 7.4 2.1
Telecommunication Services 2.9 2.5 0.4 3.5 0.3 3.2
Utilities 1.6 5.0 (3.4) 1.8 5.0 (3.2)
Net current assets 5.4 — 5.4 2.8 — 2.8
Total 100.0 100.0 100.0 100.0
1Based on total assets less current liabilities of £477.5m (30th September 2011: £473.7m).
Group Portfolio Analysis
JPMorgan Indian Investment Trust plc. Half Year Report & Accounts 2012 7
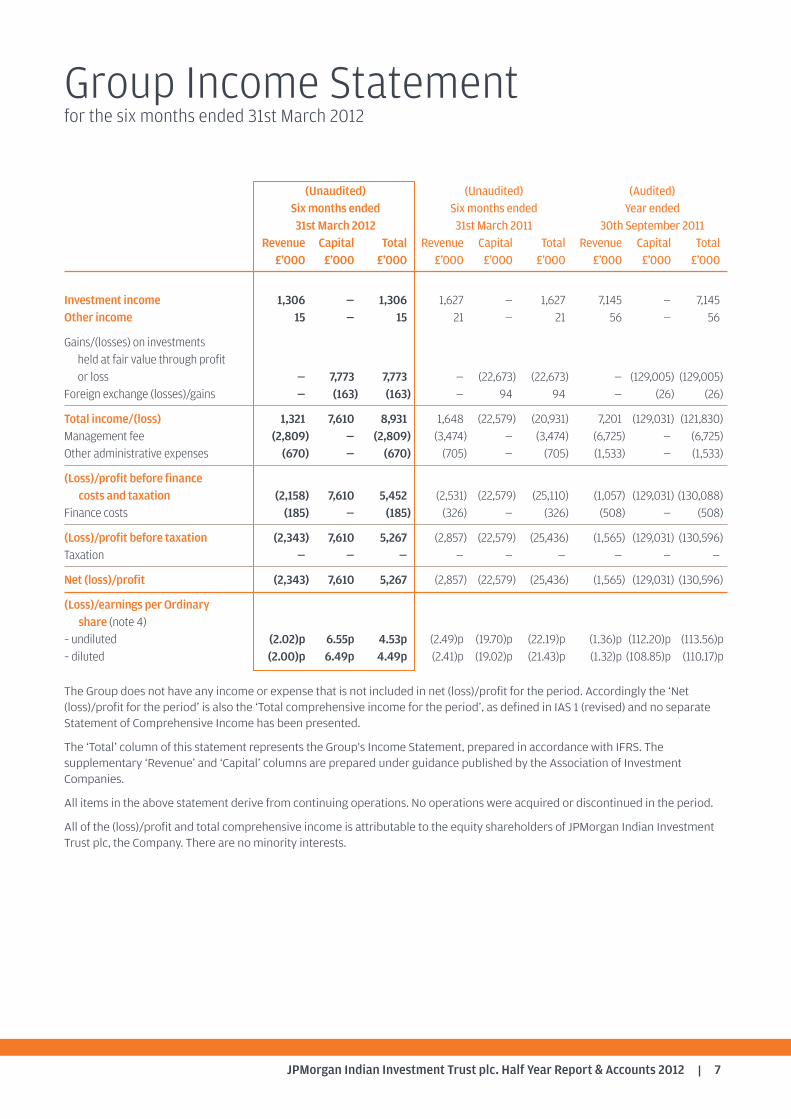
Group Income Statementfor the six months ended 31st March 2012
(Unaudited) (Unaudited) (Audited)Six months ended Six months ended Year ended31st March 2012 31st March 2011 30th September 2011
Revenue Capital Total Revenue Capital Total Revenue Capital Total£’000 £’000 £’000 £’000 £’000 £’000 £’000 £’000 £’000
Investment income 1,306 — 1,306 1,627 — 1,627 7,145 — 7,145Other income 15 — 15 21 — 21 56 — 56
Gains/(losses) on investmentsheld at fair value through profit or loss — 7,773 7,773 — (22,673) (22,673) — (129,005) (129,005)
Foreign exchange (losses)/gains — (163) (163) — 94 94 — (26) (26)
Total income/(loss) 1,321 7,610 8,931 1,648 (22,579) (20,931) 7,201 (129,031) (121,830)Management fee (2,809) — (2,809) (3,474) — (3,474) (6,725) — (6,725)Other administrative expenses (670) — (670) (705) — (705) (1,533) — (1,533)
(Loss)/profit before finance costs and taxation (2,158) 7,610 5,452 (2,531) (22,579) (25,110) (1,057) (129,031) (130,088)
Finance costs (185) — (185) (326) — (326) (508) — (508)
(Loss)/profit before taxation (2,343) 7,610 5,267 (2,857) (22,579) (25,436) (1,565) (129,031) (130,596)Taxation — — — — — — — — —
Net (loss)/profit (2,343) 7,610 5,267 (2,857) (22,579) (25,436) (1,565) (129,031) (130,596)
(Loss)/earnings per Ordinaryshare (note 4)
– undiluted (2.02)p 6.55p 4.53p (2.49)p (19.70)p (22.19)p (1.36)p (112.20)p (113.56)p– diluted (2.00)p 6.49p 4.49p (2.41)p (19.02)p (21.43)p (1.32)p (108.85)p (110.17)p
The Group does not have any income or expense that is not included in net (loss)/profit for the period. Accordingly the ‘Net(loss)/profit for the period’ is also the ‘Total comprehensive income for the period’, as defined in IAS 1 (revised) and no separateStatement of Comprehensive Income has been presented.
The ‘Total’ column of this statement represents the Group's Income Statement, prepared in accordance with IFRS. Thesupplementary ‘Revenue’ and ‘Capital’ columns are prepared under guidance published by the Association of InvestmentCompanies.
All items in the above statement derive from continuing operations. No operations were acquired or discontinued in the period.
All of the (loss)/profit and total comprehensive income is attributable to the equity shareholders of JPMorgan Indian InvestmentTrust plc, the Company. There are no minority interests.
JPMorgan Indian Investment Trust plc. Half Year Report & Accounts 20128
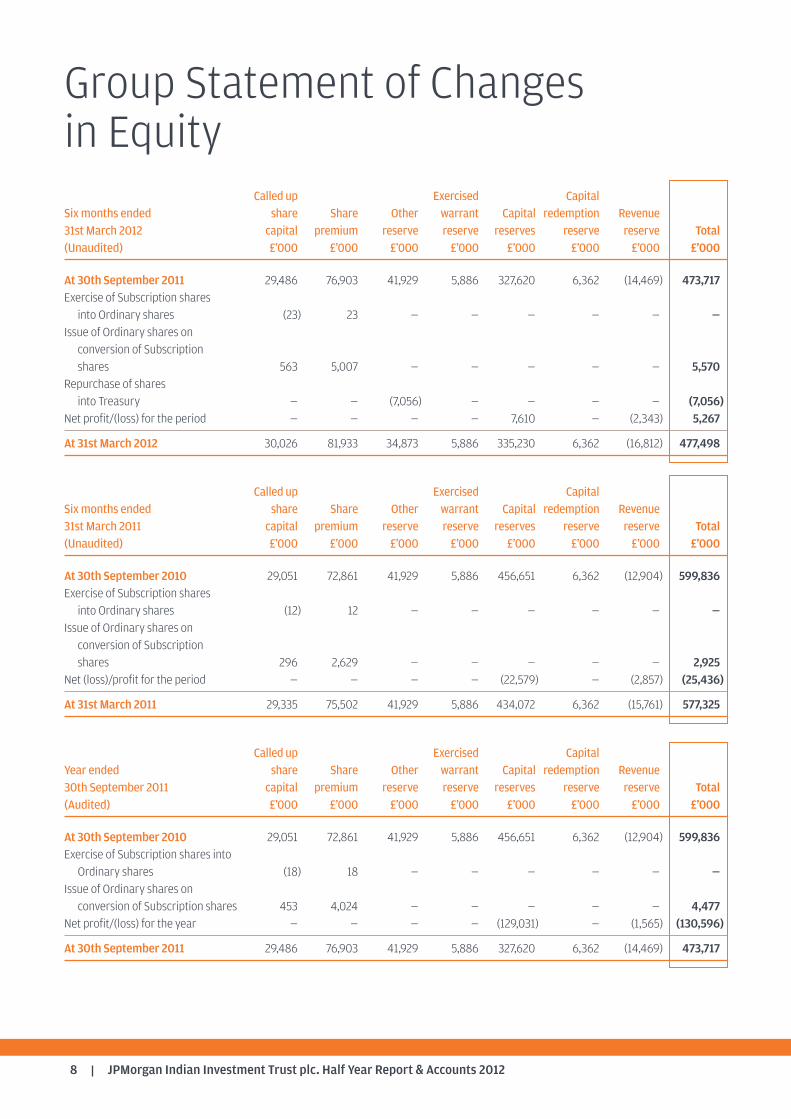
Group Statement of Changesin Equity
Called up Exercised CapitalSix months ended share Share Other warrant Capital redemption Revenue31st March 2012 capital premium reserve reserve reserves reserve reserve Total(Unaudited) £’000 £’000 £’000 £’000 £’000 £’000 £’000 £’000
At 30th September 2011 29,486 76,903 41,929 5,886 327,620 6,362 (14,469) 473,717Exercise of Subscription shares into Ordinary shares (23) 23 — — — — — —
Issue of Ordinary shares on conversion of Subscription shares 563 5,007 — — — — — 5,570
Repurchase of shares into Treasury — — (7,056) — — — — (7,056)
Net profit/(loss) for the period — — — — 7,610 — (2,343) 5,267
At 31st March 2012 30,026 81,933 34,873 5,886 335,230 6,362 (16,812) 477,498
Called up Exercised CapitalSix months ended share Share Other warrant Capital redemption Revenue31st March 2011 capital premium reserve reserve reserves reserve reserve Total(Unaudited) £’000 £’000 £’000 £’000 £’000 £’000 £’000 £’000
At 30th September 2010 29,051 72,861 41,929 5,886 456,651 6,362 (12,904) 599,836Exercise of Subscription shares into Ordinary shares (12) 12 — — — — — —
Issue of Ordinary shares on conversion of Subscription shares 296 2,629 — — — — — 2,925
Net (loss)/profit for the period — — — — (22,579) — (2,857) (25,436)
At 31st March 2011 29,335 75,502 41,929 5,886 434,072 6,362 (15,761) 577,325
Called up Exercised CapitalYear ended share Share Other warrant Capital redemption Revenue30th September 2011 capital premium reserve reserve reserves reserve reserve Total(Audited) £’000 £’000 £’000 £’000 £’000 £’000 £’000 £’000
At 30th September 2010 29,051 72,861 41,929 5,886 456,651 6,362 (12,904) 599,836Exercise of Subscription shares into Ordinary shares (18) 18 — — — — — —
Issue of Ordinary shares on conversion of Subscription shares 453 4,024 — — — — — 4,477
Net profit/(loss) for the year — — — — (129,031) — (1,565) (130,596)
At 30th September 2011 29,486 76,903 41,929 5,886 327,620 6,362 (14,469) 473,717
JPMorgan Indian Investment Trust plc. Half Year Report & Accounts 2012 9
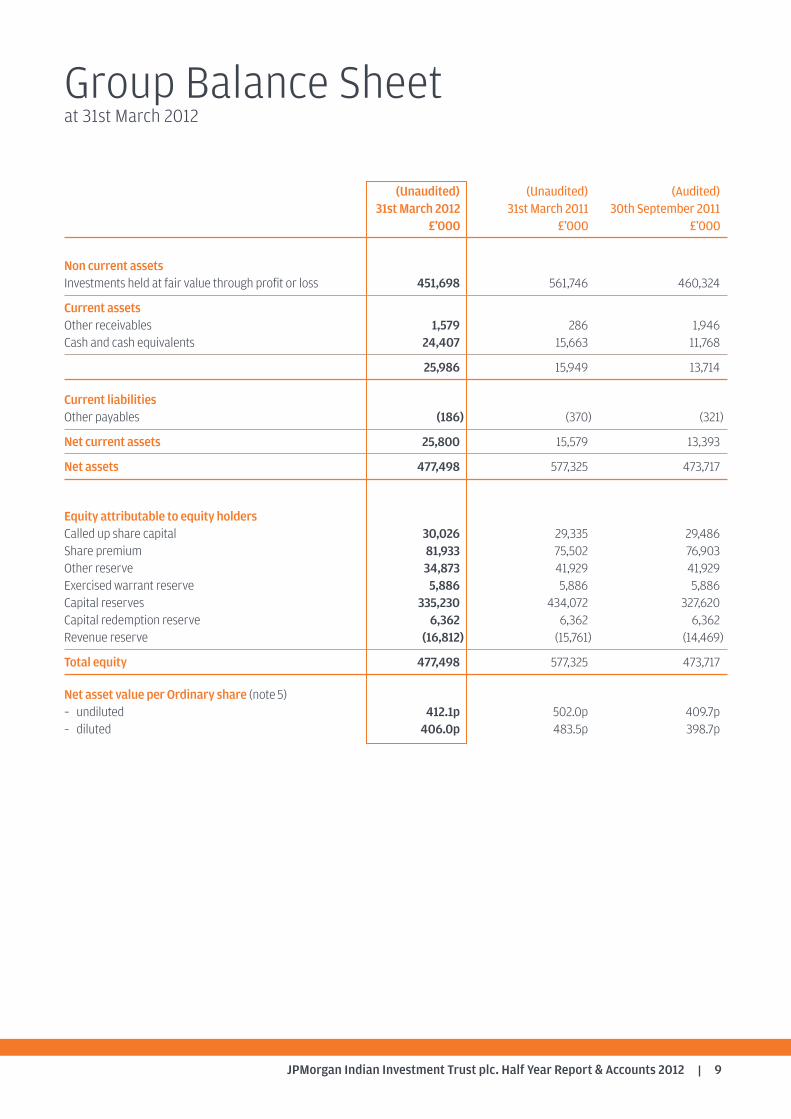
Group Balance Sheetat 31st March 2012
(Unaudited) (Unaudited) (Audited)31st March 2012 31st March 2011 30th September 2011
£’000 £’000 £’000
Non current assetsInvestments held at fair value through profit or loss 451,698 561,746 460,324
Current assetsOther receivables 1,579 286 1,946Cash and cash equivalents 24,407 15,663 11,768
25,986 15,949 13,714
Current liabilitiesOther payables (186) (370) (321)
Net current assets 25,800 15,579 13,393
Net assets 477,498 577,325 473,717
Equity attributable to equity holdersCalled up share capital 30,026 29,335 29,486Share premium 81,933 75,502 76,903Other reserve 34,873 41,929 41,929Exercised warrant reserve 5,886 5,886 5,886Capital reserves 335,230 434,072 327,620Capital redemption reserve 6,362 6,362 6,362Revenue reserve (16,812) (15,761) (14,469)
Total equity 477,498 577,325 473,717
Net asset value per Ordinary share (note5)– undiluted 412.1p 502.0p 409.7p– diluted 406.0p 483.5p 398.7p
JPMorgan Indian Investment Trust plc. Half Year Report & Accounts 201210
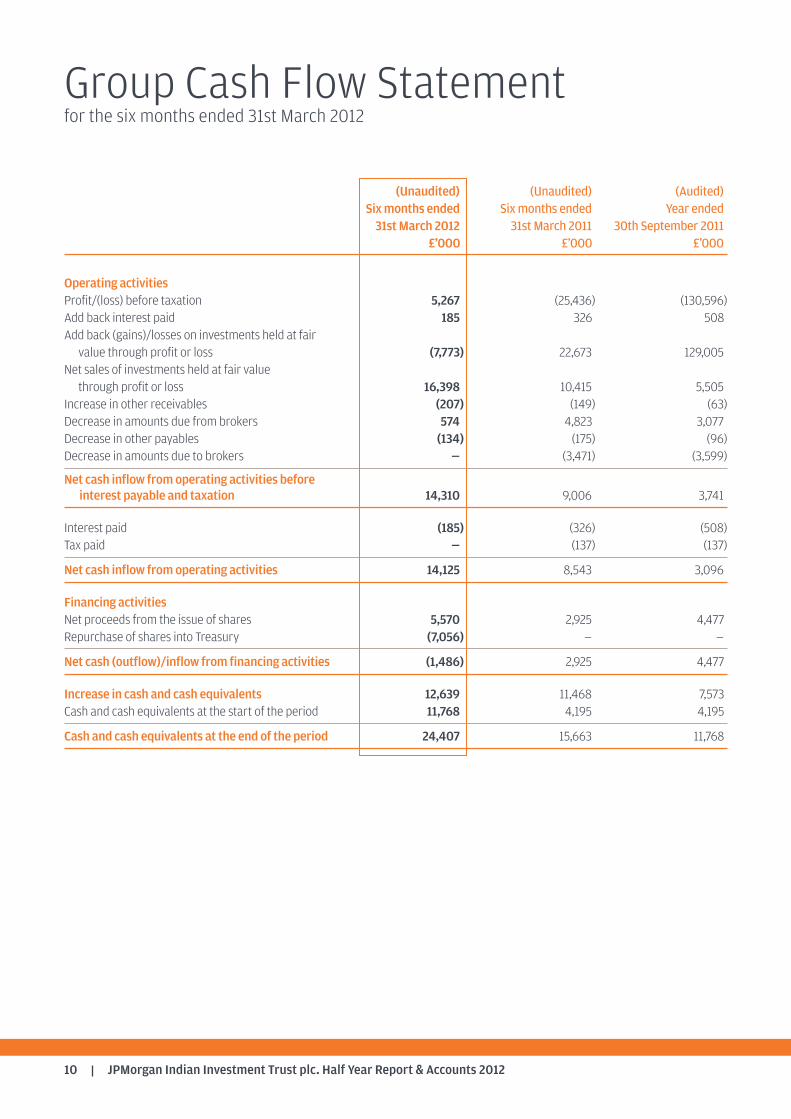
Group Cash Flow Statementfor the six months ended 31st March 2012
(Unaudited) (Unaudited) (Audited)Six months ended Six months ended Year ended31st March 2012 31st March 2011 30th September 2011
£’000 £’000 £’000
Operating activities Profit/(loss) before taxation 5,267 (25,436) (130,596)Add back interest paid 185 326 508 Add back (gains)/losses on investments held at fair value through profit or loss (7,773) 22,673 129,005
Net sales of investments held at fair value through profit or loss 16,398 10,415 5,505
Increase in other receivables (207) (149) (63) Decrease in amounts due from brokers 574 4,823 3,077Decrease in other payables (134) (175) (96) Decrease in amounts due to brokers — (3,471) (3,599)
Net cash inflow from operating activities beforeinterest payable and taxation 14,310 9,006 3,741
Interest paid (185) (326) (508)Tax paid — (137) (137)
Net cash inflow from operating activities 14,125 8,543 3,096
Financing activities Net proceeds from the issue of shares 5,570 2,925 4,477 Repurchase of shares into Treasury (7,056) — —
Net cash (outflow)/inflow from financing activities (1,486) 2,925 4,477
Increase in cash and cash equivalents 12,639 11,468 7,573 Cash and cash equivalents at the start of the period 11,768 4,195 4,195
Cash and cash equivalents at the end of the period 24,407 15,663 11,768

JPMorgan Indian Investment Trust plc. Half Year Report & Accounts 2012 11
Notes to the Group Accountsfor the six months ended 31st March 2012
1. Principal activity
The principal activity of the Company is that of an investment trust company within the meaning of Section 1158 of theCorporation Tax Act 2010.
2. Financial statements
The financial information for the six months ended 31st March 2012 and 2011 has not been audited or reviewed by theCompany’s auditors.
The financial information contained in these half year accounts does not constitute statutory accounts as defined inSection 434 of the Companies Act 2006.
The information for the year ended 30th September 2011 has been extracted from the latest published audited financialstatements. Those accounts have been delivered to the Registrar of Companies and included the report of the auditors whichwas unqualified and did not contain a statement under either Section 498(2) or 498(3) of the Companies Act 2006.
3. Accounting policies
The financial statements have been prepared in accordance with International Financial Reporting Standards (‘IFRS’), whichcomprise standards and interpretations approved by the International Accounting Standards Board to the extent that theyhave been adopted by the European Union.
Where presentational guidance set out in the Statement of Recommended Practice (the ‘SORP’) for investment trusts issuedby the Association of Investment Companies in January 2009 is consistent with the requirements of IFRS, the financialstatements have been prepared on a basis compliant with the recommendations of the SORP.
The accounting policies applied to these half year accounts are consistent with those applied in the accounts for the yearended 30th September 2011.
JPMorgan Indian Investment Trust plc. Half Year Report & Accounts 201212
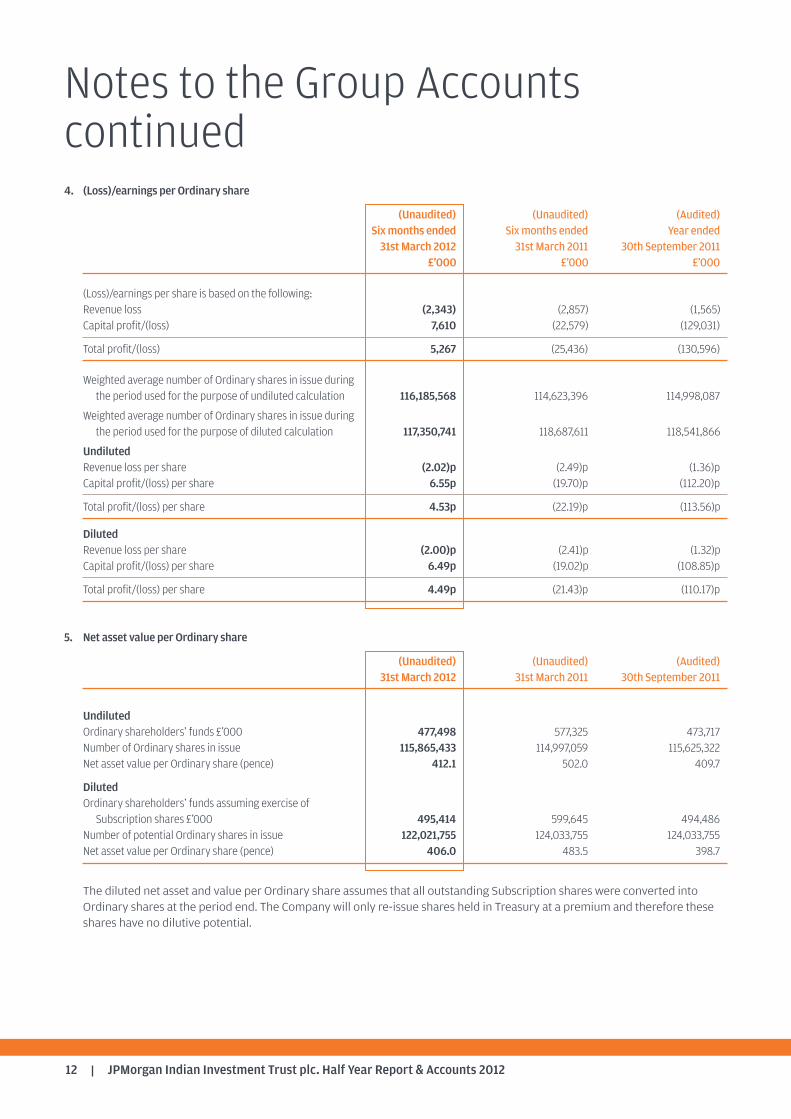
4. (Loss)/earnings per Ordinary share
(Unaudited) (Unaudited) (Audited)Six months ended Six months ended Year ended31st March 2012 31st March 2011 30th September 2011
£’000 £’000 £’000
(Loss)/earnings per share is based on the following:Revenue loss (2,343) (2,857) (1,565) Capital profit/(loss) 7,610 (22,579) (129,031)
Total profit/(loss) 5,267 (25,436) (130,596)
Weighted average number of Ordinary shares in issue during the period used for the purpose of undiluted calculation 116,185,568 114,623,396 114,998,087
Weighted average number of Ordinary shares in issue during the period used for the purpose of diluted calculation 117,350,741 118,687,611 118,541,866
UndilutedRevenue loss per share (2.02)p (2.49)p (1.36)pCapital profit/(loss) per share 6.55p (19.70)p (112.20)p
Total profit/(loss) per share 4.53p (22.19)p (113.56)p
DilutedRevenue loss per share (2.00)p (2.41)p (1.32)p Capital profit/(loss) per share 6.49p (19.02)p (108.85)p
Total profit/(loss) per share 4.49p (21.43)p (110.17)p
5. Net asset value per Ordinary share
(Unaudited) (Unaudited) (Audited)31st March 2012 31st March 2011 30th September 2011
UndilutedOrdinary shareholders’ funds £’000 477,498 577,325 473,717Number of Ordinary shares in issue 115,865,433 114,997,059 115,625,322Net asset value per Ordinary share (pence) 412.1 502.0 409.7
DilutedOrdinary shareholders’ funds assuming exercise of Subscription shares £’000 495,414 599,645 494,486
Number of potential Ordinary shares in issue 122,021,755 124,033,755 124,033,755Net asset value per Ordinary share (pence) 406.0 483.5 398.7
The diluted net asset and value per Ordinary share assumes that all outstanding Subscription shares were converted intoOrdinary shares at the period end. The Company will only re-issue shares held in Treasury at a premium and therefore theseshares have no dilutive potential.
Notes to the Group Accountscontinued
JPMorgan Indian Investment Trust plc. Half Year Report & Accounts 2012 13
Interim Management Report
The Company is required to make the following disclosures inits Half Year Report.
Principal Risks and Uncertainties
The principal risks and uncertainties faced by the Companyfall into the following broad categories: investment andstrategy; market; accounting, legal and regulatory; corporategovernance and shareholder relations; operational; andfinancial. Information on each of these areas is given in theBusiness Review within the Annual Report and Accounts forthe year ended 30th September 2011.
Any change in taxation legislation or taxation regimeapplicable to the Mauritian Subsidiary could affect the value ofthe investments held by the Group, affect the Company’s abilityto provide returns to Shareholders or alter the post-tax returnsto Shareholders. In particular, it is intended that the MauritianSubsidiary will continue to benefit from the India/MauritiusDouble Tax Treaty. Future changes to Mauritian or Indian law orto the India/Mauritius Double Tax Treaty, or the interpretationsgiven to them by the regulatory authorities, could imposeadditional costs or obligations on the activities of the MauritianSubsidiary, which in turn may have adverse effects on theperformance of the Company. The terms of the India/MauritiusDouble Tax Treaty were challenged in India but were upheld bythe Supreme Court of India in October 2003. However, morerecently, there have been discussions between the Indian andMauritian authorities with regard to re-negotiation of theTreaty. Adverse tax consequences would result if the MauritianSubsidiary ceased to qualify for the benefits under theIndia/Mauritius Double Tax Treaty (for example, if it were heldthat the Mauritian Subsidiary was not a resident of Mauritius).There can be no assurance that the Mauritian Subsidiary willcontinue to qualify for or receive the benefits of theIndia/Mauritius Double Tax Treaty or that the terms of theIndia/Mauritius Double tax Treaty will not be changed. Such anevent may require the Mauritian Subsidiary to pay or providefor tax liabilities that would reduce the net asset value of theOrdinary shares.
Related Parties Transactions
During the first six months of the current financial year, notransactions with related parties have taken place which havematerially affected the financial position or the performance ofthe Company during the period.
Going Concern
The Directors believe, having considered the Company’sinvestment objective, risk management policies, capitalmanagement policies and procedures, nature of the portfolioand expenditure projections, that the Company has adequateresources, an appropriate financial structure and suitablemanagement arrangements in place to continue in operationalexistence for the foreseeable future. For these reasons, theyconsider there is reasonable evidence to continue to adopt thegoing concern basis in preparing the accounts.
Directors’ Responsibilities
The Board of Directors confirms that, to the best of itsknowledge:
(i) the condensed set of financial statements containedwithin the half yearly financial report has beenprepared in accordance with the Accounting StandardsBoard’s Statement ‘Half-Yearly Financial Reports’; and
(ii) the interim management report includes a fair review ofthe information required by 4.2.7R and 4.2.8R of the UKListing Authority Disclosure and Transparency Rules.
For and on behalf of the BoardHugh BollandChairman 24th May 2012

JPMorgan Indian Investment Trust plc. Half Year Report & Accounts 201214
Details of Subscription Shares
On 4th November 2008 the Company issued Subscriptionshares as a bonus issue to the Ordinary shareholders on thebasis of one Subscription share for every five ordinary sharesheld. Each Subscription share confers the right (but not theobligation) to subscribe for one Ordinary share on any businessday during the period from 2nd January 2009 until 2nd January2014, after which the rights on the Subscription shares willlapse.
For the purposes of UK taxation, the issue of Subscriptionshares is treated as a reorganisation of the Company’s sharecapital. Whereas such reorganisations do not trigger achargeable disposal for the purposes of the taxation of capitalgains, they do require shareholders to reallocate the base costsof their Ordinary shares between Ordinary shares andSubscription shares received.
At the close of business on 5th November 2008 the middlemarket prices of the Company’s Ordinary shares andSubscription shares were as follows:
Ordinary shares: 246.0 pence
Subscription shares: 67.5 pence
Accordingly an individual investor who on 4th November 2008held five Ordinary shares (or a multiple thereof) would havereceived a bonus issue of one Subscription share (or therelevant multiple thereof) and would apportion the base cost ofsuch holding 94.8% to the five Ordinary shares and 5.2% to theSubscription shares.
Subscription share rights may be exercised on any day up toand including 2nd January 2014. With effect from 3rd January2012, the conversion price increased from 247 pence to291 pence per share.

JPMorgan Indian Investment Trust plc. Half Year Report & Accounts 2012 15
Glossary of Terms and Definitions
Portfolio return
Return on net assets, that is net of management fees andadministration expenses, but excluding the effect ofSubscription shares which have converted during the periodand the dilutive impact of Subscription shares in issue at theperiod end.
Benchmark return
Total return on the benchmark, on a mid-market value tomid-market value basis, assuming that all dividends receivedwere reinvested into the shares of the underlying companiesat time the shares were quoted ex-dividend.
The benchmark is a recognised index of stocks which shouldnot be taken as wholly representative of the Company’sinvestment universe. The Company’s investment strategy doesnot ‘track’ this index and consequently, there may be somedivergence between the Company’s performance and that ofthe benchmark.
Diluted return on net assets
Return on the diluted net asset value per Ordinary share on abid value to bid value basis.
Diluted net asset value per Ordinary share
Net asset value per Ordinary share assuming all Subscriptionshares outstanding were converted into Ordinary shares at theperiod end.
Return to Ordinary shareholders
Total return to the Ordinary shareholder, on a mid-market priceto mid-market price basis.
Ordinary share price discount/premium to diluted net assetvalue (‘NAV’) per share
If the share price of an investment trust is lower than the NAVper share, the shares are said to be trading at a discount. Thediscount is shown as a percentage of the NAV per share. Theopposite of a discount is a premium. It is more common for aninvestment trust’s shares to trade at a discount than at apremium.
Active position
The active position shows the difference between theCompany’s holding of an individual stock, sector or countryversus that stock, sector or country’s benchmark. A positivenumber indicates an active decision by the investmentmanager to own more of (i.e. be overweight) that stock, sectoror country versus the benchmark and a negative number adecision to hold less of (i.e. be underweight) that stock, sectoror country versus the benchmark.
History
The Company was launched in May 1994 by a public offer of shareswhich raised £84 million before expenses. In November 2005 theCompany adopted its present name, JPMorgan Indian InvestmentTrust plc.
Directors
Hugh Bolland (Chairman) Richard Burns Nimi PatelHugh SandemanPeter Sullivan
Company Numbers
Company registration number: 2915926
Ordinary Shares
London Stock Exchange Sedol Number: 0345035 ISIN: GB00345 03S9 Bloomberg: JII LS
Subscription Shares
London Stock Exchange Sedol Number: B3CSX51 ISIN: GB00B3C SX518 Bloomberg: JIIS LN
Market Information
The Company’s net asset value (‘NAV’) per share is published daily viathe London Stock Exchange. The Company’s Ordinary shares are listedon the London Stock Exchange and are quoted daily in the FinancialTimes, The Times, The Daily Telegraph, The Scotsman, TheIndependent and on the JPMorgan website at www.jpmindian.co.ukwhere the Ordinary share price is updated every fifteen minutes duringtrading hours.
The Company’s Subscription shares are listed on the London StockExchange and quoted daily in the Financial Times and on the JPMorganwebsite at www.jpmindian.co.uk, where the Subscription price isupdated every fifteen minutes during trading hours.
Website
www.jpmindian.co.uk
Share Transactions
The Company’s shares may be dealt in directly through a stockbrokeror professional adviser acting on an investor’s behalf. They may alsobe purchased and held through the J.P. Morgan Investment Account,J.P. Morgan ISA and J.P. Morgan SIPP. These products are all availableon the online wealth manager service, J.P. Morgan WealthManager+available at www.jpmorganwealthmanagerplus.co.uk
Manager and Company Secretary
JPMorgan Asset Management (UK) Limited
Company’s Registered Office
Finsbury Dials20 Finsbury StreetLondon EC2Y 9AQTelephone number: 020 7742 4000
For company secretarial and administrative matters, please contactAndrew Norman.
CustodianJPMorgan Chase Bank, N.A.125 London WallLondon EC2M 5AJ
Registrars
Equiniti LimitedReference 1087Aspect HouseSpencer RoadLancingWest Sussex BN99 6DATelephone: 0871 384 2327
Notifications of changes of address and enquiries regarding sharecertificates or dividend cheques should be made in writing to theRegistrar quoting reference 1087.
Registered shareholders can obtain further details on their holdingson the internet by visiting www.shareview.co.uk.
Independent Auditor
Deloitte LLP Chartered Accountants and Statutory AuditorStonecutter Court 1 Stonecutter Street London EC4A 4TR
Brokers
JPMorgan Cazenove Limited10 AldermanburyLondon EC2V 7RF
Savings Product Administrators
For queries on the J.P. Morgan Investment Account, J.P. Morgan ISA andJ.P. Morgan SIPP, see contact details on the back cover of this report.
Information about the Company
Financial CalendarFinancial year end 30th SeptemberFinal results announced DecemberHalf year end 31st MarchHalf year results announced MayInterim Management Statements announced January/JulyDividends N/AAnnual General Meeting January
A member of the AIC
JPMorgan Indian Investment Trust plc. Half Year Report & Accounts 2012 17

J.P. Morgan HelplineFreephone 0800 20 40 20 or +44 (0)20 7742 9995
Your telephone call may be recorded for your security
www.jpmindian.co.uk