Embed Size (px)
Citation preview

JPMorgan Income & GrowthInvestment Trust plcHalf Year Report & Accounts for the six months ended 31st July 2016
Income Growth HY_cover_4pp 29/09/2016 14:47 Page FC1

ObjectivesThe Company’s investment objectives are to meet the finalcapital entitlement of the Income shareholders and to providethem with a regular quarterly income as well as to providecapital growth for Capital shareholders.
Investment PolicyIn order to manage risk, the Company invests in a diversifiedportfolio, typically comprising 50 to 70 UK equities and a rangeof other assets. The investments are primarily UK equities,however, the Company has the flexibility to vary the allocationbetween UK equities and other assets in order to seek the besttotal returns.
BenchmarkThe FTSE 350 Total Return Index.
Life of the CompanyThe Company has a fixed life, and will be wound up voluntarilyon 30th November 2016.
Management Company and Company SecretaryThe Company employs JPMorgan Funds Limited (‘JPMF’ or the‘Manager’) as its Alternative Investment Fund Manager andCompany Secretary. JPMF is approved by the Financial ConductAuthority and delegates the management of the Company’sportfolio to JPMorgan Asset Management (‘JPMAM’).
FCA regulation of ‘non-mainstream pooledinvestments’The Company currently conducts its affairs so that the sharesissued by JPMorgan Income & Growth Investment Trust plc canbe recommended by Independent Financial Advisers toordinary retail investors in accordance with the FCA’s rules inrelation to non-mainstream investment products and intends tocontinue to do so for the foreseeable future.
The shares are excluded from the FCA’s restrictions which applyto non-mainstream investment products because they areshares in an investment trust.
AICThe Company is a member of the Association of InvestmentCompanies.
WebsiteThe Company’s website, which can be found atwww.jpmincomeandgrowth.co.uk, includes useful informationon the Company, such as daily prices, factsheets and currentand historic half year and annual reports.
Features
Income Growth HY_cover_4pp 29/09/2016 14:47 Page IFC2

1
Contents
HALF YEAR PERFORMANCE
ABOUT THE COMPANY
2 Half Year Performance
3 Chairman’s Statement
4 Investment Managers’ Report
INVESTMENT REVIEW
7 List of Investments
9 Portfolio Analyses
9 UK Direct Equity Analysis
FINANCIAL STATEMENTS
10 Statement of Comprehensive Income
11 Statement of Changes in Equity
12 Statement of Financial Position
13 Statement of Cash Flows
14 Notes to the Financial Statements
SHAREHOLDER INFORMATION
18 Interim Management Report
19 Capital Structure of the Company
20 Glossary of Terms and Definitions
21 Where to buy J.P. Morgan Investment Trusts
25 Information about the Company
Income&Growth Half Year pp01-20 29/09/2016 14:11 Page 1

2 JPMORGAN INCOME & GROWTH INVESTMENT TRUST PLC. HALF YEAR REPORT & ACCOUNTS 2016
Half Year Performance
TOTAL RETURNS TO 31ST JULY 2016 (INCLUDES DIVIDENDS REINVESTED)
Financial Data for the six months ended 31st July 201631st July 31st January %
2016 2016 change
Gross assets (£’000) 69,010 66,058 +4.5Income sharesNet assets attributable (£’000) 67,361 66,058 +2.0
Net asset value per share (p) 109.09 106.98 +2.0
Share price (p) 101.50 96.75 +4.9
Share price discount to net asset value (%) 6.96 9.56
Two dividends of 1.2p per Income share were paid in the six months ended 31st July 2016
31st July 31st January %2016 2016 change
Capital sharesNet assets attributable (£’000) 1,649 — N/A
Net asset value per share (p) 2.56 — N/A
Share price (p) 3.50 5.75 –39.1
Share price premium to net asset value (%) 36.72 N/A
Ongoing Charges(%) 1.26 1.28
A glossary of terms and definitions is provided on page 20.1 Source: J.P. Morgan2 Source: Morningstar. Share price change plus dividends received.3 Source: FTSE.
+4.3%Income share net asset value
total return1
–39.1%Capital share price total
return
+7.5%Income share price total
return2
+6.7%Unit net asset value total
return1
2.6pCapital share net asset value
total return1
+6.7%Unit share price total return
+6.9%Shareholders’ Funds total
return
+11.9%FTSE 350 Total Return Index3
Income&Growth Half Year pp01-20 29/09/2016 14:11 Page 2

3
About the Company
CHAIRMAN’S STATEMENT
This is the last half year report and accounts of the Company’s life, before we are wound upat the end of November, in accordance with our Articles of Association.
Financial markets made good progress over the six months to 31st July, propelled by thecombination of moderate growth and monetary laxity. Central banks in Japan and Europecontinued to add monetary fuel to the global financial engine, whilst the Federal Reserveabstained from further tightening. The Bank of England cut interest rates by 0.25% andannounced further purchases of assets with newly created money. The FTSE 350 (theCompany’s benchmark) returned 11.9%.
After six straight years of outperformance, the Managers had a difficult half year. Theshareholders’ funds total return was still positive at 6.9%, but this was some 5% below thebenchmark. As we promised shareholders, we remained fully invested in anticipation of ourwind-up. Gearing added value; the non-UK equity portfolio beat the benchmark; but the UKequity portion – some 70% of assets – fell sharply behind the index.
The Manager’s Report explains the causes of this performance in greater detail. The periodunder review includes the immediate impact of Britain’s decision to leave the EU. This led torelative weakness of UK-oriented companies, to which we have significant exposure. Thesecompanies had previously led our strong performance since 2009. We are relativelyunderexposed to the largest multinationals that benefited from sterling’s depreciation in thewake of the vote.
The Board increased the quarterly dividend to 1.2p per Income share in the previousfinancial year, largely reflecting the strength of dividends paid by UK companies.
It is the Board’s intention to remain fully invested over the next several months. We haveannounced already that shares in another investment trust, JPMorgan Elect PLC will beoffered to shareholders preferring to retain uninterrupted exposure to markets and not tocrystallise capital gains by receiving cash. We intend to write again in anticipation of anExtraordinary General Meeting to authorise the winding-up of the Company.
Karl SternbergChairman 29th September 2016
Income&Growth Half Year pp01-20 29/09/2016 14:11 Page 3

4 JPMORGAN INCOME & GROWTH INVESTMENT TRUST PLC. HALF YEAR REPORT & ACCOUNTS 2016
INVESTMENT MANAGERS’ REPORT
James Elliot
Katy Thorneycroft
Sarah Emly
John Baker
Market ReviewGlobal equity markets performed positively over the period under review as economic datashowed global growth to be on track. The vote to leave the EU came as a shock towards theend of the second quarter, as market participants assigned a high probability for a ‘remain’vote. Given the immediate downgrade in the UK’s perceived near-term growth prospects, aswell as the rise in uncertainty facing the global economy as a whole, equity markets sold offsignificantly and bond prices rose in the immediate aftermath. However, markets stabilisedwithin a few days and performed well in July and August as equities and corporate bondsrose strongly.
In anticipation of the economic effects of the Brexit shock, the Bank of England reducedinterest rates in August renewed its asset purchase programme. Elsewhere the effects ofBrexit appear to be limited with the euro area Purchasing Managers Index remaining at alevel suggestive of satisfactory growth.
Portfolio ReviewThe Income & Growth portfolio is managed to the objective of meeting the final capitalentitlement of the Income shareholders, as well as providing them with a regular income,and of providing capital growth for the Capital shareholders.
The Company’s overall portfolio return of +6.9% underperformed the benchmark’s return of+11.9% over the six months to the end of July 2016. There was positive absolute performancefrom all underlying strategies. Our UK equity holdings which make up our biggest allocationdelivered a positive absolute return during the period, but underperformed the FTSE 350index by 7.1%.
This disappointing performance of the UK equity element of the portfolio was a result of theportfolio’s overweight position in stocks exposed to the domestic economy such as housebuilders, retailers and media companies. The negative impact attributable to these threesectors alone was in the region of 3.7%. It resulted from a fear that these sectors willexperience a greater impact from any post ‘Brexit’ slow-down than sectors whose businessis mainly conducted overseas.
Looking at specific holdings in the portfolio the worst performers were Berkeley Group, ahouse builder with a large London exposure; Next Plc, the high street retailer and ITV, forwhom advertising is a key source of revenue. Conversely our internationally-exposedholdings such as British American Tobacco, Rio Tinto and GlaxoSmithKline performedstrongly.
In periods of such volatility it is imperative to continue to assess the portfolio’s holdings toensure that the rationale behind the original investment decision still holds. For the vastmajority of holdings this was the case and as a result few changes were made to theportfolio. Whilst we acknowledge the fact that economic uncertainty has risen we see littleto be gained from selling holdings where the underlying business case remains strong andwhere the message from the management teams remains one of guarded optimism.
During the review period we have made no changes to our asset allocation. The largestallocation is UK equities. We also own 11% in JPM Multi-Asset Income Fund. It remains
About the Company continued
Income&Growth Half Year pp01-20 29/09/2016 14:11 Page 4
5
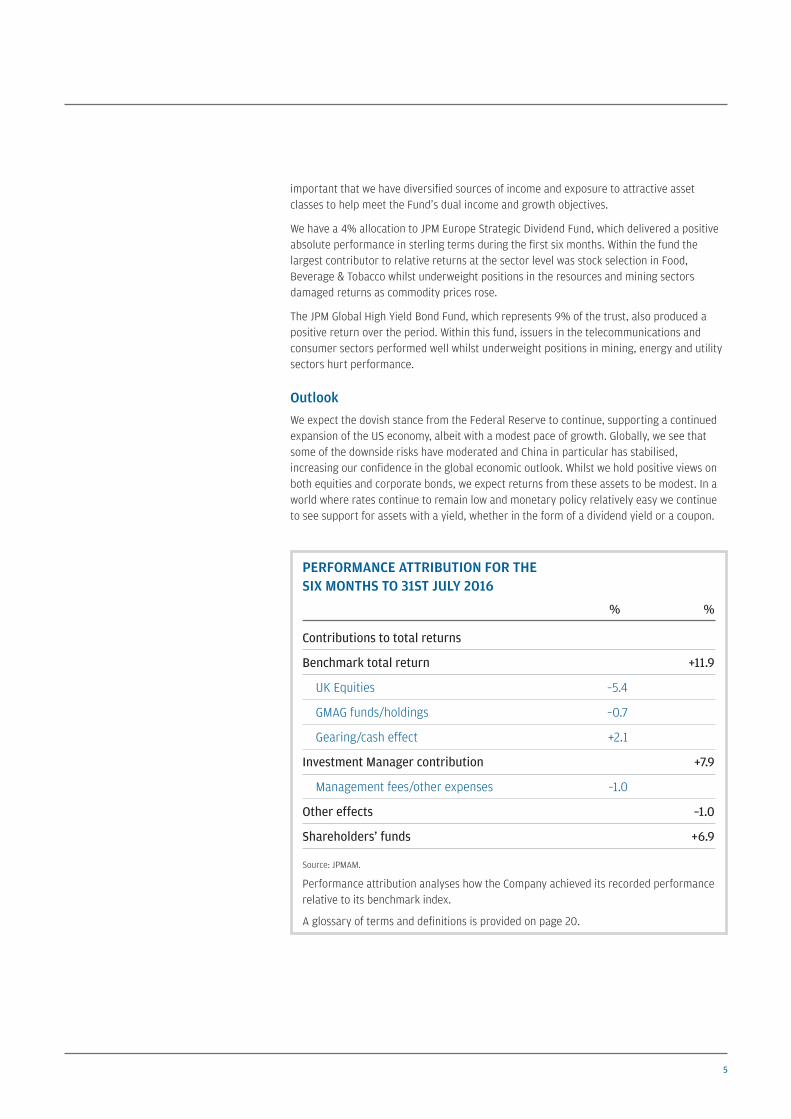
important that we have diversified sources of income and exposure to attractive assetclasses to help meet the Fund’s dual income and growth objectives.
We have a 4% allocation to JPM Europe Strategic Dividend Fund, which delivered a positiveabsolute performance in sterling terms during the first six months. Within the fund thelargest contributor to relative returns at the sector level was stock selection in Food,Beverage & Tobacco whilst underweight positions in the resources and mining sectorsdamaged returns as commodity prices rose.
The JPM Global High Yield Bond Fund, which represents 9% of the trust, also produced apositive return over the period. Within this fund, issuers in the telecommunications andconsumer sectors performed well whilst underweight positions in mining, energy and utilitysectors hurt performance.
OutlookWe expect the dovish stance from the Federal Reserve to continue, supporting a continuedexpansion of the US economy, albeit with a modest pace of growth. Globally, we see thatsome of the downside risks have moderated and China in particular has stabilised,increasing our confidence in the global economic outlook. Whilst we hold positive views onboth equities and corporate bonds, we expect returns from these assets to be modest. In aworld where rates continue to remain low and monetary policy relatively easy we continueto see support for assets with a yield, whether in the form of a dividend yield or a coupon.
PERFORMANCE ATTRIBUTION FOR THESIX MONTHS TO 31ST JULY 2016
% %
Contributions to total returns
Benchmark total return +11.9
UK Equities –5.4
GMAG funds/holdings –0.7
Gearing/cash effect +2.1
Investment Manager contribution +7.9
Management fees/other expenses –1.0
Other effects –1.0
Shareholders’ funds +6.9
Source: JPMAM.
Performance attribution analyses how the Company achieved its recorded performancerelative to its benchmark index.
A glossary of terms and definitions is provided on page 20.
Income&Growth Half Year pp01-20 29/09/2016 14:11 Page 5

6 JPMORGAN INCOME & GROWTH INVESTMENT TRUST PLC. HALF YEAR REPORT & ACCOUNTS 2016
Although these same global influences will be supportive of UK equities which are relativelyhigh yielding, they remain exposed to the potential impact of Brexit. Current economicindicators suggest investors’ worst fears may have been misplaced but confidence remainsfragile as markets, corporates and consumers await further clarification on the UK’s exitfrom the EU.
Given the Company’s short life until its reconstruction at the end of November we envisagekeeping the portfolio fully invested.
James ElliotKaty ThorneycroftSarah EmlyJohn BakerInvestment Managers 29th September 2016
INVESTMENT MANAGERS’ REPORT CONTINUED
About the Company continued
Income&Growth Half Year pp01-20 29/09/2016 14:11 Page 6

7
JPMorgan Multi-Asset Income Fund Diversified Assets 9,749 11.0JPMorgan Global High Yield Bond Diversified Assets 8,256 9.3Royal Dutch Shell Oil & Gas 6,162 7.0British American Tobacco Consumer Goods 4,398 5.0GlaxoSmithKline Health Care 4,057 4.6JPMorgan Europe Strategic Dividend Fund Diversified Assets 3,361 3.8HSBC Financials 3,167 3.6BP Oil & Gas 3,060 3.5Imperial Brands Consumer Goods 3,011 3.4AstraZeneca Health Care 2,208 2.5National Grid Utilities 2,200 2.5Beazley Group Financials 1,888 2.1Diageo Consumer Goods 1,744 2.0Rio Tinto Basic Materials 1,653 1.9Direct Line Insurance Financials 1,419 1.6Compass Group Consumer Services 1,400 1.6ITV Consumer Services 1,366 1.5WPP Consumer Services 1,228 1.4Next Consumer Services 1,179 1.3Berkeley Consumer Goods 1,172 1.3Aviva Financials 1,148 1.3Severn Trent Utilities 1,147 1.3Booker Group Consumer Services 1,121 1.3DCC Industrials 1,120 1.3Phoenix Group Financials 1,096 1.2Reed Elsevier Consumer Services 1,091 1.2Novae Group Financials 1,067 1.2Taylor Wimpey Consumer Goods 1,048 1.2
Investment Review
LIST OF INVESTMENTS AT 31ST JULY 2016
ValuationCompany Sector £ 000 %
Income&Growth Half Year pp01-20 29/09/2016 14:11 Page 7

8 JPMORGAN INCOME & GROWTH INVESTMENT TRUST PLC. HALF YEAR REPORT & ACCOUNTS 2016
Mondi Basic Materials 1,027 1.2BAE Systems Industrials 1,016 1.2Persimmon Consumer Goods 1,003 1.1Barclays Financials 990 1.1KCOM Telecommunications 864 1.0888 Holdings Consumer Services 819 0.9Intermediate Capital Group Financials 776 0.9Fevertree Drinks Consumer Goods 758 0.9WH Smith Consumer Services 755 0.9Vodafone Telecommunications 701 0.8Serco Group Industrials 661 0.8Jupiter Fund Management Financials 656 0.7Informa Consumer Services 647 0.7DS Smith Industrials 640 0.7Headlam Consumer Goods 608 0.7Micro Focus International Technology 594 0.7Legal & General Financials 556 0.6Card Factory Consumer Services 554 0.6Galliford Consumer Goods 546 0.6Croda International Basic Materials 537 0.6Costain Industrials 520 0.6Lloyds Banking Financials 500 0.6Schroders Financials 480 0.5Connect Group Industrials 360 0.4William Hill Consumer Services 211 0.2Morgan Advanced Materials Industrials 104 0.1
Total investments 88,399 100.0
ValuationCompany Sector £ 000 %
LIST OF INVESTMENTS CONTINUED
Investment Review continued
Income&Growth Half Year pp01-20 29/09/2016 14:11 Page 8
9
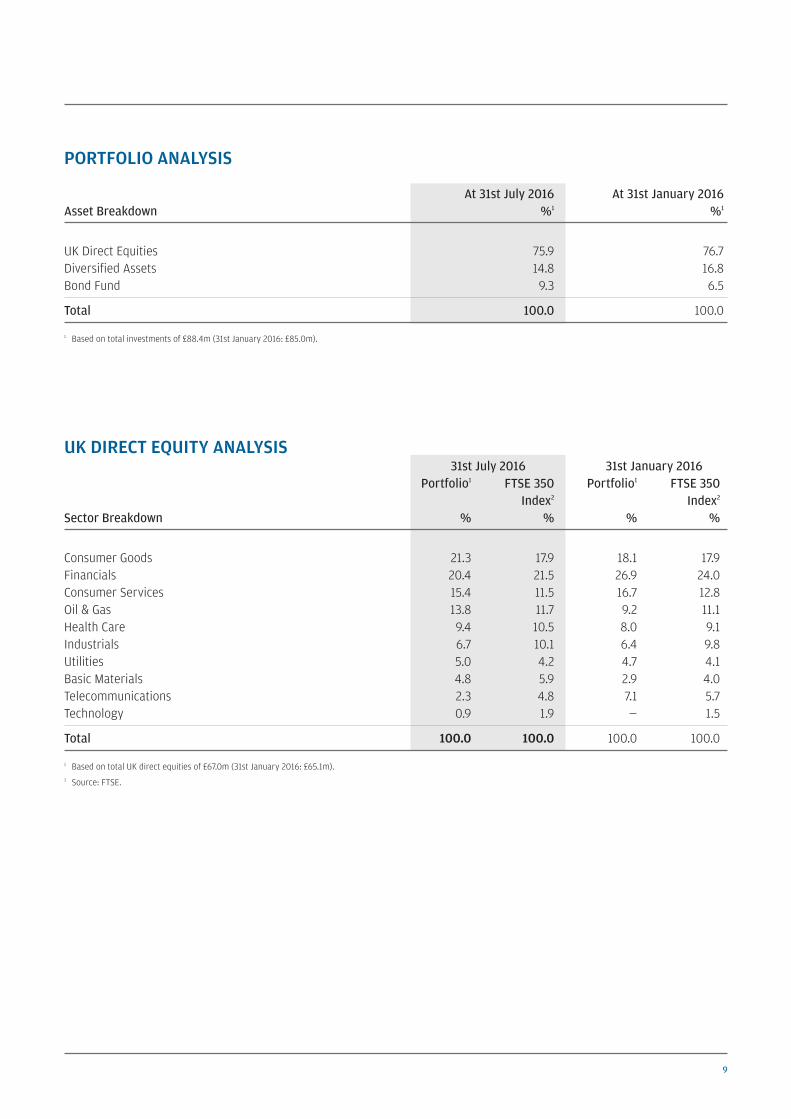
At 31st July 2016 At 31st January 2016Asset Breakdown %1 %1
UK Direct Equities 75.9 76.7Diversified Assets 14.8 16.8Bond Fund 9.3 6.5
Total 100.0 100.0
1 Based on total investments of £88.4m (31st January 2016: £85.0m).
UK DIRECT EQUITY ANALYSIS 31st July 2016 31st January 2016 Portfolio1 FTSE 350 Portfolio1 FTSE 350 Index2 Index2
Sector Breakdown % % % %
Consumer Goods 21.3 17.9 18.1 17.9Financials 20.4 21.5 26.9 24.0Consumer Services 15.4 11.5 16.7 12.8Oil & Gas 13.8 11.7 9.2 11.1Health Care 9.4 10.5 8.0 9.1Industrials 6.7 10.1 6.4 9.8Utilities 5.0 4.2 4.7 4.1Basic Materials 4.8 5.9 2.9 4.0Telecommunications 2.3 4.8 7.1 5.7Technology 0.9 1.9 — 1.5
Total 100.0 100.0 100.0 100.0
1 Based on total UK direct equities of £67.0m (31st January 2016: £65.1m).2 Source: FTSE.
PORTFOLIO ANALYSIS
Income&Growth Half Year pp01-20 29/09/2016 14:11 Page 9

10 JPMORGAN INCOME & GROWTH INVESTMENT TRUST PLC. HALF YEAR REPORT & ACCOUNTS 2016
Financial Statements
STATEMENT OF COMPREHENSIVE INCOMEFOR THE SIX MONTHS ENDED 31ST JULY 2016
(Unaudited) (Unaudited) (Audited)Six months ended Six months ended Year ended31st July 2016 31st July 2015 31st January 2016
Revenue Capital Total Revenue Capital Total Revenue Capital Total£’000 £’000 £’000 £’000 £’000 £’000 £’000 £’000 £’000
Gains/(losses) on investments held at fair value through profit or loss — 2,518 2,518 — 1,772 1,772 — (4,844) (4,844)
Net foreign currency gains/(losses) — 2 2 — (1) (1) — — —Income from investments 2,537 — 2,537 2,332 — 2,332 4,209 — 4,209 Other income — — — — — — 1 — 1
Gross return/(loss) 2,537 2,520 5,057 2,332 1,771 4,103 4,210 (4,844) (634)Management fee (79) (185) (264) (86) (202) (288) (169) (395) (564)Other administrative expenses (151) — (151) (175) — (175) (343) — (343)Provision for liquidation — — — — — — — (248) (248)
Net return/(loss) on ordinary activities before finance costs and taxation 2,307 2,335 4,642 2,071 1,569 3,640 3,698 (5,487) (1,789)
Finance costs (67) (158) (225) (65) (152) (217) (131) (304) (435)Dividends paid on Income
shares (note 3)1 (1,482) — (1,482) (1,420) — (1,420) (2,902) — (2,902)Shortfall due to Income
shareholders — — — — — — — 558 558
Net return/(loss) on ordinary activities before taxation 758 2,177 2,935 586 1,417 2,003 665 (5,233) (4,568)
Taxation (13) — (13) (1) — (1) (3) — (3)
Net return/(loss) on ordinary activities after taxation 745 2,177 2,922 585 1,417 2,002 662 (5,233) (4,571)
Allocation to Income shareholders (745) (558) (1,303) (585) — (585) (662) — (662)
— 1,619 1,619 — 1,417 1,417 — (5,233) (5,233)
Other comprehensive incomeMovement in fair value of interest
rate swap — 30 30 — 10 10 — 46 46
Total comprehensive income — 1,649 1,649 — 1,427 1,427 — (5,187) (5,187)
Return/(loss) per class of share (note 4)
Return per Income share 3.61p 0.90p 4.51p 3.25p — 3.25p 5.77p (0.90)p 4.87pReturn/(loss) per Capital share — 2.51p 2.51p — 2.20p 2.20p — (8.11)p (8.11)p
1 Dividends paid during the six months ended 31st July 2016 of 2.4p (2015: 2.3p) per Income share, amounting to £1,482,000 (2015: £1,420,000).
All revenue and capital items in the above statement derive from continuing operations. No operations were acquired or discontinued in theperiod.
The ‘Total’ column of this statement is the profit and loss account of the Company and the ‘Revenue’ and ‘Capital’ columns representsupplementary information prepared under guidance issued by The Association of Investment Companies.
Income&Growth Half Year pp01-20 29/09/2016 14:11 Page 10
11
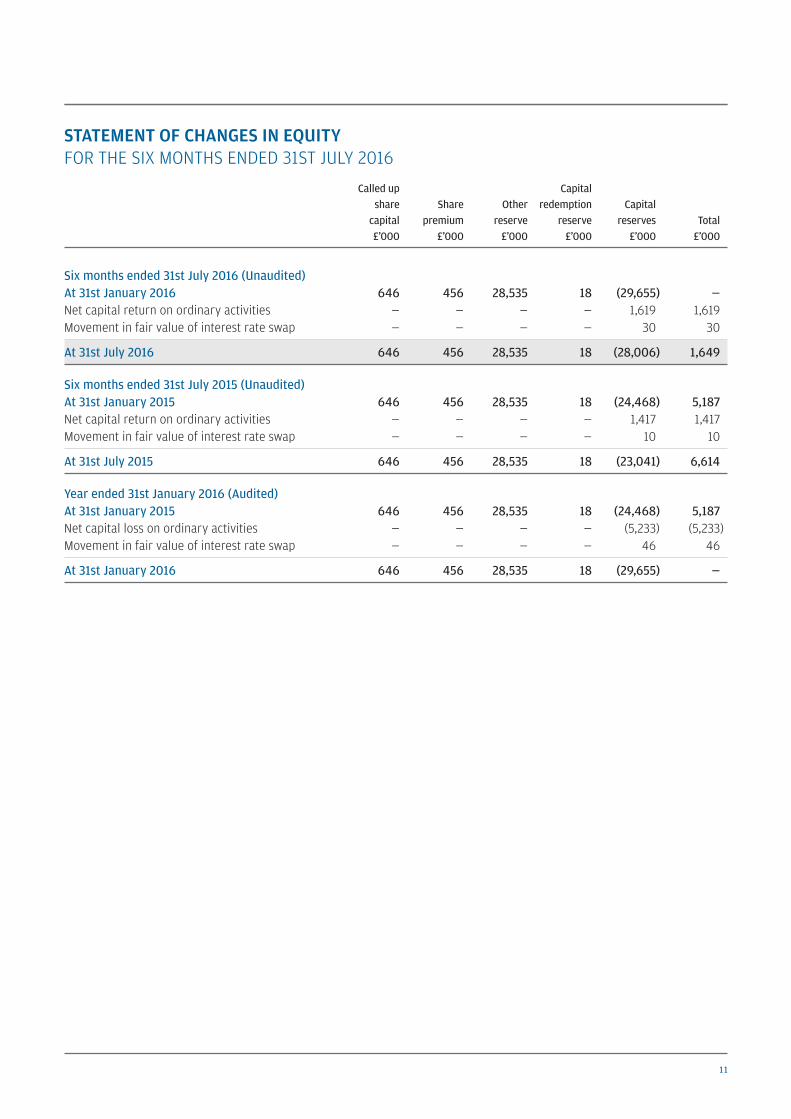
STATEMENT OF CHANGES IN EQUITYFOR THE SIX MONTHS ENDED 31ST JULY 2016
Called up Capital share Share Other redemption Capital capital premium reserve reserve reserves Total £’000 £’000 £’000 £’000 £’000 £’000
Six months ended 31st July 2016 (Unaudited)At 31st January 2016 646 456 28,535 18 (29,655) —Net capital return on ordinary activities — — — — 1,619 1,619Movement in fair value of interest rate swap — — — — 30 30
At 31st July 2016 646 456 28,535 18 (28,006) 1,649
Six months ended 31st July 2015 (Unaudited)At 31st January 2015 646 456 28,535 18 (24,468) 5,187Net capital return on ordinary activities — — — — 1,417 1,417Movement in fair value of interest rate swap — — — — 10 10
At 31st July 2015 646 456 28,535 18 (23,041) 6,614
Year ended 31st January 2016 (Audited)At 31st January 2015 646 456 28,535 18 (24,468) 5,187Net capital loss on ordinary activities — — — — (5,233) (5,233)Movement in fair value of interest rate swap — — — — 46 46
At 31st January 2016 646 456 28,535 18 (29,655) —
Income&Growth Half Year pp01-20 29/09/2016 14:11 Page 11

12 JPMORGAN INCOME & GROWTH INVESTMENT TRUST PLC. HALF YEAR REPORT & ACCOUNTS 2016
STATEMENT OF FINANCIAL POSITIONAT 31ST JULY 2016
(Unaudited) (Unaudited) (Audited) 31st July 2016 31st July 2015 31st January 2016 £’000 £’000 £’000
Fixed assets Investments held at fair value through profit or loss — 92,362 —
Current assetsInvestments held at recoverable value 88,399 — 84,962
Debtors 597 1,396 370Cash and cash equivalents 513 694 2,063
89,509 2,090 87,395
Creditors: amounts falling due within one yearCreditors (236) (1,218) (1,044)Provision for liquidation (248) — (248)Derivative financial liabilities (15) — (45)Bank loan (20,000) — (20,000)Net assets attributable to the Income shareholders (67,361) — (66,058)
Net current assets 1,649 872 —
Total assets less current liabilities 1,649 93,234 —
Creditors: amounts falling due after more than one yearDerivative financial liabilities — (81) —Net assets attributable to the Income shareholders — (66,539) —
Net assets 1,649 6,614 —
Capital and reserves Called up share capital 646 646 646Share premium 456 456 456Other reserve 28,535 28,535 28,535Capital redemption reserve 18 18 18Capital reserves (28,006) (23,041) (29,655)
Total equity shareholders’ funds 1,649 6,614 —
Net asset value per share (note 5)
Income share 109.1p 107.8p 107.0pCapital share 2.6p 10.2p —
Financial Statements continued
Income&Growth Half Year pp01-20 29/09/2016 14:11 Page 12
13
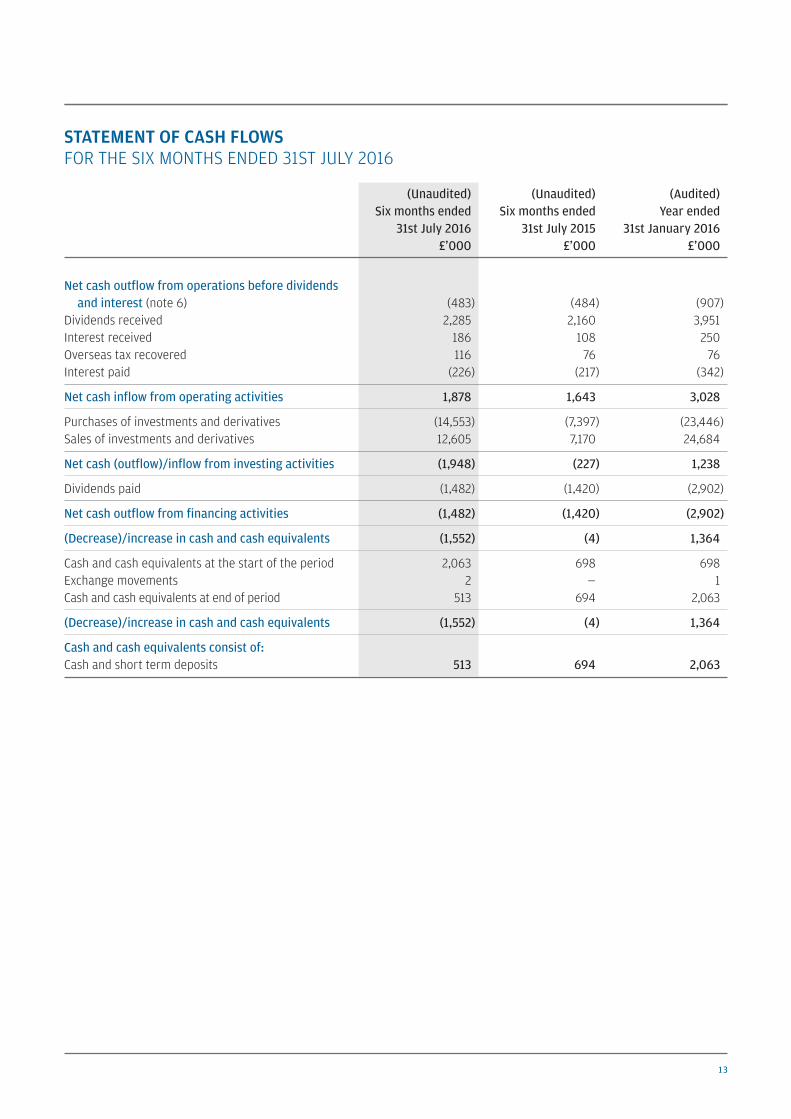
STATEMENT OF CASH FLOWSFOR THE SIX MONTHS ENDED 31ST JULY 2016
(Unaudited) (Unaudited) (Audited) Six months ended Six months ended Year ended 31st July 2016 31st July 2015 31st January 2016 £’000 £’000 £’000
Net cash outflow from operations before dividendsand interest (note 6) (483) (484) (907)
Dividends received 2,285 2,160 3,951Interest received 186 108 250Overseas tax recovered 116 76 76Interest paid (226) (217) (342)
Net cash inflow from operating activities 1,878 1,643 3,028
Purchases of investments and derivatives (14,553) (7,397) (23,446)Sales of investments and derivatives 12,605 7,170 24,684
Net cash (outflow)/inflow from investing activities (1,948) (227) 1,238
Dividends paid (1,482) (1,420) (2,902)
Net cash outflow from financing activities (1,482) (1,420) (2,902)
(Decrease)/increase in cash and cash equivalents (1,552) (4) 1,364
Cash and cash equivalents at the start of the period 2,063 698 698Exchange movements 2 — 1Cash and cash equivalents at end of period 513 694 2,063
(Decrease)/increase in cash and cash equivalents (1,552) (4) 1,364
Cash and cash equivalents consist of:Cash and short term deposits 513 694 2,063
Income&Growth Half Year pp01-20 29/09/2016 14:11 Page 13

14 JPMORGAN INCOME & GROWTH INVESTMENT TRUST PLC. HALF YEAR REPORT & ACCOUNTS 2016
Financial Statements continued
1. Financial statementsThe information contained within the financial statements in this half year report has not been audited or reviewed by the Company'sauditors.
The figures and financial information for the year ended 31st January 2016 are extracted from the latest published financialstatements of the Company and do not constitute statutory accounts for that year. Those financial statements have been delivered tothe Registrar of Companies and included the report of the auditors which was unqualified and did not contain a statement undereither section 498(2) or 498(3) of the Companies Act 2006.
2. Accounting policiesThe financial statements are prepared in accordance with the Companies Act 2006, United Kingdom Generally Accepted AccountingPractice ('UK GAAP'), including FRS 102 'The Financial Reporting Standard applicable in the UK and Republic of Ireland' and theStatement of Recommended Practice 'Financial Statements of Investment Trust Companies and Venture Capital Trusts' (the 'SORP')issued by the Association of Investment Companies in November 2014.
FRS 104, 'Interim Financial Reporting', issued by the Financial Reporting Council ('FRC') in March 2015 has been applied in preparingthis condensed set of financial statements for the six months ended 31st July 2016.
The Company has a fixed life and will be wound up voluntarily on or around 30th November 2016. Therefore, these half year financialstatements have been prepared under the ‘break-up’ basis. Fixed assets have been reclassified as current assets. The market value forinvestments is deemed to be a proxy for recoverable value. Creditors falling due after more than one year have been reclassified ascurrent liabilities.
The accounting policies applied to this condensed set of financial statements are consistent with those applied in the financialstatements for the year ended 31st January 2016.
In March 2016, the FRC published amendments to FRS 102 concerning fair value hierarchy disclosures. These amendments areeffective for accounting periods beginning on or after 1st January 2017. The Company has elected to adopt these amendments early inthese interim financial statements. Full disclosure is given in note 7.
3. Dividends on Income shares (Unaudited) (Unaudited) (Audited) Six months ended Six months ended Year ended 31st July 2016 31st July 2015 31st January 2016 £’000 £’000 £’000
Fourth quarterly dividend of 1.20p (2015: 1.10p) paid in March 741 679 679
First quarterly dividend of 1.20p (2015: 1.20p) paid in June 741 741 741
Second quarterly dividend of 1.20p paid in September n/a n/a 741
Third quarterly dividend of 1.20p paid in December n/a n/a 741
Total dividends paid in the period 1,482 1,420 2,902
A second quarterly dividend of 1.2p (2015: 1.20p) per Income share, amounting to £741,000 (2015: £741,000) has been declaredpayable in respect of the six months ended 31st July 2016. It will be paid on 23rd September 2016 to shareholders on the register atthe close of business on the 25th August 2016.
NOTES TO THE FINANCIAL STATEMENTS FOR THE SIX MONTHS ENDED 31ST JULY 2016
Income&Growth Half Year pp01-20 29/09/2016 14:11 Page 14

15
4. Return per class of share (Unaudited) (Unaudited) (Audited) Six months ended Six months ended Year ended 31st July 2016 31st July 2015 31st January 2016 £’000 £’000 £’000
Return per Income share is based on the following:Net revenue return on ordinary activities
after taxation 745 585 662Add back dividends on Income shares 1,482 1,420 2,902
Revenue return attributable to Income shareholders 2,227 2,005 3,564Capital return attributable to Income shareholders 558 — (558)
Total return attributable to Income shareholders 2,785 2,005 3,006
Weighted average Income shares in issue 61,747,803 61,747,803 61,747,803
Revenue return per Income share 3.61p 3.25p 5.77pCapital return per Income share 0.90p — (0.90)p
Total return per Income share 4.51p 3.25p 4.87p
(Unaudited) (Unaudited) (Audited) Six months ended Six months ended Year ended 31st July 2016 31st July 2015 31st January 2016 £’000 £’000 £’000
Return/(loss) per Capital share is based on the following:
Return/(loss) attributable to Capital shareholders 1,619 1,417 (5,233)
Weighted average Capital shares in issue 64,527,781 64,527,781 64,527,781
Total return/(loss) per Capital share 2.51p 2.20p (8.11)p
Income&Growth Half Year pp01-20 29/09/2016 14:11 Page 15

16 JPMORGAN INCOME & GROWTH INVESTMENT TRUST PLC. HALF YEAR REPORT & ACCOUNTS 2016
Financial Statements continued
5. Net asset value per class of share (Unaudited) (Unaudited) (Audited) Six months ended Six months ended Year ended 31st July 2016 31st July 2015 31st January 2016 £’000 £’000 £’000
Net asset value per Income share is based on the following:
Revenue reserve available for distribution 3,514 2,692 2,769Predetermined capital entitlement 63,847 63,847 63,289
Total assets attributable to Income shareholders 67,361 66,539 66,058
Number of Income shares in issue 61,747,803 61,747,803 61,747,803
Net asset value per Income share 109.1p 107.8p 107.0p
(Unaudited) (Unaudited) (Audited) Six months ended Six months ended Year ended 31st July 2016 31st July 2015 31st January 2016 £’000 £’000 £’000
Net asset value per Capital share is based on the following:
Total assets attributable to Capital shareholders 1,649 6,614 —
Number of Capital shares in issue 64,527,781 64,527,781 64,527,781
Net asset value per Capital share 2.6p 10.2p —
6. Reconciliation of net return on ordinary activities before finance costs and taxation to net cash outflowfrom operations before dividends and interest (Unaudited) (Unaudited) (Audited) Six months ended Six months ended Year ended 31st July 2016 31st July 2015 31st January 2016 £’000 £’000 £’000
Net return/(loss) on ordinary activities before finance costs and taxation 4,642 3,640 (1,789)
(Less capital return)/Add: capital loss beforefinance costs and taxation (2,335) (1,569) 5,487
(Increase)/decrease in accrued income andother debtors (58) (14) 70
Decrease in accrued expenses (46) (23) —Management fee charged to capital (185) (202) (395)Overseas withholding tax (30) (47) (78)Dividends received (2,285) (2,160) (3,951)Interest received (186) (108) (250)Realised loss on foreign currency transactions — (1) (1)
Net cash outflow from operations before dividendsand interest (483) (484) (907)
Income&Growth Half Year pp01-20 29/09/2016 14:11 Page 16

17
7. Fair valuation of financial instrumentsThe fair value hierarchy analysis for financial instruments held at fair value at the period end is as follows:
(Unaudited) (Unaudited) (Audited) Six months ended Six months ended Year ended 31st July 2016 31st July 2015 31st January 2016
Assets Liabilities Assets Liabilities Assets Liabilities£’000 £’000 £’000 £’000 £’000 £’000
Level 1: Quoted prices for identical instruments in active markets 67,033 — 69,603 — 65,131 —
Level 2: Inputs other than quoted prices whichare observable1 21,366 (15) 22,759 (81) 19,831 (45)
Total 88,399 (15) 92,362 (81) 84,962 (45)
1 Represents investments in mutual funds and interest rate swaps.
Income&Growth Half Year pp01-20 29/09/2016 14:11 Page 17
18 JPMORGAN INCOME & GROWTH INVESTMENT TRUST PLC. HALF YEAR REPORT & ACCOUNTS 2016
Shareholder Information
INTERIM MANAGEMENT REPORT
The Company is required to make the following disclosures in itshalf year report:
Principal Risks and UncertaintiesThe principal risks and uncertainties faced by the Company fall intothe following broad categories: investment and strategy; market;accounting, legal and regulatory; corporate governance andshareholder relations; operational; and financial. Information oneach of these areas is given in the Business Review within theAnnual Report and Accounts for the year ended 31st January 2016.
Related Party TransactionsDuring the first six months of the current financial year, notransactions with related parties have taken place which havematerially affected the financial position or the performance of theCompany.
Directors’ ResponsibilitiesThe Board of Directors confirms that, to the best of its knowledge:
(i) the condensed set of financial statements contained within thehalf year financial report has been prepared in accordancewith FRS 104 ‘Interim Financial Reporting’; and
(ii) the interim management report includes a fair review of theinformation required by 4.2.7R and 4.2.8R of the UK ListingAuthority Disclosure and Transparency Rules.
In order to provide these confirmations, and in preparing thesefinancial statements, the Directors are required to:
• select suitable accounting policies and then apply themconsistently;
• make judgements and accounting estimates that arereasonable and prudent;
• state whether applicable UK Accounting Standards have beenfollowed, subject to any material departures disclosed andexplained in the financial statements; and
• prepare the financial statements on the going concern basisunless it is inappropriate to presume that the Company willcontinue in business;
and the Directors confirm that they have done so.
For and on behalf of the Board
Karl SternbergChairman 29th September 2016
Income&Growth Half Year pp01-20 29/09/2016 14:11 Page 18
19
IntroductionThe Company has two classes of shares, Income and Capital. Underthe Company’s Articles of Association, on a return of assets on awinding up of the Company, the Income shares are entitled to all theassets of the Company up to a predetermined capital entitlement of103.4p per Income share, plus any balance of revenue available fordividend payments.
At 31st July 2016, the assets of the Company amounted to£69,010,000 including the balance of revenue amounting to£3,514,000.
Under accounting standards, the Income share class is classified inthe accounts as a liability due to the rights attached to that shareclass, detailed above. The Capital share class, which is the moresubordinate class of shares, is classified as equity.
Income sharesCharacteristics and EntitlementsThe Income shares offer a dividend yield and first call on capital upto a predetermined capital entitlement on winding up.
Income shares will have a maximum capital entitlement of 103.4pper share on any winding-up of the Company. They are also entitledto any undistributed revenue available for dividend payments.
Income shares are entitled to such dividends as the Directors maydetermine to distribute in respect of each financial period. Suchdividends will take the form of quarterly dividends to be declared inFebruary, May, August and November, and paid in March, June,September and December respectively.
Revenue available for dividend paymentsAt 31st July 2016, undistributed revenue amounted to £3,514,000.(before payment of the second quarterly dividend) and has beenallocated in the accounts to the Income shares.
Voting RightsEach holder of Income shares present in person at a generalmeeting will have one vote on a show of hands and, on a poll, eachholder present in person or by proxy will have one vote for eachIncome share held.
Capital sharesCharacteristics and EntitlementsGenerally by virtue of their effective gearing and their lack of yield,Capital shares have limited protection against adverse marketmovements and are therefore classed as high risk securities.Conversely, they are potentially attractive securities to investorsseeking a geared exposure to the capital performance of investmentmarkets.
Capital shares are entitled to be paid an amount, on any winding upof the Company, representing all the surplus net assets afterrepaying the bank loans and any other obligations and meeting thefinal entitlement of the Income shares. The Capital shares have noentitlement to revenue available for dividends.
Voting RightsEach holder of Capital shares present in person at a generalmeeting will have one vote on a show of hands and, on a poll, eachholder present in person or by proxy will have one vote for eachCapital share held.
Units Characteristics and EntitlementsA Unit share comprises one Capital share and one Income share. Onapplication to the Company’s Registrar, these Shares may beseparated into Income shares and Capital shares.
Unit shareholders have the same entitlements and voting rights as ifthey held separately the Income shares and Capital sharescomprised in their Units.
CAPITAL STRUCTURE OF THE COMPANY
Income&Growth Half Year pp01-20 29/09/2016 14:11 Page 19

20 JPMORGAN INCOME & GROWTH INVESTMENT TRUST PLC. HALF YEAR REPORT & ACCOUNTS 2016
GLOSSARY OF TERMS AND DEFINITIONS
Unit net asset value (‘NAV’) total returnReturn to the investor based on the change in the Unit NAV andassuming all dividends quoted ex-dividend in respect of a Unitduring the period were reinvested, without transaction costs, intoUnits at the NAV per Unit at the time the Units were quoted ex-dividend. Note that a Unit comprises one Income share and oneCapital share.
Benchmark returnTotal return on the benchmark, on a mid-market value to mid-market value basis, assuming that all dividends received werereinvested, without transaction costs, in the shares of theunderlying companies at the time the share were quoted ex-dividend.
The benchmark is a recognised index of stocks which should not betaken as wholly representative of the Company’s investmentuniverse. The Company’s investment strategy does not ‘track’ thisindex and consequently, there may be some divergence betweenthe Company’s performance and that of the benchmark.
Capital share net asset value total returnReturn to the investor based on the change in the NAV per Capitalshare.
Capital share price total return Return to the investor based on the change in the Capital sharemid-market price.
Income share net asset value total returnReturn to the investor based on the change in the NAV per Incomeshare and assuming all dividends quoted ex-dividend during theyear were reinvested, without transaction costs, in the Incomeshares at the NAV per Income share at the time the shares werequoted ex-dividend.
Income share price total returnReturn to the investor based on the change in the Income sharemid-market price and assuming all dividends quoted ex-dividendduring the year were reinvested, without transaction costs, in theIncome shares at the time the shares were quoted ex-dividend.
Share price discount/premium to net asset value (‘NAV’) per share
If the share price of an investment trust is lower than the NAV pershare, the shares are said to be trading at a discount. The discountis shown as a percentage of the NAV. The opposite of a discount is apremium. It is more common for an investment trust’s shares totrade at a discount than at premium.
Ongoing ChargesThe Ongoing Charges represent the Company’s management feeand all other operating expenses, excluding finance costs,expressed as a percentage of the average daily net assets duringthe period.
Performance attributionAnalysis of how the Company achieved its recorded performancerelative to its benchmark.
Performance attribution definitions:Stock selectionMeasures the effect of investing in securities to a greater or lesserextent than their weighting in the benchmark, or of investing insecurities which are not included in the benchmark.
Gearing/cash effectMeasures the impact on returns of borrowings or cash balances onthe Company’s relative performance.
Effect of swapThe change in the fair value of the swap contract during the periodchanges the value of total assets and thereby impacts theCompany’s performance.
Management fees/other expensesThe payment of management fees and other expenses reduces thelevel of total assets and therefore has a negative effect on relativeperformance.
Effect of share repurchasesMeasures the effect on relative performance of repurchasing theCompany’s own shares for cancellation at a price which is less thanthe net asset value per share.
Shareholders’ FundsShareholders’ funds are the aggregate value of the total net assetsattributable to both the Capital and Income shareholders.
Shareholders’ Funds Total ReturnReturn to the investors based on the change in shareholders’ fundsand assuming that the cost of all dividends quoted ex-dividend inrespect of the Income shareholders during the year were addedback, without transaction costs, to the value of the shareholders’funds at the end of the month in which the dividends were quotedex-dividend.
Shareholder Information continued
Income&Growth Half Year pp01-20 29/09/2016 14:11 Page 20

21
WHERE TO BUY J.P. MORGAN INVESTMENT TRUSTS
You can invest in a J.P. Morgan investment trust through the following;
1. Directly from J.P. MorganInvestment AccountThe Company’s shares are available in the J.P. Morgan InvestmentAccount, which facilitates both regular monthly investments andoccasional lump sum investments in the Company’s ordinary shares.Shareholders who would like information on the Investment Accountshould call J.P. Morgan Asset Management free on 0800 20 40 20 orvisit its website at am.jpmorgan.co.uk/investor
Stocks & Shares Individual Savings Accounts (ISA)The Company’s shares are eligible investments within a J.P. MorganISA. For the 2016/17 tax year, from 6th April 2016 and ending 5th April2017, the total ISA allowance is £15,240. The shares are also availablein a J.P. Morgan Junior ISA. Details are available from J.P. Morgan AssetManagement free on 0800 20 40 20 or via its website atam.jpmorgan.co.uk/investor
2. Via a third party provider Third party providers include;
Please note this list is not exhaustive and the availability of individualtrusts may vary depending on the provider. These websites are thirdparty sites and J.P. Morgan Asset Management does not endorse orrecommend any. Please observe each site's privacy and cookie policiesas well as their platform charges structure.
3. Through a professional adviserProfessional advisers are usually able to access the products of all thecompanies in the market and can help you find an investment thatsuits your individual circumstances. An adviser will let you know thefee for their service before you go ahead. You can find an adviser atunbiased.co.uk
You may also buy investment trusts through stockbrokers, wealthmanagers and banks.
To familiarise yourself with the Financial Conduct Authority (FCA)adviser charging and commission rules, visit fca.org.uk
AJ BellAlliance Trust SavingsBarclays StockbrokersBestinvestCharles Stanley DirectHargreaves Lansdown
Interactive InvestorJames BrearleyJames HaySelftradeTD DirectThe Share Centre
Income&Growth Half Year pp01-20 29/09/2016 14:11 Page 21

22 JPMORGAN INCOME & GROWTH INVESTMENT TRUST PLC. HALF YEAR REPORT & ACCOUNTS 2016
Fraudsters use persuasive and high-pressure tactics to lure investors into scams. They may offer to sell shares that turn out to beworthless or non-existent, or to buy shares at an inflated price in return for an upfront payment. While high profits are promised, ifyou buy or sell shares in this way you will probably lose your money.
Keep in mind that firms authorised by the FCAare unlikely to contact you out of the blue withan offer to buy or sell shares.
Do not get into a conversation, note the nameof the person and firm contacting you and thenend the call.
Check the Financial Services Register fromwww.fca.org.uk to see if the person and firmcontacting you is authorised by the FCA.
Beware of fraudsters claiming to be from anauthorised firm, copying its website or givingyou false contact details.
Use the firm’s contact details listed on theRegister if you want to call it back.
Call the FCA on 0800 111 6768 if the firm doesnot have contact details on the Register or youare told they are out of date.
Search the list of unauthorised firms to avoid atwww.fca.org.uk/scams.
Consider that if you buy or sell shares from anunauthorised firm you will not have access to theFinancial Ombudsman Service or FinancialServices Compensation Scheme.
Think about getting independent financial andprofessional advice before you hand over anymoney.
Remember: if it sounds too good to be true, itprobably is!
If you are approached by fraudsters please tell theFCA using the share fraud reporting form atwww.fca.org.uk/scams, where you can find outmore about investment scams.
You can also call the FCA Consumer Helpline on0800 111 6768.
If you have already paid money to share fraudstersyou should contact Action Fraud on 0300 123 2040.
5,000 people contact the Financial ConductAuthority about share fraud each year,with victims losing an average of £20,000
1 6
7
8
9
10
2
3
4
5
Beware of share fraud
How to avoid share fraud
Report a scam
In association with:
Financial Conduct Authority
Shareholder Information continued
Income&Growth Half Year pp01-20 29/09/2016 14:11 Page 22

23
Notes
Income&Growth Half Year pp01-20 29/09/2016 14:11 Page 23

24 JPMORGAN INCOME & GROWTH INVESTMENT TRUST PLC. HALF YEAR REPORT & ACCOUNTS 2016
Notes
Income&Growth Half Year pp01-20 29/09/2016 14:11 Page 24

History and life of the CompanyThe Company was incorporated on 20th October 2006 and beganinvesting on 20th December 2006. The Company has a fixed life andwill be wound up voluntarily on 30th November 2016.
Company NumbersCompany registration number: 5973571London Stock Exchange codes:Capital B1G3N00, Income B1G3N11, Units BIG3N22.ISIN numbers: Capital GB00B1G3N007, Income GB00B1G3N114,
Units GB00B1G3N221.Bloomberg Codes:Capital JIGC LN, Income JIGI LN, Units JIGU LN.Reuters Codes:Capital GJICx.L, Income JGICix.L, Units JGIC.U.L.
Market InformationThe net asset value (‘NAV’) per share of each share class is publisheddaily, via the London Stock Exchange. The Company’s shares are listedon the London Stock Exchange and share prices are quoted daily in theFinancial Times, The Times, The Daily Telegraph, The Scotsman and onthe JPMorgan website at www.jpmincomeandgrowth.co.uk, where theshare price is updated every fifteen minutes during trading hours.
Websitewww.jpmincomeandgrowth.co.uk.
Share TransactionsThe Company’s shares may be dealt in directly through a stockbroker orprofessional adviser acting on an investor’s behalf. They may also bepurchased and held through the J.P. Morgan Investment Account,J.P. Morgan ISA and J.P. Morgan Junior ISA. These products are allavailable on the online service at jpmorgan.co.uk/online
Manager and Company SecretaryJPMorgan Funds LimitedCompany’s Registered Office60 Victoria EmbankmentLondon EC4Y 0JPTelephone: 020 7742 4000
For company secretarial and administrative matters, please contactDivya Amin.
DepositaryBNY Mellon Trust & Depositary (UK) LimitedBNY Mellon Centre160 Queen Victoria StreetLondon EC4V 4LA
The Depositary has appointed JPMorgan Chase Bank, N.A. as theCompany’s custodian.
RegistrarsEquiniti LimitedReference 3081Aspect HouseSpencer RoadLancingWest Sussex BN99 6DATelephone: 0371 384 2342
Lines open 8.30 a.m. to 5.30 p.m. Monday to Friday. Calls to thehelpline will cost no more than a national rate call to a 01 or 02number. Callers from overseas should dial +44 121 415 0225.
Notifications of changes of address and enquiries regarding sharecertificates or dividend cheques should be made in writing to theRegistrar quoting reference 1078.
Registered shareholders can obtain further details on their holdings onthe internet by visiting www.shareview.co.uk
Independent AuditorErnst & Young LLPStatutory Auditor25 Churchill PlaceCanary WharfLondon E14 5EY
BrokersWinterflood Securities LimitedThe Atrium BuildingCannon Bridge25 Dowgate HillLondon EC4R 2GA
Savings Product AdministratorsFor queries on the J.P. Morgan Investment Account and J.P. Morgan ISAsee contact details on the back cover of this report.
Information about the Company
FINANCIAL CALENDAR (Final year of life)2016
Financial year end 31st January
Final results announced April
Half year end 31st July
Half year results announced September
Annual General Meeting June
General Meetings and Wind up November
A member of the AIC
25
Income Growth HY_cover_4pp 29/09/2016 14:47 Page IBC1

www.jpmincomeandgrowth.co.uk
Telephone calls may be recorded and monitored for security and training purposes.
J.P. Morgan Helpline
Freephone 0800 20 40 20 or +44 (0) 1268 444470.Telephone lines are open Monday to Friday, 9am to 5.30pm.
GB I116 09/16
Income Growth HY_cover_4pp 29/09/2016 14:47 Page BC2


![Half yearly Performance Conference Call [Company Update]](https://img.dokumen.tips/doc/110x75/577ca7661a28abea748c60dd/half-yearly-performance-conference-call-company-update.jpg)