Embed Size (px)
Citation preview

Half-Year Report 2018
13 July 2018

2 Elisa Corporation | HALF-YEAR REPORT 2018
ELISA HALF-YEAR FINANCIAL REPORT RELEASE 13 JULY 2018 AT 8:30 AM
Half-Year Financial Report January–June 2018 Second quarter 2018
• Revenue amounted to EUR 458 million (445)
• Comparable EBITDA was EUR 157 million (151) and EBIT EUR 98 million (92)
• Reported EBITDA was EUR 160 million (148) and EBIT EUR 101 million (88)
• Comparable earnings per share were EUR 0.47 (0.44), reported EPS EUR 0.49 (0.70)
• Cash flow after investments was EUR 81 million (76)
• Mobile post-paid voice ARPU was EUR 20.4 (20.4 in previous quarter)
• Mobile post-paid voice churn was 17.4 per cent (19.2 in previous quarter)
• Mobile service revenue increased by 1.6 per cent to EUR 201 million (198)
• The number of post-paid mobile subscriptions increased by 8,300 and prepaid subscrip-tions decreased by 1,400 during the quarter
• The number of fixed broadband subscriptions increased by 1,000 during the quarter
• Net debt / EBITDA was 1.9 (1.8 end 2017) and gearing 126 per cent (103 end 2017) January–June 2018
• Revenue was EUR 907 million (861)
• Comparable EBITDA was EUR 312 million (294) and EBIT EUR 195 million (180)
• Reported EBITDA was EUR 313 million (291), and EBIT EUR 196 million (177)
• Comparable earnings per share were EUR 0.94 (0.87) and reported EPS EUR 0.95 (1.13)
• Cash flow after investments was EUR 133 million (139) Key indicators
EUR million 4-6/2018 4-6/2017 Δ % 1-6/2018 1-6/2017 Δ %
Revenue 458 445 2.8 907 861 5.4
EBITDA 160 148 8.3 313 291 7.5
Comparable EBITDA 157 151 4.1 312 294 6.1
EBIT 1) 101 88 13.8 196 177 10.5
Profit before tax 1) 95 129 -26.1 184 213 -13.4
EPS, EUR 0.49 0.70 -30.8 0.95 1.13 -15.8
Comparable EPS, EUR 0.47 0.44 6.2 0.94 0.87 8.7
Capital expenditure 61 64 -5.0 114 117 -3.1 1) Comparable figures 4-6/2018: EBIT EUR 98m (92), profit before tax EUR 92m (87). Comparable 1-6/2018: EBIT EUR 195m (180), profit before tax EUR 184m (171).
Financial position and cash flow
EUR million 30 Jun 2018 30 Jun 2017 End 2017
Net debt 1,201 1,231 1,073
Net debt / EBITDA1) 1.9 2.1 1.8
Gearing ratio, % 125.9 140.0 103.2
Equity ratio, % 37.0 34.3 40.5
EUR million 4-6/2018 4-6/2017 Δ % 1-6/2018 1-6/2017 Δ %
Cash flow after invest-ments
81
76
7.3
133
139
-3.9
1) (interest-bearing debt – financial assets) / (four previous quarters’ comparable EBITDA) Additional key performance Indicators are available at elisa.com/investors (Elisa Operational Data.xlsx)

3 Elisa Corporation | HALF-YEAR REPORT 2018
CEO Veli-Matti Mattila: Earnings continued to grow thanks to improved competitiveness In the second quarter of the year, our revenue and earnings grew year-on-year. The period was the best second quarter in our history. The result improved mainly due to the growth in mobile service revenue and digital services as well as Elisa’s improved operational productivity. Finland is leading the way of a mobile life, in which mobile data is affordable and easy to use. Finnish people are clear pioneers in the use of mobile data. Elisa will enable this to continue by making the world’s first 5G video call between two countries with commercial 5G network equipment and devices. In addition to Tampere, 5G-ready networks have already been built in Turku and its surroundings. The construction of a 5G-ready network in Jyväskylä began in June. A 5G-era subscription is available for 25 per cent of the population with maximum speed of 600 Mbit/s. Fast mobile broadband subscriptions continue to grow in popularity among consumers, corporate customers and organisations. The post-paid mobile subscription base grew by 8,300 subscriptions during the quarter, while the prepaid subscription base reduced by 1,400 subscriptions. The fixed-network broadband subscription base grew by 1,000 subscriptions. The Finnish Communications Regulatory Authority (FICORA) has made a statistic on the number of the most significant network disturbances of operators in 2017. Elisa’s share of the total network disturbances of all operators is notably small and clearly smaller than Elisa’s market share. The long-term development of customer experience and quality, by artificial intelligence, for example, has resulted in a significant reduction of Elisa’s network disturbances and given the company a clear lead in FICORA’s statistics. The selection of Elisa Viihde continued to expand. The EU regulation which took effect at the beginning of April guarantees that the Elisa Viihde service is available in all 28 EU countries. The filming of a new original series, the crime drama Kaikki synnit, began during the quarter. The filming of the second season of the popular comedy series Kolmistaan is also underway. Finland’s first nationwide NB-IoT (Narrowband Internet of Things) readiness enabled the new technology’s testing with more than fifty companies. The NB-IoT allows data collection from different devices, for example from sensors. These NB-IoT applications will be able to take advantage of the 5G network’s growing capacity in the future. We opened the Elisa AI Co-Creation Challenge for world-class artificial intelligence teams. The teams are developing business by exploiting Elisa’s data. The challenge will culminate at Slush in December, when awards will be given to the winners. The continuous improvement of the customer experience and quality are an integral part of our corporate culture, and we will continue to keep a strong focus on them. Increasing productivity, internationalising our digital services, creating value with data, and our strong investment capability will continue to create a solid foundation for the creation of competitive value in the future.

4 Elisa Corporation | HALF-YEAR REPORT 2018
HALF-YEAR FINANCIAL REPORT JANUARY–JUNE 2018
The interim report has been prepared in accordance with the IAS 34 standard. The information presented in this interim report is unaudited.
Market situation The competitive environment has been intense and active. Mobile churn levels are high due to continued campaigning. Smartphone sales in the second quarter has continued to grow. Also, strong demand for data and higher 4G speeds has continued. The competition in the fixed broadband market has continued to be intense in multi-dwelling units. The number and usage of traditional fixed network subscriptions is decreasing. The markets for IT and IPTV entertainment services have continued to develop favourably. The demand for other digital services is also growing.
Revenue, earnings and financial position Revenue and earnings:
EUR million 4-6/2018 4-6/2017 Δ % 1-6/2018 1-6/2017 Δ %
Revenue 458 445 2.8 907 861 5.4 EBITDA 160 148 8.3 313 291 7.5 Comparable EBITDA1) 157 151 4.1 312 294 6.1 EBITDA-% 34.9 33.1 34.5 33.8 Comparable EBITDA-% 34.3 33.8 34.4 34.2 EBIT 101 88 13.8 196 177 10.5 Comparable EBIT 98 92 6.6 195 180 8.2 EBIT-% 22.0 19.9 21.6 20.6 Comparable EBIT-% 21.3 20.6 21.5 20.9 Return on equity, %2) 30.1 33.0 30.1 33.0
1) 4-6/2018 one-off item relates to sales gain of EUR 5.5m of divested businesses and restructuring costs relating to personnel reductions of EUR -2.5m and 1-6/2018 to sales gain of EUR 5.5m of divested businesses and restructur-ing costs relating to personnel reductions of EUR -4.7m 2) Last four quarters’ profit / average of last four quarters’ equity. Change is calculated using exact figures prior to rounding.
Second quarter 2018 Revenue increased by 3 per cent on the previous year. Growth in mobile services and digital services in both customer segments, as well as Estonian business and equipment sales affected revenue positively. However, growth in mobile revenue decelerated due to continued campaigning. Decrease in usage and subscriptions of traditional fixed telecom services in both segments, divestments and lower interconnection and roaming revenue in Finland affected revenue negatively. Comparable EBITDA increased by 4 per cent, mainly due to revenue growth and efficiency improvement. Comparable EBIT grew by 7 per cent. Net financial income and expenses totalled EUR -5 million (+40, including sale of Comptel shares of EUR 44 million). Income taxes in the income statement were EUR -17 million (-17). Comparable net profit was EUR 75 million (70) and earnings per share EUR 0.47 (0.44). Reported net profit was EUR 78 million (112) and earnings per share (EPS) were EUR 0.49 (0.70). January–June 2018 Revenue increased by 5 per cent on the previous year. Recent acquisitions, growth in mobile services and digital services in both customer segments, equipment sales, as well as Estonian business, affected revenue positively. Decrease in usage and subscriptions of traditional fixed

5 Elisa Corporation | HALF-YEAR REPORT 2018
telecom services in both segments, divestments as well as lower roaming and interconnection revenue in Finland affected revenue negatively. Comparable EBITDA increased by 6 per cent, mainly due to efficiency improvements and revenue growth. Comparable EBIT grew by 8 per cent. Net financial income and expenses were EUR -11 million (+36, including sale of Comptel shares of EUR 44 million). Income taxes in the income statement were EUR -32 million (-32). Comparable net profit was EUR 151 million (139) and earnings per share EUR 0.94 (0.87). Reported net profit was EUR 152 million (181) and earnings per share (EPS) EUR 0.95 (1.13). Financial position
EUR million 30 Jun 2018 30 Jun 2017 End 2017
Net debt 1,201 1,231 1,073 Net debt / EBITDA1) 1.9 2.1 1.8 Gearing ratio, % 125.9 140.0 103.2
Equity ratio, % 37.0 34.3 40.5
EUR million 4-6/2018 4-6/2017 Δ % 1-6/2018 1-6/2017 Δ %
Cash flow after investments2)
81
76
7.3
133
139
-3.9
1) (interest-bearing debt – financial assets) / (four previous quarters’ comparable EBITDA) 2) Excluding share investments and sale of Comptel shares in 2017 4-6/18 EUR 87m, 4-6/17 EUR 65m, 1-6/18 EUR 140m and 1-6/17 EUR 131m. Change is calculated using exact figures prior to rounding.
Second quarter Cash flow after investments increased by 7 per cent to EUR 81 million mainly due to higher EBITDA and positive change in Net Working Capital. January–June 2018 Cash flow after investments decreased by -4 per cent to EUR 133 million. Higher EBITDA and positive change in Net Working Capital affected cash flow positively. Higher paid taxes, net financial expenses and investments affected cash flow negatively. The financial position and liquidity are good. Net debt was EUR 1,201 million. Cash and undrawn committed credit lines totalled EUR 360 million at the end of the quarter.
Changes in corporate structure In March Elisa’s fully owned subsidiary Tampereen Tietoverkko Oy merged into Elisa. In April Elisa purchased 70 per cent share of Video streaming technology and services company Kepit Systems Oy. In May Elisa divested corporate clients' outsourced customer service and corporate switchboard businesses to Oy Eniro Finland Ab. In June Elisa and Elisa Appelsiini signed a merger agreement according to which Elisa Appelsiini will merge into Elisa in December 2018. In June Elisa purchased the 2.6 GHz Band 38 from Ukkoverkot Oy and agreed to rent the capacity to Ukkoverkot for their business use in a few geographical areas. Elisa uses the spectrum to increase capacity in the mobile network. In the transaction Elisa acquired Ukkonet Oy's share capital from Ukkoverkot. Ukkonet manages the license and it was consolidated into the Elisa as of 1 July 2018.

6 Elisa Corporation | HALF-YEAR REPORT 2018
Elisa’s ownership in Sulake has decreased to 49 per cent by directed share issue to Orangegames Holding B.V. Sulake runs Habbo and Hideaway social gaming platforms. Elisa has an option to decrease its ownership further to 39 per cent.
Consumer Customers business
EUR million 4-6/2018 4-6/2017 Δ % 1-6/2018 1-6/2017 Δ %
Revenue 286 278 2.9 565 539 4.9 EBITDA 103 97 5.9 203 189 7.6 Comparable EBITDA 102 99 2.6 202 191 5.9 EBITDA-% 36.0 35.0 36.0 35.0 Comparable EBITDA-% 35.7 35.8 35.8 35.5 EBIT 66 61 7.8 130 119 8.7 Comparable EBIT 65 64 2.6 129 122 6.0 CAPEX 41 43 -5.4 76 78 -2.3
Change is calculated using exact figures prior to rounding
Second quarter Revenue increased by 3 per cent. Growth in mobile services and digital services and equipment sales affected revenue positively. However, growth in mobile revenue decelerated due to continued campaigning. Lower interconnection and roaming revenue in Finland, decrease in traditional fixed network usage and subscriptions affected revenue negatively. Comparable EBITDA increased by 3 per cent, mainly due to revenue growth and productivity improvements. January–June 2018 Revenue increased by 5 per cent, mainly due to recent acquisitions, growth in mobile services, equipment sales and digital services. Lower roaming and interconnection revenue in Finland, decrease in traditional fixed network usage and subscriptions affected revenue negatively. Comparable EBITDA increased by 6 per cent, mainly due to revenue growth and productivity improvements.
Corporate Customers business
EUR million 4-6/2018 4-6/2017 Δ % 1-6/2018 1-6/2017 Δ %
Revenue 172 167 2.5 342 322 6.2 EBITDA 57 50 13.0 110 102 7.4
Comparable EBITDA 55 51 6.9 110 103 6.5
EBITDA-% 33.2 30.1 32.2 31.8
Comparable EBITDA-% 31.9 30.6 32.2 32.1
EBIT 35 27 27.1 66 58 14.2 Comparable EBIT 32 28 15.4 66 59 12.6 CAPEX 20 21 -4.3 38 39 -4.6
Change is calculated using exact figures prior to rounding
Second quarter Revenue increased by 3 per cent. Growth in mobile and digital services, as well as equipment sales affected revenue positively. Decrease in traditional fixed network usage and subscriptions as well as lower interconnection revenue in Finland, as well as divested businesses affected revenue negatively. Comparable EBITDA grew by 7 per cent mainly due to growth in revenue and productivity improvements. January–June 2018 Revenue increased by 6 per cent. Recent acquisitions, growth in mobile and digital services, as well as equipment sales affected revenue positively. Decrease in traditional fixed network usage and subscriptions as well as lower interconnection and roaming revenue in Finland, as well as

7 Elisa Corporation | HALF-YEAR REPORT 2018
divestments affected revenue negatively. Comparable EBITDA increased by 7 per cent mainly due to growth in revenue and productivity improvements.
Personnel In January–June, the average number of personnel at Elisa was 4,661(4,521). Employee expenses totalled EUR 161 million (153). In the second quarter, employee expenses were EUR 80 million (79). Personnel by segment at the end of the period:
30 Jun 2018 30 Jun 2017 End 2017
Consumer Customers 2,906 2,806 2,793 Corporate Customers 1,955 1,918 1.922 Total 4,861 4,724 4,715
Investments
EUR million 4-6/2018 4-6/2017 1-6/2018 1-6/2017
Capital expenditures, of which - Consumer Customers - Corporate Customers
61 41 20
64 43 21
114 76 38
117 78 39
Shares 6 102 6 102
Total 67 166 120 219
The main capital expenditures related to the capacity and coverage increases in the 4G networks, as well as to other network and IT investments. Second quarter and first half year 2017 capital expenditure includes a licence fee of EUR 4 million relating to Estonian 2,600 MHz auction. Investments in shares in 2018 relate to Kepit Systems and Ukkonet, and in 2017 mainly to Elisa Teleteenused (Starman) and Santa Monica Networks.
Financing arrangements and ratings Valid financing arrangements
EUR million Maximum amount In use on 30 Jun 2018
Committed credit limits 300 0 Commercial paper programme¹) 350 267 EMTN programme²) 1,000 780
1) The programme is not committed 2) European Medium Term Note programme, not committed
Long-term credit ratings
Credit rating agency Rating Outlook
Moody’s Investor Services Baa2 Stable S&P Global Ratings BBB+ Stable

8 Elisa Corporation | HALF-YEAR REPORT 2018
Shares
Share trading volumes are based on trades made on the Nasdaq Helsinki and alternative marketplaces. Closing prices are based on the Nasdaq Helsinki.
Trading of shares 4-6/2018 4-6/2017 1-6/2018 1-6/2017
Nasdaq Helsinki, millions 22,6 29,6 52,1 56,3 Other marketplaces, millions1) 57,5 58,1 103,2 94,2
Total volume, millions 80,2 87,7 155,3 150,5 Value, EUR million 3,022.8 2,925.7 5,615.5 4,927.6 % of shares 48 52 93 90
Shares and market values 30 Jun 2018 30 Jun 2017 End 2017
Total number of shares 167,335,073 167,335,073 167,335,073 Treasury shares 7,572,854 7,796,803 7,801,397 Outstanding shares 159,762,219 159,538,270 159,533,676 Closing price, EUR 39.67 33.15 32.72 Market capitalisation, EUR million 6638 5,547 5,475 Treasury shares, % 4.53 4.66 4.66
1) Other marketplaces based on the Fidessa Fragmentation Index.
Number of shares Total number of shares
Treasury shares Outstanding shares
Shares at 31 Dec 2017 167,335,073 7,801,397 159,533,676 Performance Share Plan 5 Feb 20181)
-228,543 228,543
Shares at 30 Jun 2018 167,335,073 7,572,854 159,762,219 1)
Stock exchange bulletin 5 February 2018
Significant legal and regulatory issues In March 2018 the Finnish Communications Regulatory Authority issued significant market power decisions concerning local loop and bitstream markets. Elisa appealed FICORA’s decision. In June, the Supreme Administrative Court decided not to give prohibition of enforcement to Elisa relating to FICORA's significant market power decision of 15 March 2018. In April, FICORA granted Elisa a new license to apply surcharges for consumer customer data roaming in EU and EEA countries. The new license became valid on 15 June 2018, and is valid until 14 June 2019. In May, Estonian Technical Surveillance Agency granted Elisa Eesti AS a new license to apply surcharges for customer roaming in EU and EEA countries. The new license became valid on 15 June 2018, and is valid until 14 June 2019. A court claim that one shareholder had brought relating to Anvia Oyj’s Extraordinary General Meeting decision in June 2016 approving the sale of Anvia’s ICT businesses to Elisa, has since been withdrawn from the district court. In June, the European Parliament, the Council and the Commission reached a political agree-ment to update the EU's telecoms rules. The official decisions will be made later this year. EU’s new legislation relates among other things to frequencies, market regulation, users’ rights and universal service. In addition, the renewal includes the retail regulation of intra-EU calls and text messages, which is expected to enter into force in May 2019. This retail regulation could have some financial effects on Elisa.

9 Elisa Corporation | HALF-YEAR REPORT 2018
Substantial risks and uncertainties associated with Elisa’s operations Risk management is part of Elisa’s internal control system. It aims to ensure that risks affecting the company’s business are identified, influenced and monitored. The company classifies risks into strategic, operational, hazard and financial risks. Strategic and operational risks: The telecommunications industry is under intense competition in Elisa’s main market areas, which may have an impact on Elisa’s business. The telecommunications industry is subject to heavy regulation. Elisa and its businesses are monitored and regulated by several public authorities. This regulation also affects the price level of some products and services offered by Elisa, and may also require investments that have long payback times. Elisa processes different kinds of data including personal and traffic data. Therefore the applicable data protection legislation especially General Data Protection Regulation has a significant impact on Elisa and its businesses. The rapid developments in telecommunications technology may have a significant impact on Elisa’s business. Elisa’s main market is Finland, where the number of mobile phones per inhabitant is among the highest in the world, and growth in subscriptions is thus limited. Furthermore, the volume of phone traffic on fixed network has decreased during the last few years. These factors may limit opportunities for growth. Hazard risks: The company’s core operations are covered by insurance against damage and interruptions caused by accidents and disasters. Accident risks also include litigation and claims. Financial risks: In order to manage the interest rate risk, the Group’s loans and investments are diversified into fixed- and variable-rate instruments. Interest rate swaps can be used to manage the interest rate risk. As most of Elisa's operations and cash flow are denominated in euros, the exchange rate risk is minor. The objective of liquidity risk management is to ensure the Group’s financing in all circumstances. Elisa has cash reserves, committed credit facilities and a sustainable cash flow to cover its foreseeable financing needs. Liquid assets are invested within confirmed limits in financially solid banks, domestic companies and institutions. Credit risk concentrations in accounts receivable are minor, as the customer base is broad. A detailed description of financial risk management can be found in Note 34 to the Annual Report 2017.
Events after the financial period In July, the Finnish Government adopted decisions on the main conditions of the 3.5 GHz spectrum auction. The maximum amount of frequencies is limited to 130 MHz per operator (total 3.5 GHz band is 390 MHz) and the reserve price of the total 390 MHz frequency band is EUR 65 million. The auction is expected to take place in the second half of the year, and the 3.5 GHz frequencies are expected to be in mobile broadband use in the beginning of 2019.
10 Elisa Corporation | HALF-YEAR REPORT 2018
Outlook and guidance for 2018
The macroeconomic environment in Finland has improved, but long-term structural challenges still remain. Competition in the Finnish telecommunications market remains challenging. Revenue is estimated to be at the same level or slightly higher than in 2017. Recent acquisitions, mobile data and digital services are expected to increase revenue. Comparable EBITDA is anticipated to be at the same level or slightly higher than in 2017. Capital expenditure is expected to be a maximum of 12 per cent of revenue. Elisa is continuing its productivity improvement development, for example by increasing automation and data analytics in different processes, such as customer interactions, network operations and delivery. Additionally, Elisa’s continuous quality improvement measures will increase customer satisfaction and efficiency, and reduce costs. Elisa's transformation into a provider of exciting, new and relevant services for its customers is continuing. Long-term growth and profitability improvement will derive from the growth in the mobile data market, as well as digital online and ICT services. BOARD OF DIRECTORS

11 Elisa Corporation | HALF-YEAR REPORT 2018
Unaudited
Consolidated Income Statement
4-6 4-6 1-6 1-6 1-12
EUR million Note 2018 2017 2018 2017 2017
Revenue 1 457,5 445,1 907,1 861,0 1 787,4
Other operating income 6,0 0,8 7,1 1,5 5,7
Materials and services -176,5 -170,0 -346,4 -326,8 -695,6
Employee expenses -79,6 -79,4 -161,3 -153,4 -304,0
Other operating expenses -47,6 -49,1 -93,3 -91,0 -185,8
EBITDA 1 159,8 147,5 313,2 291,3 607,7
Depreciation, amortisation and impairment 1 -59,2 -59,1 -117,5 -114,3 -229,7
EBIT 1 100,6 88,4 195,6 177,0 378,0
Financial income 0,7 46,3 1,2 47,5 49,1
Financial expense -6,2 -6,0 -12,4 -11,6 -23,9
Share of associated companies' profit 0,0 0,0 0,0 0,0 0,0
Profit before tax 95,0 128,6 184,4 213,0 403,2
Income taxes -17,5 -16,6 -32,4 -32,3 -66,5
Profit for the period 77,6 112,0 152,0 180,6 336,7
Attributable to
Equity holders of the parent 77,5 112,0 152,0 180,5 336,6
Non-controlling interests 0,0 0,1 0,0 0,1 0,1
77,6 112,0 152,0 180,6 336,7
Earnings per share (EUR)
Basic 0,49 0,70 0,95 1,13 2,11
Diluted 0,49 0,70 0,95 1,13 2,11
Average number of outstanding shares (1000 shares)
Basic 159 762 159 647 159 717 159 692 159 607
Diluted 159 762 159 647 159 717 159 692 159 607
Consolidated Statement of Comprehensive Income
Profit for the period 77,6 112,0 152,0 180,6 336,7
Other comprehensive income, net of tax
Items which may be reclassified subsequently to profit or loss
Other investments -44,3 -34,7 -34,7
Cash flow hedge 0,4 0,2 0,5 -0,1 0,3
Translation difference -0,1 -0,1 0,0 0,0 -0,2
0,3 -44,2 0,5 -34,8 -34,6
Items which are not reclassified subsequently to profit or loss
Remeasurements of the net defined benefit liability 0,3
Total comprehensive income 77,9 67,9 152,5 145,8 302,4
Total comprehensive income attributable to
Equity holders of the parent 77,9 67,8 152,5 145,7 302,4
Non-controlling interest 0,0 0,1 0,0 0,1 0,1
77,9 67,9 152,5 145,8 302,4
12 Elisa Corporation | HALF-YEAR REPORT 2018
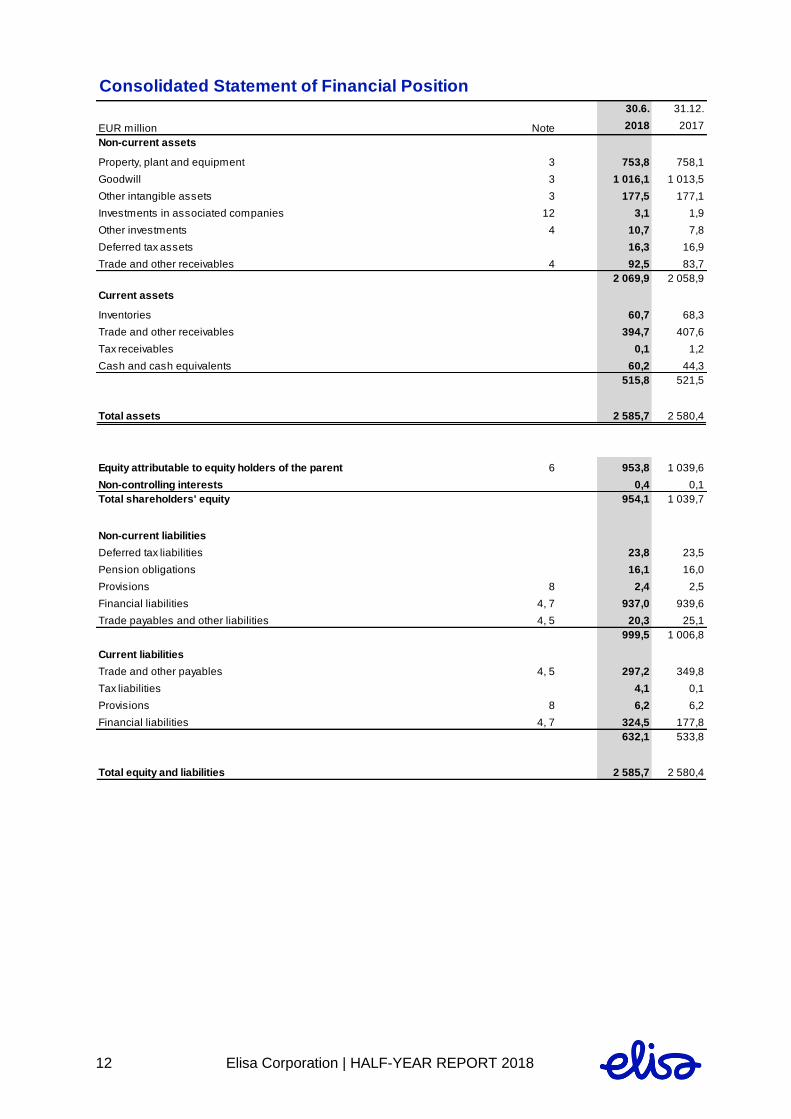
Consolidated Statement of Financial Position
30.6. 31.12.
EUR million Note 2018 2017
Non-current assets
Property, plant and equipment 3 753,8 758,1
Goodwill 3 1 016,1 1 013,5
Other intangible assets 3 177,5 177,1
Investments in associated companies 12 3,1 1,9
Other investments 4 10,7 7,8
Deferred tax assets 16,3 16,9
Trade and other receivables 4 92,5 83,7
2 069,9 2 058,9
Current assets
Inventories 60,7 68,3
Trade and other receivables 394,7 407,6
Tax receivables 0,1 1,2
Cash and cash equivalents 60,2 44,3
515,8 521,5
Total assets 2 585,7 2 580,4
Equity attributable to equity holders of the parent 6 953,8 1 039,6
Non-controlling interests 0,4 0,1
Total shareholders' equity 954,1 1 039,7
Non-current liabilities
Deferred tax liabilities 23,8 23,5
Pension obligations 16,1 16,0
Provisions 8 2,4 2,5
Financial liabilities 4, 7 937,0 939,6
Trade payables and other liabilities 4, 5 20,3 25,1
999,5 1 006,8
Current liabilities
Trade and other payables 4, 5 297,2 349,8
Tax liabilities 4,1 0,1
Provisions 8 6,2 6,2
Financial liabilities 4, 7 324,5 177,8
632,1 533,8
Total equity and liabilities 2 585,7 2 580,4

13 Elisa Corporation | HALF-YEAR REPORT 2018
Condensed Consolidated Statement of Cash Flows
1-6 1-6 1-12
EUR million 2018 2017 2017
Cash flow from operating activities
Profit before tax 184,4 213,0 403,2
Adjustments
Depreciation, amortisation and impairment 117,5 114,3 229,7
Other adjustments -4,8 -37,3 -28,7
112,8 77,0 201,0
Change in working capital
Increase (-) / decrease (+) in trade and other receivables 25,9 -11,4 -59,2
Increase (-) / decrease (+) in inventories 7,9 -5,6 -10,5
Increase (+) / decrease (-) in trade and other payables -30,5 13,0 45,0
3,2 -4,1 -24,7
Financial items, net -12,0 -9,6 -15,1
Taxes paid -29,6 -26,2 -63,6
Net cash flow from operating activities 258,8 250,1 500,8
Cash flow from investing activities
Capital expenditure -120,3 -119,4 -254,8
Investments in shares and business combinations -4,7 -36,5 -39,5
Loans granted -1,5
Repayment of loan receivables 44,8
Proceeds from asset disposal 1,1 44,7 48,4
Net cash used in investing activities -125,4 -111,3 -201,1
Cash flow before financing activities 133,4 138,8 299,7
Cash flow from financing activities
Proceeds from long-term borrowings 169,7 169,8
Repayment of long-term borrowings -4,6 -4,6 -11,1
Increase (+) / decrease (-) in short-term borrowings 152,0 -48,0 -214,0
Repayment of finance lease liabilities -1,8 -1,8 -3,8
Acquisition of non-controlling interests -1,2 -1,2
Dividends paid -263,1 -239,5 -239,6
Net cash used in financing activities -117,5 -125,4 -299,9
Change in cash and cash equivalents 15,9 13,4 -0,2
Cash and cash equivalents at the beginning of period 44,3 44,5 44,5
Cash and cash equivalents at the end of period 60,2 57,8 44,3

14 Elisa Corporation | HALF-YEAR REPORT 2018
Consolidated Statement of Changes in Equity
Reserve for
invested
non- Non-
Share Treasury restricted Other Retained controlling Total
EUR million capital shares equity reserves earnings interests equity
Balance at 1 January 2017 83,0 -142,9 90,9 405,7 534,1 0,5 971,3
Profit for the period 180,5 0,1 180,6
Translation differences 0,0 0,0
Other investments -34,7 -34,7
Cash flow hedge -0,1 -0,1
Total comprehensive income -34,8 180,5 0,1 145,8
Dividend distribution -239,6 -0,3 -240,0
Share-based compensation 2,6 3,3 5,9
Acquisition of non-controlling interests without a change in control -1,1 -0,1 -1,2
Other changes -2,6 0,0 -2,6
Balance at 30 June 2017 83,0 -140,2 90,9 370,9 474,5 0,1 879,2
EUR million
Balance at 1 January 2018 83,0 -140,2 90,9 371,6 634,2 0,1 1 039,7
Adoption of IFRS 15 7,5 7,5
Adoption of IFRS 9 4,2 4,2
Adoption of amendment to IFRS 2 14,5 14,5
Balance at 1 January 2018 83,0 -140,2 90,9 371,6 660,4 0,1 1 065,9
Profit for the period 152,0 0,0 152,0
Translation differences 0,0 0,0
Cash flow hedge 0,5 0,5
Total comprehensive income 0,5 152,0 0,0 152,5
Dividend distribution -263,6 -263,6
Share-based compensation 4,5 -0,1 4,4
Acquisition of non-controlling interests 0,2 0,2
Other changes -5,3 -5,3
Balance at 30 June 2018 83,0 -135,7 90,9 372,2 543,3 0,4 954,1

15 Elisa Corporation | HALF-YEAR REPORT 2018
Notes
ACCOUNTING PRINCIPLES
The Interim consolidated financial statements are in compliance with IAS 34 Interim Financial Reporting. The information
has been prepared in accordance with International Financial Reporting Standards (IFRS) effective at the time of preparation
and adopted for use by the European Union. Apart from the changes in accounting principles stated below, the accounting
principles applied in the interim report are the same as in the financial statements at 31 December 2017.
Changes in the accounting principles
The Group adopted the following standards, amendments to standards and interpretations as of 1 January 2018:
• IFRS 15 Revenue from Contracts with Customers . The standard includes a five-step model for the revenue recognition.
Revenue is allocated to performance obligations based on relative transaction prices. Revenue recognition takes place over
time or at a specific point in time, and the key criterion is the passing of control.
In the transition, Elisa has applied a modified retrospective approach, which means that contracts that are not completed by
1 January 2018 are treated as if they had been recognised in accordance with IFRS 15 from the very beginning. The
cumulative effect arising from the transition, EUR 7.5 million, is recognised as an adjustment to the opening balance of
retained earnings. The opening balance of short-term receivables increased by EUR 10.3 million, deferred tax assets
increased by EUR 0.1 million, short-term liabilities increased by EUR 0.8 million and deferred tax liabilities increased by
EUR 2.0 million. The comparison year is not restated.
The Group's fixed-term service agreements are recognised during the agreement period, and as an exception from the
previous recognition principles, opening fees for fixed-term service agreements and related expenses are allocated for the
entire agreement period. Sales commissions and discounts on fixed-term service agreements are also allocated for the
entire agreement period. The adjustment to retained earnings of EUR 4.5 million relates to the sales commissions. The
adjustment of retained earnings relating to the discounts, opening fees and related expenses is EUR 3.0 million.
According to the IFRS 15 standard and the Group's previous principles, service agreements valid until further notice are
recognised over time, and sales revenue is recognised less any discounts granted. The opening fees for service
agreements and related expenses are recognised at the time when the service is connected. The change does not impact
on the revenue recognition of the Group's agreements valid until further notice.
The impact of the IFRS 15 standard on the Group's revenue for 1-6/2018 is EUR -0.1 million and on EBITDA EUR -0.3
million. As at 30 June 2018 contract assets are EUR 9.9 million and contract liabilities EUR 0.1 million. The change to the
standard does not influence the cash flow.
• IFRS 9 Financial Instruments . The new standard includes guidance on the classification and measurement of financial
instruments, including new hedge accounting requirements and a new expected credit loss model for calculating
impairment on financial assets.
According to the new standard, in situations where the terms of the financial liability measured at amortised cost change
such that the change does not result in derecognition of the financial liability, the Group must still recognise a gain or loss,
which is calculated as the difference between the original contractual cash flows and the modified contractual cash flows,
discounted at the original effective interest rate. According to the previous IAS 39 standard, the difference between cash
flows was amortised over the residual maturity of the financial liability by determining the new effective interest rate.
With the implementation of IFRS 9 the Group's financial assets and liabilities are classified as financial assets and
liabilities measured at amortised cost, financial assets and liabilities measured at fair value through other comprehensive
income and financial assets and liabilities measured at fair value through profit or loss. Financial assets and liabilities
measured at amortised cost include the fixed term contracts whose cash flow include payments of principal and interest on
the principal amount outstanding. Financial asset and liabilities measured at fair value through other comprehensive
income include those financial items that are expected both to collect contractual cash flows and sell financial assets.
Financial assets and liabilities measured at fair value through profit or loss include items that do not meet the criteria of
other groups.
The cumulative effect of EUR 4.2 million arising from the transition is recognised as an adjustment to the opening balance
of retained earnings. Of this, EUR -0.5 million is due to the change in bad debt provision and related deferred tax assets and
EUR 4.6 million due to the change in financial liabilities measured at amortised cost and related deferred tax liabilities.
The change does not have a significant impact on the Group's profit for the period, and it will not influence the cash flow.

16 Elisa Corporation | HALF-YEAR REPORT 2018
• Amendment to IFRS 2 Share-based Payments . The amendment concerns incentive schemes with net settlement features
to cover withholding tax obligations and where the employer has an obligation to withhold tax from the received benefit on
the share-based payment. The previous standard requires the entity to divide the payment into an equity-settled component
and a cash-settled component. According to the new IFRS 2, compensation costs will be recognised for such payments
based on the entire scheme being an equity-settled payment. Compensation costs are recognised based on the number of
gross shares awarded, in spite of the employee ultimately only receiving the net shares and the Group paying the portion
required to meet the withholding obligations to the tax authority in cash. The withholding paid by the Group to the tax
authority is recognised directly in equity.
The Group's financial statements 2017 included a EUR 14.5 million short-term liability relating to the cash-settled
component. Due to the amendment, this portion has been adjusted in the opening balance sheet from the liabilities to
equity's retained earnings.
• Annual improvements to IFRS-standards.
APPLICATION OF NEW AND REVISED ACCOUNTING PRONOUNCEMENTS UNDER IFRS
The Group will adopt the IFRS 16 standard on 1 January 2019.
• IFRS 16 Leases. For lessors, the situation will remain largely unchanged. For lessees, all leases except short-term
contracts and contracts with low value will be recognised as a right to use on the balance sheet. The change will move off-
balance sheet liabilities to the balance sheet, and thus increase the amount of lease property and debt. The amount of off-
balance sheet liabilities on 30 June 2018 was EUR 81.5 million. The concepts of agreements processed as off-balance
sheet liabilities and the concepts used in IFRS 16 are somewhat different from each other, which is why the number of
agreements recognised on the balance sheet may differ from the number of off-balance sheet liabilities. The lease
contracts recognised on the balance sheet are mainly from business premises, telecom facilities, retails and cars. The
change does have impact on the Group's financial statements. The change will also affect the key indicators based on the
balance sheet, such as gearing.
Elisa has started preparing to implement the standard by launching a separate project to manage the planning and
implementation of the process changes required due to the standard and the change management.

17 Elisa Corporation | HALF-YEAR REPORT 2018
1. Segment Information
4-6/2018 Consumer Corporate Unallocated Group
EUR million Customers Customers Items Total
Revenue 285,9 171,6 457,5
EBITDA 102,8 56,9 159,8
Depreciation, amortisation and impairment -36,8 -22,4 -59,2
EBIT 66,0 34,5 100,6
Financial income 0,7 0,7
Financial expense -6,2 -6,2
Share of associated companies' profit 0,0 0,0
Profit before tax 95,0
Investments 40,8 20,1 60,9
4-6/2017 Consumer Corporate Unallocated Group
EUR million Customers Customers Items Total
Revenue 277,7 167,5 445,1
EBITDA 97,1 50,4 147,5
Depreciation, amortisation and impairment -35,9 -23,2 -59,1
EBIT 61,2 27,2 88,4
Financial income 46,3 46,3
Financial expense -6,0 -6,0
Share of associated companies' profit 0,0 0,0
Profit before tax 128,6
Investments 43,1 20,9 64,1

18 Elisa Corporation | HALF-YEAR REPORT 2018
1-6/2018 Consumer Corporate Unallocated Group
EUR million Customers Customers Items Total
Revenue 565,0 342,1 907,1
EBITDA 203,1 110,0 313,2
Depreciation, amortisation and impairment -73,4 -44,2 -117,5
EBIT 129,8 65,9 195,6
Financial income 1,2 1,2
Financial expense -12,4 -12,4
Share of associated companies' profit 0,0 0,0
Profit before tax 184,4
Investments 76,1 37,5 113,7
1-6/2017 Consumer Corporate Unallocated Group
EUR million Customers Customers Items Total
Revenue 538,9 322,1 861,0
EBITDA 188,8 102,5 291,3
Depreciation, amortisation and impairment -69,4 -44,8 -114,3
EBIT 119,3 57,7 177,0
Financial income 47,5 47,5
Financial expense -11,6 -11,6
Share of associated companies' profit 0,0 0,0
Profit before tax 213,0
Investments 77,9 39,3 117,3
1-12/2017 Consumer Corporate Unallocated Group
EUR million Customers Customers Items Total
Revenue 1 124,9 662,6 1 787,4
EBITDA 388,5 219,2 607,7
Depreciation, amortisation and impairment -141,5 -88,2 -229,7
EBIT 247,0 131,0 378,0
Financial income 49,1 49,1
Financial expense -23,9 -23,9
Share of associated companies' profit 0,0 0,0
Profit before tax 403,2
Investments 164,3 82,2 246,4
Total assets 1 657,0 851,2 72,2 2 580,4

19 Elisa Corporation | HALF-YEAR REPORT 2018
2. Acquisitions and disposals
Acquisition of Kepit Systems Oy
Consideration transferred
EUR million Preliminary
Cash paid 2,5
Contingent concideration 0,7
Total cost of acquisition 3,2
Analysis of net assets acquired
EUR million
Tangible assets 0,1
Trade and other receivables 0,6
Cash and cash equivalents 0,3
Trade payables and other liabilities -0,2
0,8
Effects of acquisition on cash flow
EUR million
Purchase price paid in cash -2,5
Cash and cash equivalents of the acquired entities 0,3
-2,3
Goodwill arising from business combination
EUR million
Consideration transferred 3,2
Net asset acquired 0,8
Non controlling interests of the identifiable net assets -0,2
Goodwill 2,6
On 26 April 2018, Elisa acquired 70 per cent of Kepit Systems Oy's shares. The acquisition price was EUR 3.2 million
including contingent consideration of EUR 0.7 million.
According to the preliminary purchase price allocation, the acquisition resulted in EUR 2.6 million goodwill relating to
strengthening of Group's market position in the offering of streaming services and e-commerce solutions. Goodwill is not
tax deductible. Purchase price allocation is preliminary as the verification of net assets acquired is not yet fully completed.
Possible adjustments are not expected to have material impact on purchase price allocation.
The acquired company has been consolidated from 1 May 2018 onwards. External revenue after the acquisition was EUR
0.4 million and the impact on Group profit was EUR 0.1 million. Had the acquisition been made as of beginning of the year
2018, the impact on Group revenue and profit for the period would have been EUR 0.8 million and EUR 0.2 million
respectively.
An EUR 0.1 million expense of transfer tax and expense of expert's and professionals advisors fees is recorded in other
operating expenses.
The acquisition generated a non-controlling interest amounted to EUR 0.2 million, which is included in the non-controlling
interest balance sheet item. The non-controlling interest is measured at the amount which equals non-controlling interests
proportionate share in the recognized amounts of the acquiree's identifiable net assets.

20 Elisa Corporation | HALF-YEAR REPORT 2018
Disposal of Habbo and Hideaway businesses
Net assets of the sold entity Carrying
EUR million amount
Long term trade and other receivables 0,1
Deferred tax assets 0,1
Trade and other receivables 1,1
Cash and cash equivalents 0,6
Trade payables and other liabilities -1,5
0,4
Effects of disposal on cash flow
EUR million
Cash and cash equivalent of a sold entity -0,6
-0,6
Effects of disposal on consolidated income statement and balance sheet
EUR million
Investments in associated companies 1,2
Net assets of a sold entity -0,4
Pre-existing relationships between the Group and the sold entity (1
1,3
Profit from the sales 2,2
Disposal of customer service and corporate switchboard businesses
On 2 May 2018 Elisa divested corporate clients' outsourced customer service and corporate switchboard businesses to Oy
Eniro Finland Ab. The total sales price was EUR 2.9 million and the net assets sold EUR -0.4 million. The divestment
resulted in a profit of EUR 3.3 million recorded within other operating income. The whole sales price is paid in cash.
On 6 June 2018 the Group's ownership in Sulake Suomi Oy decreased to 49 per cent in share issue where Orangegames
Holding B.V, a Dutch company which specialises in digital content, subscribed for 51 per cent of Sulake Suomi Oy's share
stock for price of EUR 3.0 million. As a result of share issue, the control of Habbo and Hideaway businesses were
transferred to Orangegames Holding B.V. and Elisa became a minority shareholder of the company. Through the
divestment Elisa gained a partner and Sulake Suomi Oy an owner that has a strong understanding and experience in game
design business.
Elisa has consolidated the result of the companies as a subsidiary until 31 May 2018 and starting form 1 June 2018 as
associated company.
As a result of the share issue, Elisa's ownership of Sulake Suomi Oy and its subsidiaries (Sulake Spain S.L.U, Sulake
Brasil and Sulake UK Ltd) decreased to 49 per cent and Elisa lost control of the companies. The change in ownership was
recorded in the Group as a sale of subsidiary and it resulted in a profit of EUR 2.2 million recorded in other operating
income.
1) As a result of the loss of control, the Group's net assets increased as the net receivables totaling to EUR 1.3 million,
previously eliminated as intra-group items, are treated as the external receivables.

21 Elisa Corporation | HALF-YEAR REPORT 2018
3. Property, plant and equipment and intangible assets
Property Other
30.6.2018 plant and intangible
EUR million equipment Goodwill assets
Acquisition cost at 1 January 2018 3 776,0 1 028,5 765,1
Additions 92,1 2,6 21,5
Business acquisitions 0,1
Disposals -2,6 0,0
Business disposals 0,0
Reclassifications -1,3 1,3
Translation differences 0,0 0,0 0,0
Aquisition cost at 30 June 2018 3 864,2 1 031,1 787,9
Accumulated depreciation, amortisation and impairment at 1 January 2018 3 018,0 15,0 588,0
Depreciation, amortisation and impairment 95,0 22,5
Accumulated depreciation and amortisation on disposals and reclassifications -2,5
Translation differences -0,1
Accumulated depreciation, amortisation and impairment at 30 June 2018 3 110,5 15,0 610,5
Book value at 1 January 2018 758,1 1 013,5 177,1
Book value at 30 June 2018 753,8 1 016,1 177,5
Property Other
30.6.2017 plant and intangible
EUR million equipment Goodwill assets
Acquisition cost at 1 January 2017 3 575,7 894,8 705,0
Additions 95,7 21,6
Business acquisitions 29,9 133,8 16,2
Disposals -4,5 -0,3
Reclassifications -0,3 0,0
Translation differences -0,1 0,0 0,0
Aquisition cost at 30 June 2017 3 696,3 1 028,5 742,4
Accumulated depreciation, amortisation and impairment at 1 January 2017 2 861,8 15,0 544,9
Depreciation, amortisation and impairment 92,6 21,7
Accumulated depreciation and amortisation on disposals and reclassifications -4,6 -0,3
Translation differences 0,0 0,0
Accumulated depreciation, amortisation and impairment at 30 June 2017 2 949,8 15,0 566,4
Book value at 1 January 2017 713,9 879,8 160,0
Book value at 30 June 2017 746,6 1 013,5 176,1
Commitments to purchase property, plant and equipment and intangible assets amounts to EUR 59.7 million (45.7) at 30
June 2018.

22 Elisa Corporation | HALF-YEAR REPORT 2018
4. Carrying amounts of financial assets and liabilities by category
Financial Financial Financial
liabilities assets/liabilities assets/liabilities
measured at measured at fair value measured at
30 June 2018 fair value through other amortised Book Fair
EUR million through profit or loss comprehensive income cost values values
Non-current financial assets
Other investments (1
10,7 10,7 10,7
Trade and other receivables 0,4 92,1 92,5 92,5
Current financial assets
Trade and other receivables 394,7 394,7 394,7
0,4 497,5 497,9 497,9
Non-current financial liabilities
Financial liabilities 937,0 937,0 977,9
Trade and other payables (2
15,3 15,3 15,3
Current financial liabilities
Financial liabilities 324,5 324,5 324,5
Trade and other payables (2
0,7 292,2 292,9 292,9
0,7 1 569,0 1 569,7 1 610,6
Financial Financial Financial
liabilities assets/liabilities assets/liabilities
measured at measured at fair value measured at
31 December 2017 fair value through other amortised Book Fair
EUR million through profit or loss comprehensive income cost values values
Non-current financial assets
Other investments (1
7,8 7,8 7,8
Trade and other receivables 83,7 83,7 83,7
Current financial assets
Trade and other receivables 407,6 407,6 407,6
499,1 499,1 499,1
Non-current financial liabilities
Financial liabilities 939,6 939,6 979,5
Trade payables and other liabilities (2
0,2 19,8 20,1 20,1
Current financial liabilities
Financial liabilities 177,8 177,8 177,8
Trade and other payables (2
343,5 343,5 343,5
0,2 1 480,8 1 481,0 1 520,91)
Other investments contains groups' unlisted equity investments2)
Excluding advances received
With the implementation of IFRS 9 the Group's financial assets and liabilities are classified as financial assets and
liabilities measured at amortised cost, financial assets and liabilities measured at fair value through other
comprehensive income and financial assets and liabilities measured at fair value through profit or loss. Financial
assets and liabilities measured at amortised cost include the fixed term contracts whose cash flow include payments of
principal and interest on the principal amount outstanding. Financial asset and liabilities measured at fair value through
other comprehensive income include those financial items that are expected both to collect contractual cash flows and
sell financial assets. Financial assets and liabilities measured at fair value through profit or loss include items that do
not meet the criteria of other groups.
The Group categorises the hedge accounting of electricity derivatives as financial liabilities measured at fair value
through other comprehensive income and contingent considerations in the business combinations as financial
liabilities measured at fair value through profit or loss.

23 Elisa Corporation | HALF-YEAR REPORT 2018
5. Financial assets and liabilities recognised at fair value
EUR million 30.6.2018 Level 1 Level 2 Level 3
Financial assets/liabilities measured at fair value
through other comprehensive income
Electricity derivatives 0,4 0,4
Financial assets/liabilities measured at fair value
through profit or loss
Contingent considerations relating to business
combinations. -0,7 -0,7
-0,3 0,4 -0,7
EUR million 31.12.2017 Level 1 Level 2 Level 3
Financial assets/liabilities recognised at fair value
through other comprehensive income
Electricity derivatives -0,2 -0,2
-0,2 -0,2
Level 1 includes instruments with quoted prices in active markets. Level 2 includes instruments with observable prices
based on market data. Level 3 includes instruments with prices that are not based on verifiable market data but instead on
the company's internal information, for example.

24 Elisa Corporation | HALF-YEAR REPORT 2018
6. EquityNumber of Treasury
shares shares Holding, % of
pcs pcs shares and votes
Shares at 31 December 2017 167 335 073 7 801 397 4,66 %
Disposal of treasury shares -228 543
Shares at 30 June 2018 167 335 073 7 572 854 4,53 %
Dividend
On 12 April 2018 Elisa's Annual General Meeting decided of a dividend of 1.65 euros per share. The total dividend amounts
to EUR 263.6 million and payment started on 24 April 2018.
7. Issuances and repayment of debt
30.6. 31.12.
EUR million 2018 2017
Issued bonds, nominal value 780,0 780,0
Issued commercial papers 267,0 115,0
Withdrawn committed credit lines 0,0 0,0
8. Provisions
Termination
EUR million benefits Other Total
1 January 2018 7,0 1,7 8,7
Increases in provisions 5,0 5,0
Reversals of unused provisions -1,9 -1,9
Utilised provisions -3,2 -3,2
30 June 2018 7,0 1,7 8,6
Termination
EUR million benefits Other Total
1 January 2017 4,1 2,3 6,4
Increases in provisions 4,0 4,0
Reversals of unused provisions -0,6 -0,6
Utilised provisions -2,1 -2,1
30 June 2017 5,5 2,3 7,8
The unused amount of EUR 1,000 million EMTN program is EUR 220 million as at 30 June 2018.

25 Elisa Corporation | HALF-YEAR REPORT 2018
9. Operating Lease Commitments
The future minimum lease payments under non-cancellable operating leases:
30.6. 31.12.
EUR million 2018 2017
Not later than one year 28,9 28,9
Later than one year not later than five years 36,6 39,4
Later than five years 16,0 18,4
81,5 86,7
Rental liabilities are exclusive of value added tax except vehicle leasing liabilities.
10. Contingent Liabilities30.6. 31.12.
EUR million 2018 2017
For our own commitments
Mortgages 2,0 2,0
Deposits 1,9 2,5
On behalf of others
Guarantees 0,5
4,0 5,0
Other contractual obligations
Venture Capital investment commitment 3,0 3,3
Repurchace obligations 0,0 0,0
Letter of credit 0,1 0,1
11. Derivative Instruments30.6. 31.12.
EUR million 2018 2017
Nominal values of derivatives
Electricity derivatives 1,7 2,4
1,7 2,4
Fair values of derivatives
Electricity derivatives 0,4 -0,2
0,4 -0,2

26 Elisa Corporation | HALF-YEAR REPORT 2018
12. Related party transactions
Acquisitions and disposals during the period are presented in Note 2.
Related party transactions with associated companies 1-6 1-6 1-12
EUR million 2018 2017 2017
Sales 0,2 0,4 0,5
Purchases 0,6 0,8 1,4
Receivables 1,3 0,1 0,1
Liabilities 0,1 0,0 0,1
There were no related party transactions with key management.
Management remuneration will be announced in Annual financial statements.
Key Figures
1-6 1-6 1-12
EUR million 2018 2017 2017
Shareholders' equity per share, EUR 5,97 5,51 6,52
Interest bearing net debt 1 201,2 1 230,7 1 073,1
Gearing, % 125,9 140,0 103,2
Equity ratio, % 37,0 34,3 40,5
Return on investment (ROI), % *) 18,1 18,8 23,7
Gross investments in fixed assets 113,7 117,3 246,4
of which finance lease investments 1,5 1,8 2,8
Gross investments as % of revenue 12,5 13,6 13,8
Investments in shares and business combinations 6,2 101,7 103,7
Average number of employees 4 661 4 521 4 614
*) rolling 12 months profit preceding the reporting date
Financial Calendar
Financial Results Q3 2018 18 October 2018
Contact Information
Investor Relations:
Press:
Elisa website: www.elisa.com
Elisa Group's related parties include the parent company, subsidiaries, associates, joint ventures and key
management. Key management consists of Elisa's Board of Directors, the CEO and the Executive Board.


![Customers Churn Prediction using Artificial Neural ... · devising of churn policy [16] is depicted in Fig. 2. Fig. 2. The Six Steps for Customer Churn Prediction. Churn prediction](https://img.dokumen.tips/doc/110x75/5e71a26fb4acff71e10cc1fe/customers-churn-prediction-using-artificial-neural-devising-of-churn-policy.jpg)