Embed Size (px)
Citation preview

HAL Id: tel-00754550https://tel.archives-ouvertes.fr/tel-00754550
Submitted on 20 Nov 2012
HAL is a multi-disciplinary open accessarchive for the deposit and dissemination of sci-entific research documents, whether they are pub-lished or not. The documents may come fromteaching and research institutions in France orabroad, or from public or private research centers.
L’archive ouverte pluridisciplinaire HAL, estdestinée au dépôt et à la diffusion de documentsscientifiques de niveau recherche, publiés ou non,émanant des établissements d’enseignement et derecherche français ou étrangers, des laboratoirespublics ou privés.
From image coding and representation to robotic visionMarie Babel
To cite this version:Marie Babel. From image coding and representation to robotic vision. Image Processing [eess.IV].Université Rennes 1, 2012. tel-00754550

Habilitation a Diriger des Recherches
From image coding and representation to robotic vision
Marie BABEL
Universite de Rennes 1June 29th 2012
Bruno Arnaldi, Professor, INSA Rennes Committee chairmanFerran Marques, Professor, Technical University of Catalonia ReviewerBenoıt Macq, Professor, Universite Catholique de Louvain ReviewerFrederic Dufaux, CNRS Research Director, Telecom ParisTech ReviewerCharly Poulliat, Professor, INP-ENSEEIHT Toulouse ExaminerClaude Labit, Inria Research Director, Inria Rennes ExaminerFranois Chaumette, Inria Research Director, Inria Rennes ExaminerJoseph Ronsin, Professor, INSA Rennes Examiner
IRISA UMR CNRS 6074 / INRIA - Equipe LagadicIETR UMR CNRS 6164 - Equipe Images

2

Contents
1 Introduction 3
1.1 An overview of my research project . . . . . . . . . . . . . . . . . . . . . . . . . . . 3
1.2 Coding and representation tools: QoS/QoE context . . . . . . . . . . . . . . . . . . 4
1.3 Image and video representation: towards pseudo-semantic technologies . . . . . . . . 4
1.4 Organization of the document . . . . . . . . . . . . . . . . . . . . . . . . . . . . . 5
2 Still image coding and advanced services 7
2.1 JPEG AIC calls for proposal: a constrained applicative context . . . . . . . . . . . . 8
2.1.1 Evolution of codecs: JPEG committee . . . . . . . . . . . . . . . . . . . . . 8
2.1.2 Response to the call for JPEG-AIC . . . . . . . . . . . . . . . . . . . . . . . 9
2.2 Locally Adaptive Resolution compression framework: an overview . . . . . . . . . . . 10
2.2.1 Principles and properties . . . . . . . . . . . . . . . . . . . . . . . . . . . . 11
2.2.2 Lossy to lossless scalable solution . . . . . . . . . . . . . . . . . . . . . . . . 12
2.2.3 Hierarchical colour region representation and coding . . . . . . . . . . . . . . 12
2.2.4 Interoperability . . . . . . . . . . . . . . . . . . . . . . . . . . . . . . . . . 13
2.3 Quadtree Partitioning: principles . . . . . . . . . . . . . . . . . . . . . . . . . . . . 14
2.3.1 Basic homogeneity criterion: morphological gradient . . . . . . . . . . . . . 14
2.3.2 Enhanced color-oriented homogeneity criterion . . . . . . . . . . . . . . . . . 15
2.3.2.1 Motivations . . . . . . . . . . . . . . . . . . . . . . . . . . . . . . 15
2.3.2.2 Results . . . . . . . . . . . . . . . . . . . . . . . . . . . . . . . . 16
2.4 Interleaved S+P: the pyramidal profile . . . . . . . . . . . . . . . . . . . . . . . . . 17
2.4.1 General principles . . . . . . . . . . . . . . . . . . . . . . . . . . . . . . . . 17
2.4.1.1 Notations. . . . . . . . . . . . . . . . . . . . . . . . . . . . . . . . 19
2.4.1.2 DPCM principles. . . . . . . . . . . . . . . . . . . . . . . . . . . . 19
2.4.2 Pyramid construction - Interleaving . . . . . . . . . . . . . . . . . . . . . . . 20
2.4.3 Interleaved S+P Pyramid Decomposition - Refined prediction model . . . . . 21
2.4.3.1 Pyramid decomposition principles - Notations . . . . . . . . . . . . 21
2.4.3.2 Top of the pyramid - Classical DPCM . . . . . . . . . . . . . . . . 21
2.4.3.3 LAR block image processing . . . . . . . . . . . . . . . . . . . . . 21
3

4 CONTENTS
2.4.3.4 Texture processing . . . . . . . . . . . . . . . . . . . . . . . . . . 23
2.4.4 Quantization Process . . . . . . . . . . . . . . . . . . . . . . . . . . . . . . 23
2.5 Joint image coding and embedded systems methodology: an applicative issue . . . . 23
2.6 Conclusion . . . . . . . . . . . . . . . . . . . . . . . . . . . . . . . . . . . . . . . . 24
3 Generic coding tools 27
3.1 General coding framework - Notations . . . . . . . . . . . . . . . . . . . . . . . . . 28
3.2 Adaptive color decorrelation . . . . . . . . . . . . . . . . . . . . . . . . . . . . . . . 28
3.2.1 Improving decorrelation process: multi component pixel classification . . . . 28
3.2.1.1 Inter-component classification . . . . . . . . . . . . . . . . . . . . 29
3.2.2 Principles . . . . . . . . . . . . . . . . . . . . . . . . . . . . . . . . . . . . 31
3.2.3 Process validation: application to Interleaved S+P codec . . . . . . . . . . . 32
3.2.3.1 Lossless compression case. . . . . . . . . . . . . . . . . . . . . . . 33
3.2.3.2 Lossy compression. . . . . . . . . . . . . . . . . . . . . . . . . . . 34
3.2.4 General use of the method . . . . . . . . . . . . . . . . . . . . . . . . . . . 35
3.3 Statistical analysis of predictive coders based on Laplacian distributions . . . . . . . 36
3.3.1 Laplace distribution: a widespread model . . . . . . . . . . . . . . . . . . . 36
3.3.2 A Laplace’s Law distribution . . . . . . . . . . . . . . . . . . . . . . . . . . 37
3.3.2.1 Notations. . . . . . . . . . . . . . . . . . . . . . . . . . . . . . . . 37
3.3.2.2 Laplace probability distribution model . . . . . . . . . . . . . . . . 37
3.3.2.3 Discretization of a continuous function issue . . . . . . . . . . . . 38
3.3.2.4 Parameters determination . . . . . . . . . . . . . . . . . . . . . . 38
3.3.3 Impact of quantization . . . . . . . . . . . . . . . . . . . . . . . . . . . . . 39
3.3.3.1 On error distribution . . . . . . . . . . . . . . . . . . . . . . . . . 39
3.3.3.2 On prediction efficiency . . . . . . . . . . . . . . . . . . . . . . . . 40
3.3.4 Entropy estimation . . . . . . . . . . . . . . . . . . . . . . . . . . . . . . . 40
3.3.4.1 Statistical study . . . . . . . . . . . . . . . . . . . . . . . . . . . . 40
3.3.4.2 Comparison with practical results and limits . . . . . . . . . . . . . 41
3.3.5 Mean Square Error estimation . . . . . . . . . . . . . . . . . . . . . . . . . 42
3.3.5.1 Statistical Approach . . . . . . . . . . . . . . . . . . . . . . . . . 42
3.3.5.2 Comparison with practical results and limits . . . . . . . . . . . . . 43
3.3.6 Applications to the Interleaved S+P predictive codec . . . . . . . . . . . . . 43
3.4 Symbol-oriented QM coding . . . . . . . . . . . . . . . . . . . . . . . . . . . . . . 45
3.4.1 Symbol-oriented entropy coding: motivation . . . . . . . . . . . . . . . . . . 45
3.4.2 QM bit plane oriented coding: an overview . . . . . . . . . . . . . . . . . . 46
3.4.3 Proposed symbol oriented coding . . . . . . . . . . . . . . . . . . . . . . . . 47
3.4.4 Context modeling . . . . . . . . . . . . . . . . . . . . . . . . . . . . . . . . 49
3.4.5 Validation: application to the Interleaved S+P . . . . . . . . . . . . . . . . 50

CONTENTS 5
3.5 Conclusion . . . . . . . . . . . . . . . . . . . . . . . . . . . . . . . . . . . . . . . . 51
4 Content securization and Quality of Service: preserving end-to-end data integrity 53
4.1 Application contexts and related ANR projects . . . . . . . . . . . . . . . . . . . . . 54
4.2 Content protection features: Interleaved S+P application . . . . . . . . . . . . . . . 55
4.2.1 Steganography and the Interleaved S+P . . . . . . . . . . . . . . . . . . . . 56
4.2.2 Cryptography ans scalability . . . . . . . . . . . . . . . . . . . . . . . . . . 57
4.2.3 Client-server application and hierarchical access policy . . . . . . . . . . . . 59
4.3 Network oriented QoS solutions . . . . . . . . . . . . . . . . . . . . . . . . . . . . . 60
4.3.1 One-pass rate control scheme using ρ-domain for MPEG-4 SVC . . . . . . . 61
4.3.1.1 ρ-domain based rate model . . . . . . . . . . . . . . . . . . . . . . 62
4.3.1.2 The ρ-domain model for MPEG-4 AVC . . . . . . . . . . . . . . . 62
4.3.1.3 Initialization of the ρ-domain model . . . . . . . . . . . . . . . . . 63
4.3.1.4 Global rate control strategy. . . . . . . . . . . . . . . . . . . . . . 63
4.3.1.5 Experimental results . . . . . . . . . . . . . . . . . . . . . . . . . 65
4.3.2 Error resilience and UEP strategies . . . . . . . . . . . . . . . . . . . . . . . 66
4.3.2.1 IP packets securization processes . . . . . . . . . . . . . . . . . . . 67
4.3.2.2 UEP strategy for scalable codec . . . . . . . . . . . . . . . . . . . 68
4.4 Conclusion . . . . . . . . . . . . . . . . . . . . . . . . . . . . . . . . . . . . . . . . 70
5 Generic analysis tools 71
5.1 Dyadic Fast Interpolation . . . . . . . . . . . . . . . . . . . . . . . . . . . . . . . . 72
5.1.1 Geometric duality principle . . . . . . . . . . . . . . . . . . . . . . . . . . . 73
5.1.2 DFI algorithm in 5 steps: an overview . . . . . . . . . . . . . . . . . . . . . 74
5.1.3 Step 1 (Initialization step): pixel copy in an enlarged grid . . . . . . . . . . . 75
5.1.4 Step 2: diagonal interpolation . . . . . . . . . . . . . . . . . . . . . . . . . 75
5.1.5 Step 3: vertical - horizontal interpolation . . . . . . . . . . . . . . . . . . . 75
5.1.6 Step 4: 1/2 pixel shift . . . . . . . . . . . . . . . . . . . . . . . . . . . . . . 75
5.1.7 Step 5: Quality enhancement - local mean correction . . . . . . . . . . . . . 76
5.1.8 Border handling . . . . . . . . . . . . . . . . . . . . . . . . . . . . . . . . . 78
5.1.9 Resulting images and objective quality . . . . . . . . . . . . . . . . . . . . . 78
5.1.9.1 Objective measure . . . . . . . . . . . . . . . . . . . . . . . . . . 79
5.1.9.2 Subjective evaluation . . . . . . . . . . . . . . . . . . . . . . . . . 79
5.1.10 Complexity analysis and parallel implementation . . . . . . . . . . . . . . . . 80
5.1.10.1 Speed enhancement solutions . . . . . . . . . . . . . . . . . . . . 82
5.2 Region segmentation from quadtree structure . . . . . . . . . . . . . . . . . . . . . 83
5.2.1 Notations . . . . . . . . . . . . . . . . . . . . . . . . . . . . . . . . . . . . 83
5.2.2 Region segmentation algorithm . . . . . . . . . . . . . . . . . . . . . . . . . 84
5.2.3 Performances analyses . . . . . . . . . . . . . . . . . . . . . . . . . . . . . . 84

6 CONTENTS
5.2.3.1 Evaluation of the segmentation . . . . . . . . . . . . . . . . . . . 86
5.2.3.2 Complexity analysis . . . . . . . . . . . . . . . . . . . . . . . . . . 87
5.2.3.3 Potential applications . . . . . . . . . . . . . . . . . . . . . . . . . 89
5.3 Multiresolution segmentation . . . . . . . . . . . . . . . . . . . . . . . . . . . . . . 89
5.3.0.4 General principles . . . . . . . . . . . . . . . . . . . . . . . . . . . 90
5.3.0.5 Multiresolution RAG . . . . . . . . . . . . . . . . . . . . . . . . . 90
5.3.0.6 Hierarchical segmentation . . . . . . . . . . . . . . . . . . . . . . 91
5.3.1 Experiments and results . . . . . . . . . . . . . . . . . . . . . . . . . . . . . 92
5.3.1.1 Visual results . . . . . . . . . . . . . . . . . . . . . . . . . . . . . 92
5.3.1.2 Objective quality of segmentation . . . . . . . . . . . . . . . . . . 92
5.3.1.3 Multiresolution and quadtree partitioning influence on complexityand objective scores . . . . . . . . . . . . . . . . . . . . . . . . . . 94
5.4 Conclusion . . . . . . . . . . . . . . . . . . . . . . . . . . . . . . . . . . . . . . . . 94
6 Pseudo-semantic representation of videos: joint analysis and coding tools 97
6.1 Consistent spatio-temporal region representation . . . . . . . . . . . . . . . . . . . . 98
6.1.1 Region-based image sequence coding: framework . . . . . . . . . . . . . . . 98
6.1.1.1 Luminance block image prediction and coding . . . . . . . . . . . . 99
6.1.1.2 Hierarchical spatio-temporal segmentation . . . . . . . . . . . . . . 100
6.1.1.3 Temporal consistency of region representation . . . . . . . . . . . . 102
6.1.2 Results and discussion . . . . . . . . . . . . . . . . . . . . . . . . . . . . . . 102
6.2 Motion tubes representation for image sequences . . . . . . . . . . . . . . . . . . . 103
6.2.1 Modeling a motion tube . . . . . . . . . . . . . . . . . . . . . . . . . . . . 104
6.2.2 Video representation based on motion tubes . . . . . . . . . . . . . . . . . . 106
6.2.2.1 Motion tubes families . . . . . . . . . . . . . . . . . . . . . . . . . 106
6.2.2.2 Motion tubes video representation properties . . . . . . . . . . . . 107
6.2.3 Motion model of a tube . . . . . . . . . . . . . . . . . . . . . . . . . . . . . 108
6.2.3.1 In between blocks and meshes: a modified Switched OBMC motionmodel . . . . . . . . . . . . . . . . . . . . . . . . . . . . . . . . . 108
6.2.3.2 OTMC: connected/disconnected motion tubes . . . . . . . . . . . 109
6.2.3.3 Regularizing the motion discrepancies: Locally-Adaptive OTMC . . 110
6.2.3.4 Motion modes: compared performances . . . . . . . . . . . . . . . 111
6.2.4 Time-evolving representation of the textures . . . . . . . . . . . . . . . . . . 112
6.2.5 Representation and compression ability of motion tubes . . . . . . . . . . . . 113
6.3 Adaptive image synthesis for video coding . . . . . . . . . . . . . . . . . . . . . . . 115
6.3.1 Motivation . . . . . . . . . . . . . . . . . . . . . . . . . . . . . . . . . . . . 115
6.3.2 Texture analysis . . . . . . . . . . . . . . . . . . . . . . . . . . . . . . . . . 116
6.3.2.1 Texture characterization . . . . . . . . . . . . . . . . . . . . . . . 116
6.3.3 Texture patch design . . . . . . . . . . . . . . . . . . . . . . . . . . . . . . 117

CONTENTS 7
6.3.4 Pixel-based texture synthesis . . . . . . . . . . . . . . . . . . . . . . . . . . 118
6.3.4.1 Adaptive neighborhood size using texture characterization . . . . . 118
6.3.4.2 Confidence-based synthesis order . . . . . . . . . . . . . . . . . . . 119
6.3.5 Patch based texture synthesis . . . . . . . . . . . . . . . . . . . . . . . . . . 120
6.3.6 Comparing and switching algorithms strategy . . . . . . . . . . . . . . . . . 120
6.3.7 Extension to video coding purposes . . . . . . . . . . . . . . . . . . . . . . . 121
6.4 Conclusion . . . . . . . . . . . . . . . . . . . . . . . . . . . . . . . . . . . . . . . . 123
7 Toward robotic vision for personal assistance living 125
7.1 Personal assistance living: towards higher autonomy . . . . . . . . . . . . . . . . . . 125
7.2 Secured navigation of wheelchair solutions . . . . . . . . . . . . . . . . . . . . . . . 126
7.2.1 APASH project . . . . . . . . . . . . . . . . . . . . . . . . . . . . . . . . . 126
7.2.2 Technical issues . . . . . . . . . . . . . . . . . . . . . . . . . . . . . . . . . 127
7.3 Fall detection through 3D cameras . . . . . . . . . . . . . . . . . . . . . . . . . . . 128
7.4 Long term objectives . . . . . . . . . . . . . . . . . . . . . . . . . . . . . . . . . . 128

8 CONTENTS

Remerciements
Cette habilitation est une facon pour moi de faire un bilan sur mes activites passees au sein dulaboratoire IETR et mettre en exergue le lien qui existent avec celles qui se deroulent desormais al’IRISA, dans l’equipe Lagadic.
Rien n’est lineaire, ni les relations humaines, et encore moins le cheminement de la pensee. Sides chemins de traverse sont pris, c’est pour mieux renforcer les convictions et la determination quel’on a a accomplir ce pour quoi on se bat.
Je tiens a remercier tres sincerement tout d’abord tous les membres de mon jury pour leurparticipation a cette entreprise particuliere qu’est l’Habilitation a Diriger les Recherches. Merciinfiniment a mes rapporteurs Ferran Marques, Benoıt Macq et Frederic Dufaux pour leur relectureattentive et leur soutien. Merci infiniment aussi a Charly Poulliat, Denis Friboulet, Claude Labit pourles echanges conviviaux et tres riches. Un grand merci a Joseph Ronsin, mon directeur de these al’IETR, pour lequel j’ai un profond respect.
Il me semble aussi important de remercier tous ceux qui ont facilite mon integration a l’IRISA.En tout premier, je remercie Bruno Arnaldi pour l’aide precieuse, l’attention qu’il m’a temoignee etbien sur la presidence de cette habilitation. Francois Chaumette m’a alors accueillie avec chaleur : jelui en suis vraiment reconnaissante. Laurent Bedat, Muriel Pressigout, Sylvain Guegan ont toujoursete a mes cotes dans les moments les plus difficiles et leur confiance me touche.
Cote Lagadic, Alexandre Krupa, Fabien Spindler, Eric Marchand doivent etre chaleureusementremercies eux aussi pour leur attention sincere a mon egard et l’accueil qu’ils m’ont reserve. Sanscet entourage fort, je n’aurai certainement pas ete a meme de me projeter dans le futur et mener abien une mobilite thematique.
Ivan Leplumey ne peut pas etre oublie dans ces remerciements. Il m’a invitee avec une infiniegentillesse a prendre place au sein departement Informatique de l’INSA. La convivialite, la solidaritene sont pas des vains mots...
Marie Francoise Pichot, Nathalie Jacquinot, Celine Gharsalli sont des assistantes dont les qualiteshumaines et le devouement aupres des equipes de recherche ou pedagogiques n’ont d’egal que ceuxde Jocelyne Tremier, pour laquelle mon amitie restera indefectible.
Merci aussi a tous ceux a l’INSA avec lesquels je partage des aventures pedagogiques et quotidi-ennes dans la bonne humeur : Jean-Noel Provost, Luce Morin, Sylvain Haese, Eric Bazin, MaximePelcat, Veronique Coat, Kidiyo Kpalma, Jean-Gabriel Cousin, Laurence Roze, Marin Bertier...
Je ne peux finir cette liste a la Prevert sans remercier du fond du coeur mes petits canetons(autre denomination d’un doctorant) : Francois Pasteau que j’ai adopte definitivement, ClementStrauss, Fabien Racape, Rafik Sekkal, Matthieu Urvoy, Yohann Pitrey, Jean Motsch. Sans vous,cette habilitation n’aurait pu etre realisee... Vous etes epatants !
1

2 CONTENTS
Je dedie cette HDR a mon pere.
A Aziliz, Klervi et Julien.

Chapter 1
Introduction
1.1 An overview of my research project
This habilitation thesis is somehow specific since the main part of my work unfolded within the IETRlaboratory although I recently joined the IRISA / INRIA laboratory. This situation reflects the naturalevolution of my research topics.
My research works were in fact first oriented towards image and video coding, and relied onthe Locally Adaptive Resolution (LAR) coding scheme. Then, image representation and analysisdomains were introduced in order to fit human vision properties as well as the image content. Thecombination of these topics led us to look into joint analysis and coding frameworks.
Meanwhile, as the current French National Research Agency (ANR) encourages the researchers totake part in and to manage projects for both collaboration and technological transfer purposes, moreand more research works are directly driven by project purposes. Clearly, our work has been naturallyinfluenced by the different collaborative projects in which we were involved. As a consequence, myresearch topics are not exclusive and provide a large range of analysis and coding solutions. Even ifthey are strongly oriented towards compression, I took an interest in a large panels of related topics.
In this way, I participated in two ANR projects, both of them addressing securization issues. TheTSAR project (Safe Transfer of high Resolution Art images) tended to design a scalable solution ofsecurized transmission of coded images. As for it, the CAIMAN project (Codage Avance d’IMAges etNouveaux services) aims at designing a new joint source/channel coding framework able to integrateHuman Vision System based features. Hence, I worked on data integrity issues through dedicatedcryptography and steganography solutions and through Quality of Services oriented techniques. Inaddition, the main objective of CAIMAN project was to propose a coding solution as a response tothe JPEG-AIC call for proposal. As the LAR was chosen to be a candidate, a large part of the team’swork was devoted to an active participation to JPEG committee actions.
In connection to these research fields, since 2005, I co-supervised with Joseph Ronsin and OlivierDeforges six PhD students that have defended their dissertations, namely Jean Motsch, YohannPitrey-Helpiquet, Matthieu Urvoy, Francois Pasteau, Fabien Racape and Clement Strauss.
Recently, researches have been even more focused on pseudo-semantic representation of imagesand videos. If these studies have been conducted so that to match compression issues, relateddomains can be investigated. This leads me to tackle robotic vision issues, and more particularlyrobotic assistance. I am now involved into different projects that clearly influence my future research.
3
4 CHAPTER 1. INTRODUCTION
I obtained, by special dispensation, the authorization to independently supervise two PhD students(Rafiq Sekkal, Yao Zhigang), whose works are oriented towards tracking and autonomous navigationwith the help of 3D vision systems. For all these reasons, I joined the Lagadic Team within IRISA /INRIA laboratory in November 2011.
1.2 Coding and representation tools: QoS/QoE context
This habilitation document is then mainly devoted to applications related to image representation andcoding. Of course, this research field has been deeply investigated and many related previous books[205] and habilitation thesis have been already published [146][38][129] in this domain. The ideais not here to rewrite the image coding context, but rather to reinstate this work among emergingservices.
If the image and video coding community has been traditionally focused on coding standardizationprocesses, advanced services and functionalities have been designed in particular to match contentdelivery system requirements. In this sense, the complete transmission chain of encoded images hasnow to be considered.
To characterize the ability of any communication network to insure end-to-end quality, the notionof Quality of Service (QoS) has been introduced. First defined by the ITU-T as the set of technologiesaiming at the degree of satisfaction of a user of the service [85], QoS is rather now restricted tosolutions designed for monitoring and improving network performance parameters. However, endusers are usually not bothered by pure technical performances but are more concerned about theirability to experience the desired content. In fact, QoS addresses network quality issues and providesindicators such as jittering, bandwidth, loss rate...
An emerging research area is then focused on the notion of Quality of Experience (QoE, alsoabbreviated as QoX), that describes the quality perceived by end users. According to [86], QoE isdefined as a subjective metric measuring the acceptability of an application of a service. Within thiscontext, QoE faces the challenge of predicting the behaviour of any end users.
When considering encoded images, many technical solutions can considerably enhance the enduser experience, both in terms of services and functionalities, as well as in terms of final image quality.Ensuring the effective transport of data, maintaining security while obtaining the desired end qualityremain key issues for video coding and streaming [162].
First parts of my work are then to be seen within this joint QoS/QoE context. From efficient cod-ing frameworks, additional generic functionalities and services such as scalability, advanced entropycoders, content protection, error resilience, image quality enhancement have been proposed.
1.3 Image and video representation: towards pseudo-semantic tech-nologies
Related to advanced QoE services, such as Region of Interest definition of object tracking andrecognition, we further closely studied pseudo-semantic representation. First designed toward codingpurposes, these representations aim at exploiting textural spatial redundancies at region level.
Indeed, research, for the past 30 years, provided numerous decorrelation tools that reduce theamount of redundancies across both spatial and temporal dimensions in image sequences. To this

1.4. ORGANIZATION OF THE DOCUMENT 5
day, the classical video compression paradigm locally splits the images into blocks of pixels, andprocesses the temporal axis on a frame by frame basis, without any obvious continuity. Despitevery high compression performances such as AVC [206] and forthcoming HEVC standards [208], onemay still advocate the use of alternative approaches. Disruptive solutions have also been proposed,and offer notably the ability to continuously process the temporal axis. However, they often rely oncomplex tools (e.g. Wavelets, control grids [29]) whose use is rather delicate in practice.
We then investigate the viability of alternative representations that embed features of bothclassical and disruptive approaches. The objective is to exhibit the temporal persistence of thetextural information, through a time-continuous description.
At last, from this pseudo-semantic level of representation, texture tracking system up to objecttracking can be designed. From this technical solution, 3D object tracking is a logical outcome, inparticular when considering vision robotic issues.
1.4 Organization of the document
This document is divided into five main parts related to coding, securization and analysis solutions.These contributions are related to my work within the IETR laboratory.
The contributions presented in chapter 2 fit into the schemes of the LAR coding framework. Thescalable version of the LAR, namely the Interleaved S+P framework, is particularly described. Fromthis scheme, we designed advanced generic tools, presented in chapter 3, specially defined for anypredictive coders. In particular, relying on error prediction distributions studies, generic color-baseddecorrelation solution as well as as specific entropy coder are described.
Chapter 4 addresses data integrity issues. Scalable cryptography and steganography solutionsare first proposed, then network-oriented Quality of Service solutions, elaborated for scalable coderpurposes, are shown. Generic analysis tools, that tend to match low complexity requirements, aredefined in chapter 5. An original Dyadic Fast Interpolation is thus proposed, along with quadtree-based segmentation solutions. Chapter 6 presents then disruptive approaches for joint representationand coding of image sequences.
The last chapter (chapter 7) states for my research perspectives, oriented towards robotic vi-sion. It emphasizes my progressive transition towards assistance living concerns through adaptedtechnologies.

6 CHAPTER 1. INTRODUCTION

Chapter 2
Still image coding and advancedservices
Nowadays, easy-used communication systems have emphasized the development of various innovativetechnologies including digital image handling, such as digital cameras, PDAs or mobile phones. Thisnaturally leads to implement image compression systems used for general purposes like digital storage,broadcasting and display. JPEG, JPEG 2000 and now JPEG XR have become international standardsfor image compression needs, providing efficient solutions at different complexity levels. Nevertheless,if JPEG 2000 is proved to be the most efficient coding scheme, its intrinsic complexity prevents itsimplementation on embedded systems that are limited in terms of computational capacity and/ormemory. In addition, usages associated with image compression systems are evolving, and tend torequire more and more advanced functionalities and services that are not always well addressed bycurrent norms. As a consequence, designing an image compression framework still remains a relevantissue.
The JPEG committee has started to work on new technologies to define the next generationof image compression systems. This future standard, named JPEG AIC (Advanced Image Coding),aims at defining a complete coding scheme able to provide advanced functionalities such as lossyto lossless compression, scalability, robustness, error resilience, embed-ability, content description forimage handling at object level [98].
In this context, the Locally Adaptive Resolution (LAR) codec framework, designed within theIETR laboratory and initiated by Olivier Deforges, has been proposed as a contribution to the relativecall for technologies, tending to fit all of previous functionalities [40]. The related method is a codingsolution that simultaneously proposes a relevant representation of the image. The LAR method hasbeen initially introduced for lossy image coding. This original image compression solution relies ona content-based system driven by a specific quadtree representation. Multiresolution versions of thiscodec have shown their efficiency, especially for lossless coding purposes. An original hierarchical self-extracting region representation has also been elaborated: a segmentation process is realized at bothcoder and decoder, leading to a free segmentation map. This latter can be further exploited for colorregion encoding or image handling at region level. Thanks to the modularity of our coding scheme,the complexity can be adjusted to address various embedded systems. For example, basic version ofthe LAR coder has been implemented onto FPGA platforms while respecting real-time constraints.Pyramidal LAR solution and hierarchical segmentation processes have also been prototyped onto
7

8 CHAPTER 2. STILL IMAGE CODING AND ADVANCED SERVICES
DSPs heterogeneous architectures.
During my own PhD work, my main contribution was devoted to the design of a scalable codingframework based on the LAR principles. The Interleaved S+P solution is thus based on a twointerlaced pyramidal representation and is used for coding purposes [21]. If other versions of amultiresolution LAR coding solution have been studied [41], the Interleaved S+P, thanks to itscontained complexity and the advanced functionalities it proposes, is the framework that has beenfurther developed and presented as a response to JPEG-AIC Call For Proposal. Since then, I co-supervised four PhD works relative to this topic.
In this chapter, we focus on the Interleaved S+P still image coding characteristics. JPEG AICscope is first introduced as well as associated requirements. Then we describe the technical featuresof the LAR system, and show the originality and the characteristics of the proposed scheme.
2.1 JPEG AIC calls for proposal: a constrained applicative context
A part of my research work has been realized within the ANR CAIMAN project1. A major objectiveof this project was to propose an innovation coding solution that could be able to fit the new JPEG-AIC standard requirements. The LAR image codec has been then selected as a possible answer todedicated call for proposal. As a consequence, our work has undergone the JPEG expectations interms of both scientific developments and scheduling. This section presents then our involvement inthe JPEG-AIC normalization process.
2.1.1 Evolution of codecs: JPEG committee
The most widely used image codec is JPEG for sure. This codec has been standardized by the JPEGcommittee in 1992 [78]. It is mainly based on a Discrete Cosine Transform (DCT), together with adedicated quantization process and Huffman entropy coding. The JPEG codec has been then furtherimproved by the mean of a Q15 binary arithmetic coder [81]. This image codec exhibits interestingcharacteristics such as a low complexity together with good quality at medium to high bit rates.However it lacks of lossless mode, preventing it from encoding images without any artefact. TheJPEG format is widely used in digital cameras as well as on the Internet.
To address the issue of lossless encoding, JPEG-LS has been standardized by the JPEG committeein 1998 [79]. JPEG-LS uses a completely different approach than JPEG does and is therefore notbackward compatible with JPEG. JPEG-LS is a predictive codec based on the LOCO-I scheme [203].
In 2002, JPEG2K has been standardized [80] by the JPEG committee. This image codec is basedon a Cohen-Daubechies-Feauveau wavelet. It offers resolution scalability, high compression ratio,rate control and ROI management. However it lacks of JPEG backward compatibility and has a highcomplexity.
As for it, JPEG Wireless [82] is based on the JPEG 2K image codec. It addresses the issue oftransmitting image through error prone wireless network. It offers a new layer of error robustness tothe JPEG2K codec.
Standardized in 2010, JPEG-XR [83] created by Microsoft offers a low complexity, average ratedistortion [159], complexity [139] results between JPEG and JPEG2K, and lacks of JPEG or JPEG2K
1http://www.research-projects.org/xwiki/bin/view/CAIMAN/

2.1. JPEG AIC CALLS FOR PROPOSAL: A CONSTRAINED APPLICATIVE CONTEXT9
backward compatibility.
Within this compression scope, WebP[65], created by Google, is studied by the JPEG committeeto check its relevance. It corresponds to the Intra mode of VC8 also known as WebM [64]. Itoffers good rate distortion performance compared to the state of the art JPEG2K and JPEGXR [49].However it lacks of any kind of scalability.
To propose a new image codec, the JPEG committee has issued in 2007 a new Call for AdvancedImage Coding (AIC) and evaluation methodologies [98]. The committee has then initiated an activityto study potential methodologies for image quality evaluation and technologies for future generationimage compression systems. This activity is seen as a new work item for standardization of a newevaluation approaches and image compression system if any potential technologies, which significantlyimprove the performance current image compression standards, can be identified. Among others, anarea of special interest is the creation of a low-complexity high-performance coding format for two,three or higher-dimensional medical data.
2.1.2 Response to the call for JPEG-AIC
The LAR codec has been proposed as a response to the Call for Advanced Image Coding (AIC) andevaluation methodologies [98]. We responded to the call for both natural images (contribution [12])and for medical images (contributions [19, 20]). In addition we answered to the call for a medicalimage database (contribution [13]).
Once the response to the AIC call for proposal has been accepted in July 2010, the work wasorganized around several ”core experiments” aiming at testing specific functionalities of the codec.Each core experiment must be successively validated to continue the JPEG process. Therefore theLAR codec has been optimized for the different core experiments while being generally improved interms of ease of use, parameterization, architecture, complexity, modularity, and while making surethat everything remains bug free. Four versions of the reference software have been published allalong this process [14, 15, 16, 17].
This implication in JPEG committee deeply influenced the team’s work. Unfortunately thissoftware development, testing process and in general the JPEG contributions around the LAR codecdo not usually results in promotable scientific contributions while being very time consuming togetherwith imposing some constraints. However the visibility of our work has been greatly increased andhas lead to interesting exchanges with the international image coding community. The PhD worksof both Francois Pasteau and Clement Strauss were conducted within this context. Together withMederic Blestel, an expert engineer specially recruited for the CAIMAN project, they provide majorinnovations towards JPEG-AIC requirements.
The following paragraphs present 3 core experiments and summarize the corresponding contri-butions.
Core 1: objective quality, July 2010 - October 2010. This core experiment [99], realized fromJuly 2010 up to October 2010, was targeting on objective quality. The core results showed someproblems with the codec due to parametrization process, as ideal parameters needed to be found foreach image. Testers used a standard set of parameters leading to some sub-optimal results. Howevera good behavior of the codec with respect to the JPEG standards has been emphasized.

10 CHAPTER 2. STILL IMAGE CODING AND ADVANCED SERVICES
Core 2: objective and subjective quality, October 2010 - February 2011. The second core[100], from October 2010 up to February 2011, added subjective quality measures into the tests. TheLAR reference software [16] has been evaluated in a subjective manner by the university of Poitiers[101] and in a objective manner by the university of Stuttgart [160]. The result of the core showedthat the LAR is performing similarly to JPEG-XR for 0.25 and 0.5bpp, and was worst for higherbitrates. The conclusion was that some improvements were necessary to help find the LAR optimalparameters.
Core 3: performance evaluation and functionality analysis, February 2011 - July 2011. Forthe third core [102], from February 2011 up to July 2011, the LAR reference software [17] hasbeen evaluated in terms of complexity and objective quality [18]. We conducted and presentedboth evaluations. The results of the core, presented in July 2011, showed a lower performancein terms of complexity and compression when compared to JPEG2K. As a consequence the JPEGcommittee decided to abandon the experiments on the LAR codec. However this participationremains a very positive experience, especially in terms of both industrial contacts and normalizationprocess understanding.
2.2 Locally Adaptive Resolution compression framework: anoverview
The LAR method, first designed by Olivier Deforges in [42], was initially introduced for lossy imagecoding purposes [40]. The philosophy behind this coder is not to outperform JPEG2K in terms ofcompression, but rather to propose an open source, royalty free, alternative image coder with inte-grated services. While keeping the compression performances in the same range as JPEG2K(losslesscoding) or JPEG XR (lossy coding), with contained complexity, our coder also provides services suchas scalability, cryptography, data hiding, free region representation and coding.
The LAR codec is based on the assumption that an image can be represented as layers of basicinformation and local texture, relying then on a two-layer system (figure 2.1). The first layer, calledFlat coder, leads to construct a low bit-rate version of the image with good visual properties. Thesecond layer deals with the texture that is encoded through a dedicated texture coder relying onDCT (spectral coder) or pyramidal system. This texture coder aims at visual quality enhancementat medium/high bit-rates. Therefore, the method offers a natural basic SNR scalability.
Figure 2.1: General scheme of two-layer LAR coder
The LAR codec tries to combine both efficient compression in a lossy or lossless context andadvanced functionalities and services as described before. To provide a codec which is adaptable andflexible in terms of complexity and functionality, different tools have been developed. These toolsare then combined in three profiles in order to address such flexibility features (figure 2.2).
Therefore, each profile adresses to different functionalities and different complexities. The Base-

2.2. LOCALLY ADAPTIVE RESOLUTION COMPRESSION FRAMEWORK: ANOVERVIEW 11
Figure 2.2: Specific coding parts for LAR profiles
line profile is related to low complexity, low functionality requirements, the Pyramidal profile showsan increased complexity but new functionalities such as scalability, rate control are available, and theExtended profile includes scalable color region representation and coding, cryptography, data hiding,unequal error protection services, naturally leading to higher complexity.
An extensive part of my work has been conducted within the medical image compression context.As a consequence, the baseline profile, dedicated to low bit-rate encoding, is clearly not appropriated.As medical image compression requires lossless solutions, we then focus the discussion on function-alities and technical features provided by the pyramidal and extended profiles dedicated to contentprotection: cryptography, steganography, error resilience, hierarchical securized processes. In thiscontext, the Interleaved S+P coding tool [21] has been chosen as the appropriate tool.
2.2.1 Principles and properties
As previously mentioned, a two-layer framework has been designed. This image decomposition intotwo sets of data is thus performed conditionally to a specific quadtree data structure, encoded in theFlat coding stage. The basic idea is that local resolution, in other words the pixel size, can dependon local activity. Thanks to this type of block decomposition, block size implicitly gives the natureof the given block: smallest blocks are located upon edges or on texture areas whereas large blocksmap homogeneous areas (figure 2.3). Then, the main feature of the Flat coder consists of preservingcontours while smoothing homogeneous parts of the image.
This quadtree partition remains the key system of the LAR codec. Consequently, this coding partis required whatever the chosen profile.

12 CHAPTER 2. STILL IMAGE CODING AND ADVANCED SERVICES
Figure 2.3: Original image and associated quadtree partitions obtained with a given value of activitydetection parameter
2.2.2 Lossy to lossless scalable solution
Scalable image decompression is an important feature as soon as very large images are used. Scal-ability enables progressive image reconstruction by integrating successive compressed sub-streamsduring the decoding process.
Scalability is generally first characterized by its nature: resolution (multi-size representation)and/or SNR (progressive quality enhancement). The LAR codec supports both of them but differsfrom JPEG2K. The main difference is that the LAR provides a multiresolution solution togetherwith an ”edge oriented” quality enhancement. The lossy or lossless coding process involves two-passdyadic pyramidal decomposition (figure 2.4). The first pass, leading to a low bit-rate image, encodesthe overall information in the image thanks to the Flat coder, thus preserving main contours, whilesmoothing homogeneous areas. The second pass using a Texture coder adds the local texture inthese areas. The LAR framework also contains some interpolation / post-processing steps that cansmooth homogeneous areas while retaining sharp edges.
The second important feature for scalability concerns granularity. Scalability granularity defineswhich elementary amount of data can be independently decoded. Among existing standards, JPEG2Koffers the finest granularity of scalability. On the other hand, JPEG provides no scalability, exceptin its progressive mode, while JPEG-XR enables up to 4 scalability levels. With the LAR codec, thenumber of dyadic resolution levels N is adjustable, with two quality levels per resolution. Therefore,the number of elementary scalable sub-streams is equal to 2N .
2.2.3 Hierarchical colour region representation and coding
Within the extended profile, for colour images, we have designed an original hierarchical region-basedrepresentation technique adapted to the LAR coding method. An initial solution was proposed in[40] that can be seen as an adaptation of the split/merge methods that tackles coding constraints. .
Even if efficient context-based methods adapted to quadtree-based region partition compressionhave been developed [138], prohibitive partition coding cost stays one of the principal restrictionsto the evolution of content-based coding solutions. To avoid the prohibitive cost of region shape

2.2. LOCALLY ADAPTIVE RESOLUTION COMPRESSION FRAMEWORK: ANOVERVIEW 13
Flat coding +
+
TEXTUREFLAT
+
-
+
-
Imag
es fr
om
th
e p
yram
idal
rep
rese
nta
tio
n
DPCM coding
Texture coding
Texture codingFlat coding
Quadtree
Figure 2.4: Pyramidal representation of an image
descriptions, the most suitable solution consists of performing the segmentation directly, at both thecoder and decoder, using only a low bit-rate compressed image resulting from the Flat codiing layer.The segmentation process allows then several simultaneous merges in order to limit complexity andto provide a more compact multi-scale representation. Moreover, a joint mean/gradient criterionweighted by region surfaces (non-symetrical distance) has been defined in order to favor regionswith spatial consistency. By iteratively increasing thresholds, a hierarchical segmentation is obtainedand allows to efficiently describe the image content from finest to coarse scale. Having as manyindexed levels as threshold levels, indexed hierarchical segmentation can be described with a N-arytree structure called Partition Tree PTN
s (s: spatial; st: spatio-temporal) where N is the number ofindexed levels [122][168]. The multi-scale representation is said to be a self-extracting process (costfree) because both coder and decoder only work on Y-block image.
Color information is used to improve segmentation quality and the encoding of the chromaticcomponents using region representation. To take advantage of color information in the chromaticcomponents encoding, a chromatic control principle is defined and included in the merging pro-cess previously described. This chromatic control generates additional binary information for eachluminance-based merging attempt to control the merging process. Natural extensions of this par-ticular process have also made it possible to address medium and high quality encoding and theregion-level encoding of chromatic images. Another direct application for self-extracting region rep-resentation is found in a coding scheme with local enhancement in Regions Of Interest (ROI).
2.2.4 Interoperability
The extended profile also proposes the use of dedicated steganography and cryptography processes,which will be presented in chapter 4. To sum up, the interoperability of coding and representationoperations leads to an interactive coding tool. The main features of the LAR coding parts aredepicted in figure 2.5.

14 CHAPTER 2. STILL IMAGE CODING AND ADVANCED SERVICES
Figure 2.5: Block diagram of extended LAR coder profile
2.3 Quadtree Partitioning: principles
Systems based on a variable-size block representation rely on the knowledge of both a homogeneitycriterion and a specific partition. To avoid overlapping, a common partition solution follows quadtreetopology.
The LAR framework involves a quadtree partitioning P [Nmax...Nmin] with all square blocks havinga size equal to a power of two, where Nmax and Nmin represent respectively the maximum andminimum authorized block sizes. Thus, the partitioning process consists of first splitting the imageinto uniform Nmax square blocks and then building a quadtree on each block.
In fact, many methods rely on such a variable-size block representation. In particular, MPEG4-AVC/H.264 intra mode authorizes a partition P [16,4] (it splits images into 4× 4 or 16× 16 blocks),where size selection operates to produce the best bit rate/distortion from a PSNR point of view [70].Methods based on tree structure operate from the highest level (or maximal size) by cutting nodesdown into sons when the homogeneity criterion is not met. Although several homogeneity tests canbe found in literature [173, 184], in most cases they rely on a computing stage of a L1 or L2 normdistance obtained between the block value and the value of its four sons.
In this section, different solutions of designing the mandatory homogeneity criteria are presented.
2.3.1 Basic homogeneity criterion: morphological gradient
A first criterion, based on edge detection, as been especially elaborated for LAR coding purposes.Among the various possible filters, a morphological gradient filter (the difference between maximumand minimum luminance values on a given support) has been chosen, because of its fast, recursiveimplementation and the resulting limitation of the absolute value of texture.
General description. Let I(x, y) represents a pixel with coordinates (x, y) in an image I of sizeNx ×Ny. Let bN (i, j) ∈ I be the block of size N ×N .
Let P [Nmax...Nmin] be a quadtree partition, and min[bN (i, j)] and max[bN (i, j)] be respectivelythe minimum and maximum values in block bN (i, j).

2.3. QUADTREE PARTITIONING: PRINCIPLES 15
For each pixel, the block size is given by
Siz(x, y)=
max (N) if ∃ N ∈ [Nmax . . . Nmin] :∣∣max
[bN(b xN c, b
yN c)]−min
[bN(b xN c, b
yN c)]∣∣ ≤ Th
Nmin otherwise,(2.1)
where Th represents the homogeneity threshold.
The resulting image of sizes immediately produces a rough segmentation map for the image,where blocks sized with Nmin are mainly located on contours and in highly textured areas. Thischaracteristic forms the further basis of various coding and advanced analysis steps provided by theframework.
Color images. For color images, the solution consists of defining a unique regular partition locallycontrolled by the minimal size among the three components of the considered color space. Then, foreach pixel I(x, y) ∈ I, for YCbCr color space, the image of sizes Siz is given by
Siz(x, y)=min [SizY (x, y), SizCr(x, y), SizCb(x, y)]. (2.2)
The thresholds Th can be independently defined for the luminance component and color com-ponents. In case of a single threshold Th, the corresponding minimum value (equation 2.2 is mainlysupplied from the Y component.
2.3.2 Enhanced color-oriented homogeneity criterion
To address color images representation issue, both a color space and a content extraction strategyhas to be defined. As required by JPEG-AIC Call For Proposal, the idea is to add psycho-visualconsiderations into image codecs together with allowing good rate/distorsion results. Toward thisobjective, we introduce psycho-visual considerations, especially in the LAR quadtree computation.However, our idea of using the CIELAB color space for analysis can be transposed to other codecsor image processing methods, as soon as they rely in a quadtree representation. This solution hasbeen designed by Clement Strauss during his PhD work in [183, 182].
2.3.2.1 Motivations
Psycho-visual aspects are typically considered for both video coding [10] and image coding such asthe JPEG coder [180], where vision models have been used as improvement steps. In particular,works on wavelet quantization noise visibility [200] have led to an perceptual distortion control inJPEG2K [112]. The main drawback of this last approach is that perceptual features are externallyused to set up the coder to obtain a given visual quality.
Matching psycho-visual requirements can be then facilitated by means of an appropriate colorspace. If YUV color space is typically used for video coding purposes, CIE L*a*b* or CIELAB [75][53]is a color space especially designed to exhibit visually uniform color spacing for representation issues.The CIELAB takes into account psychovisual experiments, and models the optical nerve and brainresponse to color stimuli. Similarly to the Y channel in YUV [204] and YDbDr [66] color spaces, theL* axis of the CIELAB color space represents the lightness, while a* and b* represents chrominances,respectively the red to green axis and blue to yellow axis. The uniform color spacing property of

16 CHAPTER 2. STILL IMAGE CODING AND ADVANCED SERVICES
the CIELAB induces that the Euclidean distance between two colors corresponds to the perceivedcolor difference. This color difference measure has been lately updated by several correcting metrics(∆E94 [34], ∆E2000 [174]).
Because of its human vision correlation property, we propose to consider the CIELAB colorspace and to evaluate its capacity to improve the perceptual aspect of the image partitioning whencompared to YUV-based representations. In order to increase the perceptual quality, the partitioningprocess has to give a more accurate representation of the segmentation in particular upon edges. Theexperiments have demonstrated the representation efficiency of the euclidean distance while keepingLAR compression performances in the same acceptable range.
Let us now define a related homogeneity criterion. All criteria take as inputs the minimum andthe maximum pixel values of the three color planes on a given block. For CIELAB color space,(Lmax, Lmin, amax, amin, bmax, bmin) values are tested. The homogeneity criterion based on theEuclidean distance is thus defined as criterion =
√4L2 +4a2 +4b2, where 4L = Lmax −
Lmin,4a = amax − amin,4b = bmax − bmin.
2.3.2.2 Results
Input images are natively in RGB color format and each of these color planes is compressed in theRGB color space by the Interleaved S+P compression algorithm. The image set is composed offive natural images: barba, lena, parrots, peppers, and P06 from JPEG-AIC database [160]. TheInterleaved S+P coder is set in a lossless profile and is driven by the quadtree partitioning of theimage. This quadtree is computed in either YUV color space or in CIELAB color space. The shownimages result from the Flat coder.
Testing procedure. The CIELAB partitioning is set with a threshold TH giving the closest numberof blocks to the number of blocks provided by the ideal YUV partitioning. A reasonable assumption isthat an equivalent number of blocks in the CIELAB quadtree space also gives an equivalent quadtreecoding cost. This way the representations are compared at the same level of granularity.
Quality metrics. As the LAR framework relies on content-based features, the WPSNR metric mustbe used with caution [183]. Among perceptual quality metrics modeling subjective quality, the C4metric has been proved to be the most efficient metric on computing the LAR image quality bycorrelating the most with human observation [183]. This metric evaluates the quality from 1 to 5as in subjective assessment rating where 1 represents the poorest quality. This metric is used in thefollowing results.
Comparison of YUV and CIELAB representations. Since bit-rates being the same, the repre-sentation quality remains to be evaluated and compared. The representation can be both visuallyevaluated or by means of the C4 and WPSNR metrics. On some images, the differences are barelynoticeable but on others, the CIELAB representation with Euclidean criterion clearly outperforms theYUV representation by introducing less noticeable artifacts.
Visually, the differences usually occur for instance in the red tone color (figure 2.6) and areespecially visible in fading areas. YUV partitioning is less discriminant in the red tones and produces

2.4. INTERLEAVED S+P: THE PYRAMIDAL PROFILE 17
larger blocks while the CIELAB produces smaller and more visually accurate blocks. Figures 2.6 showan example of the superiority of the CIELAB-Euclidean representation.
The visual subjective analysis is correlated with the C4 metric analysis. CIELAB partitioning withthe Euclidean criterion produces objectively more visually accurate representation as shown in table2.1. However, the example images 2.6, while being improved by the CIELAB partitioning, exhibit alower WPSNR as shown in table 2.2.
C4 measurement YUV CIELAB Euclidean
Barba 3.320 3.256
Lena 3.703 3.916
P06 2.953 3.049
Parrots 4.393 4.363
Pimen 2.894 3.038
Average 3.453 3.524
Table 2.1: C4 quality assessments with different partitioning criteria and optimal threshold TH
Rate/distortion YUV CIELAB Euclidean
WPSNR PIX 24.909dB 24.887dB
Flat bit-rate: 1.243bpp 1.241bpp
Table 2.2: WPSNR PIXRGB and bit-rate, YUV and CIELAB representations (image: barba)
Depending on the target application objectives, the CIELAB-oriented criterion can be used. Themain drawback is the additional computational cost of the overall process. If low complexity is arequired feature as well a low memory storage, morphological based criterion has to be preferred.
2.4 Interleaved S+P: the pyramidal profile
As shown in 2.2, the pyramidal profile relies on the Interleaved S+P framework [21]. In this section,we first introduce the general principles of our algorithm before setting out the construction of thepyramid.
In the following, M = z0 and G = z1 denote the S-transformed coefficients in such a way thatif (u0, u1) is a couple of value, we have
z0 = bu0 + u1
2c,
z1 = u0 − u1.(2.3)
2.4.1 General principles
The pyramidal decomposition is based on an adaption of the Wu predictor described in [211]. Forfull resolution image, errors are coded by means of three interlaced sampling of the original image.

18 CHAPTER 2. STILL IMAGE CODING AND ADVANCED SERVICES
(a) YUV, 29776 blocks (b) CIELAB, Euclidean crite-rion, 29746 blocks
(c) YUV block image, 29776blocks
(d) CIELAB block image,Euclidean criterion, 29746blocks
(e) YUV, 20962 blocks (f) CIELAB, Euclidean crite-rion, 20932 blocks
(g) YUV block image, 20962blocks
(h) CIELAB block image,Euclidean criterion, 20932blocks
(i) YUV, 11779 blocks (j) CIELAB, Euclidean crite-rion, 11617 blocks
(k) YUV block image, 11779blocks
(l) CIELAB block image,Euclidean criterion, 11617blocks
Figure 2.6: YUV versus CIELAB partitioning.

2.4. INTERLEAVED S+P: THE PYRAMIDAL PROFILE 19
By this way, we tend to obtain a spatial configuration of 360 type context surrounding a given pixelso that the resulting prediction error is drastically reduced.
1M
2G 3G
3M
Figure 2.7: Original application of the S-Transform
The general principle of the Interleaved S+P algorithm is as follows. The first step consists ofapplying the 1D S-Transform on the 2 vectors formed by 2 diagonally adjacent pixels in a 2 × 2block, as depicted in figure 2.7. The two vectors of coefficients are sucessively encoded through twosuccessive passes.
2.4.1.1 Notations.
Let define some useful notations.
let 1M be the image composed of the z0 S-transform coefficient of the first diagonal coded throughthe first pass, such as 1M(i, j) = z(2 ∗ i, 2 ∗ j),let 2G be the image composed of the z1 S-transform coefficient of the first diagonal coded throughthe second pass, such as 2G(i, j) = z(2 ∗ i+ 1, 2 ∗ j + 1),let 3M be the image composed of the z0 S-transform coefficient of the second diagonal codedthrough the third pass, such as 3M(i, j) = z(2 ∗ i+ 1, 2 ∗ j),let 3G be the image composed of the z1 S-transform coefficient of the second diagonal codedthrough the third pass, such as 3G(i, j) = z(2 ∗ i, 2 ∗ j + 1).
2.4.1.2 DPCM principles.
The first pass encodes through a classical DPCM system a uniform subsampled image formed by theaverage of two diagonally adjacent pixels within each 2x2 block (1M transformed coefficients).
Then the second pass predicts the 2G transformed coefficients in order to reconstruct the valueof the two pixels of the first diagonal. At this stage, the 360 type prediction context consists of thealready known values of the current pass and the diagonal means coded by the first pass.
Finally, the third pass encodes the remaining half of the original image composed of the set ofthe 3M and 3G S-coefficients. Once again, thanks to the reconstructed pixels resulting from thetwo previous passes, a completely spatially enclosing and adjacent context is available to predict thetransformed pixel (figure 2.8).

20 CHAPTER 2. STILL IMAGE CODING AND ADVANCED SERVICES
x
Reconstructed pixels from
already coded coefficients
Current coefficient
to be coded
Diagonal mean z01
(already coded : pass 1)
x
x
prediction values
Coefficients of 1st diagonal
(gradient values z12)
Coefficients of second
diagonal (z03 and z1
3)
2nd pass 3rd pass
z01z01
Figure 2.8: Second and third pass of the transformed coefficients prediction process.
2.4.2 Pyramid construction - Interleaving
Let Y the original image be of size Nx × Ny. The multiresolution representation of an image isdescribed by the set Illmax
l=0 , where lmax is the top of the pyramid and l = 0 the full resolutionimage.
As an extension of the Wu method, four blocks N2 ×
N2 are gathered into one block N × N
valued by the average of the two blocks of the first diagonal (first S-pyramid on figure 2.9), that letus write the following equation:
l = 0, I0(i, j) = Y (i, j);
l > 0, Il(i, j) =⌊Il−1(2i,2j)+Il−1(2i+1,2j+1)
2
⌋,
(2.4)
with 0 ≤ i ≤ N lx, 0 ≤ j ≤ N l
y, where N lx = Nx/l and N l
y = Ny/l.
The transformation of the second diagonal of a given 2×2 block can also be seen as a second S-pyramid, where the pixel values depend on the ones existing at the lower level of the first S-pyramid.Interleaving is in this way realized.
Blocks n X n
Blocks n/2 X n/2
Blocks n/4 X n/4
Level l+1
Level l
Level l+2
First S-Pyramid Second S-Pyramid
Figure 2.9: Construction of the pyramid

2.4. INTERLEAVED S+P: THE PYRAMIDAL PROFILE 21
2.4.3 Interleaved S+P Pyramid Decomposition - Refined prediction model
The Interleaved S+P pyramidal decomposition process results from the extension and the adaptationof the Wu prediction method to the whole pyramid. In this section we describe the implementedprediction scheme.
2.4.3.1 Pyramid decomposition principles - Notations
The reconstruction of a 2 × 2 block located on a given level l is realized in two successive passes.First, the S-transform is applied on pixels Il(2i, 2j) and Il(2i+ 1, 2j + 1) so that
1Ml(i, j) = zl,10 (2i, 2j) =
⌊Il(2i, 2j) + Il(2i+ 1, 2j + 1)
2
⌋,
2Gl(i, j) = zl,21 (2i+ 1, 2j + 1) = Il(2i, 2j)− Il(2i+ 1, 2j + 1).
(2.5)
We immediately can notice that the 1M l(i, j) coefficient is equal to the value of the reconstructedpixel obtained in the upper level of the pyramid leading to
1Ml(i, j) = Il+1(i, j). (2.6)
In a similar way, pixels from the second diagonal of a block are processed as follows:
3Ml(i, j) = zl,30 (2i+ 1, 2j) =
⌊Il(2i, 2j + 1) + Il(2i+ 1, 2j)
2
⌋,
3Gl(i, j) = zl,31 (2i, 2j + 1) = Il(2i+ 1, 2j)− Il(2i, 2j + 1).
(2.7)
The entire pyramid is then decomposed in two successive descent processes. If the first one isintended to reconstruct the LAR Flat block image, the second one encodes the image texture: thegrid information is thus exploited (see figure 2.10).
2.4.3.2 Top of the pyramid - Classical DPCM
On the highest level of the pyramid, we applied the first pass so that the Ilmax(i, j) =
zlmax−1,10 (2i, 2j) = 1Mlmax−1(i, j) coefficient values are predicted. For this purpose, we use the
classical MED predictor implemented in the compression method LOCO-I [202].
2.4.3.3 LAR block image processing
Reconstructing the LAR block image means that for a given level of the pyramid, a block is processedonly if the corresponding block size is lower or equal to the level size (i.e. Siz(x × l, y × l) ≤ 2l).Conversely, if Siz(x × l, y × l) > 2l), the block values are copied out so that Il(2i, 2j) = Il(2i +1, 2j) = Il(2i, 2j + 1) = Il(2i+ 1, 2j + 1) = Il+1(i, j).
Note that z stands for the estimated value of transformed coefficient z.
First S-Pyramid. As the 1M l(i, j) value is already known from the upper level of first S-pyramid,we just have to predict the transformed coefficient 2Gl(i, j), standing for gradient value of the first

22 CHAPTER 2. STILL IMAGE CODING AND ADVANCED SERVICES
Blocks n X n
Blocks n/2 X n/2
Blocks n/4 X n/4
Level l+1
Level l
Level l+2
Blocks of sizen/4 X n/4 in Quadtree partition
Figure 2.10: Decomposition and extraction of LAR block image data
2× 2 block diagonal. In the LAR block image processing context (high activity areas), it turns outthat linear prediction is more efficient to estimate 2Gl(i, j) leading to
2Gl(i, j) = 2.1
[0.9Il+1(i, j) +
1
6
(Il(2i+ 1, 2j − 1)
+Il(2i− 1, 2j − 1) + Il(2i− 1, 2j + 1))
−0.05(Il(2i, 2j − 2) + Il(2i− 2, 2j)
)−0.15
(Il+1(i, j + 1) + Il+1(i+ 1, j)
)− Il+1(i, j))
].
(2.8)
Second S-Pyramid. The third pass of adapted Wu predictor encodes the coefficients from seconddiagonal. Estimation of 3M l uses inter- and intra-level prediction from reconstructed values, so that
3M l(i, j) = β00
1
4
(Il(2i− 1, 2j + 1) + Il(2i, 2j + 2)
+Il(2i+ 2, 2j) + Il(2i+ 1, 2j − 1))
+β10 1M l(i, j),
(2.9)
where (β00 , β
10) = (0.25, 0.75), and 1M l(i, j) is the reconstructed value of coefficient 1M l(i, j). The
estimated value 3Gl(i, j) is computed as follows:
3Gl(i, j) = β01
(Il(2i− 1, 2j + 1) + Il(2i, 2j + 2)
−Il(2i+ 1, 2j − 1)− Il(2i+ 2, 2j))
−β11
(Il(2i− 1, 2j) + Il(2i− 1, 2j + 2)
−Il(2i, 2j − 1)− Il(2i, 2j + 1).
(2.10)
with (β01 , β
11) = (3/8, 1/8). Il(2i, 2j + 1) corresponds to the Wu predictor [211] for the third pass
applied to the pixel Il(2i, 2j + 1).

2.5. JOINT IMAGE CODING AND EMBEDDED SYSTEMS METHODOLOGY: ANAPPLICATIVE ISSUE 23
2.4.3.4 Texture processing
The second descent process of the pyramid allows to reconstruct the texture. On each level, pixelof size Siz(x × l, y × l) > 2l are here evaluated. Once again, we can distinguish prediction of firstS-pyramid from the second one.
First S-Pyramid. Texture blocks are characterized by their low local activity. Thus gradient values2G(i, j) are difficult to estimate through linear prediction. This is the reason why we use medianvalues extracted from close neighborhood.
Let me(u1, u2, . . . , un) be the median value of a set of n values (u1, u2, . . . , un). The estimationof coefficient 2G(i, j) located in a texture area is
2G(i, j) =1
4
(me
(Il(2i− 2, 2j), Il(2i, 2j − 2), Il(2i− 1, 2j − 1)
)+me
(Il+1(i+ 1, j), Il+1(i, j + 1), Il+1(i+ 1, j + 1)
)).
(2.11)
Second S-Pyramid. Context is there sufficient to evaluate precisely coefficient values, thanks tolinear predictors. 3Ml are then estimated through the equation 2.9, where (β0
0 , β10) = (0.37, 0.63).
Predicted coefficients 3G(i, j) are obtained by the application of the relation 2.10, where (β01 , β
11) =
(1/4, 0).
2.4.4 Quantization Process
The quantization process used in the LAR codec uses quantization factor Q, boundary bk, recon-struction levels rk and intervals ik such as
• k ≥ 0, bk = b(Q2 + kQ)c , rk = k, ik = (bk..bk+1],
• k < 0, bk = b(Q2 + kQ)c , rk = k, ik = [bk..bk+1].
Such a quantization process is uniform when Q is odd. However when Q is even the quantizationprocess is uniform with a dead zone around 0. Such a quantization process will naturally have animpact on the statistical properties of the resulting bitstream.
2.5 Joint image coding and embedded systems methodology: anapplicative issue
As previously mentioned, the modularity of the scheme authorizes new level of scalability in terms ofcomplexity, closely related to the chosen profile. As long as it is possible, the proposed solutions weredeveloped so that to fit fast prototyping issues. In particular, in connection with the Architectureteam of the IETR laboratory, automatic solutions of fast prototyping onto heterogeneous architecture(DSPs, FPGAs), using Algorithm Architecture Matching methodology [67] were proposed. Conse-quently, if the LAR codec has been developed on PCs, different versions has been implemented ontovarious embedded systems.

24 CHAPTER 2. STILL IMAGE CODING AND ADVANCED SERVICES
Parallel architectures. First embedded systems oriented works were dedicated to the fast devel-opment and implementation of a distributed version of the LAR framework on multi-componentsplatforms [154], or for extended profile with the proper region description, using cosimulation Mat-lab/C approaches [56]. Solutions for fast design of signal and image processing applications havebeen then proposed. Within a unified framework, application modeling, cosimulation and fast imple-mentation onto parallel heterogeneous architectures are enabled and help to reduce time-to-market.The overall system provides thus an automatically generated code enabling a high abstraction levelfor users.
FPGA implementations. In [39], a dedicated FPGA implementation of the Baseline LAR imagecoder has been designed. In particular, the chosen internal architecture has been designed as a setof parallel and pipelined stages, enabling a full image processing during a unique regular scan. Itpresents limited requirements for both memory and computation power.The resulting architecturelatency remains extremely low as it is determined by the data acquisition for one slice of 8 lines.
Dataflow programming for hardware implementation. Implementing an algorithm onto hard-ware platforms is generally not an easy task. The algorithm, typically described in a high-levelspecification language, must be translated to a low-level HDL language. The difference betweenmodels of computation (sequential versus fine-grained parallel) limits the efficiency of automatictranslation. On the other hand, manual implementation is naturally time-consuming. To solve thisproblem, designers are establishing solutions to describe the process in a higher level way. In thevideo coding field, a new high level description language for dataflow applications called RVC-CAL[51] was normalized by the MPEG community through the MPEG-RVC standard [26]. This standardprovides a framework to define different codecs by combining communicating blocks developed inRVC-CAL.
In this context, Khaled Jerbi, a PhD student that I partially co-supervised, defined a global designmethod going from high level description to implementation [88, 89]. The first step consists of thedescription of an algorithm as a dataflow program with the RVC-CAL language. Then the functionalverification of this description using a software framework is realized. The final step consists of anautomatic generation of an efficient hardware implementation from the dataflow program. We usedthis method to quickly prototype and generate hardware implementation of a baseline part of theLAR coder, from an RVC-CAL description. We demonstrated then the ability of the method toprovide efficient automatic hardware implementations.
2.6 Conclusion
As described in this chapter, the Interleaved S+P framework tends to associate both compressionefficiency with scalable content-based representation. Meanwhile, the JPEG committee has definedthe JPEG-AIC guidelines leading to design new or enhance existing functionalities. A large part ofmy work has been then devoted to JPEG committee through an active participation. Clearly, thistime-consuming task could have not been realized without the help of Francois Pasteau and ClementStrauss (both have defended their dissertation) together with Mederic Blestel, who worked in theIETR laboratory during five years.
Quadtree partitioning remains the key feature of each profile of the LAR method. It acts as

2.6. CONCLUSION 25
a simplification process of the image, leading to design realistic embedded systems, while keepinginteresting compression performances. Nevertheless, JPEG core experiments have shown that theglobal framework requires advanced improvements in terms of coding features and solution to matcheasy-to-use application need. These challenges were partially reached through generic coding tools,as described in the next chapter.

26 CHAPTER 2. STILL IMAGE CODING AND ADVANCED SERVICES

Chapter 3
Generic coding tools
Even most part of my work was in connection with the Interleaved S+P coding framework, someadvanced solutions were designed so that to be independent of the coding scheme. Indeed, whenconsidering QoS based tools, such as Rate/Distorsion Optimization (RDO) mechanisms, statisticalmodels are necessary. In parallel, from these models, advanced prediction and entropy processescan be imagined. This chapter presents then generic coding tools aiming at enhancing statisticalproperties as well as pure coding performances.
Among the different functionalities required by JPEG-AIC standardization committee, user-friendly implementation, low computational complexity, as well as efficient multi-component imagecoding performances, are of first interest. Within joint context of the CAIMAN project and JPEG-AIC standardization process, we designed innovative solutions based of an analysis of the predictionerrors of the Interleaved S+P coder. The genericity of the proposed techniques enables to considerthem as part of a universal image coding toolbox. Application to the Interleaved S+P codec ishowever presented throughout this chapter. This chapter corresponds to the main part of FrancoisPasteau’s PhD work.
The idea is then to revisit the different coding steps of any predictive coder. First, whereas stateof the art codecs usually handle multi component images such as color images using only any colortransform, this chapter presents some techniques aiming at improving both the compression ratio andthe quality of the compressed color images. These tools exploit the remaining correlation betweenthe components of an image and take advantage on the prediction errors distribution. After definingrelated notations in section 3.1, adaptive decorrelation has been then designed and is described insection 3.2. This solution relies on improved predictors and is independent of the coding scheme.Therefore they can be applied to any predictive codec such as LAR, H264, etc ...
Secondly, section 3.3 provides a statistical analysis of predictive codecs under the assumptionthat the prediction error distribution follows a Laplace law. In particular, the quantization process ismodeled against the prediction errors to be able to estimate both rate and distortion.
Finally, in section 3.4, the classical entropy coder QM being a binary arithmetic coder, a scanpattern needs to used to encode multiple bit input values. The approach used in the JPEG2K codec,where bit planes are coded one after the other, is not appropriate for the predictive coders whichtypically require a raster scan. Therefore a symbol oriented QM coding is proposed in this chapter.This scan pattern provides a lower complexity as well as similar compression ratio.
27

28 CHAPTER 3. GENERIC CODING TOOLS
Prediction Q++
-Entropy CodingS-transformI
Reconstruction Q-1 Entropy DecodingS-transform
IZ
I
IZ QZI)(
QZI)(
IZ
Substream
QIZ
IZ~
Figure 3.1: Interleaved S+P Coding of a resolution level
3.1 General coding framework - Notations
Figure 3.1 summarizes the coding and decoding processes of an image I through a scalable predictivecoder. In this figure, I is an image from a given resolution level of a given component of the originalimage. It refers to the Il notation used in the previous section. When considering the InterleavedS+P scheme case, the differences between Flat and Texture coding are not mentioned in this figureas they only change the prediction scheme and the part of the image Il to encode. This figureintroduces the main notations used in this document and shall be referred to.
Let define some notations used in this document.
let I be an image corresponding to a given level of the multiresolution representation of a com-ponent of the original image,let ZI be one of the transformed image of I, namely ZI ∈ 2G, 3M, 3G in case of InterleavedS+P framework,let ZI be the prediction of ZI ,let εZI
be the prediction error between ZI and ZI ,let (εZI
)Q be the quantized version of εZIwith quantization factor Q,
let [εZI]Q be the reconstructed version of εZI
after quantization with respect to Q,
let ZI be the reconstructed value of ZI ,let I be the reconstructed value of I.
3.2 Adaptive color decorrelation
3.2.1 Improving decorrelation process: multi component pixel classification
Different studies have been realized so that to lower the resulting bitrate. In particular, solutionsbased on classification processes have been designed. Indeed, classification can be used to improvethe compression ratio of any codec thanks to the principle of conditional entropy. Let A, B and Cbe three statistical variables. Conditional entropy follows the relation
H(C) ≥ H(C|A) +H(C|B),
where A ∩B = ∅, X ∩A ∪X ∩B = X, H(X|A) being the entropy of X knowing A and H(X|B)being the entropy of X knowing B. Therefore if we can divide error values into different classesthanks to new information given by the context, it would lower the overall entropy and improve the

3.2. ADAPTIVE COLOR DECORRELATION 29
compression ratio. Classification requires then both context modeling tools as well as classificationcriteria.
Pixel spatial classification has been first defined in [143] and then is extended to multi-componentimages through a local activity based classification process [144][145], in the case of the InterleavedS+P framework.
In this document, we focus on the generic multi-component image -based solution.
3.2.1.1 Inter-component classification
As shown in [144], classification performed on pixels according to their neighborhood can improvethe compression ratio. The same principle has been extended to multi component images, as forexample color images. Such an algorithm tries to use the residual correlation between differentcomponents of an image to perform an accurate classification. Actually contours are more proneto have high error values whereas homogeneous areas produce low error values. Those areas tendto be located in the same position between the different image components, leading to propose adedicated inter-component classification.
Inter-component classification is performed after the prediction scheme as shown on figure 3.2.In this classification scheme, the goal is to classify (εZC
)Q with information coming from (εZY)Q.
+
Prediction ++-
YZ
Prediction
Entropy Coding
Entropy Coding
Y compression
C compression
-+
Entropy Coding
Entropy Coding
Classification
1Cl
2Cl
3Cl
YZ
CZ CZ~
CZ
YZ~
Figure 3.2: Multi component classification scheme
The proposed inter-component classification is performed according to the following algorithm.Let Cl1, Cl2 and Cl3 be the three classes of the classification.
1. One of the three components is used as a reference Y to code another component C, Y codingprocess is thus not modified.
2. Histogram of absolute values of (εZY)Q is computed.
3. A first error threshold T1 is set to the histogram mean.
4. A second error threshold T2 is set such as 34 of the prediction errors are lower than T2.

30 CHAPTER 3. GENERIC CODING TOOLS
5. Classification is then performed as follows:
6. Cl1 = (εZC)Q—abs((εZY
)Q) < T1.
7. Cl2 = (εZC)Q—T1 ≤ abs((εZY
)Q) < T2.
8. Cl3 = (εZC)Q—T2 ≤ abs((εZY
)Q).
When considering the Interleaved S+P framework, as the 2G, 3M and 3G images presentdifferent characteristics in terms of error distribution, the inter component classification scheme isperformed independently for each type of errors. It leads to three different classifications for bothFlat and Texture coefficients. The aim of such a context modeling is to perform discriminationsinside each type of errors. Thus, coefficients of a given type producing the same error distributionare gathered into one context class.
A set of three pictures has been used to evaluate the performances of the proposed solution. Thisset includes peppers, mandrill and lena pictures (table 3.1). Each of them has different characteristics:mandrill image has high frequencies whereas peppers image features large areas of identical colour.Finally lena has both high frequencies and low frequencies respectively located in her hair and onthe background. To obtain comparable results with other image coders such as JPEG2K, a simplearithmetic coder has been used. Four different color spaces were used for the compression, RGB,YCgCo-R [119], O1O2O3 [43] and the Reversible color transform used in JPEG2K [80]. All thesecolor spaces are reversible and can therefore be used for lossless coding [144].
Except for peppers picture, performing colour space decorrelation improves compression results.The YCoCg-R, O1O2O3 and YDbDR colour spaces offer an average 4% gain on mandrill picture andan average 2.5% gain on lena image. The specificity of peppers picture in regard of colour spacesis due to the fact that this image has mainly two predominant colours, red and green. ThereforeRGB colour space can, in this particular case, leads to better results. However, even if it producesthe best improvement, compression using the RGB colour space remains less efficient in terms ofcompression ratio than the other colour spaces.
Despite the general use of color images, the development of image codecs such as JPEG, JPEG2Kor the newly standardized JPEGXR has been primarily focused on giving the best performance onsingle component images. To handle color images, state of the art codecs usually rely on colortransforms such as YUV, YCgCo and/or subsampling steps to achieve both good compression ratioand good visual quality. However after performing color transforms and/or subsampling, each colorcomponent is independently encoded.
When considering lossless coding, coding techniques rely on statistical analysis of the image toperform compression. As subsampling would cause losses, only reversible color transforms can beused. However, even after applying static color transforms, residual correlation still exists betweencomponents [144]. This underlaying correlation results in an suboptimal compression rate as decor-relation has been statically done without consideration of the statistics of the image itself. A criticalapplication of lossless coding of colour images concerns cultural digital libraries [116]. Museumsactually try to safely digitalize their belongings and thus to produce large quantities of lossless colourpictures. Moreover, current digital cameras are widespread and generate high resolution colourimages. Professional photographers tend to prefer lossless compression of their pictures to avoidartifacts due to image compression.
To improve the compression ratio of color images for lossless coding as well as quality for lossycoding purposes, different approaches have been studied. In particular, performing adaptive inter

3.2. ADAPTIVE COLOR DECORRELATION 31
peppers Alone Classification
YCoCg-R 14.975 14.898
O1O2O3 14.968 14.896
YDbDr 15.048 14.960
RGB 14.907 14.767
mandrill Alone Classification
YCoCg-R 18.170 18.121
O1O2O3 18.106 18.065
YDbDr 18.122 18.084
RGB 18.948 18.705
lena Alone Classification
YCoCg-R 13.582 13.437
O1O2O3 13.536 13.392
YDbDr 13.577 13.422
RGB 13.914 13.662
Table 3.1: Compression results in bpp
component decorrelation was considered. Such an adaptive decorrelation differs from usual reversecolor transforms by its automatical adaptivity to the image statistics.
3.2.2 Principles
Adaptive color decorrelation can be seen as a reversible color transform with Y ′
C ′1C ′2
=
1 0 0−µC1 1 0−µC2 0 1
YC1
C2
(3.1)
where µC1 and µC2 values are adaptively computed during the coding process to best fit the statisticsof the image.
The idea is here to take advantage of these statistics so that to improve coding performances.By performing adaptive decorrelation during the prediction process itself, both compression ratio andquality can be improved in a single pass. The figure 3.3 represents the functional implementation ofsuch a technique, whereas the algorithm used to perform the decorrelation is presented in Algorithm3.1.
On line 11 of algorithm 3.1, the adaptive decorrelation is performed on the predictor applied oncomponent C. The predictor is decorrelated according to the reconstructed value of the predictionerror of component Y . The µC update process described on lines 15-27 is used to update the

32 CHAPTER 3. GENERIC CODING TOOLS
Figure 3.3: Adaptive Decorrelation during Prediction Scheme
decorrelation factor at each iteration by computing a new barycenter of the set of points of coordinates
(ZC′− ZC ; [εZY
]Q).
To enable a correct behavior at decoder side, ZC′
has to be used as it is the only availablereconstructed value at decoder side. However predictions computed before decorrelation ZC are
used instead of predictions after decorrelation ZC′
to ensure an accurate update of µC .
To avoid DC = 0 we perform a point reflection on the points of coordinate (x; y)|y < 0 aroundthe origin (0, 0). Therefore only the absolute value of [εZY
]Q is taken into consideration in DC . Toensure a locally adaptive decorrelation, we decrease the numerator and denominator by a factor ofµC after cpt iterations. The number of iterations and the divider of the numerator and denominatorhave been empirically evaluated.
As adaptive decorrelation can be realized at both encoder and decoder sides, the process itself iscostfree. Moreover, due to this symmetric process, adaptive decorrelation is also a lossless process.
3.2.3 Process validation: application to Interleaved S+P codec
Interleaved S+P version [21] of the LAR codec has been used as reference codec to implementand validate this adaptive decorrelation solution. As we showed in a previous study [144] using theRGB color space with an adaptive decorrelation and classification leads to better results than usingstatic color transform. The RGB color space has thus been used during the benchmark process.The image set is composed of 10 images coming from the second core experiment of JPEG-AIC(bike crop, cafe crop, p06 crop, p10 crop, rokounji crop, p26 crop, zoo crop, green crop, north-coast crop, woman crop)[160]. The resolution of these images is 2 megapixels in 24 bit color depth.Compressions were performed with different quantization factors from lossless Q=1 up to Q=32.To implement inter-prediction, basic predictors directly using the values of the neighborhood wereused. Table 3.3 presents average quality results using the WPSNR MSE metric [177] in dB. Despiteof not being directly correlated with the Mean Opinion Score in the case of the LAR codec [183],the WPSNR MSE metric has been used in these tests as it is one of the quality metrics used in theJPEG AIC standardization process.
Table 3.4 presents average rate results in bits per point (bpp). Column named Alone references to

3.2. ADAPTIVE COLOR DECORRELATION 33
Algorithm 3.1: Adaptive decorrelation algorithm during prediction
1: Initialization2: cpt = 03: NC = 04: DC = 05: µC = 06: for all i do7: Adaptive Decorrelation on predictor8: ZC
′= ZC + µC × [εZY
]Q
9: ε′ZC= ZC
′− ZC
10: ZC′= ZC
′+ [ε′ZC
]Q11:
12: µC update13: if DC > 0 or [εZY
]Q 6= 0 then
14: NC = NC + (ZC′− ZC)× sign([εZY
]Q)15: DC = DC + |[εZY
]Q|16: µC = NC/DC
17: cpt = cpt+ 118:
19: Ensure local adaptation20: if cpt > 1000 then21: NC = NC/422: DC = DC/423: cpt = 024: end if25: end if26: entropycoding((εZY
)Q)27: entropycoding((ε′ZC
)Q)28: end for
the Interleaved S+P codec itself, Decorrelation during prediction references to the method presentedin previous section.
3.2.3.1 Lossless compression case.
In a lossless context (Q=1), adaptive decorrelation prediction process has been studied with thesame experimental conditions as for inter-component classification in section 3.2.1.1. Table 3.2shows that adaptive inter-component decorrelation improves the compression ratio for all imagesand colour spaces. The most significant improvements are realized with RGB colour space. RGBbeing the most correlated colour space used in this work, adaptive inter-component decorrelationcan be more accurate and can result in even better compression gain. Inter-component classificationleads also to better compression ratios for all images and all colour spaces. It even outperforms theadaptive decorrelation in few cases such as peppers picture with YCgCo-R and O1O2O3 colour spaces.However, in most cases, this classification is still less efficient than the adaptive inter-component
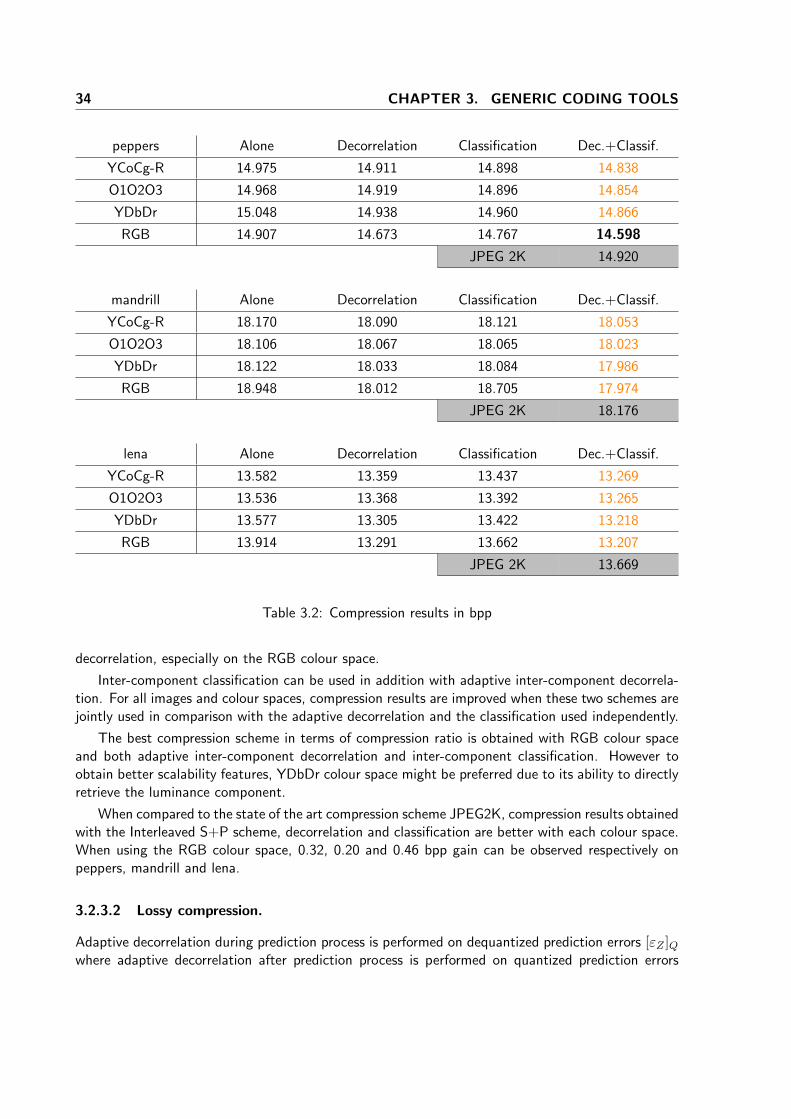
34 CHAPTER 3. GENERIC CODING TOOLS
peppers Alone Decorrelation Classification Dec.+Classif.
YCoCg-R 14.975 14.911 14.898 14.838
O1O2O3 14.968 14.919 14.896 14.854
YDbDr 15.048 14.938 14.960 14.866
RGB 14.907 14.673 14.767 14.598
JPEG 2K 14.920
mandrill Alone Decorrelation Classification Dec.+Classif.
YCoCg-R 18.170 18.090 18.121 18.053
O1O2O3 18.106 18.067 18.065 18.023
YDbDr 18.122 18.033 18.084 17.986
RGB 18.948 18.012 18.705 17.974
JPEG 2K 18.176
lena Alone Decorrelation Classification Dec.+Classif.
YCoCg-R 13.582 13.359 13.437 13.269
O1O2O3 13.536 13.368 13.392 13.265
YDbDr 13.577 13.305 13.422 13.218
RGB 13.914 13.291 13.662 13.207
JPEG 2K 13.669
Table 3.2: Compression results in bpp
decorrelation, especially on the RGB colour space.
Inter-component classification can be used in addition with adaptive inter-component decorrela-tion. For all images and colour spaces, compression results are improved when these two schemes arejointly used in comparison with the adaptive decorrelation and the classification used independently.
The best compression scheme in terms of compression ratio is obtained with RGB colour spaceand both adaptive inter-component decorrelation and inter-component classification. However toobtain better scalability features, YDbDr colour space might be preferred due to its ability to directlyretrieve the luminance component.
When compared to the state of the art compression scheme JPEG2K, compression results obtainedwith the Interleaved S+P scheme, decorrelation and classification are better with each colour space.When using the RGB colour space, 0.32, 0.20 and 0.46 bpp gain can be observed respectively onpeppers, mandrill and lena.
3.2.3.2 Lossy compression.
Adaptive decorrelation during prediction process is performed on dequantized prediction errors [εZ ]Qwhere adaptive decorrelation after prediction process is performed on quantized prediction errors

3.2. ADAPTIVE COLOR DECORRELATION 35
(εZ)Q. Without quantization, the dequantized value of the prediction error [εZ ]Q is equal to thequantized one (εZ)Q, thus leading to the same results.
However when considering lossy compression, adaptive decorrelation during prediction producesbetter results and achieves a gain up to 0.4 bpp (20%) for high quantization (Q = 32). Adaptivedecorrelation during prediction improves both quality and compression rate in all cases.
Quantization AloneDecorrelation during
prediction
Q = 4 42.709 42.813
Q = 8 38.289 38.494
Q = 32 30.148 30.715
Table 3.3: Quality results of proposed methods in PSNR (db)
Quantization AloneDecorrelation during
prediction
Q = 1 13.599 12.092
Q = 4 6.6723 5.4472
Q = 8 4.4755 3.5204
Q = 32 1.5075 1.1070
Table 3.4: Rate results of proposed methods in bits per pixel (bpp)
3.2.4 General use of the method
The color-based method of decorrelation defined in this section is entirely reversible. It requires no sideinformation and automatically matches the image content. In terms of performances, the adaptivedecorrelation during prediction process decreases significantly the final rate as well as increases theoverall objective quality.
Of course, these results have been mainly used together with the Interleaved S+P codec. How-ever, as soon as a predictive codec is defined, the adaptive color decorrelation solution can beintegrated within the coding scheme. Typically, the image codec standard JPEG-LS is based ona predictive tool able to discriminate between contours and flat areas: the decorrelation processwould provide an enhancement in terms of compression ratios. As for video coders, the MPEG-basedframework embeds spatial prediction functional block that could also benefit from our solution.

36 CHAPTER 3. GENERIC CODING TOOLS
3.3 Statistical analysis of predictive coders based on Laplacian dis-tributions
In addition to advanced decorrelation solutions, as shown in previous section, complementary codingtools based on statistical modeling process can be designed. In particular, an analysis of predictivecoders in terms of error distribution can be conducted RDO purposes.
The proposed analysis relies on a Laplacian probability distribution model that is used to charac-terize prediction errors according to a reduced set of parameters. From these parameters, estimatorsof both quality and entropy are proposed. The case of quantized residues is especially consideredas quantization process is directly implies for lossy compression purposes. These discrete models arethen validated in the case of the Interleaved S+P coder. In this document, only main properties aregiven: relative proofs are described in [142].
3.3.1 Laplace distribution: a widespread model
When considering image coders, many studies have been done to characterize the distributions ofthe resulting data. Indeed, whatever the coding principle is (transform-based, predictive or hybridcoder), the idea is to minimize the overall entropy. To this aim, statistical properties are of majorinterest. Moreover, as we try to achieve realistic solutions of RDO, the chosen statistical model hasto be low complex.
In the literature, most of image coder standards are based on Discrete Cosine Transform (DCT).In this context, statistic features of transform residuals have to be estimated [105].
If Gaussian distributions have first been studied, Laplace distributions [97], Generalized Gaussiandistributions (GGD) [216][219] and Cauchy distributions [4] lead to more accurate models. As Laplacedistribution can be seen as a special case of GGD, the latter shows a higher accuracy in offline analysis[105]. However, tuning GDD requires an additional parameter when compared to Laplace and Cauchydistributions. In [45], authors claim that the predictability of the model parameters is even moreimportant than the accuracy of the models themselves. As a consequence, the high complexity ofGDD based analysis prevents from using it for inline RDO solutions even if there is a loss of accuracy.Similarly, even if the generalized Gaussian model gives the most accurate representation of the ACcoefficient distribution, the Laplacian model is commonly employed because of its ability to be bothmathematically and computationally more solvable [135].
When considering Cauchy distributions, a higher accuracy is observed in the case of heavy tails oftransformed residuals [4]. Nevertheless, although Cauchy distribution’s mean can be taken as zero,since it is symmetrical about zero, the expectation, variance, higher moments, and moment generatingfunction do not exist. Attempts to estimate these parameters will not be successful. In RDO context,this properties penalize the process and prevent from utilizing it. Laplacian Mixture Model (LMM)have also been proposed for modeling coding residues [141], but the overall performances in bothterms RDO and complexity tend to set aside those solutions. When considering wavelet-basedcoding solution, such as SPIHT-like coders, if hyperbolic probability density function better fits thereal distribution [185], Laplacian models are used [199].
As for pure predictive coders, they typically also rely on Laplacian-like error distributions[104][212]. Moreover, classical RDO processes rely on Mean Square Error (MSE) metrics. Evenif this metric from maximum likelihood perspectives is not as accurate as the Cauchy metric is [172],

3.3. STATISTICAL ANALYSIS OF PREDICTIVE CODERS BASED ON LAPLACIANDISTRIBUTIONS 37
the use of MSE is in particular justified as soon as the error follows a Gaussian or Laplace distribution.To sum up, in the literature, authors usually use Laplace distribution models for coding purposes[212]. A good tradeoff between the computational complexity and accuracy is thus reached.
3.3.2 A Laplace’s Law distribution
The first part of this study addresses the problem of finding a probability distribution model whichfits the experimental probability distribution of εZ . In this first part of the study, quantization is nottaken into account to simplify the model (Q=1). Quantization issue will be studied in section 3.3.3.
3.3.2.1 Notations.
We introduce some notations related to the Laplacian probabilitymodel.
Let PQ(x) be the probability P (x = (εZ)Q) depending on quantization parameter Q,
let αQ be the scalar such as PQ(x) = αQe− |Qx|
b ,let αQ
c be the approximated version of αQ in continuous domain,
let αQd be the approximated version of αQ in discrete domain.
3.3.2.2 Laplace probability distribution model
Laplace’s law can be expressed by
P1(x) = P (x = (εZ)1) ,= α1e− |x|
b (3.2)
where P1(x) represents the probability of the prediction error x appearing among (εZ)1.
Laplace’s law is expressed in the continuous domain. Therefore to ensure fitting to a probabilitydistribution, ∫ +∞
−∞α1
ce−|x|b dx = 1 (3.3)
should be verified, where α1c corresponds to the approximation of α1.
Therefore,
1
α1c =
∫ +∞
−∞e−|x|b dx
α1c =
1
2b.
In continuous domain, a probability distribution model using Laplace’s law is approximated by
P1(x) ≈ 1
2be−|x|b . (3.4)

38 CHAPTER 3. GENERIC CODING TOOLS
3.3.2.3 Discretization of a continuous function issue
Laplace’s law is an expression in continuous domain. However, as the probability distribution iscomputed from discrete values in image compression context, such a function has to be sampled tobe a valid probability distribution model. In the rest of the study, N corresponds to the dynamicof prediction errors. Therefore −dN−1
2 e and bN−12 c respectively correspond to the lower and higher
limit values of these residues.
To discretize the continuous expression between −dN−12 e and bN−1
2 c, α1 needs to be reevaluated
using the sum∑bN−1
2c
x=−dN−12e instead of the integral in equation 3.3, so that
bN−12c∑
x=−dN−12e
α1e− |x|
b = 1,
, thus leading to
α1 =1− e−
1b
1 + e−1b
.
Therefore, a probability distribution model from Laplace’s law applied to discrete values can beexpressed as
P1(x) =1− e−
1b
1 + e−1b
e−|x|b . (3.5)
Now that as the expression of the probability distribution model is known, it is important to findthe parameters that will ensure a well fitted probability distribution model.
3.3.2.4 Parameters determination
As shown on equation 3.5, Laplace’s law probability distribution model can be completely determinedby only one parameter b. Therefore, this parameter needs to be chosen to best fit the practicaldistribution model. To do so, we propose to first determine the α1 parameter introduced in equation3.2.
How to determine the α1 parameter. By noticing that P1(0) = α1, the determination of α1
becomes trivial when the whole practical probability distribution is available. Therefore, during theprediction process, it is possible to online determine α1 by monitoring the number of errors equal tozero produced by the prediction process.
However, such an estimation of α1 is strongly dependent on the mean value of the probabilitydistribution. In fact, a biased experimental distribution will lead to a completely inaccurate probabilitydistribution model. However as explained before, this study has been performed under the assumptionthat the mean value of the probability distribution equals zero.

3.3. STATISTICAL ANALYSIS OF PREDICTIVE CODERS BASED ON LAPLACIANDISTRIBUTIONS 39
How to determine the b parameter. From α1, b can be estimated using
b =1
ln(
1 + α11− α1
) . (3.6)
3.3.3 Impact of quantization
Quantization represents a second step in the prediction error production. Such a quantization hasbeen explained in section 2.4.4. First, quantization process has been applied to Laplace’s law proba-bility distribution model, and the obtained mathematical relationships are presented here. Secondly,quantization impact on prediction efficiency has been studied.
3.3.3.1 On error distribution
Mathematical approach from Laplace’s law. The goal of such a study is to understand theimpact of quantization on the probability distribution from a mathematical point of view, withoutconsidering the impact of quantization on the prediction efficiency.
As the quantization process is not uniform, it can be mathematically expressed by
PQ(x) = αQ(x)e−|Qx|b , (3.7)
with
αQ(x) =
αQ0 = 1− 2e
−bQ2 c+ 1
b
1 + e−1b
, if x = 0;
αQ∗ = e
bQ−12 cb − e
−bQ2 c+ 1
b
1 + e−1b
, otherwise.
(3.8)
When comparing equation 3.2 with equation 3.7, e−|x|b becomes e−
|Qx|b . Without considering
αQ(x), by identification, it is possible to observe that b becomes bQ .
However, as the quantization is not uniform around 0 when the quantization factor Q is even,Because of αQ being dependant of x, after quantization, the probability distribution does not fitwith Laplace’s law model anymore.
Approximation of quantized distribution. When quantized, prediction errors do not followLaplace’s law anymore. The approximation αQ(x) = αQ(0) = αQ
d is then proposed. Under thishypothesis, a probability distribution model following Laplace’s law can be found so that
PQ(x) ≈ αQd.e−
|Qx|b , (3.9)
with
αQd =
1− e−Qb
1 + e−Qb
.

40 CHAPTER 3. GENERIC CODING TOOLS
Such a model can be compared to equation 3.5 where b is replaced by bQ
3.3.3.2 On prediction efficiency
As predictions are performed on previously encoded pixels, quantization impacts the prediction errordistributions as well as the prediction efficiency. In the previous section, prediction efficiency has notbeen considered and mathematical relationships were only derived from the unquantized probabilitydistribution model. To assess the impact of quantization on predictors, we define bQ as the bparameter from the probability distribution model of unquantized errors εZI
when quantization factorQ is applied.
Tests have been conducted on the images from the core experiment 2 from JPEG AIC [101]. Eachimage has been compressed using Interleaved S+P version of the LAR codec using different valuesof quantization parameter (Q ∈ [1, 255]). For each prediction pass, the probability distributionof prediction errors before quantization, namely εZ , has been extracted. Using equation 3.6, bQparameter has been estimated for εZ . This parameter refers to the efficiency of the predictor.A lower efficiency will be observed as the bQ parameter increases and an higher efficiency as bQdecreases.
An increase of the b parameters can be observed, representing the loss of efficiency of predictors.However if we consider the approximation of quantized distribution
PQ(x) ≈ 1− e−Qb
1 + e−Qb
e−Qxb ,
PQ can be expressed as a function of bQ so that PQ(x) ≈ f( b
Q). In previous sections, the impact ofquantization has not been considered, therefore the approximation b1 ≈ bQ has been used and an
error of bQ − b1 has been neglected. To estimate the error realized on PQ, the errorbQ−b1
Q has beenstudied. When considering quantized probability distributions, the increase of b related to the lowerefficiency of predictors has shown to be compensated by the quantization factor. As a consequence,the impact of quantization on prediction efficiency can then be neglected.
3.3.4 Entropy estimation
From a probability distribution model, entropy can be computed. As entropy computation has astraightforward relationship with the probability distribution model, the accuracy of the entropyestimation relies on the accuracy of the probability distribution model. In this section, three differententropy estimators are proposed from the most simple expression to the most complex one. Allestimators are then compared to practical results and discussed.
3.3.4.1 Statistical study
From discrete domain. From the expression of the probability distribution model shown in equation3.9, entropy H can be estimated using

3.3. STATISTICAL ANALYSIS OF PREDICTIVE CODERS BASED ON LAPLACIANDISTRIBUTIONS 41
H =
N2∑
x=−N2
−PQ(x).log2(PQ(x)), (3.10)
H ≈ −log2(αQd) + 2
αQd.Q.e−
Qb
ln(2).b.(1− e−Qb )2
.
Therefore,
H = −log2(αQd) + 2
Q.e−Qb
ln(2).b.(1− e−2Qb ). (3.11)
The first member of the expression namely −log2(αQ) corresponds to the affine relationship betweenH and Q. The second member
2Q.e−
Qb
ln(2).b.(1− e−2Qb )
leads to a positive estimation of the entropy even if Q > b.
Equation 3.11 can be expressed as H = f(Q, b). We can notice that
∀γ ∈ R, f(Q, b) = f(γQ, γb).
We consider b0 and b1, two possible values for the b parameter and Q0 and Q1 two possible valuesof the quantization factor Q. Therefore if we know f(Q, b0) for all Q, it is possible to extrapolatef(Q1, b1) according to
f(Q1, b1) ≈ f(Q1.b0
b1, b0).
3.3.4.2 Comparison with practical results and limits
Figure 3.4 presents entropy estimations from equation 3.11 as well as the entropy experimentallyfound. Such an entropy has been computed from the experimental probability distribution withouttaking into account entropy coding. This experiment has been conducted on the images from the coreexperiment 2 from JPEG AIC [100]. Each image has been compressed with different quantizationfactors Q ∈ [1, 255] and entropy from each stream has been extracted. Models have been constructedfrom these streams and entropy have been estimated using the proposed models. Figure 3.4 presentsthen an example of results on a stream reflecting the common behavior of both the models andexperimental entropies.
As explained before, experimental entropy has two main characteristics. When Q < b, relationshipbetween entropy H and log2(Q) is affine. However when Q >> b, a deadening can be observed.Entropy estimation from continuous domain can not follow the experimental entropy and becomesnegative when Q >> b. Approximation from discrete domain as well as the mathematical expressionfrom Laplace’s law produce similar results and tend to underestimate entropy when Q >> b. Sucha behavior is to be expected as the proposed models do not take into account the statistic noise.At high quantization factor, this statistic noise will cause a higher entropy as it represents extrainformation, not considered by Laplace’s law models, to be encoded.

42 CHAPTER 3. GENERIC CODING TOOLS
100
101
102
−2
−1
0
1
2
3
4
5
6
Quantization Factor Q
Ent
ropy
H (
bpp)
ExperimentalContinuous domainDiscreet domainApproximation discreet domain
Figure 3.4: Comparison between practical results, pure mathematical, approximated quantized andcontinuous domain
3.3.5 Mean Square Error estimation
In this section, we estimate the distortion created by the quantization process. To do so, we estimatethe mean square error from the probability distribution model and the quantization factor Q.
3.3.5.1 Statistical Approach
Mean square error can be expressed from a Laplace’s law probability distribution model according to
MSE ≈ 4α1b3 +
4α1e− b
Q2 cb
1− e−Qb
(e−
1b − 1
)b3 −
(bQ−1
2 ce− 1
b + bQ2 c)b2
+12
(bQ−1
2 c2e−
1b − bQ2 c
2)b.
(3.12)
As the MSE estimator has been derived from the probability distribution model without quanti-zation, only P1(x) has been used and not PQ(x). Therefore approximations presented in 3.3.3.1 arenot used.
All the calculations are performed from the initial hypothesis that the probability distributionfollows Laplace’s law. Three characteristics can then be observed. First, when quantization factor Qis equal to its maximum value, meaning that all ZQ = 0,
limQ→∞
MSE = 4α1b3.
Therefore, if b >> 1, 4α1b3 ≈ 2b2, leading to
limQ→∞
MSE = 2α1b2.
From equation 3.12, MSE can be expressed as a function of Q and b, so that MSE = g(Q, b).Therefore, we can approximate that
∀γ ∈ Rγ2g(Q, b) ≈ g(γQ, γb)

3.3. STATISTICAL ANALYSIS OF PREDICTIVE CODERS BASED ON LAPLACIANDISTRIBUTIONS 43
As with entropy estimators, if we know g(Q, b0) for all Q and one value of b0, it is possible toextrapolate g(Q1, b1) using
g(Q1, b1) ≈(b1b0
)2
g
(Q1.b0b1
, b0
).
Finally, whereas entropy is mean invariant, the efficiency of mean square error estimators relies onthe mean value of the probability distribution model being equals to zero.
3.3.5.2 Comparison with practical results and limits
As for entropy estimation, quality estimator has been compared to experimental values. The experi-ment has been conducted the same way as for entropy estimators. Each image has been compressedwith different quantization factors, Q ∈ [1, 255], and mean square error values from each stream hasbeen extracted. Models have been constructed from these streams and resulting distortions havebeen estimated using the proposed model.
0 50 100 150 200 2500
20
40
60
80
100
120
Quantization Factor Q
MS
E
Experimental MSEMSE estimation
Figure 3.5: Comparison between experimental and estimated MSE
Figure 3.5 presents an example of quality estimation versus experimental quality where limits ofestimator can be clearly noticed.
The first limit to be noticed is that the estimation seems to have a bias and a simple translationQ = Q−3 can fix it. This inaccuracy comes from the approximation used to produce equation 3.12,ie∫
instead of∑
. The maximum distortion is obtained when Q = 255. A big difference betweenthe estimated and obtained quality can be nevertheless observed. This difference can be explainedby the statistical noise for Q >> 1. This statistical noise is mainly dependent on the image andcannot be expressed by the model presented here.
3.3.6 Applications to the Interleaved S+P predictive codec
The described estimators of MSE and entropy for predictive codecs based on Laplacian error distri-bution are naturally relevant for Rate Distortion Optimization. As JPEG-LS relies on the assumptionthat residuals follow a two-sided geometric distribution (thus a discrete Laplace distribution) [203],using such estimators would probably take advantage of them espacially for near-lossless purposes.

44 CHAPTER 3. GENERIC CODING TOOLS
In [142], an immediate application was the extension of the method to the particular multires-olution description of the Interleaved S+P method. Relations between prediction error substreamsof different levels are studied. To this aim, parameters b from substreams of different resolutionlevels have been compared. Then distortion propagation from one level on another has been studiedleading to an estimator of the final mean square error of an image after coding.
From this study, a few mathematical tools have been designed to help realize a good rate distortionoptimization. This tools can be divided in three categories: at stream level, at resolution level andfrom multiresolution. Therefore, we have the following relations.
• at stream level
b3M ≈ b3G1.7
(3.13)
HLi =H2G +H3M +H3G
3(3.14)
MSEa∪b ≈ MSEM +MSEG
4+niG4n
(3.15)
• for multiresolution
bLi+1 ≈bLi0.9
(3.16)
H =LMax∑i=0
1
2iHLi (3.17)
MSELi ≈1
2
(MSELi+1 +
MSE2G
4+ni2G4n
+MSE3M +MSE3G
4+ni3G4n
)(3.18)
Besides rate distortion optimization, these relationships can be used in other domain. For exam-ple, the quality of the decoded image can be estimated before the decoding process, only from thebitstream itself. This solution, first developed for JPEG2K in [25], can be then adapted to any coderas soon as estimators of both entropy and quality are known. Such a mechanism estimates the qualityof the decoded image without decoding it and without any side information (figure 3.6). First thebitstream is parsed to know the size, the availability of each substream as well as the quantizationused. For each substream according to equation 3.6, the b parameter is estimated. From this bparameter and the quantization factor, equation 3.12 is used to estimate the Mean Square Error.Finally equation 3.18 is used to sum the MSE of all substreams included in the input bitstream.
Parsing bLi = f ( HLi,QLi ) MSELi = f ( bLi,QLi )MSELi ∑
bLi
QLi
HLi
MSEBitstream
Figure 3.6: A priori quality estimation

3.4. SYMBOL-ORIENTED QM CODING 45
3.4 Symbol-oriented QM coding
Sections 3.2 and 3.3 have respectively dealt with the prediction process and the resulting distributionmodel. The last step of any encoding framework requires an entropy coder to reduce the amount ofbytes needed to be stored. It uses a statistical representation of the data to be compressed, so thatto produce a bitstream using as little data as possible.
Entropy coding itself can be performed through different entropy coders. Commonly knowncoders are run length coder, Huffman coder [74], Golomb coder [63] or arithmetic coder [161]. Q15[81] as well as MQ [80] fall in the last category, i.e. arithmetic coders. Such an arithmetic coder usesthe principles of Elias coding using intervals to represent input symbols. The size of each intervalcorresponds to the probability of the symbol to appear. Q15 and MQ belong to a subcategory ofarithmetic coder, namely binary arithmetic coder. Such coders use only two symbols as input, 0 or1 each represented by a separate interval.
Arithmetic coders generally offer good compression ratio as well as a relatively low complexityin regards to other arithmetic coders. To lower the overall complexity, the idea is here to propose asymbol-oriented coding scheme based on QM coding scheme.
3.4.1 Symbol-oriented entropy coding: motivation
As a binary arithmetic coder can only take binary values (0 or 1) as input, a scan pattern is requiredto encode values coded with multiple bits. The JPEG2K entropy coder uses a bit-plane orientedcoding [169]. Bit plane oriented coding involves coding bits in an ”horizontal” way: first all mostsignificant bits from all values are encoded, then the next less significant bit plane until it reachesthe least significant bits. As JPEG2K is not a predictive codec and relies on a wavelet transform, anapproximated decoding of the values from only the few first bits already gives interesting informationto reconstruct the pixel values. Therefore such a bit plane coding can be used as part of a rate control.However in case of predictive codecs, fully reconstructed prediction error values are required. Indeedan approximated prediction error would result in incorrect pixel reconstruction as well as incorrectpredictions afterwards, leading to error propagation within the reconstructed image.
Moreover a bit plane oriented coding needs the whole input stream to be available to startencoding. Classically, prediction errors are computed one after another following a raster scan. Thisway, the bit plane oriented coder has to wait that all predictions have been realized before startingand therefore does not allow parallelism between prediction and entropy coding (figure 3.7).
Prediction Q++-
Entropy CodingYZ YZ~∀ pixels∀ pixels
Figure 3.7: QM coding scheme with bit plane orientation
To address this issue, a symbol-oriented QM coding is proposed. Such a symbol oriented codinginvolves to code bits in a ”vertical” way. All bits from an input value, referred as a symbol in thecase of entropy coding, are then encoded before starting encoding all bits of the next symbol. Such ascheme enables inline entropy coding of prediction errors directly after the prediction process (figure

46 CHAPTER 3. GENERIC CODING TOOLS
3.8). Such a characteristic enables
• to monitor the stream size for rate control and adjust the quantization factor through a feedbackloop,• to determinate the context for the QM Coding during the prediction process,• to pipeline the prediction process with the entropy coding.
Prediction Q++-
Entropy CodingYZ YZ~
Context selection
∀ pixels
Figure 3.8: QM coding scheme with symbol orientation
3.4.2 QM bit plane oriented coding: an overview
As shown on figure 3.9, QM bit plane oriented coding is performed in an ”horizontal” way. To avoidbeing dependent of the sign, symbols are not coded in a 2’s complement representation but ratherwith a sign bit and the absolute value of the symbol. This entropy coding framework relies on threedifferent passes: significant pass, sign coding and magnitude refinement pass.
-15 20 2 31 0
1
0
1
1
1
1
0
1
0
1
0
0
0
0
0
0
1
0
0
1
1
1
1
1
0
0
0
0
0
0
Symbol
Sign
MSB
LSB
Sign Coding
Significant propagation pass
Magnitude refinement pass
Figure 3.9: Example of QM coding with bit plane orientation
Significant pass. This pass aims at encoding the first most significant bits of the symbols. The bitplane oriented coder starts in significant pass that processes the most significant bit of the symbols.Two cases can arise after coding a bit:
• After coding a ”0” value, the coder continues in the same bit plane with the next symbol.

3.4. SYMBOL-ORIENTED QM CODING 47
• After coding a ”1” value, the coder encodes the sign of the current symbol in the sign codingpass. All remaining bits of this symbol will be from now on coded in the magnitude refinementpass. After coding the sign of the symbol, the coder continue in the same bit plane with thenext symbol (symbol ’20’ in figure 3.9).
Sign coding. As explained previously, sign coding is performed when a ”1” is met in the significantpass. Sign coding is performed by encoding the binary value of the sign with the MQ Coder.
Magnitude refinement pass. Finally magnitude refinement pass is performed for all remainingbits after finding a ”1” in the significant pass.
3.4.3 Proposed symbol oriented coding
As shown on figure 3.10, symbol plane oriented coding is performed in a ”vertical” way. As for bitplane oriented coding, symbol oriented coding uses a sign bit and the absolute value of the symbol.It also involves three different passes: magnitude, sign and refinement coding.
-15 20 2 31 0
4
-
-
1
1
1
5
-
0
1
0
0
2
-
-
-
-
0
5
-
1
1
1
1
0
-
-
-
-
-
0 1 0 1 -
Symbol
Sign
MSB
LSB
Sign Coding
Magnitude Coding
Refinement Coding
Magnitude
Figure 3.10: Example of QM coding with symbol orientation
Magnitude coding. Magnitude coding (figure 3.11) is designed so that to encode the number ofbits needed to represent the symbol to be encoded as well as to adjust the complexity of the overallentropy coding process by minimizing the number of QM coding passes used.
Magnitude coding is performed in three steps.
• First, the minimal number of bits X needed to represent the symbol X to encode is computed,as shown in algorithm 3.2. It relies on a loop to look for the minimal number of bits needed toencode the symbol X. Let maxX be the maximal possible value of X. This loop is performedat most maxX times and requires only bit shifting and subtraction. Therefore its complexityremains low.

48 CHAPTER 3. GENERIC CODING TOOLS
X
θ Tab computation
computationSymbol X Unary coding QM coding
Context
Figure 3.11: Magnitude coding process
• Then X is coded through unary coding with the dictionnary Tab containing the length of thecodeword. To be able to construct a well fitted dictionary, a statistical study of the symbolto encode (i.e. prediction errors) has to be carried out (typically as described in section 3.3).From this study, the probability distribution of the magnitude of the prediction errors can beestimated. Let PMag(x, θ) be the probability P (x = X) with an error probability distributionestimated with the set of parameters θ. The dictionary Tab can be then determined usingalgorithm 3.3 as well as the error distribution model P (x = X).
• Finally, each bit from the unary codeword is encoded with the QM Coder.
3.2.
Algorithm 3.2: X Computation
Require: XEnsure: X
1: Initialisation of a temporary variable comp = 2maxX
2: X = maxX
3: while X < comp do4: comp = comp
25: X = X - 16: end while
This algorithm is relatively complex as it involves sorting. However the sorting mechanism isapplied on a reduced table of maxX elements. For example if we consider an 8 bits per componentimage, maxX = 10, leading to a sorting process on only 10 values. When knowing θ, all possiblecodeword lengthes in Tab can be determined before actually performing the entropy coding and doesnot have to be computed for each symbol to encode. However, if the entropy coding is performedinline with the prediction, the θ parameters of the whole stream is naturally unknown at the time ofthe entropy coding.
Different solutions to this problem can be used. In particular, to respect a low complexityconstraint, an estimation of the b
Q from previously encoded stream is first used to estimate Nbparameters. Then after encoding a certain number of symbols, the set θ of parameters are againapproximated but this time using the previously encoded prediction errors. This scheme enables alow complexity approach as well as an adaptivity to the stream statistics during coding.
Finally each bit from the unary codeword is encoded using the QM coder according to a given

3.4. SYMBOL-ORIENTED QM CODING 49
Algorithm 3.3: Tab Computation
Require: θ, maxX
Ensure: Tab1: Initialization Tab = [0 0 0 ... 0]2: for i = 0 to maxX do3: Compute PMag(i, θ)4: j = i− 15: Sorting PMag(i, θ) among the already computed PMag(Tab[j], θ)6: while j ≥ 0 and PMag(i, θ) > PMag(Tab[j]) do7: Tab[j + 1] = Tab[j]8: Tab[j] = i9: j = j − 1
10: end while11: end for
context. Such context modeling technics are explained in the next section.
Sign coding. Sign coding is performed directly after magnitude coding. The algorithm here doesnot differ from classical bit plane oriented QM Coding. Only the context modeling varies and ispresented in the next section.
Refinement coding. The remaining bits are then encoded. The number of refinement bits hasbeen previously determined by the magnitude coding pass.
After having performed these three coding passes on a symbol, the whole process is repeated onthe next symbol until the end. Next section will discuss about the context modeling techniques usedfor each coding pass to improve the efficiency of the entropy coder.
3.4.4 Context modeling
The context modeling techniques used in the symbol oriented QM coder are based on spatial classifi-cation of prediction errors. When comparing symbol oriented and bit plane oriented coding schemes,the context orientation is different. If we consider bit plane oriented coding, a 360 context is avail-able from higher bit planes. As for the symbol oriented coding, due to the raster scan, only a 180
neighborhood is available to construct the context model. However, this context can be improvedinto a 360 context by using values from the directly higher resolution level.
Magnitude coding. The classification process uses a 360 context with three thresholds to ob-tained four different classes. Using four classes was empirically determined to be a tradeoff betweena good context modeling and context dilution. As it encode the unary codeword, QM coding processdecreases the context number for each bit it encodes. Therefore the context values need to be distantfrom at least the maximum magnitude maxX that can be coded. As an example, in case of 8 bitsper component images, there should be at least 10 contexts in each class.

50 CHAPTER 3. GENERIC CODING TOOLS
Sign coding. The classification process also uses a 360 context to track the sign of the predictionerrors of the neighborhood. From this neighborhood of 8 values, an average value is computed and 5classes are generated. The first class corresponds to the case when 4 values are positive and 4 valuesare negative. The fifth class corresponds to the case when the eight values share the same sign. Totake into account the most probable sign, the sign of the prediction error to encode is XORed withthe most probable sign from the surrounded context.
Refinement coding. Considering the refinement pass, no context modeling has been used as ofyet. Therefore there is only one context for this pass.
3.4.5 Validation: application to the Interleaved S+P
For validation purposes, the proposed QM coding scheme has been implemented in the InterleavedS+P codec. Each substream has been coded according to both symbol oriented and bitplane orientedcoding schemes. Entropy coding is performed inline with the prediction process.
To compare both complexity and compression ratio, the set of images of the core experiment 2of JPEG AIC standardization process has been used. For each image, 30 compressions have beenperformed from low to high bitrates. Both symbol and bit plane oriented coding have been used.Concerning the complexity benchmark, results have been obtained by performing each compression50 times and taking the average time of these 50 compressions.
Compression ratio. Figure 3.12 presents the average compression ratio of both bit plane orientedand symbol oriented coding. An overhead between 0.5% and 3.5% can be observed for the proposedmethod against bit plane oriented coding. This result could be mainly improved by using a bettercontext modeling. The context modeling proposed in this chapter is a preliminary study and additionalwork should be done to improve the results.
30
32
34
36
38
40
42
44
46
48
50
0 1 2 3 4 5 6 7 8Rate (bpp)
WP
SN
R (d
B)
Symbol oriented coding
Bit plane oriented coding
Figure 3.12: Compression ratios of QM encoding for both symbol oriented and bit plane orientedQM Coding
Complexity. Figure 3.13 presents the computational time of both bit plane oriented and symboloriented coding for all images and three compressions. The average gain in computational time is

3.5. CONCLUSION 51
around 50% for the entropy coding process and 33% for the whole encoding process of the InterleavedS+P coder for low bitrate as well as for high bitrates.
0
500
1000
1500
2000
2500
3000
3500
0 50 100 150 200 250Quantization factor
Enc
odin
g tim
e (m
s/M
egap
ixel
)
Symbol oriented coding
Bit plane oriented coding
Figure 3.13: Compression ratios of QM encoding for both symbol oriented and bit plane orientedQM Coding
3.5 Conclusion
In this chapter, we presented three different generic tools for coding purposes. First, based on an inter-component adaptive decorrelation, multi-component compression framework has been presented.Results obtained show bit-rate saving from 0.20 up to 0.46 bpp have been observed. Consideringcolour spaces, using the RGB colour space together with the decorrelation process leads to thebest compression results. However, for better scalability features, YDbDr colour space might beconsidered.
Secondly, a statistical analysis of predictive coders based on Laplacian distributions providesestimators of entropy and distortion. These tools can be then combined for advanced functionalitiessuch as rate control and rate distortion optimization processes.
Finally, a symbol oriented QM coder was then proposed and compared to the classical bit planeoriented QM coder. Results in terms of complexity of the proposed scheme were shown to be betterthan bit plane oriented coding with a gain of about 60 %.
If the validation process has been conducted with the Interleaved S+P coder, as previouslymentioned, the genericity of the presented techniques allows to envisage their integration into otherpredictive coders.
As we shown in this chapter, this generic coding toolbox should enhance compression perfor-mances as well as providing advanced Quality of Service (QoS) features based on statistical modelingof prediction errors. In particular, improving Rate / Distorsion features naturally enhances Qualityof Experience. Even if the quality metric used in this study remains the debatable MSE, the relatedcomplexity insures realistic network based implementations.
Along with these coding-oriented tools, additional services has to be designed so that to guaranteean end-to-end QoS. In particular, the next chapter focuses on data integrity.

52 CHAPTER 3. GENERIC CODING TOOLS

Chapter 4
Content securization and Quality ofService: preserving end-to-end dataintegrity
Quality of Experience is not only based on the lone received image quality. Typically, medical imagesor high resolution art images usually embed private metadata that have to remain confidential. Hugeamount of medical data are then stored on different media and are exchanged over various networks. Ifthese embedded sensitive data are accidentally altered, even if the received image quality is sufficient,end-users can perceive the overall process as an inefficient one. As a consequence, techniquesespecially designed for these data are required so that to provide security functionalities such asprivacy, integrity, or authentication. Multimedia security is thus aimed towards these technologiesand applications [24]. In addition, to insure reliable transfers, flexible and generic scheduling andidentification processes have to be integrated for database distribution purposes while taking intoaccount secure remote network access together with future developments in network technologies.
Then, on one hand, content protection consists of preserving data integrity and masking datacontent. The commonly used methods to obtain these protections are respectively hashing andciphering. On the other hand, the embedding of hired data aims to protect copyrights or add metadatato a document. Besides watermarking, steganography, and techniques for assessing data integrityand authenticity, providing confidentiality and privacy for visual data is among the most importanttopics in the area of multimedia security. Applications range from digital rights management tosecured personal communications, such as medical materials.
Moreover, errors can occur in various ways when transmitting multimedia contents. Dependingon the communication media, i.e. cable network, wireless network (wifi, cellphone network) or evenduring physical storage (hard disk, flash memory...), binary or packet errors can appear, the worstcases being potentially the wireless network followed by the cable network. In order to providethe best user experience, error concealment and robustness strategies are incorporated during bothsource coding and the transmission process. As for the channel coding, protection strategies dependon transmission conditions in order to ensure Quality of Service (QoS).
When considering the source coding side, this robustness is usually obtained by adding a givenlevel of redundancy within the transmitted data. Under certain conditions this redundancy allows torecover the whole information even if some parts of the information are damaged. Hybrid approaches,
53
54CHAPTER 4. CONTENT SECURIZATION AND QUALITY OF SERVICE:
PRESERVING END-TO-END DATA INTEGRITY
named joint source-channel coding, achieve robustness by combining protection strategies at bothsource and channel coding. However when the errors are too strong, or when data packets aredefinitely lost, some part of the information can be missing or unusable despite the transmissionrobustness and the added redundancy.
In this chapter, we address these two different services, namely content protection solutionsthrough Interleaved S+P based mechanisms, and Quality of Services tools designed for MPEG-4SVC or any scalable image coder. This chapter is organized as follows: section 4.1 defined first thesecurization oriented application contexts within these works have been realized. Then we focus ontwo aspects of the data integrity. Section 4.2 provides joint data hiding and cryptography processes,while section 4.3 described two specific tools among Quality of Service ones.
4.1 Application contexts and related ANR projects
I was involved in two different ANR (French National Research Agency) projects, both relative tosecurization and image coding topics. These projects, namely TSAR and CAIMAN deeply influencedmy research when considering the content protection domain. The application contexts, inherent tothese collaborations, have raised some concrete issues that we tended to alleviate. In this section, Ibriefly describe the purposes of TSAR and CAIMAN projects and my associated involvement.
TSAR project: Safe Transfer of high Resolution Art images - 2006/2009. The protection ofdigitized works of art still pose security problems when they broadcasted on-line. The goal of theproject TSAR is then to transmit in a secure way high quality images. Within the TSAR project, fivelaboratories were involved, namely the C2RMF (Louvre, Paris), IETR (Rennes), IRCCyN (Nantes),LIRMM (Montpellier) and LIS (Grenoble).
Museums are supposed to undertake at least two essential missions [31]. First, they have topreserve their huge number of items and save them from damage. At the same time, museums playan active role in the spread of cultural knowledge and this educational objective leads them to widelycommunicate these materials. However, these two missions are somewhat contrary in nature becausehandling art items inevitably causes damage. To solve this major problem, museum research centershave introduced the “digital museum” concept [116]: digital versions of the original art items arecollected in a database on a server accessible via the Internet.
For example, the National Gallery in London, the Tokyo University Digital Museum (throughthe Digital Museum 2000 project [167]) or the Chinese University Museum Grid [31] provide publicaccess to their databases. However, users can only download low-resolution images. The applicationhas been actually designed to prevent illegal copies of digitized data. The best way to achieve thisconsists basically of not transmitting high-resolution images. High-resolution information is thereforestored separately and reserved for a limited number of people.
In France, the C2RMF laboratory, connected to the Louvre museum, has digitized more than300, 000 documents taken from French museums, in high resolution (up to 20, 000× 30, 000 pixels).The resulting EROS database [149] is for the moment only accessible to researchers whose workis connected with the C2RMF. To widely open the database, the idea is to create a framework tointegrate the different security solutions in order to secure the access to the images. This projectthen aims at transmitting hidden data in images of important sizes by means of steganography andwatermarking techniques. This data hiding scheme will also be combined with cryptography and

4.2. CONTENT PROTECTION FEATURES: INTERLEAVED S+P APPLICATION 55
compression methods in order to both increase the transfer security and to minimize the transmis-sion time. The application concerns secure transmission of high-resolution images of painting andarchaeological objects (several gigabytes of data).
As far as the French TSAR project is concerned, the Interleaved S+P image coding methodtakes part into the framework. The objective is to design an art image database accessible througha client-server process that includes and combines a hierarchical description of images and dedicatedcontent securization processes. Jean Motsch, who I co-supervised, has defended his dissertation in2009 in connection with the TSAR project. I was nominated as the scientific responsible of IETRworks.
CAIMAN project: Codage Avance d’IMAges et Nouveaux services - 2009/2012. In collab-oration with Thales Communications, and ETIS, XLIM-SIC, and IETR laboratories, the CAIMANproject aims at providing new image coders able to reach a widespread use such as JPEG does,together with advanced functionalities. In particular, a user-friendly solution should be designed,while keeping a low computational complexity and more advanced features in the direction of sometools of JPEG2K.
Not only the compression efficiency will drive the adoption of the future generation of imagecodecs but more the new services it will provide. These considerations have been taken into accountby the JPEG Committee for JPEG advanced Image Coding to which CAIMAN will contribute. ThisCAIMAN project is thus naturally closely linked to JPEG-AIC work (see section 2.1).
The main objective of CAIMAN consists of studying a still image coder that jointly integratesin its design security aspects such as steganography, error-resilience, adaptation to the network androbustness to losses and Quality of Experience issues, without sacrifying to compression efficiency.The Interleaved S+P framework has been then proposed to the JPEG committee and related workled to contributions to the JPEG-AIC standard.
In particular, medical image concerns were addressed during this project. The Interleaved S+pcoding scheme has been developed to face the secure transmission issues. Embedded functionalitiessuch as adapted selective cryptography, human vision-based steganography coupled with UnequalError Protection and error resilience tools have been designed so that to maintain good codingproperties together with embedded Quality Of Service oriented system.
MPEG4-SVC video coding standard. The standard MPEG4-SVC was designed so that to addscalability. Technicolor took part to the standardization process of the framework, based in MPEG4-AVC coding scheme. However, the complexity of the proposed solution prevent from a widespreaduse of it. One of the identified bottleneck relies in the rate control mechanism. In collaboration withTechnicolor, we provide an efficient one-pass rate control solution. Yohann Pitrey has then designedduring his PhD work a low-complex solution, able to address both AVC and SVC frameworks.
4.2 Content protection features: Interleaved S+P application
Whatever the storage or channel transmission used, medical applications require secure transmissionof patient data. Embedding them in an invisible way within the image itself remains a relevant solu-tion. We also deal with security concerns by encrypting the inserted data. Whereas the embedding

56CHAPTER 4. CONTENT SECURIZATION AND QUALITY OF SERVICE:
PRESERVING END-TO-END DATA INTEGRITY
scheme can be made public, the use of a decryption key will be mandatory to decipher the inserteddata.
4.2.1 Steganography and the Interleaved S+P
Data embedding is one of the new services expected within the framework of medical image com-pression. It consists of hiding data (payload) in a cover image. Applications of data embeddingrange from steganography to metadata insertion. They differ in the amount of data to be insertedand the degree of robustness to hacking.
From a signal processing point of view, it uses the image as a communication channel to transmitdata. The capacity of the channel for a specific embedding scheme gives the size of the payload thatcan be inserted. A fine balance has to be achieved between this payload and the artifacts introducedin the image. This being so, different embedding schemes are compared on a payload versus PSNRbasis. Of course, the overall visual quality can be assessed. The target application is the storageof data related to a given medical image or sensitive art images. That data can consist of patientID, time stamps, or the medical report, transcribed or in audio form in case of medical materials.The idea is to avoid having to store several files about specific images by having all the necessaryinformation directly stored within the image data.
We therefore propose a data embedding service that aims to insert a high payload in an imageseen either as a cover or a carrier, such as a medical report in audio form. For this purpose, audiodata, after coding and ciphering, is inserted in a corresponding image. The embedded image is thentransmitted using usual channels. Of course, this scheme is compliant with any error protectionframework that might be used. When retrieval of audio data is requested, the data embeddingscheme is reversed, and both the original image and the audio data are losslessly recovered. To avoidsignificant perceptually distortions, the data hiding mapping is powered by the quadtree: distortionsare less perceptible in homogeneous areas than upon edges as shown in figure 4.1.
In this context, we studied the Difference Expansion (DE) method, introduced by Tian [191] thatembeds one bit per pixel pair based on S Transform. As the Interleaved S+P algorithm and DEboth use S-Transform during their computation, we have combined both techniques to perform thedata insertion without degrading coding performance. In order to adjust the DE algorithm to LARInterleaved S+P, some minor modifications are introduced compared with the original DE method.In particular, we drive the insertion process by the quadtree partition, which means that the insertionis dependent on the image content. Another important improvement is that in the initial DE method,positions of possible ”extensible” difference have to be encoded, adding a significant overhead. Inour coding scheme, these positions can be directly deduced from the quadtree, and are then nottransmitted [131].
We show preliminary results on an angiography 512-squared medical image (Figure 4.2). Apayload of 63598 bits is inserted, with a PSNR of 40 dB. Considering a 1 million pixel image,the payload can be up to 300 kbits. Our embedding scheme performs well, allowing high payloadand minimum distortion, as shown on zoomed parts of the images from the figure 4.2. From acompression point of view, the data hiding process does not affect the coding efficiency: the totalcoding cost is about equal to the initial lossless encoding cost of the source image plus the insertedpayload.

4.2. CONTENT PROTECTION FEATURES: INTERLEAVED S+P APPLICATION 57
(a) 2 × 2 blocks, P = 19528 bits,PSNR=35 dB
(b) 2× 2 blocks (c) 4 × 4 blocks, P = 29087 bits,PSNR=44 dB
(d) 4× 4 blocks (e) 4×4 up to 16×16 blocks, P =90126 bits, PSNR=42 dB
(f) 4× 4 up to 16× 16 blocks
Figure 4.1: Visual quality versus watermarked block sizes. For each image, position of modifiedpixels has been extracted (in white onto black background).
Figure 4.2: a) Source image - b) Image with inserted payload
4.2.2 Cryptography ans scalability
Besides watermarking, steganography, and techniques for assessing data integrity and authenticity,the provision of confidentiality and privacy for visual data is one of the most important topics in

58CHAPTER 4. CONTENT SECURIZATION AND QUALITY OF SERVICE:
PRESERVING END-TO-END DATA INTEGRITY
the area of multimedia security in the medical field. Image encryption lies somewhere between dataencryption and image coding. Specifically, as the amount of data to be considered is several ordersof magnitude greater than the amount for ordinary data, more challenges are to be dealt with. Themain challenge is the encryption speed, which can be a bottleneck for some applications in terms ofcomputation time or in terms of required computing resources. A secondary challenge is to maintainthe compliance of the encrypted bitstream with the chosen image standard used to compress it.
Partial encryption. Partial encryption addresses the first aforementioned challenge. Our partialencryption scheme is based mainly on the following idea: the quadtree used to partition the image isnecessary to rebuild the image. This has been backed up by theoretical and experimental work. As aresult, the quadtree partition can be considered to be the key itself, and there is no need to encryptthe remaining bitstream.
The key obtained is thus as long as usual encryption key and its security has been shown tobe good. If further security is requested, the quadtree partition can be ciphered using a publicencryption scheme, to avoid the transmission of an encryption key, as depicted in Figure 4.3 [132].This system has the following properties: it is embedded in the original bit-stream at no cost,and allows for multilevel access authorization combined with a state-of-the-art still picture codec.Multilevel quadtree decomposition provides a natural way to select the quality of the decoded picture.
Figure 4.3: Interleaved S+P hierarchical selective encryption principle
Selective encryption. Selective encryption goes a bit further than partial encryption. The ideais to cipher only a small fraction of the bitstream, namely the main component, which gives theadvantage of providing a decoder compliant bitstream. This property allows the user to see a pictureeven without the key. Of course, the picture must be as different to the original one as possible.
Our selective encryption scheme uses also the quadtree partition as a basis [57]. The data requiredin the compression framework to build the Flat picture are also used. The general idea is to encryptseveral levels of the pyramid. The process begins at the bottom of the pyramid. Depending on thedepth of the encryption, the quality of the image rebuilt without the encryption key varies. Theencryption itself is performed by a well-known secure data encryption scheme. One main property ofour selective encryption scheme is that the level of encryption (i.e. the level of the details remainingvisible to the viewer) can be fully customized. Hierarchical image encryption is obtained by decidingwhich level will be decrypted by supplying only the keys corresponding to those levels. This refinesthe quality of the image given to different categories of viewers. The encryption of a given level ofthe partition prevents the recovery of any additional visually-significant data (figure 4.4). From adistortion point of view, it appears that encrypting higher levels (smaller blocks) increases the PSNR,

4.2. CONTENT PROTECTION FEATURES: INTERLEAVED S+P APPLICATION 59
(a) Original image
(b) RC4 - Encryption ofQuadtree partition
(c) RC4 - Encryption ofQuadtree partition and Flatstream
(d) AES - Encryption ofQuadtree partition
(e) AES - Encryption ofQuadtree partition and Flatstream
Figure 4.4: Visual comparison between original image and image obtained from partially encryptedLAR encoded streams without encryption key.
and at the same time, the encrypting cost. From a security point of view, as the level increases, thesearch space for a brute force attack increases drastically.
4.2.3 Client-server application and hierarchical access policy
Images and videos databases are a powerful collaborative tool. However, the main concern whenconsidering these applications lies in the secure accessing of images. The objective is therefore todesign a medical image database accessible through a client-server process that includes and combinesa hierarchical description of images and a hierarchical secured access.
Along with the TSAR project, a corresponding client-server application [11] has been then de-signed. Every client will be authorized to browse the low-resolution image database and the serverapplication will verify the user access level for each image and eventual Region of Interest (ROI)request. ROIs can be encrypted or not, depending on the security level required.

60CHAPTER 4. CONTENT SECURIZATION AND QUALITY OF SERVICE:
PRESERVING END-TO-END DATA INTEGRITY
If a client application sends a request that does not match the user access level, the serverapplication will reduce the image resolution according to access policy. The exchange protocol isdepicted in Figure 4.5.
Figure 4.5: Exchange protocol for client-server application
4.3 Network oriented QoS solutions
If image content issues have been discussed in previous section, data integrity can also be handledby network oriented QoS solutions. Anyway, Quality of Services is a generic term gathering all kindof processes able to guarantee end-to-end requirements, such as final image quality, latency, framerate, etc... In case of video coders, Rate/Distorsion allocation is naturally a part of QoS issues. Inthis context, PhD work of Yohann Pitrey was devoted to the design of a low complex rate controlscheme targeted to SVC framework [147]. This work was realized in collaboration with Jerome Vieron(Technicolor).
Besides, to ensure optimal visualization of transmitted images, there are two possible ways of pro-tecting the bitstreams. First, protecting the encoded bit-stream against error transmission is requiredwhen using networks with no guaranteed quality of service (QoS). In particular, the availability ofthe information can be ensured by the Internet protocol (IP). We focused our studies on two topics,namely the loss of entire IP packets and the transmission over wireless channel. When considering theInterleaved S+P coder, we develop error resilience strategies adapted to our compression scheme. Inparticular UEP solutions used together with proper resynchronization processes and robust encodingnaturally leads to optimal conditions for the transmission of sensitive data. Even if we also developedoperative resynchronization processes [23] relying on Q15 like coder (section 3.4), only informationabout UEP framework will be given in this part.
4.3. NETWORK ORIENTED QOS SOLUTIONS 61
4.3.1 One-pass rate control scheme using ρ-domain for MPEG-4 SVC
Video coding and processing have become central areas of interest for video communications. Videocoding standards such as MPEG-4 AVC/H.264 [206] manage to efficiently reduce the amount of datato transmit. However, current video applications have to cope with heterogeneous communicationnetworks and video-reading devices. Conventional video coding suffers from the lack of adaptabilityto these multiple targets. Typically, a different version of the video must be encoded for each target.Moreover, the redundancies between the different versions of the video are not exploited, whichresults in a waste of time, storage space and bandwidth.
As a response, scalable video coding has been developed to cope with this need for adaptability.Recently a standard was supplied, with the finalization of the new MPEG-4 Scalable Video Codingextension (SVC) [156, 179]. This standard supports three types of scalability. Spatial scalabilityaffects frame resolution, to address variable screen sizes. Quality scalability acts on the signal-to-noise-ratio (SNR) to provide various levels of quality in the decoded video stream. Temporalscalability increases the number of frames per second to improve motion smoothness. An MPEG-4AVC/H.264 compatible base layer is then first encoded, then motion and texture information canbe upsampled and refined to code the enhancement layers more efficiently. This new tool calledinter-layer prediction enables MPEG-4 SVC to provide scalability features without losing too muchcoding efficiency when compared to MPEG-4 AVC/H.264 [171].
MPEG-4 SVC ensures that a video stream can adapt to different decoding targets. However,the standard does not provide any tools to cope with the communication channel capacity. Activityvariations in the contents of a video sequence can cause great bitrate fluctuations at the outputfrom the encoder. If not controlled, such fluctuations can cause undesirable display interruptions inthe decoder. To transmit an encoded video stream on a communication channel, the bitrate of thestream must cope with the channel bandwidth. Rate control is a critical part of the encoding process,as it is intended to regulate the bitrate and attenuate these fluctuations. Generally, a budget is firstdetermined according to the available bandwidth, and dispatched among the video frames. Then,a bitrate model anticipates the behavior of the output bitrate from the value of the quantizationparameter, in order to reach the desired budget. Although rate control has been widely studied forconventional video coding such as MPEG-4 AVC/H.264 [115, 107, 72], only a few proposals existfor scalable video coding. In [1], the rate control scheme from [107] is implemented in MPEG-4SVC but only affects the base layer. In [214], only spatial and quality scalabilities are handled andeach macroblock is encoded twice, which dramatically increases the computational complexity ofthe encoder. The scheme presented in [110] is able to control each type of scalability in SVC usingonly one encoding pass. The statistics from the base layer and from the previous frame in the samelayer are used to predict bitrate behavior and distorsion. Although these contributions are of greatinterest for rate control on MPEG-4 SVC, they remain quite complex and require a lot of calculations.Moreover the tested configurations do not reflect practical SVC applications, and do not cope withcurrent video stream bitrate and size requirements, as specified in [84].
During his PhD work, Yohann Pitrey has to design a new one-pass low-complexity rate controlframework, dedicated to this video codec. We control the bitrate at frame level using a low-complexitylinear bitrate model based on the ρ-domain framework [72]. This model is used to process thequantization parameter of each frame. In particular, we use the statistics from the previous frameto initialize the bitrate model. This way, each frame is only encoded once and the computationalcomplexity of the whole rate control process is extremely low. Additionally, we dispatch the target

62CHAPTER 4. CONTENT SECURIZATION AND QUALITY OF SERVICE:
PRESERVING END-TO-END DATA INTEGRITY
bitrate inside each group of pictures to get smooth quality variations in the encoded stream. Frameweights based on their coding efficiency are used to reduce the PSNR variations in each group ofpictures.
4.3.1.1 ρ-domain based rate model
Conventional rate control approaches try to formulate the bitrate as a function of the quantizationparameter (QP) [158, 115]. Indeed, the QP determines the amount of data lost during the encodingprocess and has a direct influence on the output bitrate. Based on this relationship, it is possibleto choose the optimal value of QP, by predicting its impact on the output bitrate. However, therelationship between the QP and the bitrate is difficult to approximate correctly. To alleviate thisproblem, a common approach is to encode each image with several values of QP and choose the valuethat produces the bitrate closest to the constraint. This kind of exhaustive approach is not suitable inpractice as it requires a lot of computations. Other approaches try to estimate the distribution of thedata before quantization using Laplacian or Gaussian functions [158, 108]. This estimation is thenused to predict the behavior of the bitrate from the value of QP. Unfortunately, the approximationstep remains quite complex and suffers from inaccuracies.
Another approach called ρ-domain uses the amount of null coefficients in a frame after quan-tization as an intermediate parameter between the QP and the bitrate [72]. It has been observedthat this parameter, denoted as ρ, has a direct influence on the bitrate needed to code a frame [73].The relationship between ρ and the bitrate is highly linear, which makes it easy to evaluate [72].A relationship can be found between ρ and the QP, to relate the bitrate to the QP. In [175], theso-called ρ-domain rate model was used to successfully control the bitrate on MPEG-4 AVC/H.264.
4.3.1.2 The ρ-domain model for MPEG-4 AVC
After the prediction step, the residual information is transformed using an Integer Discrete CosineTransform (IDCT). The transformed coefficients are then quantized and sent to entropy coding.Considering the DCT coefficients of a frame, it is easy to determine how many of them will be codedas zeros after quantization. This coefficient will be coded as a zero if its value is below a specificdead zone threshold. In the quantization scheme used in MPEG-4 AVC, the threshold depends onboth the position of the coefficient in the transformed macroblock and the value of the QP [175].
In [175], it is stated that ρ can be expressed as a function of bitrate R as follows:
ρ(R) =R0 −R× (1− ρ0)
R0, (4.1)
where R0 and ρ0 are two initial values to be determined. It is obvious that this relationship is linear.Note that the couple of values (R; ρ) = (0; 1) is a solution of equation (4.1). Indeed, when thebitrate is equal to zero, all the coefficients are coded as zeros, so ρ is equal to 1.We can then findthe value of QP qt that generates the closest number of bits to a target bitrate Rt, so that
qt = arg minq∈[0;51]
|ρ(q)− ρ(Rt)| . (4.2)
The ρ-domain modeling framework has several advantages. First, this model is very accurateand no approximation are required, as the quantized coefficients are directly available during the

4.3. NETWORK ORIENTED QOS SOLUTIONS 63
encoding process. Secondly, the ρ-domain has very low computational complexity, as the model inequation (4.1) is linear.
In [148], we validated the ρ-domain model for MPEG-4 SVC purposes. Then, model initializationissue has to be dealt.
4.3.1.3 Initialization of the ρ-domain model
Two approaches have been proposed. In our first step work [148], such as in [72, 175], each frameor macroblock is pre-encoded to get the quantized coefficients. These coefficients are then usedto process the value of ρ and choose the right value of QP, which is used in a second encodingpass. This so-called two-passes solution achieves good results, as the rate model is initialized withdata from the frame itself. However, the encoding process is executed twice and the computationtime is significantly increased. We then propose to use the information from the previous frame asa basis for the calculation of ρ. This kind of approach has already been studied in other bitraterepresentation contexts [107, 217]. Spatial and temporal correlations between consecutive framesare used to predict the coding parameters. The main advantage of this so-called one-pass alternativeis that no pre-encoding step is needed, thus leading to lower complexity.
The next section presents a one-pass rate control scheme for MPEG-4 SVC using the ρ-domainmodel.
4.3.1.4 Global rate control strategy.
Our scheme was designed as a compromise between low computational complexity and accurate ratecontrol. For this reason, we execute the rate control step only once per frame and use the sameQP for the whole frame. A drawback of this is that we generally cannot reach the exact budget fora frame. Changing the QPs for all macroblocks at a time induces a threshold effect between thereachable bitrates at the frame level. Some existing rate control approaches run at the macroblocklevel. They manage to control the bitrate more accurately, but at the cost of higher computationalcomplexity.
The quality of user visual experience is closely related to the quality variations inside the decodedvideo stream. Thus, we aim to reduce the PSNR fluctuations inside each GOP. To do this, we usea frame type dependant budget allocation to dispatch bits among frames according to their codingcomplexity.
Budget allocation. Budget allocation is an important part of a rate control scheme. Most of thechoices are made at this stage, and the QP processing module is designed exclusively to respectthese choices. In most practical SVC applications, each layer addresses a particular target, withspecific bitrate requirements. So we specify a bits-per-second (bps) constraint for each layer, whichis handled separately. This target bitrate is then converted into bit budgets at GOP and frame levels.
GOP-level budget allocation The available bitrate is first dispatched among GOPs. Inside agiven layer l, each GOP is granted the same budget. Gl defined as
Gl = Sl ×Cl
Fl+ E, (4.3)

64CHAPTER 4. CONTENT SECURIZATION AND QUALITY OF SERVICE:
PRESERVING END-TO-END DATA INTEGRITY
where Cl is the required target bitrate per second, Sl is the size of a GOP in layer l and Fl isthe number of frames per second in layer l. We add a small feedback term E to compensate forallocation errors from previous GOPs. In our experiments, E is limited to 10% of the entire GOPbudget.
Once GOP level budget allocation is completed, we have to dispatch the budget among frames.Great care must be taken in dispatching the budget among the different types of frame, because ithas a direct impact on output quality. To this end, we define the following frame weights.
Relative frame-weights MPEG-4 SVC supports three types of frames (i.e.: I, P and hierarchicalB-frames). Each type uses specific coding tools and has distinct coding performances. I frames useonly intra-frame macroblock prediction and are the most reliable. However, their coding efficiencyis not very high. P frames allow intra and inter-frame prediction and benefit from better codingefficiency than I frames. B frames use bidirectional inter-frame prediction and are the most effective.As a result, getting the same quality requires more bits for P frames than for B frames. MPEG-4 SVC also provides a hierarchical GOP structure using hierarchical B frames to ensure temporalscalability [170]. Successive B frames are encoded in a pyramidal fashion so that when a level isadded, the number of frames per second is multiplied by two. This GOP structure causes the codingperformances of hierarchical B frames to vary depending on their temporal level. MPEG-4 SVCallows eight temporal levels for B frames. We consider each temporal level as a different frame type,namely B1, B2, . . . B8.
To ensure constant quality within a GOP, we dispatch the allocated budget according to thecoding performances of each type of frame. For each type of frame T in each scalable layer l, weintroduce a frame weight KT,l, defined as
KTf ,l = 2q/6 × bf , (4.4)
where Tf is the frame type of frame f , bf the number of bits needed to code the frame f , and q theQP value. As it depends both on the QP and the bitrate, this weight reflects the coding efficiencyachieved for a frame. Basically, with equal QP, KI,l > KP,l > KB1,l > · · · > KB8,l. To obtainconstant quality inside a GOP, we dispatch the available budget among frames according to eachframe type’s weight.
Frame-level budget allocation. We use then the frame weights to dispatch the GOP budgetamong frames. A frame needs to be allocated a budget that corresponds to its relative weight in theGOP. The target budget Rt for a frame at position f in a GOP in layer l is processed as follows:
Rt =KTf ,l∑f−1
i=0 KTi,l +∑Sl
i=f KTi,l
×Gl + ε, (4.5)
where Ti is the type of frame at position i and ε is a small feedback term to compensate for theallocation errors from previous frames. As rate control is processed before encoding frame f , we donot know its weight. As an estimation, we use KTf ,l which is the weight of the last encoded frame
that has the same type in the same layer. Similarly, we use the last encoded frame weights KTi,l forframes that have not yet been encoded.

4.3. NETWORK ORIENTED QOS SOLUTIONS 65
QP processing Once the budget allocation step is complete, we choose the optimal value of QP foreach frame. The optimal target value of QP, denoted as qt, is the one that minimizes the differencebetween the number of bits needed to encode the frame and the target number of bits, denoted asRt. Using the one-pass approach, the target value of ρ is processed as
ρt =Rp −Rt × (1− ρp)
Rp, (4.6)
where qp is the value of QP used to encoded the previous frame of the same type in the same layer,Rp is the generated number of bits and ρp is the corresponding value of ρ. Then, the target QP isdetermined as
qt = arg minqp−∆q ≤ q ≤ qp+∆q
|ρ(q)− ρt| . (4.7)
4.3.1.5 Experimental results
We define three scenarios to test spatial, quality and temporal scalabilities. The tested configurationsare summed up in table 4.1. All our tests were based on the JSVM Reference Software version 8.6[179] in which we implemented our ρ-domain-based rate control algorithm. We use reference videosequences to attest the performances on various types of contents.
Figure 4.6 shows the achieved bitrates per second for two video sequences. The achieved bitratesare very close to their targets, which shows the ability of our scheme to respect the specified constantbitrate per second constraints. We also display the behaviour of our scheme at frame level in figure4.7. It shows the accuracy of the bitrate control at frame level, as the achieved bitrate is also veryclose to the constraint. Additionally, the behaviour of the budget dispatching method is clearlyvisible. P frames are granted more bits than the B frames, and the B frames get less and less bitswhen their temporal level increases. The impact on the overall quality will be discussed with moredetails in the following. The next evaluates the proposed scheme in terms of encoding time.
Our budget dispatching policy grants a number of bits to each frame according to their relativecoding complexity. The differences between frame types and levels are therefore compensated andthe quality along the GOP should be constant. Figure 4.7 displays the achieved bitrate at framelevel. Using our budget dispatching policy, P frames are granted more bits than B frames, while Bframes are granted more bits in the lower levels than in the higher levels. We compare the results
Scenario Layer frame size (pixels) frames per secondtarget bitrate
(kbps)frames per GOP
SPATIAL
0 176*144 30 100 161 352*288 30 400 162 704*576 30 1200 16
QUALITY
0 352*288 30 400 161 352*288 30 1200 162 352*288 30 3600 16
TEMPORAL
0 352*288 15 200 41 352*288 30 400 82 352*288 60 800 16
Table 4.1: Test scenarios for each type of scalability.

66CHAPTER 4. CONTENT SECURIZATION AND QUALITY OF SERVICE:
PRESERVING END-TO-END DATA INTEGRITY
HARBOUR SOCCER
5 10 150
500
1000
1500
2000
Time (s)
Bitr
ate
(kbi
t)layer 2layer 1base layertarget bitrate
5 10 150
500
1000
1500
2000
Time (s)
Bitr
ate
(kbi
t)
layer 2layer 1base layertarget bitrate
SP
AT
IAL
5 10 150
2000
4000
6000
Time (s)
Bitr
ate
(kbi
t)
layer 2layer 1base layertarget bitrate
5 10 150
2000
4000
6000
Time (s)
Bitr
ate
(kbi
t)
layer 2layer 1base layertarget bitrate
QU
AL
ITY
2 4 6 80
500
1000
1500
Time (s)
Bitr
ate
(kbi
t)
layer 2layer 1base layertarget bitrate
2 4 6 80
500
1000
1500
Time (s)
Bitr
ate
(kbi
t)
layer 2layer 1base layertarget bitrate
TE
MP
OR
AL
Figure 4.6: Achieved bitrate per second using our one-pass rate control scheme.
obtained with this policy to a simple policy that grants the same number of bits to each frame,or so-called ”constant-budget” policy. Visually, the constant-budget policy produces quality fadingeffects between the P frames, which are quite unpleasant for the viewer. Using our policy, the qualityis smoother and the overall quality impression is much better. It is interesting to note that we alsoobtain a slight increase in PSNR. Actually, the quality of P frames is higher, so they make a betterprediction for B frames. As a consequence, the quality of the whole encoding process is slightlyhigher using our dispatching policy.
As a result, the presented one-pass rate control scheme performs accurate bitrate control, whilesuccessfully reducing the quality variations along the video frames.
4.3.2 Error resilience and UEP strategies
Commonly, robust wireless transmission can be achieved through the use of error resilience processesat both source and channel coding. At the source coding side, the entropy coder is often the lessrobust part of the coder. When using arithmetic entropy coder such as MQ coder used in JPEG2Kformat, a single bitshift in the bitstream is enough to create important visual artifacts at the decodingside.
First, to prevent the decoder from desynchronizing and therefore error from propagating, syn-chronisation markers needs to be added. Moreover, specific error detection markers can be used to

4.3. NETWORK ORIENTED QOS SOLUTIONS 67
HARBOUR SOCCERS
PA
TIA
L
600 620 640 660 680 700 720 740 760 780 8000
50
100
150
200
250
Images
Déb
it (
kb
it)
couche 2 couche 1 couche base budget réel image images P
600 620 640 660 680 700 720 740 760 780 800
0
50
100
150
200
250
Images
Déb
it (
kb
it)
couche 2 couche 1 couche base budget réel image images P
QU
AL
ITY
600 620 640 660 680 700 720 740 760 780 8000
100
200
300
Images
Déb
it (
kb
it)
couche 2 couche 1 couche base budget réel image images P
600 620 640 660 680 700 720 740 760 780 8000
100
200
300
Images
Déb
it (
kb
it)
couche 2 couche 1 couche base budget réel image images P
TE
MP
OR
AL
600 620 640 660 680 700 720 740 760 780 800
0
50
100
Images
Déb
it (
kb
it)
couche 2 couche 1 couche base budget réel image images P
600 620 640 660 680 700 720 740 760 780 800
0
50
100
150
Images
Déb
it (
kb
it)
couche 2 couche 1 couche base budget réel image images P
Figure 4.7: Achieved bitrates at frame level using our one-pass rate control scheme.
detect errors during decoding and discard bitstreams affected by this error. Such synchronizationand error detection markers have already been implemented as SEGMARK, ERTERM and RESTARTmarkers in the JPEG2K codec [189] as well as in the Interleaved S+P codec [142].
At the channel coding side, error robustness is achieved by using error correcting codes, suchas Reed Solomon [155] and convolutive codes [52]. Such error correcting codes add redundantdata in the bitstream in order to detect and possibly correct transmission errors. Depending on thechannel characteristics, error correcting codes have to be tuned to achieve good performance in errorcorrection while keeping a small amount of redundant data. These error correcting codes are usuallycomputationally expensive and fast codes like LDPC and turbo codes can often be used instead.
Moreover, bitstream overhead has to be taken in consideration while performing image compres-sion and has to remain as low as possible to maintain an acceptable bit rate. In this section, we onlyconsider IP packet-based error correcting codes.
4.3.2.1 IP packets securization processes
Very few works cover the loss of entire IP packets in medical data transmissions [128] in particular.In a more general framework such as image transmission, most studies relate to the implementa-tion of error control coding e.g. Reed-Solomon codes to compensate for packet loss by avoidingretransmissions [128, 47].
By adjusting the correction capacities and, thus, the rates of redundancy, it is possible to adapt toboth a scalable source and an unreliable transmission channel. This is the purpose of Unequal ErrorProtection (UEP) codes which have been proposed within standardization processes [50]. The specific

68CHAPTER 4. CONTENT SECURIZATION AND QUALITY OF SERVICE:
PRESERVING END-TO-END DATA INTEGRITY
problem of medical or art image integrity is the volume of the data being transmitted (cf losslesscoding, 3D-4D acquisition etc.). Within this framework, UEP must meet algorithmic complexityrequirements to satisfy real time constraints.
Roughly speaking, the most important part of the image is more protected by redundant informa-tion than non significant data. Figure 4.8 illustrates the associated framework. From image codingprocess, both bitstream data and codec properties are available for an advanced analysis stage. Then,a hierarchy can be extracted from the bitstream, so that the UEP strategy stage can add adequateredundancy. As a consequence, fine granularity can be obtained for good adaptation both to thehierarchy of the image and to the channel properties as joint source channel coding.
hierarchy1
2
3
Image coding UEP strategyAdding redundancy
Bitstream analysis& Codec analysis
Redundant dataEncoded data
Figure 4.8: UEP principles: hierarchy and redundancy
A great deal of research work has been done in this area over the past decade. In particular,the working draft of JPEG2K WireLess (JPWL) [50] proposes to concentrate unequal protection onthe main header and the tile header as any error on these part of the stream is fatal for decoding.In this solution, conventional Reed-Solomon error correction codes are applied to a symbol levelto provide protection [47]. A very strong protection obviously improves the chances of success indecoding when binary losses occur but it also guarantees the integrity of the headers whether theproperties of the channel are good or very bad. Furthermore, performance evaluation and protectionon a symbol level are far removed from the real channels like wireless channels as can be seen forexample through the variations in the protocol IEEE802.xx (WLAN or WiMax). More precisely, theapproach never considers the effectiveness of the mechanisms operated on the level of Media AccessControl (MAC) layer and physical (PHY) layer such as the Hybrid ARQ (Automatic Query Request -H-ARQ) combining efficient channel coding (turbo-code) and retransmission. Likewise, unequal errorprotection [2] or the new representations based on a multiple description of information [210] arenot considered. Still, when designing joint source-channel coding UEP schemes, we jointly considerthe PHY and MAC layers as effective to deliver true symbols so as to propose unequal protectionframework at the transmission unit level i.e the packet level.
4.3.2.2 UEP strategy for scalable codec
When considering wireless channel, limited bandwidth and SNR are the main features. Therefore,both compression and secure transmission of sensitive data are simultaneously required. The In-terleaved S+P and an Unequal Error Protection strategy are applied respectively to compress andprotect the original image. The UEP strategy takes account of the sensitivity of the substreamsrequiring protection and then optimizes the redundancy rate. In our application, we used the ReedSolomon Error Correcting Code RS-ECC, mixed with symbol block interleaving for simulated trans-mission over the COST27 TU channel [71] (Figure 4.9). When compared to the JPWL system, we

4.3. NETWORK ORIENTED QOS SOLUTIONS 69
show that the proposed layout is better than the JPWL system, especially transmission conditionsare bad (SNR < 21 dB).
Figure 4.9: Overall layout of the multi-layer transmission/compression system
In other words, compensating IP packet loss also requires a UEP process, which uses an exactand discrete Radon transform, called the Mojette transform [22]. The frame-like definition of thistransform allows redundancies that can be further used for QoS purposes (figure 4.10).
Figure 4.10: General joint LAR-Mojette coding scheme
Other simulation tests have been designed for MIMO systems using a similar framework, and haveshown the ability of our codec to be easily adapted to bad transmission conditions, while keepingreasonable additional redundancy. At this point, comparisons with other methods remain difficult.Both SISO and MIMO transmissions simulation tools were provided by the French X-LIM Laboratory[27]. This work has been supported successively by the TSAR and the CAIMAN projects. Currentdevelopments are focused on the study of the LTE transmission system [126], and its combinationwith Interleaved S+P coded bitstreams.
These preliminary tests have been carried out without implementing basic error resilience features,such as resynchronization process, that should greatly improve our results. Some related solutionsare presented below. Typically, resynchronization solutions based on QM-like entropy coding scheme(see section 3.4) drastically increases the overall performances of the system.

70CHAPTER 4. CONTENT SECURIZATION AND QUALITY OF SERVICE:
PRESERVING END-TO-END DATA INTEGRITY
4.4 Conclusion
This chapter was dedicated to joint QoS oriented image coding and securization framework.Quadtree-based cryptography and data hiding were shown to be efficient solutions for content se-curization. In terms of error resilience, source-based together with channel-based coding have beendeveloped.
MPEG4-SVC dedicated rate control has also shown is efficiency. Indeed, our rate control approachcompetes with the existing approaches, as the results can attest. The main advantages of our schemeare the accuracy of the ρ-domain bitrate model and its low computational complexity, as only onepass is performed. The presented bitrate dispatching policy also allows our method to obtain asmooth quality throughout each GOP, which enhances the perceived quality and insure end-to-endQoS based functionality.
As for it, the Interleaved S+P coding scheme has been developed to face the secure transmis-sion issues. Embedded functionalities such as adapted selective cryptography, human vision-basedsteganography coupled with Unequal Error Protection and error resilience tools have been designed.The idea is to maintain good coding properties together with embedded Quality Of Service orientedsystem. This framework has yet been evaluated by the JPEG committee and has shown its globalefficiency, even if the global framework has not been retained.
However, the exchange of medical data remains a key research topic. As for the moment, whenconsidering medical image protection issues, Picture Archiving and Communication System (PACS)oriented frameworks have limitations in terms of securization process durability. If classical medicalframeworks use image coding schemes such as JPEG, JPEG2K, JPEGXR, securization processesonly act as additional features. A complete joint system should be built in such a manner that bothcoding and secure properties would benefit from each other. This remains an open research area.

Chapter 5
Generic analysis tools
For QoS/QoE purposes, generic coding tools as well as data integrity protection systems have beendesigned and described in previous chapters. To improve QoE, quality enhancement of images aswell as content handling services can be additionally proposed. This chapter then deals with genericsolutions for image analysis purposes. It can be then seen as a toolbox easily adaptable to morecomplete image processing chain.
First, image interpolation issue is addressed. As an example, resolution scalability of the Inter-leaved S+P codec is an important property as it embeds several versions of the image at differentresolution levels. The resolution of these levels is doubling in size up to the original resolution andeach resolution level is predicted from the previous one. In other words, the Interleaved S+P codecpredicts, or interpolate, a bigger image from a smaller one. Our idea is to focus on this dyadicinterpolation process and to propose a better and generic interpolation method. The underlyinginterpolation method should get the highest quality possible for a minimal complexity.
On the other hand, all images contain a certain level of semantic. Recognizing objects and namingthem is such a complex task that most of approaches have been introduced at a pseudo semanticlevel. One approach is to extract coherent areas in the images that share uniform characteristics.These similar areas are then grouped together thanks to a segmentation process. Image segmentationcreates regions where the semantic information is uniform regarding to some criteria. Even if theseregions do not match real world semantic, the information can nevertheless be exploited. Thesemantic information can be then extracted in terms of computed abstract features such as texture,colors, shapes etc. The image can also be translated in a more abstract feature space to reducethe image characteristics to a small set of parameters. In this feature space, similar images haveclosed characteristics and are easier to compare or interpret. Depending on the application, semanticextraction process has various constraints and purposes. The major constraint is the algorithmcomplexity versus performance, the more the algorithm mimics the human brain the more timeexpensive it is.
Depending on the application, the segmentation algorithm can be tuned to reach a proper seman-tic level enabling a given task even if this pseudo semantic is nothing close to a real world semantic.In this context, most region segmentation methods focus on getting the best segmentation repre-sentation using various approaches [218]. The goal of those methods is to automatically extract thesemantic information from an image to address various applications such as object recognition [69]or classification [114].
71

72 CHAPTER 5. GENERIC ANALYSIS TOOLS
Region segmentation can be either performed directly in image domain [5] or in a feature spaceusing clustering techniques [54]. The main drawback of most methods is the high complexity due tothe computational complexity and the amount of data to process. In order to reduce the complexity,some suboptimal region segmentation methods first reduce the amount of input data leading tofaster methods, for instance by using a quadtree partitioning [91]. In particular, quadtree structuresare typically used in video [121] and image coding [209]. As an example the draft specificationof HEVC video standard specifies variable block size coding units (CUs) coded through a quadtreestructure. In this chapter, we then propose two segmentation solutions that take advantages of thequadtree-based image representation.
This chapter is organized as follows: first the Dyadic Fast Interpolation method is presented insection 5.1. Then quadtree based segmentation techniques are given. In section 5.2, we designeda solution that only takes the quadtree structure as input. It then can be seen as a kind of proofof concept, leading to underline the ability of the quadtree to represent image content. Then, amultiresolution segmentation is shown in section 5.3, relying on multiresolution Region AdjacencyGraph structure.
5.1 Dyadic Fast Interpolation
Interpolation is required in applications when the original size of the image is not adapted to thedesired usage. In this case, images must be resized to fit to the desired resolution and the mostdifficult task is image enlargement. Indeed, in case of enlargement, the subsequent interpolationprocess has to estimate missing pixel values. In the literature, interpolation is sometimes referred assingle image super-resolution. A wide spectrum of approaches have been proposed for interpolation,together with a large range of complexity.
State-of-the-art interpolation methods can be classified in two distinct groups (figure 5.1). Thefirst group (in green) contains high complexity methods with usually high visual quality. The secondgroup (in blue) contains low complexity methods with often lower quality.
On the high complexity, high quality side, methods extract some statistical information from lowresolution data to reconstruct high resolution images. Some approaches build high resolution imagesby stitching several high resolution patches [62] that locally correspond to low resolution image.This type of methods gives good results but is highly dependent on the patches database and tendsto create unnatural artifacts. Some methods like [164] or [194] use Partial Differential Equations(PDEs) with excellent visual results, at the expense of high complexity. NEDI [106] and improvedmethods such as iNEDI [7] compute missing pixels by calculating the contribution of the neighborpixels to the missing ones and assuming that covariance stays constant across scales. If this methodis among the most popular in the field, its complexity is rather high (1300 multiplications per pixel).With quality comparable to NEDI [106], ICBI [61] uses second order image derivatives and iterativeprocess leading to a moderate complexity. Another type of methods perform a local analysis to selectthe best appropriate oriented linear filter in a given filter bank. These approaches can be in particularbased on wavelets [30] and lead to moderate complexity property. However, the resulting images arenot as good as high-ends methods.
On the low complexity, lower quality side, methods are mostly based on linear kernels that areless computationally expensive but provide medium to low quality image. The best images aregenerally obtained by sinus cardinal (sinc) based kernels like Lanczos [46] filter. This type of filter
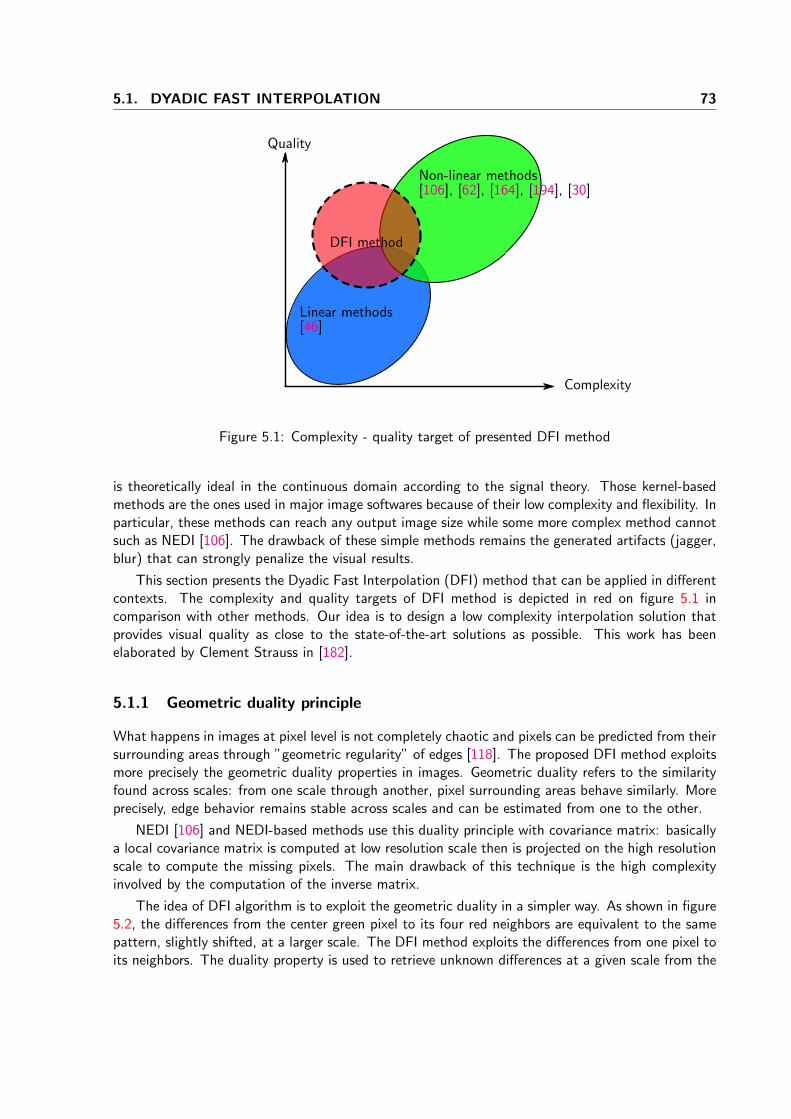
5.1. DYADIC FAST INTERPOLATION 73
Quality
Complexity
Linear methods
Non-linear methods
DFI method
[106], [62], [164], [194], [30]
[46]
Figure 5.1: Complexity - quality target of presented DFI method
is theoretically ideal in the continuous domain according to the signal theory. Those kernel-basedmethods are the ones used in major image softwares because of their low complexity and flexibility. Inparticular, these methods can reach any output image size while some more complex method cannotsuch as NEDI [106]. The drawback of these simple methods remains the generated artifacts (jagger,blur) that can strongly penalize the visual results.
This section presents the Dyadic Fast Interpolation (DFI) method that can be applied in differentcontexts. The complexity and quality targets of DFI method is depicted in red on figure 5.1 incomparison with other methods. Our idea is to design a low complexity interpolation solution thatprovides visual quality as close to the state-of-the-art solutions as possible. This work has beenelaborated by Clement Strauss in [182].
5.1.1 Geometric duality principle
What happens in images at pixel level is not completely chaotic and pixels can be predicted from theirsurrounding areas through ”geometric regularity” of edges [118]. The proposed DFI method exploitsmore precisely the geometric duality properties in images. Geometric duality refers to the similarityfound across scales: from one scale through another, pixel surrounding areas behave similarly. Moreprecisely, edge behavior remains stable across scales and can be estimated from one to the other.
NEDI [106] and NEDI-based methods use this duality principle with covariance matrix: basicallya local covariance matrix is computed at low resolution scale then is projected on the high resolutionscale to compute the missing pixels. The main drawback of this technique is the high complexityinvolved by the computation of the inverse matrix.
The idea of DFI algorithm is to exploit the geometric duality in a simpler way. As shown in figure5.2, the differences from the center green pixel to its four red neighbors are equivalent to the samepattern, slightly shifted, at a larger scale. The DFI method exploits the differences from one pixel toits neighbors. The duality property is used to retrieve unknown differences at a given scale from the

74 CHAPTER 5. GENERIC ANALYSIS TOOLS
Is equivalent to
and to
Figure 5.2: Geometric duality across scale
i
i+1
i+2
j+1
j+2j
Step 1: initialization
Step 2: diagonalinterpolation
i+1
i+2
j+1
j+2j
Step 3: verticalinterpolation
i
i+1
i+2
j+1
j+2j
Step 4: shiftremoval
i
i+1
i+2
j+1
j+2j
Step 5: enhancement
i
i+1
i+2
j+1
j+2j
Figure 5.3: DFI steps sequence
ones available at a larger scale.
5.1.2 DFI algorithm in 5 steps: an overview
DFI interpolation is decomposed into 5 steps, as presented by figure 5.3. The initialization (step 1)creates an enlarged grid from low resolution pixels. Steps 2 and 3 fill the missing pixels by guessingneighbors’ difference respectively in a diagonal and in an horizontal-vertical manner. Steps 4 and 5can be considered as additional steps: step 4 corrects a 1/2 pixel shift introduced by step 1 while step5 is a quality enhancement step. The method is conceived to double the image size from ((N ×M)to (2N × 2M)), but it can be iteratively repeated to reach any 2n enlargement.
In the following, I denotes the low resolution image of size N ×M , I stands for the interpolatedimage of size 2N × 2M , and I(i, j) is a pixel located at the coordinates (i, j) in an image I.

5.1. DYADIC FAST INTERPOLATION 75
5.1.3 Step 1 (Initialization step): pixel copy in an enlarged grid
DFI method classically enlarges images by first copying low resolution pixels in a larger grid of size2N × 2M as illustrated in figure 5.4. Therefore, 3
4 of pixels are missing at this step.
Original Image
? ??
? ??
? ??
???? ? ? ? ? ?
? ? ? ? ? ?? ? ?
Pixel copy
Enlarged grid
Figure 5.4: Step 1 - Pixel copy over an enlarged grid
5.1.4 Step 2: diagonal interpolation
Interpolation step 2 takes as input the enlarged grid created at the step 1 (red pixels in figure 5.3).Step 2 interpolates missing pixels that have four known neighbors on their diagonals. The pixelsprocessed by the step 2 are visualized in green in figure 5.3.
In order to estimate the pixel value, the process computes the differences between the missingpixel and its fours known neighbors. The differences are obtained by following the geometry similarityprinciple presented in figure 5.2 by computing differences in the same direction but at a larger scale.This diagonal interpolation process is illustrated in figure 5.5.
As an example, the difference ∆a between the missing pixel I(2i+ 1, 2j + 1) (pixels 2 in figure5.5) and its top left neighbor is approximated by the mean value ∆a = (∆a1+∆a2+∆a3+∆a4)/4,where the set ∆ai represents the local differences obtained within the four quadrants. Once themissing pixel is estimated from its 4 neighbors, the resulting pixel value is bounded by the values ofthese 4 neighbors. The corresponding complete algorithm can be found in [182].
5.1.5 Step 3: vertical - horizontal interpolation
This second step benefits from the results of the first step. This step can be seen as the same as step2 but rotated by 45 degrees. Step 3 interpolates missing pixels that have four neighbors in verticaland horizontal directions. The pixels processed by the step 3 are represented in blue in figure 5.3.
Step 3 algorithm is very similar to the previous one except that the immediate neighbors arein vertical and horizontal configuration. Identically, the missing pixel is interpolated by estimatingits differences to its 4 neighbors. Once again, the differences (∆a,∆b,∆c,∆d) are obtained byfollowing the geometry similarity principle presented in figure 5.2 by computing differences in thesame direction but at a larger scale (figure 5.6).
5.1.6 Step 4: 1/2 pixel shift
Step 1 introduces a 1/2 pixel shift in the image as it does not spread evenly the low resolutionpixel in the enlarged image. Ideally, the first low resolution pixel I(1, 1) should be projected in the

76 CHAPTER 5. GENERIC ANALYSIS TOOLS
2j
2j-22i-
2
2j+2
2i 2i+2
2i+1
2j+1
2i+4
2j+4
2j
2j-22i-
2
2j+2
2i 2i+2
2i+1
2j+1
2i+4
2j+4
2j
2j-22i-
2
2j+2
2i 2i+2
2i+1
2j+1
2i+4
2j+4
2j
2j-22i-
2
2j+2
2i 2i+2
2i+1
2j+1
2i+4
2j+4
Δd
ΔbΔa2j
2j-22i-
2
2j+2
2i 2i+2
2i+1
2j+1
2i+4
2j+4
1 1 1 1
1111
1 1 1 1
1111 1 1 1 1
1111
1 1 1 1
1111 1 1 1 1
1111
1 1 1 1
1111 1 1 1 1
1111
1 1 1 1
1111
1 1 1 1
1111
1 1 1 1
1111
2
Figure 5.5: Step 2 - diagonal interpolation
interpolated image on coordinates I(1.5, 1.5).
The step 4 is dedicated to compensate this shift. This step is identical to the step 2 and isapplied to the interpolated high resolution image so that to create new pixels between pixels atinteger position from a diagonal neighborhood (like step 2). Another way of seeing this is that itcreates new pixels on an imaginary grid of the same resolution but shifted of a 1/2 pixel position.Then, this imaginary grid substitutes the original one compensating the 1/2 pixel shift (figure 5.7).
Regarding WPSNR scores, the shift correction is required in order to avoid a shift between thereference image and the interpolated image. In all other cases, the 1/2 pixel shift can be optional,especially when the real high resolution image is unknown and when the image borders are off interest.
5.1.7 Step 5: Quality enhancement - local mean correction
Image interpolation is an up-sampling operation, leading to enlargie the image size, while down-sampling is the inverse operation. Ideally an interpolation operation followed by a down-samplingoperation must result in an identity operation. This last step 5 aims at verifying that up-samplingand down-sampling operations are symmetric. If not, the step 5 corrects the interpolated image
In practice, any interpolation methods can introduce a bias that may need to be corrected. Thepresented quality enhancement step is a generic method that can be applied to any interpolationmethod. The algorithm ?? is then implemented the simplest way possible: in particular, otheradvanced down-sample filters can be used so that to increase the overall image quality.

5.1. DYADIC FAST INTERPOLATION 77
2j
2j-2
2i-2
2j+2
2i 2i+22i+
1
2i+4
2j+4
1 1 1 1
1111
1 1 1 1
1111
2
2 2
2
2
2
2 2 2
2 22
1 1 1 1
2j
2j-2
2i-2
2j+2
2i 2i+22i+
1
2i+4
2j+4
1 1 1 1
1111
1 1 1 1
1111
2
2 2
2
2
2
2 2 2
2 22
1 1 1 1
2j
2j-2
2i-2
2j+2
2i 2i+22i+
1
2i+4
2j+4
1 1 1 1
1111
1 1 1 1
1111
2
2 2
2
2
2
2 2 2
2 22
1 1 1 1
2j
2i-1
2j+1
2i 2i+32i+
1
11
2
2 2
2
2
2
3
2j-1
2j
2j-2
2i-2
2j+2
2i 2i+22i+
1
2i+4
2j+4
1 1 1 1
1111
1 1 1 1
1111
2
2 2
2
2
2
2 2 2
2 22
1 1 1 1
2i+2
Figure 5.6: Step 3 - vertical / horizontal interpolation
1 1
11
2
22
2
3 3
3
33
3
3 3
4 4 4
4 4 4
4444
4
4
4 4 44i
i+1
i+2i+3
j+1 j+2 j+3j
4 4 4
3 4 4
4344
4
3
4 4 44i
i+1
i+2i+3
j+1 j+2 j+3j
1
3
2
Pixels from pass 1 (low resolution image pixels)
Interpolated pixels from pass 2
Interpolated pixels from pass 3
Interpolated pixels from pass 4 4
1/2 Pixel shift
1: Diagonal interpolation 2: Pixels replacement
Figure 5.7: Step 4: diagonal interpolation for 1/2 pixel shifting
Local mean correction - Algorithm During interpolation, one pixel in the low resolution imageI is projected over four pixels in I. The step 5 algorithm checks the projection in the oppositedirection. It verifies that the interpolated pixels can be correctly projected back to the low resolutioninput image. Then, the correction algorithm checks if the mean of the four projected pixels in Iis equal to the corresponding pixel in I. If a correction is required, the four pixels are uniformlymodified to get closer to the awaited mean.
Visually images appear sharper, however local mean correction also tends to add some aliasingon thin edges. The PSNR score of interpolated images are higher with the correction. The table 5.1shows an increase of 0.84 dB over 25 images.

78 CHAPTER 5. GENERIC ANALYSIS TOOLS
(a) Original image (b) Input image (c) Interpolated imageWITHOUT quality enhance-ment
(d) Interpolated imageWITH quality enhancement
Figure 5.8: Quality enhancement step illustration, 8× enlargement
methods mean WPSNR in dB over 25 images
Interpolation alone 32.08Interpolation + local mean correction 32.92
Interpolation + smoothed local mean correction 32.87
Table 5.1: Local mean correction results on proposed interpolation method, average WPSNR scoreson 25 images
Smoother local mean correction. To soften the aliasing effect, one solution is to apply a smoothercorrection. The correction must be especially smoothed on strong edges where the aliasing is morevisible. The correction is thus not directly applied. In a first time, a raw correction map is computedcontaining pixel by pixel correction. In a second time, I is corrected by a smoothed version of thecorrection map. By smoothing the correction map, the aliasing effect is strongly reduced togetherwith keeping quality gain. Despite a reduced efficiency (-0.05dB) resulting images appear visuallybetter with less aliasing (table 5.1). Figure 5.8 illustrates the quality enhancement step effects.
5.1.8 Border handling
On a general point of view, some methods do not handle image border well: either the borders arenot processed or the output image is cropped and borders are simply removed. In order to handle theimage border, the low resolution image is extended by border replication. This is a classical approachfor image border filtering without modifying the filtering algorithm itself. In our case, a band of8 pixels is added all around the image border. The band is created by symmetry with the pixel inthe image. This image extension is illustrated in figure 5.9. Image extension by symmetry creates acomplete neighborhood for border pixels and allows the DFI method to stay the same for all pixels.
5.1.9 Resulting images and objective quality
For evaluation purposes, we have produced images by applying all the 5 steps of the DFI method.In particular, the 1/2 pixel shift (step 4) and the quality enhancement (step 5) are used. Imagesare compared in terms of objective quality and in terms of subjective quality. For objective quality

5.1. DYADIC FAST INTERPOLATION 79
8 pixels
Symmetry 8 pixels
Symmetry
Figure 5.9: Image extension by symmetry for border handling
measures, 25 images are used. For subjective quality measures, a subset of 13 images are used. Thecomplete testing procedure is described in [182].
5.1.9.1 Objective measure
Objective measures operate comparisons of our DFI method with a classical linear method of similarcomplexity. Table 5.2 shows a WPSNR gain for the DFI method of 0.5 dB when compared to theLanczos method.
method Bilinear* Mitchell* Lanczos* DFI methodWPSNR 29.23 dB 31.10 dB 32.43 dB 32.92 dB
Table 5.2: Average WPSNR scores on 25 images of 512 by 512 pixels size. 2× enlargement. * :ImageMagick filter
5.1.9.2 Subjective evaluation
In order to evaluate the DFI method in a subjective manner, a subjective quality campaign has beenperformed on several images. The goal of such a campaign is to get an evaluation of the perceivedvisual quality of the DFI method and to figure how human subject feels about the DFI methodcomparatively to other methods.
The results, summarized in figure 5.10, consists of a subjective evaluation on 13 images, eachimage is interpolated with 8 different methods and rated by 14 human subjects. This type ofassessment campaign is very time consuming and test subjects are voluntary.
The evaluation process is done as follows. For each image, the 8 different methods are presentedtogether with the original image. Test subject rate freely each resulting image on a 0 to 10 scale.10 being the highest quality. Images were interpolated from a size of 128 by 128 pixels up to a sizeof 512 by 512 pixels. The compared methods have a wide spectrum of complexity and are listed inthe following sections.

80 CHAPTER 5. GENERIC ANALYSIS TOOLS
On the low complexity side, 3 linear filter based methods, from the ImageMagick library [37],are used together with our DFI method, i.e. the nearest neighbor interpolation, bicubic and Lanczosinterpolation solutions. Our DFI method has the same class of complexity than linear filters aspresented in section 5.1.10. On the medium to high complexity side, 4 methods are used. ICBI[61] is a method with medium complexity. iNEDI [7] interpolation process is an improved versionof [106] and is the most complex method of the set. The Pseudo LAD [165] of the ”SAR ImageProcessor” software is used as it is often cited in the field and is well considered. PhotoZoom 3 [113]is a commercial enlargement software for photographers that has been also used in this test.
0.0
20.0
40.0
60.0
80.0
100.0
Pelica
nba
ncZeb
rarev
eil
macha
onfle
ur1
maneg
efle
ur2
poup
eeaig
le
mouton
sgir
afe tigre
Hidden referenceICBIinediLanczosDFIN.NeighborPhotozoomSAR Pseudo-LADBicubic
Figure 5.10: Subjective evaluation
From the figure 5.10, a group of 3 methods is clearly above the others and the DFI method isamong them. Apart from the ”Pelican” image, the DFI method gives rather close subjective scoresto much more complex methods (PhotoZoom [113] and Pseudo LAD [165]). A second group ofmethods including ICBI, iNEDI, and Lanczos methods gives medium results with a clear quality gapfrom the first group of methods. In [61], the subjective evaluation of the ICBI method gives similarresults to the iNEDI method. Our evaluation thus corroborates this equivalence. Lastly, bicubic andnearest neighbor methods give the worst results.
5.1.10 Complexity analysis and parallel implementation
This section presents a deep complexity analysis of the DFI method. In addition, the computationaltimes of all the methods assessed in the previous subjective evaluation are presented.
Interpolation Algorithm analysis. The main part of our interpolation algorithm,i.e. steps 1 up to3, operates only on integer data and does not use any multiplication. Operations are then restrictedto bitshifts comparisons, and additions. Table 5.3 shows the number of each operation for each ofthe 5 steps. In addition, table 5.3 shows the percentage of pixels that are processed by each step.

5.1. DYADIC FAST INTERPOLATION 81
Number of operations per pixel +,- bitshifts comparisons % of processed pixels
Step 1 0 0 0 25%Step 2 21 5 4 25%Step 3 21 5 4 50%Step 4 21 5 4 100%Step 5 10 2 4 100%
Mean operation number per pixel 46.75 10.75 11 100%
Table 5.3: Number of operations per pixel in the high resolution image for the proposed interpolationalgorithm
Compared to other methods, the proposed DFI method exhibits a very low computational com-plexity. Moreover, the implementation uses integer data leading to faster computation time. Forcomparison purposes, the NEDI method [106] claims to perform 1300 multiplications per pixels.
Speed comparison. In order to illustrate its low complexity, our DFI method is compared to Im-ageMagick [37] interpolation functions and to the methods used in the subjective evaluation (section5.1.9.2). Table 5.4 shows that the speed relative to the presented interpolation method is comparableto kernel based methods. This test shows that it is slightly faster that default ImageMagick filtersbut the DFI method achieves better visual results and lower memory consumption.
Interpolation algorithm (+ opening and saving) time for 250 iteration Peak memory
ImageMagick Lanczos filter 56.73 s 19404 ko
ImageMagick Mitchell filter 50.297 s 19384 ko
Proposed interpolation method 49.50 s 10504 ko
Table 5.4: Benchmark of interpolation methods, enlargement by 2 of a 512 by 512 image
For the subjective evaluation (section 5.1.9.2), the DFI method has comparable quality resultswith Photozoom [113] and pseudo LAD [165] methods. However, the DFI method is at least 50times faster (see table 5.5). As a consequence, the DFI method has the best tradeoff between qualityand complexity of all the tested methods.
method execution time implementation
DFI method ≈ 0.06s compiled + multithreadingImageMagick filters [37] ≈ 0.06s compiled + multithreadingICBI [61] ≈ 1.2s according to [61] compilediNEDI [7] >1000s Matlabpseudo LAD [165] 3 to 4s compiled + multithreadingphotozoom [113] 3 to 4s compiled + multithreading
Table 5.5: Execution times of the methods used in the subjective evaluation: 128 by 128 pixels imageenlarged to a 512 by 512 pixels image

82 CHAPTER 5. GENERIC ANALYSIS TOOLS
5.1.10.1 Speed enhancement solutions
The goal of the presented DFI is to achieve the higher quality with the minimum complexity. If theDFI has proved to be a fast method, its speed can be enhanced at a cost of a slight lost of quality.Different solutions have been envisaged.
First a speed enhancement solution taking advantage of the YCbCr color space characteristicscan be designed. Since each channel of the YCbCr does not have the same visual importance theinterpolation process should be different from the Y channel to the others. Indeed, the Y channelhas to be processed with more care than the chrominance channels that can be processed by simplerand faster algorithm. In this case, the Y channel can be processed by our interpolation algorithmwhile the chrominance channels are processed by a simple bilinear filtering. A WPSNR decrease of0.278dB is observed when compared to the version where all color channels are processed by the DFImethod. However, the time gain between the two approaches is more than 50% while the loss ofWPSNR is only 1%.
Secondly, a speed enhancement solution relies on an image activity classification. Indeed, forinterpolating algorithms, the most critical results are located on edges and high energy or texturedregions. On those areas, the interpolation method quality is of the most importance to get satisfyingvisual results. On the opposite side, smoother areas (low energy regions) of the image can beprocessed with less care for the same visual final result. Our idea is to choose the proper interpolationmethod for each pixel according to the pixel energy class. Since low energy pixels can be easilyinterpolated with a simpler and faster method, the overall complexity can be reduced compare tothe case where all pixels are interpolated with our interpolation method. As an example, within theLAR framework, the quadtree structure gives us clues on the nature of the pixels. Typically, 2 by 2pixels blocks represent areas of highest activity, such as texture or contour, being more difficult tointerpolate. The proposed solution is then to process with the DFI method all the pixels representedby 2 by 2 blocks in the quadtree, while the rest of the image will be processed by a faster bilinearfiltering. In addition, surrounding pixel of 2 by 2 blocks will also be processed by the DFI methodto avoid frontier artifacts. Results show a negligible loss of WPSNR (0.0017 dB) while the speedgain is about 12%. The acceleration factor strongly depends on the ratio of classified pixels linkedto the quadtree threshold TH and the nature of the image. On the 25 tested images, the speed gainis ranging from 0% up to 80% with similar WPSNR losses.
In any cases, the Hybrid DFI algorithm leads to speed gain with a minimal quality loss. Classi-fication is here based on a quadtree decomposition of the image. However, any other classifier canbe used, such as contour extraction in the low resolution image. Hybrid interpolation approach istherefore a general principle that can be applied on a wide application field.
For a maximal efficiency, both acceleration solutions can be combined. A speed increment of59% with a slight quality loss of 0.277db is then observed. Figure 5.11 illustrates the visual effect ofthe hybrid solution. In particular, visually, the figures 5.11a and 5.11b are very similar.
Considering our speed performances, the DFI method is thus fast enough to be used for realtime video interpolation. For example, it could be used to interpolate from SD to HD resolution.However, the DFI method is limited to enlargement ratio of 2n and the ratio between SD to HD is1.5. A solution exists to overcome this issue: it consists of adapting the DFI algorithm during thecomputation of missing pixels, as described in [32], by using a rectangular neighborhood of 1.5 ratio,instead of using a square neighborhood.

5.2. REGION SEGMENTATION FROM QUADTREE STRUCTURE 83
(a) Interpolated image, no acceler-ation
(b) Combined approach: YCbCrcolor space + Hybrid DFI
(c) Pixel classification for HybridDFI; white = DFI, black = bilinearinterpolation
Figure 5.11: Combined approach: YCbCr color space + Hybrid DFI illustration, 2× enlargement
5.2 Region segmentation from quadtree structure
While its coding cost remains minimal, a quadtree contains a certain level of pseudo-semantic. Thepurpose of the presented algorithm is to extract the remaining semantic information from only thequadtree structure knowledge into regions. The idea is here to validate the assumption that thequadtree itself can be a clue of the image content. As no other information than the quadtreestructure itself is required, the resulting segmentation map is sub-optimal but the overall complexityof the algorithm is very low. This solution can be then seen as a preprocess for further and finersegmentation processes.
The segmentation method relies then on two strong hypothesis. First, we assume that objectcontours are represented by smaller blocks. Secondly, we assume that the inner part of the objectsis represented by bigger blocks in the quadtree that localize the object center.
Based upon these assumptions, the idea behind the method is to used a region growing approach,where the seeds are located on the bigger blocks. The regions will then grow by accumulating availablesurrounding blocks of decreasing sizes. Regions should then grow in objects from the inside out, andshould automatically stop at object contour.
This original segmentation method has been designed by Clement Strauss during its PhD work.
5.2.1 Notations
In order to describe the segmentation algorithm, let us introduce some notations.
• Let QT be the the dyadic quadtree partition composed of P square blocks bi, for i ∈ 1..Pand where each block bi has a surface of 2S × 2S pixels, S ∈ 1..MaxSize,
• The region segmentation method transforms the initial partition ∆0 being the quadtree par-titioning QT into a partition ∆k (0 < k < P ) through k merging steps. Consequently a ∆k
partition is then composed of (P −k) non overlapping regions Rki . Each region R0
i in ∆0 thencorresponds to a block bi.
• Let surf(Rki ) be the surface in pixels of Rk
i ,

84 CHAPTER 5. GENERIC ANALYSIS TOOLS
• Let |(Rki )| be the cardinal of Rk
i ,• Let Ak
i be the set of adjacent regions of Rki ∈ ∆k.
In order to easily describe the algorithm, the term ”block” is used but actually refers to a ”singleblock region”.
5.2.2 Region segmentation algorithm
As previously mentioned, the segmentation algorithm 5.1) is initialized by the quadtree partitioning∆0. The algorithm can be then decomposed into two iterative processes, namely Seeds creationand Region growing.
First, the Seed creation process is executed. Once a first block of surface CurrentSurf isadded to the seed of a region, all adjacent blocks of surface CurrentSurf are recursively added tothe seed. During this step a set of seeds is created. Figure 5.12c illustrates the result of the creationof a set of seeds.
During the second process Region growing, all regions, issued from a seed, are simultaneouslygrown together. Regions are grown by merging their immediately adjacent blocks. Figure 5.12dillustrates the growth of seeds created in the previous step (figure 5.12c).
Neighbor blocks are merged if their surface is above the CurrentSurf threshold. Once a firstregion has grown by merging its immediate neighborhood, the next region is grown until all regionsare processed. This last process is repeated a given number of times namely iter(CurrentSurf)times. iter(CurrentSurf) is here manually set up considering the awaited results and the context.
Making regions grow one by one leads to a simultaneous region growing process. In our setupthe number of growing repetitions increases when the block size threshold CurrentSurf decreases.The more growing repetitions are performed, the more blocks are merged thus decreasing the totalnumber of regions.
The two processes are re-iterated with a reduced value of CurrentSurf . New seeds are created,leading to new regions, then all regions are grown by merging surrounding blocks that match theCurrentSurf threshold. Figure 5.12 illustrates few steps of the region segmentation algorithm.
The algorithm does not consider the pixel value and only uses the quadtree structure withoutadditional data and without supervision. In this sense the algorithm performs a kind of blind seg-mentation.
5.2.3 Performances analyses
Segmentations may seem to exhibit a rather high number of regions as shown in figure 5.12. Keepinga rather high number of regions is justified by the limited content of the input data (quadtree) asshown in figure 5.12f. Moreover a large number of regions also mean smaller regions thus avoidingstrong segmentation errors. Indeed if a region grows too much it is more likely to cross over a semanticcontour where it should have stopped. It also enables a more accurate visual representation. Thedata given by the lone quadtree is so light in terms of information that it is difficult to extractbig regions covering a whole semantic object. Therefore a semantic object will be more likely splitinto several regions. This solution has been chosen in order to avoid the case where a single regionoverlaps two different objects.

5.2. REGION SEGMENTATION FROM QUADTREE STRUCTURE 85
(a) Original image (b) Quadtree (c) New seeds creation
(d) Region growing step 1 (e) Region growing step 2 (f) New seeds creation
Figure 5.12: Few steps of the segmentation method in false colors

86 CHAPTER 5. GENERIC ANALYSIS TOOLS
Algorithm 5.1: Complete region segmentation algorithm
/* Initializations */
k = 0;
∆k = Qt;CurrentSurf = 2MaxSize × 2MaxSize;repeat
/* Seeds creation */
while ∃ Rki |( surf(Rk
i ) = CurrentSurf and |Rki | = 1) do
while ∃ Rkj ∈ Ak
i and surf(Rkj ) = CurrentSurf and |Rk
j | = 1 do
Merge Rkj and Rk
i into ∆k+1;
k = k + 1;
Update Aki ;
end
endCurrentSurf = bCurrentSurf/4c;/* Region growing */
while ∃ Rki | surf(Rk
i ) = CurrentSurf dofor iter = 1 to iter(CurrentSurf) do
Let A′ = R0j |(R0
j ∈ Aki and surf(R0
j ) = CurrentSurf and |R0j | = 1) ;
Let N = |A′|;Merge Rk
i and A′ into ∆k+N ;k = k +N ;
Update Aki ;
end
end
until CurrentSurf = 0;
5.2.3.1 Evaluation of the segmentation
Evaluating a segmentation is a hard task [92]. Segmentation evaluation can be performed withhelp of standard databases. Another way of evaluating a method can be obtained by evaluating theapplication enabled by the region representation. It can give a idea of how good is the segmentationfor a given task.
The Berkeley image segmentation database [124] measures segmentation processes by comparingregion contours with human segmentation. This database is widely used for segmentation evaluationpurposes. The Berkeley database contains both test images and training images with human groundtruth. In addition a benchmark method is given.
Considering this image database, it cannot be directly used in our case since our pseudo semanticlevel is not high enough. However the comparison methodology can still be exploited.
As for the benchmark, our segmentation process produces too much regions comparing to whathuman subjects do. Therefore using the Berkeley benchmark method is not a valid option [92]. Inaddition our segmentation is working from a reduced data set (quadtree) that already reduces thesemantic. Similar method in that way does not exist to our knowledge and comparing our method

5.2. REGION SEGMENTATION FROM QUADTREE STRUCTURE 87
with other methods with full access to the image would be meaningless.
Even if the Berkeley segmentation benchmark cannot be used as a whole, our method can,nevertheless, be visually compared either to the proposed hand drawn ground truth or relatively tothe original image.
Figure 5.14 and 5.13 present segmentation results obtained on 3 images of the Berkeley database[124]. Each image is presented with the corresponding quadtree, the segmentation map in falsecolors, and pseudo region boundary extraction
The region pseudo contour image shows region boundaries only where the quadtree exhibits 4by 4 or 2 by 2 pixel blocks. Region boundaries are shown in white when they correspond to 2 by 2blocks and in grey for 4 by 4 blocks. Displaying only contours on smaller blocks enables to highlightone of our hypothesis on the quadtree block size semantic. Indeed we assume that smaller blockssemantically correspond to object contours.
Figures 5.13 and 5.14 show that our segmentation process manages to extract from the quadtreesome object contours. This demonstrates that the presented method manages to reach a certainpseudo semantic level and validates both our region growing approach and our hypothesis about thequadtree block semantics.
As previously mentioned, a rating of our segmentation is difficult and comparing with otherapproaches has no real signification according to our specificities. However both segmentation mapsand pseudo region contours partially exhibit the pseudo semantic contained in the quadtree andpartially retrieve the semantic contained in the original image.
(a) Original image (b) Quadtree (c) Segmentation (d) Method pseudocontours
(e) Ground truth
Figure 5.13: Segmentation method evaluation, Berkeley database
5.2.3.2 Complexity analysis
Region segmentation process is composed of two major steps: quadtree decomposition and regionmerging. Quadtree decomposition has a low complexity and does not use any multiplication, division,or floating point operations. It uses mainly comparisons to compute the local homogeneity.

88 CHAPTER 5. GENERIC ANALYSIS TOOLS
(a) Original image (b) Quadtree input (c) Segmentation in false col-ors
(d) Method pseudo contours
Figure 5.14: Segmentation method evaluation

5.3. MULTIRESOLUTION SEGMENTATION 89
Region merging itself also has a low complexity. First it uses a reduced amount of data sincethe quadtree strongly sums up the image content. Secondly the region merging depends only oncomparison operators and no multiplication is involved. In addition its complexity is proportionalto the image size. In the followings, execution times are given for a C implementation on an Intelcore 2 duo at 2.5 GHz used with a single core. The quadtree split process takes about 10ms andthe segmentation process typically takes from 30ms up to 60ms for a 512 by 512 pixels color image.These could be optimized by tuning the implementation.
5.2.3.3 Potential applications
The image segmentation method is based on a strongly reduced dataset. Segmentation is not directlyperformed in the pixel domain. Instead, the method uses an empty quadtree structure, assumingthat this structure matches the semantic content of the image. Several algorithms and codecs embedsuch quadtree structures from where the method could operate. Despite the low semantic contentof the input, the segmentation method manages to retrieve some semantic contained in the originalimage and approaches the ground truth results. The input data being so light, our method has avery low complexity even when considering the quadtree partitioning. The results show that bothour hypothesis about the semantically compliant quadtree structure and the region growing approachmake sense. The seed selection efficiently selects object center, and the region growing based onblock sizes manages to recover some original semantic.
In addition the quality of our results show that a quadtree partitioning enables an efficient speedup for image segmentation by simplifying the information without destroying important semanticparts. This quadtree partitioning approach should be considered as a speed up approach for othermethods.
One advantage of our method is to enable a basic segmentation without needing color informa-tion. As an example, in a video or image coding scheme, this could enable a semantically adaptiveprocessing prior to pixel value availability or knowledge. However, as this method does not use colorinformation, adding such information should naturally improve the segmentation representation bysuppressing some uncertainties during the region growing algorithm, hence improving the segmen-tation quality, at the expense of complexity. It also could be seen as a preprocess for advancedsegmentation solutions so that to accelerate the overall process.
5.3 Multiresolution segmentation
In parallel to the previous low complex segmentation solution, a scalable segmentation algorithmcalled JHMS (Joint Hierarchical and Multiresolution Segmentation) characterized by region-basedhierarchy and resolution scalability, has been proposed by Rafiq Sekkal during his PhD work. Mostof the state-of-the-art algorithms either apply a multiresolution segmentation [93, 197, 181] or ahierarchical segmentation [94, 127]. The proposed approach combines both multiresolution andhierarchical segmentation processes. Indeed, the image is considered as a set of images at differentlevels of resolution, where at each level a hierarchical segmentation is performed.
Multiresolution implies that a segmentation of a given level is reused in further segmentationprocesses operated at next levels so that to insure contour consistency between different resolutions.Each level of resolution provides a Region Adjacency Graph (RAG) that describes the neighborhood

90 CHAPTER 5. GENERIC ANALYSIS TOOLS
relationships between regions within a given level of the multiresolution representation. Region labelconsistency is preserved thanks to a dedicated projection algorithm based on inter-level relationships.
Semantic or pseudo-semantic region extraction takes then advantage of multiresolution repre-sentation in terms of region definition at the expense of the computational complexity. Then aneffective tradeoff should be found so that to obtain both content compliant representation and a fastsegmentation solution.
This solution remains generic as the innovative part relies on the RAG description. This frameworkcan be then coupled to any hierarchical segmentation system, such as
Figure 5.15: Multiresolution and hierarchical segmentation representations
5.3.0.4 General principles
The JHMS technique relies on an iterative process of the pyramid until reaching the desired level ofresolution lmin. As described in figure 5.16, an initialization process from the low resolution imageis first required.
Let RAGl be the Region Adjacency Graph at resolution level l, with l ∈ lmax, . . . , lmin.Regions of the initial RAGlmax correspond to the blocks of the lowest resolution image. Then, ahierarchical segmentation modifies the RAGlmax by including hierarchical description.
Iteratively, for each level l of the pyramid, the current RAGl is obtained by projecting the RAGl+1
onto the RAGl resolution. RAGl is then updated by taking into account both the projected RAGl+1
and changes within neighborhood relationships. Finally, a hierarchical segmentation is performed ontothe current RAGl.
5.3.0.5 Multiresolution RAG
Figure 5.17 depicts the different steps of the multiresolution RAG algorithm. To project RAGl+1 ontoRAGl across resolution, the algorithm projects the regions labels by using the quadtree partition.Indeed it is used as a reference to decide which blocks are kept unchanged and which ones aresplit. Thus regions composed of at least one unchanged block are considered as fixed regions,and are directly projected in the current level. Labels of fixed regions are maintained for the nextsegmentation step. Inheriting labels ensures the label consistency of the segmentation. Unchangedblocks correspond to leaves of the quadtree. Thus if an unchanged block is detected at lth level, itmeans that 2l+1 pixels in the full resolution will be discarded from the computation. Consequently,the computation is reduced thanks to quadtree partitioning.

5.3. MULTIRESOLUTION SEGMENTATION 91
Pyramidal representationPyramidal representation
RAG Initialization
ResolutionLevel lmax
ResolutionLevel l
HierarchicalSegmentation
HierarchicalSegmentation
HierarchicalSegmentation
RAG Projection
l=l-1
RAG lmax
RAG l+1
Quadtree
Reslmax
Res l
RAG lmin
RAG l
Multiresolution RAGMultiresolution RAG
Hierarchical segmentationHierarchical segmentation
l
Figure 5.16: JHMS general scheme
Region relationships between two successive levels are shown in figure 5.17. Two kinds of regionrelationships are obtained: regions created in RAGl with blocks from the same region in the RAGl+1
(Figure 5.17.a) or regions with blocks that belong to different regions in RAGl+1 (Figure 5.17.b).
Label
Split
Merge
Level l
Level l+1
regionblock
RAGl+1
Resl+1
Resl
RAGl
Labeling
Split
Merge
Level l
Level l+1
a b
Figure 5.17: Inter-level regions relationships. Four regions in Resl, in a) regions are composed with
blocks of the same region parent. However in b) there is one region composed from blocks belongingto the two regions parents
5.3.0.6 Hierarchical segmentation
An extension to hierarchical representation at each level of multiresolution can be designed to over-come the natural resulting over-segmentation by selecting the segmentation granularity. This globalsolution called Joint Hierarchical and Multiresolution Segmentation (JHMS) provides a highly scal-able region representation.

92 CHAPTER 5. GENERIC ANALYSIS TOOLS
5.3.1 Experiments and results
The proposed algorithm combines two criteria. The first criterion is the difference between themean values of two adjacent regions. The second criterion computes the gradient between blocksalong the shared contour between two regions. For our experiments, we used the Locally AdaptiveResolution structure to build the quadtree and the hierarchical segmentation function (see section2.2.3). Although a learning step is recommended to find the optimal set of parameters, they havebeen empirically tuned relying on experiments when trying to get effective results.
Figure 5.18: Scalable segmentation results
5.3.1.1 Visual results
In Figure 5.18, resulting segmented images are shown. Regions are here presented in false color. Fromthe left to the right, original image is first presented, then the corresponding oversampled image oflabels at different resolution levels (i.e. 3, 2, 1). As can be observed, results at this resolutionare satisfactory in terms of representation. In addition, the consistency of region labels is wellpreserved across resolutions, so that object tracking can be envisaged throughout the multiresolution.Furthermore, color gradated regions such as the sky of the first image are well detected as a singleregion thanks to the local gradient feature.
5.3.1.2 Objective quality of segmentation
In order to compare the proposed algorithm with the literature, obtained segmentation maps aretested against the Berkeley benchmark[124] . This benchmark is usually used for comparing contourdetector algorithms. Contour maps are thus compared with contour maps designed by human beingswhich are then considered as ground truth. In our experiment the BSDS300 dataset is used.

5.3. MULTIRESOLUTION SEGMENTATION 93
The proposed algorithm is strictly based on local gradient and mean merging criteria. To providea fair comparison, only color-based contour detectors, from the Berkeley benchmark, that share thesame features have been compared. The algorithm results have been then compared with groundtruth images. As shown in table 5.6, JHMS obtained F=0.60 score. As for it, GPB [117] (GlobalProbability of Boundary) combines the use of local information derived from brightness, color, andtexture signals to produce a contour detector. It provides the best performance on the benchmarkwith F=0.70. CG[125] (Color Gradient), another algorithm based on same features as the JHMSprovides a score of F=0.57.
JHMS provides a pseudo semantic segmentation and is not able to reach object level granularityby itself. Typically, the difference of score with GPB is due to the fact that additional textureinformation are used in the GPB segmentation. Texture improves the segmentation results, however,extracting texture features makes the algorithm more computationally complex.
Algorithms Ground Truth GPB CG JHMS
Scores Average 0.79 0.70 0.57 0.59
Table 5.6: Quantitative scores on Berkeley database BSDS30
In figure 5.19, different contour maps are presented from GPB, CG and JHMS techniques. Most ofcontours in JHMS are similar to those found in the ground truth images. Neither global informationnor texture features are used in JHMS. In consequence, any strong brightness or color variationswithin a single object lead to over-segmentation, thus penalizing the score of our algorithm. Forexample, to segment the tiger in the last row of figure 5.19, hand segmented images consider thewhole tiger as a single region and one consistent contour. With the proposed algorithm, the tiger isdetected as multiple adjacent regions corresponding to the stripes of the skin.
Figure 5.19: Image Boundaries, from the left: ground truth, Global Probability of Boundary GPB,Color Gradient (CG) and JHMS results

94 CHAPTER 5. GENERIC ANALYSIS TOOLS
5.3.1.3 Multiresolution and quadtree partitioning influence on complexity and objectivescores
In order to exhibit the influence of the quadtree partitioning and the influence of the multiresolutionscalability on the computational complexity and objective scores, segmentations in different config-urations have been performed on the BSDS300 dataset images. Results are here obtained using anIntel Core i7 @2.67GHz with a single thread. The average time of segmenting the 100 images of thedataset and mean scores of Berkeley benchmark have been measured.
First the influence of the quadtree partitioning is evaluated without multiresolution. Segmenta-tions are directly performed on the full resolution image, either on pixel based images or on blockbased images following the quadtree partitioning. Table 5.7 shows that the quadtree partitioningenables a 5.5 times speed up compared to the pixel based images. In addition the objective scorewith quadtree partitioning is better. This can be explained by the fact that the quadtree helps byguiding the segmentation algorithm in the image by providing a first pseudo semantic description.
Secondly the multiresolution segmentations are compared with an increasing number of resolutionlevels. Table 5.7 depicts the results of our experiments with segmentations performed withoutmultiresolution, and with up to 4 levels of embedded resolution levels. Objective scores remain almostidentical when increasing the number of resolution levels and remain close to the performances of thesegmentations without multiresolution. However, using multiresolution, scalability strongly impactsthe complexity. Complexity comes from both the RAG projection from one resolution level to the nextand the segmentation itself at one level of resolution. With more levels of resolution the segmentationat each resolution level is simplified, therefore, more levels tend to reduce the overall complexity. Asfor the RAG projection mechanism, its complexity is proportional to the number of blocks. From thehalf resolution up to the full resolution, the RAG projection handles much more small blocks thanduring other previous projection steps. Therefore, the last RAG projection onto the full resolutionlevel explains for the most part the complexity of the method.
Multiresolution none none 2 levels 3 levels 4 levels
Quadtree partitioning no yes yes yes yes
BSDS300 scores 0.58 0.60 0.575 0.577 0.578
Execution time (s) 1.100 0.200 1.429 1.355 1.300
Table 5.7: Multiresolution and quadtree partitioning influence on complexity and objective scores
5.4 Conclusion
In this chapter, we first describe an innovative and low complex interpolation solution. The DFI in-terpolation method was developed as a universal method and its only limitation is the 2n enlargementratio. Concerning the quality, subjective tests show that the DFI method is visually almost as goodas state of the art method. However, the DFI complexity is much lower and comparable to linearmethods and is at least 50 times faster than other tested methods with comparable or better quality.The DFI is highly parallel and has been implemented on multicore architectures with accelerationfactor close to the number of cores. In addition, speed enhancement solution has been proposed,with help of color spaces and classification, enabling a speed increment of 59%, this with minimal

5.4. CONCLUSION 95
quality loss. Therefore, the DFI method has one of the best tradeoff between quality and complexity,and in this sense fulfill our objectives.
Then we focused on the quadtree structures, to extract some pseudo semantic content. Inthe Interleaved S+P codec case, this quadtree is very light to encode and does not contain muchinformation, but is transmitted prior to anything else for a minimal cost. The ultimate goal of suchsemantic extraction is to enable content dependent processing without other knowledge than thequadtree structure itself.
In order to extract semantic directly from the quadtree structure, several methods have beendeveloped that give different types of information. In order to be able to extract semantic at objectlevel, a kind of blind region segmentation method has been developed that only uses the quadtreestructure. This segmentation is labeled as ”blind” because there is no color information about theimage. This method does not give one region per object but ensures that an object is representedby a set of regions. Even if raw results in terms of region representation are not competitive withother segmentation method, mainly because of oversegmentation, yet we proved the ability of thequadtree structure to represent by itself the image content.
Finally, a RAG-based multiresolution segmentation has been designed. Coupled with any hierar-chical segmentation process, the proposed solution is highly scalable while remaining efficient bothin terms of computational complexity and in terms of region representation quality.
From these generic tools, dedicated algorithms could benefit from them. In particular, followingchapters address two different potential application context, namely pseudo-semantic video codecsas well as vision robotics.

96 CHAPTER 5. GENERIC ANALYSIS TOOLS

Chapter 6
Pseudo-semantic representation ofvideos: joint analysis and coding tools
Previous chapter was dedicated to generic analysis tools. In particular, quadtree-based segmentationprocesses, addressing different objectives, were presented. These methods can be coupled to anyother method aiming at automatically analyzing the image content.
When considering video coding, the ability to locally describe the geometrical contents appearsto be an essential feature so that to take advantage of the inherent redundancies. Indeed, most ofthe time, image sequences account for the evolution of a scene across time. As a consequence, eachimage can be interpreted as a deformed version of its predecessor in the sequence. For this reason,the largest part of the redundancies is located along the temporal axis and should be further studied.
The image content can be thus described by different levels of semantical meaning. If object-based extraction solutions integrate high level of semantical information, such as whole object shape,intermediate tools aim at obtaining a coherent representation in terms of texture, motion, coloror any combination of this typical features. As they do not rely on any side information, theseintermediate representations can be qualified as pseudo-semantical methods, as they tend to fit tothe image content. In this context, disruptive approaches, relying on local cues analysis, can lead topseudo-semantic video representation, able to exhibit the video content.
Three different pseudo-semantic representations of videos are proposed in this chapter. If theyinitially address coding issues, the resulting video representations can be used by itself to reach highersemantically consistent representation.
In section 6.1, a RAG-based video segmentation process is described. The main innovation reliesin the ability to exhibit the persistence of the regions along a given sequence. This video segmentationcan be used as a first step for object recognition, tracking, classification etc. It relies on a quadtreebased segmentation representation, fully compliant with the ones presented in chapter 5.
Section 6.2 investigates the viability of an alternative representation that embeds features ofboth classical and disruptive approaches. Its goal is to exhibit the temporal persistence of thetextural information, through a time-continuous description. However, it still relies on blocks, mostlyresponsible for the popularity of the classical approach. Instead of re-initializing the description ateach frame, it is proposed to track the evolution of initial blocks taken from a reference image. Ablock, and its trajectory across time and space, is called a motion tube. An image sequence is theninterpreted as a set of motion tubes.
97

98CHAPTER 6. PSEUDO-SEMANTIC REPRESENTATION OF VIDEOS: JOINT
ANALYSIS AND CODING TOOLS
In between the two previous solutions, an image analysis/synthesis framework, designed for videocoding, combines the region segmentation and characterization tools together with texture synthe-sizers (section 6.3). Thus, it aims at improving the coding efficiency for textured regions in imagesand videos. The basic assumption is based on the human visual system properties, which preferssynthesized details to flat color, even if the output surface is not exactly the source texture. In thiswork, texture synthesis algorithms from the literature are adapted in order to fit the coding context.In particular, the idea is to fill textures which are not entirely transmitted.
6.1 Consistent spatio-temporal region representation
Defined as second generation coder, region-based approach tends to link digital systems and humanperception. This type of approach provides advanced functionalities such that scalable video coding[130][122], Region of Interest (ROI) coding, video object tracking [28] and content manipulation[168]. Despite the benefits of region-based solution, actual standards MPEG4-AVC [70] and SVC[84][207] and even HEVC [208] are always based on traditional hybrid coding scheme. Principalobstacles to the content-based system evolution are
• the high amount of side data required to described region boundaries,• the high complexity of segmentation algorithms.
As an example, the SESAME coder that achieves a rate-distortion (RD) optimization on a multiscaleframe representation and explicitly encodes the resulting segmentation partition [123, 168]. Alter-native solutions attempt to not transmit the region partition coding while only considering decodedinformation in the segmentation process. For example, [215] presents a symmetric-complexity codingsystem where both coder and decoder compute a motion segmentation in a video coding context.Unadapted for low bit-rate, this solution produces unacceptable region description especially uponcontours.
During his partial PhD work (he did not wish to end and defend his thesis work), Erwan Flecherhas designed a content-based color image sequence coding system. Principal improvement of thiscoder called LAR video relies on a temporal multi-scale representation of the video content that is notexplicitly transmitted to the decoder. A hierarchical segmentation aims to efficiently compress bothcolor components and motion information by region levels. Restricted to the Flat layer encoding, theLAR video can be seen as a natural extension of the LAR region based color image representation(see section 2.2.3) [55].
6.1.1 Region-based image sequence coding: framework
The proposed color image sequence coding system is based on Intra (I) and Predictive (P) framecompression where only the Flat layer is considered. On the one hand, luminance I-frames areefficiently compressed with the Flat Interleaved S+P coder (intra prediction mode). On the otherhand, inter prediction mode that uses temporal redundancy between consecutive frames has beendeveloped to compress luminance P-frames. LAR video coder takes advantage of on the multi-scalerepresentation of the frame content that is presented both at coder and decoder (section 2.2.3). Thisallows the encoding of chromatic components and the definition of a region-based representation ofthe motion information (figure 6.1).

6.1. CONSISTENT SPATIO-TEMPORAL REGION REPRESENTATION 99
+ -
++
Postprocess
Q
Q-1
Partitioning &modelisation
Spatio-temporalsegmentation
Motioncompensation
Z-1Z-1
-
++
Q
Q-1
+
Intraprediction
Partition QT
Y block residues
U & V region residues
Image Y (T)
Forward motionestimation
Control bits
Decoded imageYUV (T)
Z-1
Image Y (T-1)
Region-based motionvectors
Image UV (T)
Blo
ck levelR
egio
n level
Figure 6.1: Region based video coding framework
The principle of the low complexity coder can be described with three sequential steps as schemat-ically shown on figure 6.2:
Step 1 Luminance block image is compressed using inter/intra prediction modes and region-basedmotion compensation (figure 6.2.a),
Step 2 Considering Y-block image and chromatic control, multi-scale spatial segmentation forregion-based chromatic components representation is performed (figure 6.2.b). It allows colorimage compression at region level and non-explicit definition of Partition Tree PTN
s ,Step 3 Using motion feature, a hierarchical spatio-temporal segmentation is derivated of PTN
s bysplit/merge process. It provides a compressed region-based description of motion betweenframes (figure 6.2.c).
As a consequence, for each frame, the bitstream includes block size information from the quadtreerepresentation, quantized prediction errors of the Y-block image and region-based Cr/Cb data, pre-diction errors of region-based motion vectors and side information such as chromatic control bits andmotion split/merge related data.
6.1.1.1 Luminance block image prediction and coding
In the LAR video coder, partition is directly computed on the current frame in order to provide theluminance block image previously described. Inter/intra prediction modes and quantization step arethen used to reduce the bit-rate of the Y-block image. For P-frames, previous decoded frame isprojected on the current quadtree partition using region-based motion vectors. Consequently, threetypes of blocks (defined in the current quadtree partition) result from the compensation step (seefigure 6.3): blocks with only one projected value, blocks with multiple projected values (overlappedblocks) and blocks with zero projected value (uncovered blocks ot I frames). In two first cases,mean value is computed and is used as block prediction. High prediction errors (included overlapped

100CHAPTER 6. PSEUDO-SEMANTIC REPRESENTATION OF VIDEOS: JOINT
ANALYSIS AND CODING TOOLS
Spatio-temporalsegmentation
Y Flat image
Region-based motionvectors
Spatialsegmentation
Flat coderIntra/Inter
Chromaticregion coder
Motion coder
++ +-
UV regionImage
UV blockImage
U & V region residuesY block
residues
Spatial partition tree
Spatio-temporal
partition tree
a b c
Figure 6.2: Simplified region based video coding framework
blocks) are classically located on moving object boundaries especially when region-based motioncompensation is operated. DFD energy is thus mainly concentrated on small blocks which areefficiently compressed with a block-size adapted quantization. In last case, blocks are predicted inintra mode with the same edge-based predictor that is used for still image encoding.
6.1.1.2 Hierarchical spatio-temporal segmentation
Once Y-block image has been compressed and transmitted to the decoder, spatial segmentation thatonly considers information of the current frame is processed independently for I and P-frames. Aregion-based motion compensation has been considered for P-frame encoding. Indeed, a region-basedmotion estimation/compensation provides better performances that classical block-based approachesespecially upon moving contours. As a consequence, spatio-temporal segmentation aims to providea multi-scale representation in which defined regions respect spatial and temporal homogeneities.They thus naturally share common features such as gray level, color and motion. Figure 6.4 givesa basic description of the spatio-temporal segmentation and motion encoding. Considering that thePartition Tree PTN
s is known at the decoder, the aim is to define a new Partition Tree PTNst based
on the spatio-temporal segmentation. Sequential splitting and merging steps are realized in order todecompose regions with non-homogeneous motion and to group regions with spatial and temporalsimilarities. Information associated to motion-based splitting/merging is transmitted because thedecoder does not know region-based motion parameters. Note that PTN
st describes a research-spaceadapted to Rate/Distortion optimization thanks to the inherent indexed hierarchy [130].
To describe region-based motions, in our experiments, a translational motion model has beenused. Low complex parameter computation and efficient parameter prediction have motivated thechoice of this model. In order to take into account motion information, a well-known fast and variableblock-size motion estimator called EPZS (Enhanced Predictive Zonal Search) [192] is initially usedto compute the forward motion vector of each region (or block) of the partition. Motion estimationon supports with inconsistency size (classically 2 × 2 block-size) are not estimated but result from

6.1. CONSISTENT SPATIO-TEMPORAL REGION REPRESENTATION 101
Quatree partition
Block image (T-1)
Blo
ck level
Motion(T-1) => T
Estimated block image (T)
Partially compensated
Compensated by single value
Compensated by multiple values
Noncompensated
Reg
ion
level
Block classifica-tion (T)
Block image (T)
Temporal block estimation
R1
R6
R7
R2
Figure 6.3: Motion compensation and quadtree partitioning
Motion estimation
Motion vectorfield smoothing
Tree split and merge
Image Y (T+1)
Image Y (T)
Z-1
Spatio-temporal segmentation (T)
Spatial segmentation (T)
Quadtree partitionP[16,..,4](T)
Motion vector field smooth field
Figure 6.4: Spatio-temporal segmentation process: motion and spatial compliant hierarchy

102CHAPTER 6. PSEUDO-SEMANTIC REPRESENTATION OF VIDEOS: JOINT
ANALYSIS AND CODING TOOLS
Quadtree partition (T)
Region basedmotion
Motioncompensation Z-1
Partitionreconstruction
Merging processpass 1
Similarity criterion
Intra/Inter blocksdetection
Overlapping rate
estimation
Intra blocks
Partition tree (T)
compensated label image (T-1)
Compensatedpartition tree (T-1)
Level ofhierarchy
Merging processpass 2
Partial partition tree
Figure 6.5: Spatio-temporal segmentation process: motion and spatial compliant hierarchy
(a) Quadtree partition (b) Decoded image +post-processing
(c) Segmentation with120 regions
1 2
8
10
24
28
32
74
81 82 83 84
7 23
25
61
76 79
3
11
14
17
19
54
4 22
58
59
60
69 70 72 73
5 64 65
6 66
75
78 26 77 27
85
86
9
12
13
15
16
31 33
87 88
29 30 80
34 35 36
38 39
40 42
89
92
41
46
49 53
94 95 97
99
111119
37
43
20
48
50 51 98102103
105106
93
18104
107117120118
55110114
116
21 67 68
62 63
90
47
91
44 45
57
96
100 101
108109
115 52113 56
71
112
(d) RAG
Figure 6.6: From a moving patch of texture towards the motion tube
an interpolation process. Finally, once a level of the hierarchical spatio-temporal segmentation hasbeen selecting, motion vectors associated to the regions are transmitted.
6.1.1.3 Temporal consistency of region representation
To obtain a consistent region based video representation, different tools have been adapted to ourframework. Based on a two-step merging process, labelling consistency is preserved so that to insurea temporally stable representation. As shown on figure 6.5, previous partition tree is projected ontoquadtree of the current frame. Then, depending on the quality of block motion compensation, thelabel of the previous region representation is affected to the current block or not. The next steponly considers the well-preserved blocks and applies a dedicated segmentation step. As for it, thesecond segmentation pass processes the remained blocks thus providing a complete multi-scale regionrepresentation.
6.1.2 Results and discussion
In this section, some visual results are described. Resulting from the Foreman CIF encoding with abit-rate of 350kbit/s, figure 6.6b shows the decoded P-frame 50 with a PNSR equal 29/36/36 dBfor respectively Y/Cr/Cb components (4:2:0). The luminance is encoded with the Flat InterleavedS+P (inter/intra mode) as shown in section 6.1.1.1 and the chromatic component representation(120 regions) can be described with the region adjacency graph (RAG) presented by the figure 6.6d.

6.2. MOTION TUBES REPRESENTATION FOR IMAGE SEQUENCES 103
Figure 6.7: Temporal consistency of regions: illustration on football sequence. First row showsthe original sequence, second raw the associated region representation, third row illustrates regionlabeling
Though compression results remains lower than the standard MPEG4-AVC, offered functionalities bythis multi-scale representation with a controlled coding cost are very interesting.
The temporal consistency of the representation is illustrated by figure 6.7. The third row ofimages shows ellipses that correspond to regions obtained by the framework. The ellipse centersmatch the centroıd locations of each region, and their size is proportional to the size of consideredregions. This figure illustrated the consistency as the region labels remain persistent throughout thesequence.
Classically, region-based video coder does not provide competitive solutions regarding the lonebitrate. In particular, the forward motion estimation, required in case of region based motion de-scription, drastically lower the coding efficiency. However, we demonstrate here the ability of theframework to both provide a temporally consistent region representation allowing region match-ing/tracking together with a contained complexity. Considering non-explicit Partition Tree encoding,the proposed framework provides a solution able to provide multi-scale content representation andthus enabling advanced functionality such as ROI coding and video object tracking.
To match coding efficiency requirements, region-based solutions are then not relevant. To al-leviate this issue, joint block-based and texture-based solutions have been designed. The followingsection presents an innovative motion tube representation.
6.2 Motion tubes representation for image sequences
While looking at a sequence of natural images, one can see that a texture is likely to be found inseveral consecutive frames. Indeed, the textural information is carried by the objects of the sceneand its the background: both objects and background are most often persistent through the time.

104CHAPTER 6. PSEUDO-SEMANTIC REPRESENTATION OF VIDEOS: JOINT
ANALYSIS AND CODING TOOLS
time
Figure 6.8: Temporal persistence of textures in image sequences
However, due to camera motion and object displacement, any texture may follow a given trajectoryand may undergo a certain deformation (translation, resizing, rotation, warping) as shown on figure6.8.
As a consequence, any sequence of images can generally be considered as a set of moving patchesof texture, with respect to a given set of trajectories and deformations. From that perspective, it isreasonable to represent a sequence of images as such, assuming that it is possible to get a correctset of patches along with their trajectories and deformations parameters. Some textures, however,cannot be handled by such an approach: particle objects, liquids and transparencies, to cite a few ofthem, present such major changes of texture that it might be impossible to track their evolution overtime without any specific approach. The current work focuses on sequences which do not presentsuch delicate textures, which will be processed as for them in section 6.3, and aims at finding a setof patches of texture to represent such sequences.
It appears that an ideal compression system might be obtained by locally decorrelating the spatialcontents, and globally processing the information along the temporal axis. In practice, this can beobtained by continuously tracking local areas of an image sequence across time. Putting aside thetraditional frame-macroblock paradigm, it is proposed to see image sequences as a collection ofspatio-temporal units which deform and move across time and space. These structures are calledmotion tubes, and are described in this section.
This work is the result of a collaboration with Stephane Pateux and Nathalie Cammas (OrangeLabs), who co-supervised Matthieu Urvoy during his PhD work [196][195].
6.2.1 Modeling a motion tube
As depicted on figure 6.9, the successive shapes of a moving texture patch reminds a tube whosesection is deforming. From now on, moving patches of textures will be referred to as motion tubes.Such motion tubes will be able to track moving texture across time and space, thus exploiting theirtemporal persistence.

6.2. MOTION TUBES REPRESENTATION FOR IMAGE SEQUENCES 105
time
(a) A moving patch of texture
time
(b) A crude representation of a motion tube
Figure 6.9: From a moving patch of texture towards the motion tube
timet+1
t
t-1
t-2
T (t)MT
G(t)Ω (t)MT
wt-1 t
Figure 6.10: Trajectory and deformation of a motion tube
Tubes definition. LetMT be a motion tube attempting to describe a patch of texture along withits evolution across time and space, through a sequence of images. MT will be characterized by 3types of information: its texture T , its lifespan L, and its deformation parameters W leading to
MT = T ,L,W . (6.1)
Deformation model. In order to cope with texture displacements and deformations, an appropriatedeformation model has to be set up. The deformation of a texture may be described as the result ofa transform whose transfer function is a warping operator w.
Trajectory. The notion of trajectory is crucial to the notion of motion tubes. Indeed, the temporalpersistence of textures will be captured only if motion tubes naturally exhibit a deformation alonga trajectory T (t). A luminance sample P of the patch of texture, due to the displacement and thedeformation of the texture, will follow a trajectory TP(t). The trajectory TMT (t) of a motion tubewill be given by the trajectory of the center of gravity GMT (t) of the patch at each time instant t.Figure 6.10 illustrates this principle.

106CHAPTER 6. PSEUDO-SEMANTIC REPRESENTATION OF VIDEOS: JOINT
ANALYSIS AND CODING TOOLS
time
1 23 4
5
t0
t1
t2t3 t4
Figure 6.11: An image sequence partially reconstructed from a few motion tubes
6.2.2 Video representation based on motion tubes
Figure 6.11 illustrates a motion tube based representation. Five tubes have been initialized atttstart = t2, and their textures have been tracked from t0 to t4. Assuming the motion field is uniformon areas reconstructed by motion tubes 1, 2 and 3, we can see that they are kept together throughthe whole GOP. Tube 4, on the other hand, behaves differently to map a discontinuity of the motionfield. Tubes 1, 2, 3 and 4 share the same start (ttstart = t0) and end (ttend = t4) instants, and theirlifespan L is [t0, t4]. Finally, tube 5 does not appear at t0 nor t4 because the texture it carries is notpresent at those instants: its lifespan is then [t1, t3].
This being said, the main problem of this representation comes down to find a right set of motiontubes. Let It be an image from the sequence SI at time instant t. While the existence of a matchingset of motion tubes S can be easily assumed, there is no uniqueness for such a representation.
6.2.2.1 Motion tubes families
A motion tube is driven by a large set of parameters (lifespan, shape, trajectory, texture, . . . ). Inpractice, its optimization may prove to be a difficult task. In order to simplify this problem, it isproposed to create groups of motion tubes which, for now, will share the same temporal parameters.These groups are called families of motion tubes.
A sequence of images represents a scene within which, due to camera motion or objects displace-ments, background may change and objects may appear or disappear. Likewise, the availability ofthe textures will also vary across time. A family of motion tubes sources the textural informationfrom a common reference instant. As a consequence, it will not be able to register the entire texturalinformation: a single family cannot entirely represent a complex sequence.
Therefore, several families of motion tubes will be required to provide an appropriate representa-tion. These families may overlap temporally and/or spatially. A convenient way to instantiate severalmotion tube families is to split the sequence into GOP and create a family for each of them. Eachfamily is initialized at the GOP start instant. This particular solution is illustrated in figure 6.12using GOP of 8 time instants. The first GOP is reconstructed with the red family FMT (t0) whosetubes end at t8, the second GOP by the blue family FMT (t8) whose tubes end at t16, and the thirdGOP is reconstructed by the green family FMT (t16) which ends at t24. Typically, camera motionand objects displacement may force us to create several families within the same GOP.

6.2. MOTION TUBES REPRESENTATION FOR IMAGE SEQUENCES 107
time
t0
t8
t16t24
F (t ) : GOP (0,8)0MTF (t ) : GOP (8,16)8MTF (t ) : GOP (16,24)16MT
Figure 6.12: GOP paradigm in the context of motion tubes
time
t0
t1
tt8
2
Multi-connectedareas
Unconnectedareas
Figure 6.13: Preliminary example of motion tube based reconstruction - Connected and unconnectedtubes
6.2.2.2 Motion tubes video representation properties
Motion tubes, by their nature, can benefit from the temporal persistence of moving textures: theirtracking is then simplified. In particular, the motion estimation of a motion tube, at a given instant,can be guided by its trajectory at previous or next instants. This tends to reduce the discrepancies ofthe motion field, and the relative motion coding cost. It also maximizes the tube’s lifespan, due to anenhanced tracking, thus minimizing the amount of textural information to be sent. Furthermore, asmotion tubes can start and end at any time instant, they fit appropriately the instants of apparitionand disappearance of the tracked textures. They can be either dependent or independent fromeach other (neighbouring motion tubes undergo the same changes), connected or disconnected(neighbouring motion tubes may be joint or disjoint). Keeping motion tubes connected will constraintthe motion field to be continuous, while disconnections will be able to represent the ruptures of themotion field.
Sole motion tubes might not be able to entirely represent a sequence of images. In that, theymay be seen as a synthetic representation. In particular, complex scenes on which the tracking oftextures is difficult or even impossible won’t be entirely reconstructed by any reasonable set of motiontubes. In figure 6.13, unconnected areas correspond to areas which are not reconstructed by anymotion tube. Dedicated mechanism will then need to be proposed to handle these areas (e.g. withinpainting).

108CHAPTER 6. PSEUDO-SEMANTIC REPRESENTATION OF VIDEOS: JOINT
ANALYSIS AND CODING TOOLS
6.2.3 Motion model of a tube
Among pattern-based models, block-based and mesh-based models are very popular in video compres-sion applications. Historically, however, blocks are generally preferred to meshes as they are used instandardized video compression schemes. Yet, numerous techniques employing blocks and/or mesheshave been provided. An advanced study of these techniques has been realized in [195] considering ourcontext. The ability of several models have been studied, in particular Block Matching Compensa-tion algorithms (BMC) [190][87], Overlapped Block Motion Compensation (OBMC) [136][140][33],Control Grid Interpolation (CGI) [186] and a few hybridized variants such as Switched Control GridInterpolation (SCGI) [76], Switched OBMC (SOBMC) [77].
If hybrid CGI-based approaches generally provide the best abilities regarding motion representa-tion, they do not fulfill our complexity requirements. As a consequence, SOBMC provides the besttrade-off between modeling abilities and complexity and is considered as the basement of our pro-posed motion model. However, the SOBMC has been only used to model the deformation betweena couple of images, and does not provide (unlike active meshes, for instance), an intrinsic ability todescribe the deformation of a whole GOP in a continuous manner. As a consequence, the providedmotion model will extend the abilities of the SOBMC to account for the spatio-temporal nature ofthe motion tubes.
6.2.3.1 In between blocks and meshes: a modified Switched OBMC motion model
In order to represent a wide enough variety of deformations, the motion of each motion tube MTis described through four motion vectors. To each corner of the quadrilateral patch of texture beingtracked is associated a motion vector which describes its displacement in regards to its initial position
in the reference image. At time instant tn,−→dTL(tn),
−−→dTR(tn),
−→dBL(tn) and
−−→dBR(tn) respectively stand
for the displacement of the top-left, top-right, bottom-left and bottom-right corners of ΩMT (tn).
ddBL
dTL dTR
BR
(a) Initial block of textureΩMT (tref)
ddBL
dTL dTR
BR
(b) Idealistic forward CGIwarping
ddBL
dTL dTR
BR
BTLMT
BTRMT
BBLMT
BBRMT
(c) OBMC-like warping ap-proximation
Figure 6.14: Forward motion compensation of a motion tube: in between OBMC and CGI
The proposed deformation model is illustrated in figure 6.14. Figure 6.14a shows the initial blockof texture sourced from I0 along with its motion vectors. As each motion vector describes the localdisplacement of a single corner, the proposed model can be compared to the CGI, wherein all fourcorners are behaving as control points: the original square block can then be seen as a mesh whosedeformations motion compensate the corresponding patch of texture (figure 6.14b).

6.2. MOTION TUBES REPRESENTATION FOR IMAGE SEQUENCES 109
6.2.3.2 OTMC: connected/disconnected motion tubes
Connected motion tubes. In order to provide a continuous representation of the motion field, itis crucial for the motion tubes to be able to remain connected to each other, and for their motionmodel, to handle corresponding deformations (warpings). Let X be the current motion tube. Let A,B and C be respectively the top-left, top, and left causal neighbours of X. It is assumed that theirdeformation has been previously estimated.
dBL dBR
A B
C
=dBRB
=dBRC
X
dTR
d = TLdBL
B dTRC
2+
(a) Full-connected OTMC
dBR
A B
C
dTL =dBRB=dBL
B
X
dTR
dBL =dBR dTL dTR+ -
(b) Top-connected OTMC
dBL dBR
A B
C
dTL=dTRC
=dBRC
X
dTR =dBR dTL dBL+ -
(c) Left-connected OTMC
Figure 6.15: Idealistic representation of the deformation for the three connected modes
The proposed OTMC model keeps X’s corners connected to those of its causal neighbours. Inpractice, vertical and horizontal connection directions are only considered. Figure 6.15 illustrates theOTMC motion model. In order to keep the schematics as simple as possible, the deformations arerepresented as idealistic CGI warpings. Three connection modes are provided: full-connected OTMCmode, top-connected OTMC mode and left-connected OTMC mode.
TMC: disconnected motion tubes in translation. Despite its crudeness, the translational BMCmotion model proved to be quite efficient in classical approaches to motion compensation, in termsof compression. In particular, its ability to compactly represent the discontinuities of the motionfield have been largely appreciated. Similarly, it is crucial for the motion tubes to be able to simplytranslate, regardless to the deformation of neighbouring patches of textures. In such case, a single
motion vector (in practice,−−→dBR) is used to describe the translation undergone by the motion tube.
Such a motion model is baptized TMC and requires then a single translational projection to beperformed.
Hybridizing TMC and OTMC motion models into a Switched OTMC model Similarly to theSOBMC and other hybrid block-mesh approaches, the final motion model hybridizes the differentmotion modes previously introduced. Four connection modes are now available: full connection,left connection, right connection and disconnection. The different motion modes can be hybrized invarious ways to accurately represent the local variations of the motion field. Figure 6.16 illustratestheir hybridization with several connection patterns which may appear.
With TMC and OTMC motion modes, neighbouring motion tubes can be either fully connected,or completely disconnected. At some point, however, it may be interesting to partially connect amotion tube to only one of its neighbours. As a solution, two intermediate motion modes lying inbetween the disconnected TMC and the connected OTMC motion modes are proposed:

110CHAPTER 6. PSEUDO-SEMANTIC REPRESENTATION OF VIDEOS: JOINT
ANALYSIS AND CODING TOOLS
ddBL
dTLdTR
BR
A B
CX
(a) A, B and C: OTMC;X: TMC
dBL
dTR
dBR
A B
C
dTL
X
(b) A and X: OTMC; Band C: TMC
dBL
dTR
dBR
A B
C
dTL
X
(c) A: OTMC; B and C:TMC; X: top OTMC
dBL dBR
A B
C
=d +BR
=dBRC
X
dTRd = TL dTRC
d - TL dBL
(d) A and C: OTMC; Band X: left OTMC
Figure 6.16: Various hybridizations of the different motion models
• the Top OTMC motion mode keeps the current motion tube X connected to its top neighbourB (figure 6.16c);• the Left OTMC motion mode keeps the current motion tube X connected to its left neighbour
C (figure 6.16d).
6.2.3.3 Regularizing the motion discrepancies: Locally-Adaptive OTMC
While OTMC provides the ability to connect neighbouring motion tubes, it represents the defor-mations in a very crude way: indeed, any geometric shape is reduced to a set of four overlappingblocks BX
TL, BXTR, BX
BL and BXBR. This crude representation may not be appropriate to any kind
of deformations, in particular in case of large deformations. This results into motion discrepancieswhich could be avoided with a finer motion model.
As a solution, it is proposed to recursively split these four blocks into sub-blocks. Their dis-placements are interpolated from the four original motion vectors. This process is iterated until therepresentation of the deformation is accurate enough. Such a motion compensation process is calledLAOTMC, and is illustrated in figure 6.17.
The decision whether to split or not to split a (sub-)block relies on its four displacement dif-ference between consecutive corners. If all the differences are under a coherence threshold δTh, thepartitioning operation is not required, and the (sub-)block can be directly motion compensated.
dBL
dTLdTR
dBR
(a) Initial OBMC blocks
dBL
dTLdTR
dBR
(b) First level partitioning
dBL
dTLdTR
dBR
(c) Second level partitioning
Figure 6.17: LAOTMC motion mode: automatic recursive partitioning of a motion tube
As can be seen from figure 6.17, the accuracy of the deformation representation is locally adaptedto the nature of the motion field. In particular, it can be seen from figure 6.17c that the shape’s

6.2. MOTION TUBES REPRESENTATION FOR IMAGE SEQUENCES 111
approximation is much more closer to the idealistic shape (represented by the dashed quadrilateral)than its initial crude approximation was. Using the LAOTMC, a larger set of deformations can bethen handled.
6.2.3.4 Motion modes: compared performances
Disconnected TMC versus connected OTMC. In [195], it has been shown that TMC motionmode provides a significantly better PSNR on reconstructed areas (SPSNR metric) than the OTMCdoes. On the other hand, the OTMC is able to reconstruct a larger proportion of the images. This iseasily explained by the fact that the OTMC motion mode is not able to represent the discontinuitiesof the motion field, and cannot catch up with areas corresponding to moving objects boundaries.However, forcing the motion tubes to be connected to each other limits the amount of unpredictedareas. As for it, figure 6.18 shows the motion compensation prediction of the third frame I2 ofsequence Foreman whether TMC or OTMC motion modes are used. Compared to the TMC, theOTMC does increase the amount of reconstructed areas, while lowering the overall quality of thecompensation. In particular, distorted edges can be observed.
(a) Original frame (b) TMC - SPSNR= 32.55 dB, Rec.rate= 91.10%
(c) OTMC - SPSNR= 29.80 dB,Rec. rate= 99.03%
Figure 6.18: TMC versus OTMC motion modes: influence on the synthesized images
How hybridizing the different motion model does improve the motion compensation. Whilethe efficiency of the OTMC in regards to the TMC is arguable, their hybridization undoubtedly endsup in an improved motion compensation. They all provide PSNR higher than the reference score ofthe TMC. Hybrid scenarios, however, do not provide a reconstruction rate as high as the sole use ofthe OTMC does. In the end, hybridizing all four motion modes respectively increases both PSNRand reconstruction rates by 1.82 dB and 2% in average. Figure 6.19 shows the motion compensationprediction of the third frame I2 of sequence Foreman obtained with three hybrid scenarios. The fullOTMC motion mode is advantageously used in areas which contain few edges. On the contrary,edgy areas are most often handled by partially disconnected (top and left OTMC) or disconnected(TMC) modes. If all four motion modes are enabled, the selected motion models roughly divide upinto: 40% of TMC, 30% of full OTMC, 15% of left OTMC and 15% of top OTMC as well.

112CHAPTER 6. PSEUDO-SEMANTIC REPRESENTATION OF VIDEOS: JOINT
ANALYSIS AND CODING TOOLS
(a) Reconstruction of I2 using fullOTMC, left OTMC and top OTMCmodesSPSNR= 32.93 dB, Rec. rate=96.91%
(b) Reconstruction of I2 using TMCand full OTMC modesSPSNR= 33.47 dB, Rec. rate=95.78%
(c) Reconstruction of I2 usingTMC, full OTMC, left OTMC andtop OTMC modesSPSNR= 33.96 dB, Rec. rate=95.44%
Figure 6.19: Hybridization of the four motion modes: influence on the synthesized images
6.2.4 Time-evolving representation of the textures
The evolution of a patch of texture across time is not only defined by its displacement and defor-mation, but also by its intrinsic textural changes. Towards an accurate time-evolving representationof the textures, it is proposed to source the textural information from several reference images. Insuch case, the final texture results from a weighted average of several temporally-aligned patchesof textures. Motion tubes benefiting from several texture reference instants are called bi-predictivetubes, or shortly, B-tubes. Let I0, . . . , I8 be a GOP of GS = 9 consecutive images. From now on,it is assumed that two reference images Iref0 and Iref1 are available. Typically, these can be locatedat the extremities of the GOP, such that Iref0 = I0 and Iref1 = I8.
B-tubes definition. B-tubes source their textural information from more than one reference in-stants. In this way, existing video compression schemes based on Analysis-Synthesis frameworksimilarly use several reference instants to synthesize the images [188, 198, 29, 103]. All these videocompression schemes, however, suffer from resolution losses, as they use a single reference instant inthe end: textures from the many different reference instants are first projected on a main referenceinstant; the different contributions are then merged and projected into the current instant to obtainthe final synthesized image. As textures undergo two successive motion compensations, projectedtextures often suffer from resolution losses. Motion tubes, however, do not suffer from this problem,as there is no main reference instant. Textures are in our case motion compensated a single timeonly, which reduces the risks of resolution losses, as motion tubes warping operators could be easilycomposed and inverted, such that any image from any instant can be directly motion compensatedat any other time instant.
B-families. At this point, motion tubes mainly suffer from their inability to provide a complete re-construction of the images. Small and large holes were previously distinguished. Large reconstructionholes are especially problematic, as they generally correspond to textural areas which are unavailableat the reference instant. They can be the consequence of occlusions, camera motions, etc. As asolution, it is proposed to include additional motion tubes to describe these areas. Obviously, these

6.2. MOTION TUBES REPRESENTATION FOR IMAGE SEQUENCES 113
motion tubes need to be instantiated from a frame which actually contains the textures missingto the spatio-temporal representation. The concept of B-families of motion tubes has been thenintroduced, as an inter-tube bi-prediction mechanism.
Figure 6.20 shows how B-families of motion tubes drastically improve the representation. Topfigures show the output images, while bottom figures indicate which families of motion tubes havecontributed to the reconstruction: yellow for FMT (t0), blue for FMT (t8), green for a weightedaverage of FMT (t0) and FMT (t8), and finally magenta for FMT (t4). As could be expected, familyFMT (t0) mainly contributes to the reconstruction of the right half of the face of Foreman, whilefamily FMT (t8) mainly contributes to the reconstruction of its left half. Both of these familieshave been able to catch the deformation of the background, which is mostly synthesized from aweighted average of both contributions. Finally, the third family FMT (t4) nearly completes thereconstruction, by notably providing a large part of the mouth which was missing.
(a) FMT (t0)’s reconstruction SP-SNR= 35.79 dB, Rec. rate=86.81%
(b) 0FMT (t0, t8)’s reconstructionSPSNR= 36.52 dB, Rec. rate=96,26%
(c) 1FMT (t0, t4, t8)’s reconstruc-tion SPSNR= 36.24 dB, Rec. rate=99.29%
(d) Areas reconstructed byFMT (t0)
(e) Areas reconstructed by0FMT (t0, t8)
(f) Areas reconstructed by1FMT (t0, t4, t8)
Figure 6.20: B-families of motion tubes: influence on the synthesis of the fourth image of sequenceForeman
6.2.5 Representation and compression ability of motion tubes
Video coding: integration into AVC standard. All motion tubes were systematically trackedduring the whole duration of the GOP, whether the corresponding patches of textures could betracked or not. Occlusions, complex deformations, or any other phenomena preventing an initial

114CHAPTER 6. PSEUDO-SEMANTIC REPRESENTATION OF VIDEOS: JOINT
ANALYSIS AND CODING TOOLS
patch of texture from being tracked are especially problematic for the motion tubes. It is critical forthe representation to be able to detect their occurrences and, in that event, deactivate or terminatethe affected tubes.
In order to further validate the representation in regards to state-of-the-art coding tools, it wasfirst proposed to compare the reconstruction provided by the motion tubes with the reconstructionprovided by AVC compression standard. To this end, motion tubes were embedded into the JSVM.The decisions taken by the modified coder provided a large amount of invaluable informations re-garding the motion tubes and their abilities. A complete study can be found in [195]. Several keyfeatures were then highlighted:
• motion tubes were eventually used, in very significant proportions, by the modified coder. Thisfurther validates the concept of motion tubes: they are able to provide a proper representationof a large part of the sequences;
• as could be expected, the more stable and persistent the images contents are across time, themore suited are motion tubes. Complex areas from the sequences, however, were generallybetter matched by classical coding tools.
• in terms of pure compression, however, the proposed hybrid compression scheme does notprovide any gains; quite the contrary, actually. Still, the coding cost of the motion tubes canbe easily reduced by removing the motion information of unused tubes.
The integration of the motion tubes into AVC showed that a significant amount of the mac-roblocks could be favorably coded by the motion tubes. However, the coding cost of the motiontubes was not taken into account in the mode selection process, as the instantaneous coding cost ofa motion tube has little if no meaning. In the end, the gain in pure AVC bitrate dit not compensatefor the coding of the motion tubes. On the other hand, all motion tubes were transmitted, eventhough they were only partially or not selected at all by the modified coder. For this reason, it isessential for unused motion tubes to be discarded from the representation, thus reducing their codingcost. Compression performances may then turn in favor of the motion tubes.
Representation features. During his PhD work, Matthieu Urvoy has proved that motion tubes areactually viable candidates to the representation of image sequences. Reconstructed images showedthat, for a large proportion of the image sequences, motion tubes were able to properly synthesizethe textures from a minimal amount of textural information. Their integration to H.264/AVC furtherproved how much interesting motion tubes may be in regards to more classic representations. Asexpected, they also intrinsically exhibit the temporal persistence. In terms of representation, this turnsout to be an invaluable information regarding the spatio-temporal content of the image sequences,and may greatly facilitate its analysis. Even though initial patches of textures cannot be interpretedas semantic regions, their evolutions will submit to those of the objects they belong to. A videoobject may and its temporal evolution may then be interpreted as an arbitrary set of motion tubes.
Motion tubes were then designed in such a way that the proposed representation is not affectedby problems which are inherent to existing schemes. However, such a disruptive approach comes toa cost: the tube-based representation is not mature enough yet to be advocated for practical use forvideo coding purposes (e.g. as an answer to calls from normalization committees). Also, its abilityto compact image sequences needs to be significantly increased for it to be seriously considered as

6.3. ADAPTIVE IMAGE SYNTHESIS FOR VIDEO CODING 115
an alternative. Nevertheless, the pseudo-semantic representation ability of the motion tube can beseen as an innovative analysis tool.
6.3 Adaptive image synthesis for video coding
In state-of-the-art compression schemes, pixel-wise redundancy is reduced by using predictions andtransformed domain operations. However, classical spatio-temporal approaches, exploiting redun-dancy based on the mean squared error (MSE) criterion, are not able to take visual redundancy intoaccount. Detailed textures may seem nearly stationary for the Human Visual System, but totallyirregular according to MSE criterion. At the same time, texture synthesis algorithms [201, 6, 96, 95]have shown promising results. The purpose of new coding schemes is to detect regions where exactpositions of texture patterns are irrelevant for the human eye. The whole regions are not encodedsince a few patterns are sufficient enough to synthesize satisfactory regions.
The following framework has been proposed by Fabien Racape during his PhD work [151], thanksto a industrial collaboration with Edouard Francois, Dominique Thoreau and Jerome Vieron fromTechnicolor [152][153].
6.3.1 Motivation
One of the first synthesis-based compression scheme was presented in [48]. This approach includes ananalysis in order to detect replaceable textures which are finally synthesized by a dedicated texturesynthesis algorithm at decoder side. An interesting framework has been designed in [220] wheresome 8x8 blocks are removed at the encoder side and synthesized by the decoder. The segmentationfirst classifies blocks into structures, corresponding to boundaries of objects, and textures. Thefirst category is classically encoded and the latter is removed and synthesized at decoder. Thesegmentation is based on simple edge detector thresholding. To avoid temporal inconsistencies,motion estimation is considered in selecting patches which will be used for texture synthesis. Thelatter is performed using the algorithm presented in [96], which appeared hard to exploit in our tests,since 8x8 blocks offer poor overlap for the Graphcut technique.
The work presented in [134] proposes a closed-loop analysis-synthesis approach. As in [220],groups of pictures (GOP) are considered for a spatio-temporal scheme. Each potential region froma GOP is both analyzed and synthesized, using side information from texture analyzer. A firstsynthesizer is designed for Rigid textures with global motion, which has a great similarity to globalmotion compensation (GMC). Another synthesizer, inspired by the patch-based approach developedin [96], processes Non-rigid textures with local and global deformations. The scheme has recentlybeen upgraded [133] with photometric corrections, using Poisson editing and covariant cloning.However, Y. Liu [111] pointed out that synthesis algorithms work more efficiently with differentkinds of textures and addressed the specific case of near regular textures.
Another framework for image compression is proposed in [109] where both textural and structuralblocks can be removed at encoder side. The textures are synthesized at decoder using [96], whilea binary edge information helps an inpainting method to retrieve structural ones. To keep colorcoherency, a draught board of blocks is preserved, limiting the bit-rate saving. The problem of thesegradated regions is tackled in [213] with parameter assistant inpainting. However, several pixel-basedsynthesis algorithms from the literature [201, 6, 95] also provide promising visual performance for a

116CHAPTER 6. PSEUDO-SEMANTIC REPRESENTATION OF VIDEOS: JOINT
ANALYSIS AND CODING TOOLS
Input
TextureAnalyzer
Encoder Decoder
TextureSynthesizer
Encoder side Decoder side
Sideinforma-
tion
Bit-stream
Output
Texture map
Decoded parts
Figure 6.21: Framework overview.
large range of textures, until they get the right parameters depending on the patterns to synthesize.
An innovative framework using both complementary pixel-based and patch-based approaches hasbeen then realized. The scheme includes a texture characterization step, based on DCT-domaindescriptors, that outputs the approximated feature size of texture patterns to be synthesized. Thetwo following texture synthesis algorithms have inspired this work: the basic pixel-based approachdeveloped in [201] and the algorithm presented in [96] for the patch-based synthesis.
The proposed framework is depicted in figure 6.21. First, input images are analyzed to detecttextured regions that can be synthesized by the algorithm used at decoder side. Thus this partof the framework is divided into two main steps: a segmentation step and a characterization step.A resulting texture map is sent to the encoder and side information, describing texture patterns.Then, pointed out regions are partially removed, whereas structural regions are classically encoded.Removed regions are synthesized from neighboring small surfaces of texture, also classically encoded.In the following, the patches denote these samples of texture which serve as inputs for synthesis.At the decoder side, the bit-stream and potential side information to locate encoded regions areboth used to build and locate structural parts, whereas the labeled removed regions are synthesizedusing a new adaptive pixel-based algorithm. Like encoder side analysis, the synthesis contains acharacterization step, which outputs required parameters for texture algorithm.
6.3.2 Texture analysis
This section focuses on the analysis at the encoder side which aims at characterizing texture patternsand designing the removed regions and sample patches for synthesis. For validation purposes, thesegmentation has been performed by the region extraction scheme presented in section 2.2.3.
6.3.2.1 Texture characterization
This part of the scheme is used at both encoder and decoder sides. It outputs the parameters requiredby the texture synthesizer in order to give its best results. Thus, using characterization enables theencoder to decide whether the texture can be synthesized or not. Indeed, if the characterized texturerequires impossible parameters, for example too large patterns, it is finally classically encoded. Themain parameter for our pixel based algorithm corresponds to a size of neighborhood window. Thusthe characterization step computes descriptors from different sizes. The descriptors are derived fromthose described in [178] which are computed from the Fourier transform. Since the characterizationrequires little sizes of blocks, i.e. inferior to 32 pixels wide, descriptors from DCT domain have been

6.3. ADAPTIVE IMAGE SYNTHESIS FOR VIDEO CODING 117
DC
λ=1
λ=2
λ=3
Figure 6.22: Descriptor computed on a 4x4 DCT block.
θb
a
R L
g
h
Figure 6.23: Descriptor Integral on a discrete array.
chosen. Indeed, the Fourier transform outputs descriptors with a lower resolution in frequency, whichis a problem to describe a signal from a small window. Like in [178], descriptors are computed fromconcentric circles represented in figure 6.22.
The DC coefficient is not taken into account in order to be invariant to changes of averageluminance, so the descriptors vector has size of block minus one coefficient. A large set of blocksinside the texture region are randomly chosen to compute descriptors at different sizes centered atthe same position.
Since the scheme uses discrete transform, figure 6.23 depicts the integral computation on aparticular coefficient at position (i, j). The DCT value is weighted with the length L of the arc of acircle, crossing position (i, j) from a to b, given by L = R ∗ θ where
θ = arcsin
(√1− b2
R2
)− arcsin
( aR
). (6.2)
The average descriptors are then computed for each size and analyzed. According to [201] and ourexperiments, the size of the compared neighborhood has to be greater than the elementary patternof the texture, to produce a visually good result. The first coefficient of each block corresponds toa single variation of luminance over the block used for DCT computation. Experiments on a largeset of texture patches show that if the first coefficient is greater than any others in the descriptorsvector, the block size is smaller than an elementary pattern.
Thus, computing descriptors at random locations will serve to approximate the feature size oftexture patterns. Typically, descriptors of sizes from 4x4 up to 16x16 pixels are computed for eachlocation.
The next section describes the synthesis of the segmented regions, using parameters from texturecharacterization.
6.3.3 Texture patch design
Texture synthesizers from the literature process with a rectangular input patch. Its relevance isessential to ensure an efficient synthesis in this particular context. One notices that cropping a patch

118CHAPTER 6. PSEUDO-SEMANTIC REPRESENTATION OF VIDEOS: JOINT
ANALYSIS AND CODING TOOLS
(a) square patch (b) chosen patch
Figure 6.24: Texture patch design
(a) No anchor block (b) Synthesis of anempty region
(c) chosen patch (d) Anchor blocks loca-tion
Figure 6.25: Impact of anchor blocks to synthesized areas
close to the texture region to be synthesized can lead to inconsistencies between candidate pixelsand previously reconstructed borders. Figure 6.24a shows a case in which there is a variation ofluminance, leading to a failing synthesis. We propose to define the patch as the surrounding MBsof the region to be synthesized. This source patch for synthesis is depicted in figure 6.24b.
Large textured regions require anchor preserved blocks in order to prevent artefacts. After experi-ments, it has been decided to encode some anchor macroblocks (MB) at strategic locations depictedin figure 6.25 since the region size exceeds a fix number of MBs in width or height. Coupled witha confidence-based synthesis order described in next section, they prevent visible seams at synthesisjunctions.
6.3.4 Pixel-based texture synthesis
The pixel-based synthesizer derives from the basic scheme presented in [201]. This algorithm relieson the matching between current pixels’ neighborhood and those in a texture patch, using the Sumof Squares Error (SSE) as criterion. In order to improve the research process, the exact neighborhoodmatching described in [166] is used. The following describes the adaptation to the context of removedregions.
6.3.4.1 Adaptive neighborhood size using texture characterization
Texture characterization enables the synthesizer to get an approximate neighborhood. In order torefine the neighborhood sizes for matching, a set of neighborhood sizes are tested, for example 7x7and 9x9 if the best descriptor is 8x8 large. The chosen distance minimizes the norm distance
Dm,n(p, c) =
∑Nm,n
k=0 (pk − ck)2
Nm,n(6.3)

6.3. ADAPTIVE IMAGE SYNTHESIS FOR VIDEO CODING 119
Ω=(3,5);(4,7);(5,9)
Candidate 4 from short list
D (p ,c)
D (p ,c)
min(D (p,c))
p
p p
p
c
Patch
m,nΩ,i
i
4,7
5,9
3,5
D (p ,c)4
4
4
1
1
2
4
Figure 6.26: Finding best matching neighborhood.
1 1 1 1 11 1 1 1 11 11 11 1
000000
00
1 1 1 1 11 1 1 1 1
000000
00000000
1 1 1 1 11 1 1 1 111 11 1
000000
00
0.64 0.40 0.64 0.550.52
initialization update
Figure 6.27: Confidence map order. Confidences wa, wb and wc are computed for center pixels usingneighboring confidences. At initialization, wa = 0.64 for instance. After synthesizing pixel a, wb isupdated by assigning w1
a.
where Nm,n is the number of pixels contained in the neighborhood of current pixel, m and n respec-tively representing its height and width, ck and pk denote the kth pixel’s luminance in the currentneighborhood and the considered one in the patch respectively. Considering various neighborhoodsizes enables to better catch texture patterns size and shape. This process is illustrated in figure6.26 where three neighborhood sizes (3; 5)(4; 7)(5; 9) are competing. Experiments show that asynthesis with a lot of changes in neighborhood sizes does not give visually good results. In orderto avoid this kind of issue, we propose to favor the neighborhood sizes that have been chosen by amajority of previously synthesized pixels, by means of a global weight.
6.3.4.2 Confidence-based synthesis order
The goal is here to exploit available data which are, at this point, the only confident data. Thelatter corresponds to surrounding pixels, which are whether previously decoded or synthesized. Thus,raster scan order is clearly not adapted. As in [109], a scan order depending on a synthesis-coherentconfidence map is adopted. The map building law is depicted in figure 6.27, where initial computingfrom previously decoded pixels is represented on the left side and the map update during synthesison the right side.

120CHAPTER 6. PSEUDO-SEMANTIC REPRESENTATION OF VIDEOS: JOINT
ANALYSIS AND CODING TOOLS
Figure 6.28: Patch-based synthesis order
(a) a (b) b (c) c
Figure 6.29: a: The red hatched region is used to search the best matching patch. b: the chosenpatch is pasted on the new texture. c: the best cuts are found between overlapping regions
6.3.5 Patch based texture synthesis
The patch based method used can be decomposed into two main steps. The synthesis order, depictedin figure 6.28, is based on the confidence map. Each patch added to the output texture is chosenby comparing the already known parts, depicted in figure 6.29 a), with all the possible positions inthe input patch. The SSE criterion is then used to find the best matching area. That is, the patchsize is determined by previously described DCT-descriptors.
Most of the time, the added patch does not match exactly the already synthesized texture, thena second step consists on cutting the patch with the texture using a graphcut like method describedin [96]. Costs between overlapping patches is computed from the extended version in [96] usinggradients. Figure 6.29 presents a typical case due to surrounding blocks and synthesis order.
6.3.6 Comparing and switching algorithms strategy
smooth detailed
Figure 6.30: Texture spectrum for switching synthesizers

6.3. ADAPTIVE IMAGE SYNTHESIS FOR VIDEO CODING 121
One has now to determine whether to use patch- or pixel-based technique depending on textures’characteristics. Then an experimental classification of textures in our context is presented in figure6.30. Patch-based method provides good results with detailed textures but fails with smoother ones,creating edge artefacts. Reversely, pixel-based synthesis is well-adapted to smooth variations butfails when producing large detailed patterns. According to experimental results depicted in figures6.31 and 6.32, patch-based method seems to give good results on grass and trodden earth but failsto synthesize water or clouds where pixel-based method produces better results.
(a) original frame (b) Missing textures (c) Pixel-based (d) Patch-based
Figure 6.31: Results on the Coastguard sequence
(a) original frame (b) Missing textures (c) Pixel-based (d) Patch-based
Figure 6.32: Results on the Morocco Trial sequence
Since the patch-based approach produces visible artifacts when failing, an a posteriori methodis proposed. Three gradient-based criteria are proposed in order to quantify the amount of createdartifacts. ∆Gl denotes the gradient’s differences at cut locations between synthesized and originalimages, while ∆Gh and ∆Gv represent horizontal and vertical mean Sobel gradients’ differences,again between output and input textures. After experiments on a large set of textures, maximumthresholds 5; 5; 20 have been fixed for ∆Gh, ∆Gv and ∆Gl respectively to determine acceptablesynthesis. Gl characterizes the located seams to determine if the cuts are hidden enough, while Ghand Gv aim at pointing out such oriented edges, highly detectable by the Human Visual System, likein figure 6.33 c). As the texture is expected synthesizable by characterization step, the pixel-basedsynthesizer is chosen for high gradients.
The solution has been integrated to JM encoder [193]. Table 6.1 shows the coding performancesobtained on Container, Coastguard et Wool. QP values 10,15,20,25,30,35,40 allow to measurehow the removed regions impact the resulting bitrate.
6.3.7 Extension to video coding purposes
From this intra-frame compression framework using two kinds of texture synthesis, according to theirfavorite types of texture, an extension to image sequences has also been proposed in [151]. The idea

122CHAPTER 6. PSEUDO-SEMANTIC REPRESENTATION OF VIDEOS: JOINT
ANALYSIS AND CODING TOOLS
(a) (b) (c) (d)
Texture ∆Gh ∆Gv ∆Gl
a -0.3 -0.8 0.93b -3.5 -4.1 17.6c -12.3 11.1 28.7d -4.0 15.3 60.7
Figure 6.33: Resulting gradients for the 4 textures
QP 10 15 20 25 30 35 40
Sequences Bit-rate saving (%)
Coastguard CIF 21,8 22,4 20,7 20,3 19,7 19,5 18,9Container CIF 21,7 19,3 14,4 10,6 7,1 4,5 2,7
Wool SD 14,4 13,9 11,7 10,3 8,8 7,5 7,1
Table 6.1: Resulting bit-rate saving with respect to the Quantization parameter QP
is to propose a synthesis solution that takes account of both spatial and temporal context. To thisaim, both coding and synthesis modes should be carefully tuned so that to prevent from temporaldivergence. To insure consistency between synthesized frames and the other ones, non synthesizedframes, called reference frames, should be designed. Derived from GOP standard structures, wedefine GOPM (motion-oriented GOP) structures as a set of frames that are delimited by two referenceframes.
The global framework is shown in figure 6.34. Reference images are classically encoded throughMPEG-AVC scheme. For other frames, a temporal segmentation is first applied, so that to de-tect motion consistent regions. These regions will be encoded through adapted motion estima-tion/compensation methods. As for other regions, namely textured regions, they are processed bythe switch pixel/patch based synthesis framework presented in 6.3.4. The resulting bistream thencontains
• data related to macroblocks that are classically encoded,• parameters of synthesis algorithms of each synthesized region,• motion parameters for compensated regions (for affine motion, 6 parameters are required by
region),• information about location of synthesized or interpolated macroblocks.
Assessing the quality of decoded frames by such schemes, using objective methods, remainsproblematic. No satisfied solution has been until now found to assess synthesized textures withinvideo compression context. Here, results on bit-rate savings are presented with the assumption ofsimilar visual quality in order to tend to fair comparisons. To this aim, subjective tests have beenlead to select videos. At comparable visual quality, up to 3% bit-rate is preserved, compared toH.264/AVC, on many SD and CIF sequences. As an example, figure 6.35 presents bit-rate savingsaccording to 3 CIF sequences.

6.4. CONCLUSION 123
MotionSegmentation
Texture Segmentation
Classical encoding
Motion parameters encoding
Synthesis parametersencoding
Input GOP
Reference pictures
Intermediatepictures
Bit-stream
Encoder
Rigid regionsLocal motions
Objects, edges Texture
Figure 6.34: Global video encoding framework
6.4 Conclusion
A temporal consistent region representation has been first described. If the compression results areclearly not competitive with any video coder from the state-of-the-art, the major functionality, i.e thepersistence of the regions throughout the sequence, remains of major interest. Based on a temporalRAG, homogeneous regions can be tracked.
With motion tubes, image sequences are interpreted as a set of patches of textures undergoingspecific displacements and deformations along a given time interval. Indeed, each motion tubeconsists of an initial patch of texture, a lifespan during which the patch is available, and a set ofwarping operations describing its evolutions across time and space. In order to make their use easier,motion tubes were grouped into families: a reference image was partitioned into blocks, each ofwhich initializing a motion tube. With motion tubes, the motion information now consists of aset of spatio-temporal trajectories along with local deformations. The temporal persistence of thetexture is then naturally exhibited by the representation. Results show that tubes can effectively beused to represent image sequences, and coding improvements should be realized so that to be morecompetitive towards H.264/AVC standard.
As for the adaptive image synthesis tool for video compression, this approach is designed to bejointly used with current and future standard compression schemes. At encoder side, texture analysisincludes segmentation and characterization tools, in order to localize candidate regions for synthesis.The corresponding areas are not encoded. The decoder fills them using texture synthesis. Theremaining regions in images are classically encoded. They can potentially serve as input for texturesynthesis. The chosen tools are developed and adapted with an eye to ensuring the coherency of

124CHAPTER 6. PSEUDO-SEMANTIC REPRESENTATION OF VIDEOS: JOINT
ANALYSIS AND CODING TOOLS
0
5
10
15
20
25
30
35
0 2000 4000 6000 8000 10000
Patinage
Container
Coastguard
gain
s d
ébit
(%
)
Débits(kbits/s)
Figure 6.35: Bit-rate savings
the whole scheme. Thus, a texture characterization step provides required parameters to the texturesynthesizer. Two texture synthesizers, including a pixel-based and a patch-based approach, are usedon different types of texture, complementing each other. A first scheme is proposed for intra framecoding. Then, a temporal method is developed. The scheme is coupled with a motion estimator inorder to segment coherent regions and to interpolate rigid motions using an affine model. Inter frameadapted synthesis is therefore used for non-rigid texture regions. Assessing the quality of decodedframes by such schemes, using objective methods, is problematic. Results on bit-rate savings arepresented with the assumption of similar visual quality. At comparable visual quality, up to 33%bit-rate is preserved, compared to H.264/AVC, on many SD and CIF sequences.
Once again, if the coding issue was the final objective of these works, the resulting video represen-tation allows advanced semantically based processes, such as patch or region tracking. When takinginto account additional features, able to distinguish objects within a given scene, object tracking canbe envisaged. In this way, the next chapter proposes some application contexts relative to roboticvision.

Chapter 7
Toward robotic vision for personalassistance living
Previous chapters have described joint video analysis and coding tools. If my first research objectiveswere related to compression, I am convinced that the proposed pseudo-semantic video representationshave potential applications in other domains. Typically, geometrical cues, object detection andtracking can be deduced from advanced processes such as the ones previously presented.
Robotic vision shares common parts with video coding tools, especially 3D object tracking andsemantical scene analysis. Through collaborative projects, that I manage and describe in this chapter,I operate a noteworthy change in my research projects. Together with embedded system concerns, Iexpect to design robotic vision systems dedicated to personal assistance living issues. Yao Zhigang,PhD student, has started his work which matches this context, whereas Rafiq Sekkal PhD’s researchtopic moves slightly towards robotic vision.
This chapter then presents a roadmap that I intend to follow. General ideas and research perspec-tives are then exposed. In section 7.1, personal assistance living systems issues are described in thelight of autonomy needs. Within this context, section 7.2 is dedicated to secured and autonomousnavigation solution of electrical wheelchairs, whereas section 7.3 proposes to use 3D cameras toautomatically detect unusual situations. Since these research axis are closely related to collaborativeprojects, these latter will be naturally described in corresponding sections.
7.1 Personal assistance living: towards higher autonomy
The loss of autonomy can be a consequence of ageing, evolutive or chronic diseases or even accidentthat induced permanent handicaps. Disabling chronic conditions have thus to be carefully consideredin order to investigate technical and societal solutions able to preserve people autonomy.
When considering elderly people, their number and their proportion are expected to continuouslyincrease. In France, demographic projections tend to show that the French population will stabilizeat 64 million in 2050. By that time, seniors could account for 35 percent of the population. Sincethe Sixties, the health of elderly people in France has undergone significant changes. A transitionhas been observed, from acute illnesses to chronic or degenerative illnesses that lead to severedisabilities. While acute illness does not prevent seniors from travelling or having an active life,
125

126CHAPTER 7. TOWARD ROBOTIC VISION FOR PERSONAL ASSISTANCE LIVING
the evolution up to disabling chronic diseases requires the adaptation and gradual introduction ofactivities, accommodation and nursing homes. This situation is not only relative to ageing and elderlypeople, but also concerns more generally disabled people.
In [58], it has been emphasized that the ability to freely move, whatever the destination andthe timing are, remains a fundamental need for well-being and living well at home. For seniors, assoon as they loose their capacity to move by themselves, their mental condition is often affected,thus leading to additional handicaps. In [137], it has been shown that the notions of autonomy andintegrity are strongly linked. In this way, it is obvious that creating tools towards autonomy andinsuring secured moves are considered as a necessity.
As a consequence, personal assistance living issues are partially in relation with assistance roboticinnovations. When considering robotic vision, performing automatic tasks with the help of camerasremains possible. The specificity of assistance robotic is that, as long as robotic systems are developedtowards personal assistance, highly secure processes have to be designed.
The next section focuses then on a vision-based solution for wheelchair autonomous navigation.
7.2 Secured navigation of wheelchair solutions
7.2.1 APASH project
The APASH (Assistance au Pilotage pour l’Autonomie et la Securite des personnes Handicapees)project relies on a consortium composed of AdvanSEE (SME specialized in embedded vision sys-tems), Ergovie (SME that sells and adapts wheelchairs) and three laboratories within INSA, namelyIRISA, LGCGM (Sylvain Guegan) and IETR (Muriel Pressigout, Sylvain Haese, Luce Morin, FrancoisPasteau). This project aims to develop technologies to assist disabled people and allow them tofreely move indoor despite their handicap. This solution is particularly adapted to elderly peoplesuffering from disorientation and spatio-temporal confusion.
Indeed, the use of electrical wheelchair requires three levels of sequential decisions:
• strategy level, i.e. decisions about trajectory for instance,
• tactical level, i.e. decisions about motion with smooth time constraints, such as slowing down,avoiding obstacles...
• operative level, i.e. decisions that require hard time constraints, such as avoiding imminentdanger.
Moving with the help of a wheelchair remains then a quite complex task which requires both cognitiveand sensory capacities. These capacities can be deeply altered, implying an increased difficulty todrive the wheelchair. In particular, going through doors, taking the elevator in a secure way withoutrisking collision because of hazardous wheelchair motions remains a relevant issue.
Within this context, a first step of this research and development project consists of designingsolutions to insure secured moves inside problematic areas. The main innovations brought by theAPASH project rely then on the joint use of image information and heterogeneous multi-sensor data,in order to schedule vehicle trajectories. This would provide flexibility for an automatic navigationsystem and would ensure the immediate compatibility of the proposed system with existing electricwheelchairs.

7.2. SECURED NAVIGATION OF WHEELCHAIR SOLUTIONS 127
Localization issues will be addressed through the use of robotic vision. Coupled with this local-ization process, navigation issues will require the fusion of data obtained from not only vision sensorsbut also from multiple other odometry sensors. The objective is to compute a motion controler forthe electric wheelchair that takes account of the dynamic environment of hospitals.
The technical framework requires sensor networks: the resulting information redundancy ensuresthe necessary project reliability and safety, complying with the ISO26262 norm that focuses particu-larly on the transport of people. Performances will be evaluated in terms of patient acceptability andsafety. The ergonomics of the wheelchair commands will be particularly studied so that to designappropriate and smart man-machine interface.
Further advanced researches are envisaged as soon as this first step of development will beavailable. Complete autonomous indoor and outdoor navigation will be the next social and technicalchallenge. Indeed, acquiring a high level of autonomy involves, in case of severe handicaps, to entirelyassist people for their daily travels.
7.2.2 Technical issues
The technical objective of this work consists of developing a navigation system to ensure safe move-ment without collision of mobile robots in their dynamic environment. In order to improve thereactivity of mobile robots in their dynamic environment, we propose to take into account the fullprocessing chain, i.e. from the sensor up to the model. To reach this objective, it will be necessary tojointly work on two aspects, namely the navigation system and the dynamic modeling of the mobilerobot. The full model obtained by the interaction between these two tools will make possible toimprove the control of the mobile robot. Zhigang Yao, a PhD student I co-supervise, has started hiswork relative to this framework in November 2011.
To obtain continuous indoor motion, vision based processes can be used. From a single embeddedcamera, obtained data have to be analyzed in order to be reactive enough in a dynamical environment.The main challenge of the system is to precisely determine the pose of the wheelchair. Relatedinitialization and tracking features are still difficult problems especially in a dynamic environment[59]. Three types of approaches are then available: feature-based trackers relying on geometricalcues [35], template-matching approaches (i.e. based on texture recognition) [90], or hybrid solutionssuch as in [150]. Each of these solution addresses different application contexts as their robustness toocclusion may vary. The idea is then to use a hybrid-based solution to guarantee robust and real-timetracking. Markless solutions are here mandatory, as a complete and precise 3D model of the buildingwill not necessary be available. In any case, additional techniques can be coupled in order to takeaccount of aberrant estimated values and to improve robustness. Classically, M-estimators [35] orRANSAC [176] are used to this aim.
Mobile robot navigation will be then insured by visual servoing. Indeed, wheelchair orientednavigation issues are quite similar to the mobile robotic ones in terms of navigation strategies[157][120][36] and in terms of control [3].
As for it, the geometrical model of the wheelchair has to be elaborated. Coupled with both thekinematic and the dynamic models of the mobile robot, the optimal position of the sensors relativelyto the wheelchair itself has to be found. The idea is then to identify all the possible motions of thewheelchair in order to precisely adapt the motion control. Deduced from these models, motions ofthe wheelchair should be as precise and smooth as possible in order to be safe for both the patientand the environment.
128CHAPTER 7. TOWARD ROBOTIC VISION FOR PERSONAL ASSISTANCE LIVING
In addition, we have also to take into account the fact that the mobile robot will evolve in adynamic environment. The task for visual control thus naturally varies according to the consideredenvironment. For instance, the target (door, elevator,...) can be partially or totally occulted bya moving object thus requiring solution to estimate target position while moving the vehicle. Inaddition, for example when changing room, automatical definition of visual servoing reference willbe a crucial issue.
Finally, the behavior of the vehicle has to be fully characterized, in particular when taking intoaccount man-machine interactions. The control of this overall behavior is the key feature to guaranteesecurity. Even if the wheelchair remains under control of the disabled people, the position and thevelocity of the vehicle should match the environment constraints. As a consequence, the control unitwill have to find a tradeoff between autonomous and remote control [187]. For instance, in case ofobstacle or door detection, a solution consists of progressively substituting the human control forautomatical control, as the obstacle is getting closer.
7.3 Fall detection through 3D cameras
Staying at home, for disabled or ageing people, has been proved to be a source of well-being. In-homecare services can be then set up as soon as the concerned people agree. However, for family circle,or for people themselves, this matter of fact can be difficult to accept because of health risk. Inparticular, falls can rapidly become a case of emergency.
In the state-of-the-art, emergent technical solutions, relative to home-care support, tend toreassure people in the sense that they are able to raise alarm as soon as unusual situation is detected.To this aim, dedicated multiple camera-based frameworks have been developed [9]. In parallel, thanksto low-cost 3D cameras such as the Kinect, fall detection frameworks have been designed [163].Meanwhile, the combination of these two methods has led to innovative solutions for gait analysis[8].
The project PATH4FAR (Posture Analysis and Tracking at Home for Fall AlaRm), led by NeoTecVision (Rennes), aims at providing a complete framework for robust fall detection. From accurateanalysis tools, together with dedicated embedded system, we intend to verify the ability of theframework to provide ”true” alarms. This project, until now, is not yet financed. It will be realizedwith the help of the Hospital of Port Louis.
The idea is here to adapt robust 3D tracking solutions to depth signals in order to preciselylocalize people as well as their positions in the room. Multiple 3D cameras will be used to this aim.In particular, challenges lie in the fact that the resolution of depth signals is not as accurate as amonocular camera.
7.4 Long term objectives
A transversal topic of these projects relies on tracking issues. From compression up to robotic vision,tracking textures, objects or geometrical cues are common issues. In Lagadic team, some previousrelated works have already been realized especially towards markerless and robust tracking systems.Yet some issues, such as tracking initialization or real-time object detection, have not been completelysolved. PhD work of Rafiq Sekkal will address these sensitive issues through joint object extraction

7.4. LONG TERM OBJECTIVES 129
and tracking. In particular, his previous work, based on multiresolution segmentation (see section5.3), could be seen as an answer to the visual servoing initialization issue.
As for the autonomous navigation, an approach based on both visual servoing laws andappearance-based navigation from an image database has been designed for urban vehicle navigationpurposes (ANR projects Predit MobiVIP and CityVIP). The idea is to verify if this technique can beapplied within the APASH project context. APASH related application implies a maximal safety whilemoving in a very constraint environment (in hospital or at home, obstacle and stairs avoidance...).In order to enhance the wheelchair motion safety, additional information from heterogenous sensorsshould be provided. In particular, radio technologies such as Ultra Wide Band (UWB) systems canprovide indoor precise localization [68][60][44]. In collaboration with Sylvain Haese (IETR - CPRgroup), we intend to combine UWB and 3D vision to improve localization precision, especially inhigh danger areas such as stairs. Dedicated sensor fusion process would thus be studied.
In a nutshell, these long term objectives naturally confirm the fact that my research areas are noworiented towards robotic vision issues. In conjunction with embedded systems concern, applicationsthat are envisaged are mainly focused on personal assistance living.

130CHAPTER 7. TOWARD ROBOTIC VISION FOR PERSONAL ASSISTANCE LIVING

List of Figures
2.1 General scheme of two-layer LAR coder . . . . . . . . . . . . . . . . . . . . . . . . . . . . . 10
2.2 Specific coding parts for LAR profiles . . . . . . . . . . . . . . . . . . . . . . . . . . . . . . . 11
2.3 Original image and associated quadtree partitions obtained with a given value of activity de-tection parameter . . . . . . . . . . . . . . . . . . . . . . . . . . . . . . . . . . . . . . . . . 12
2.4 Pyramidal representation of an image . . . . . . . . . . . . . . . . . . . . . . . . . . . . . . 13
2.5 Block diagram of extended LAR coder profile . . . . . . . . . . . . . . . . . . . . . . . . . . 14
2.6 YUV versus CIELAB partitioning. . . . . . . . . . . . . . . . . . . . . . . . . . . . . . . . . . 18
2.7 Original application of the S-Transform . . . . . . . . . . . . . . . . . . . . . . . . . . . . . . 19
2.8 Second and third pass of the transformed coefficients prediction process. . . . . . . . . . . . . 20
2.9 Construction of the pyramid . . . . . . . . . . . . . . . . . . . . . . . . . . . . . . . . . . . 20
2.10 Decomposition and extraction of LAR block image data . . . . . . . . . . . . . . . . . . . . . 22
3.1 Interleaved S+P Coding of a resolution level . . . . . . . . . . . . . . . . . . . . . . . . . . . 28
3.2 Multi component classification scheme . . . . . . . . . . . . . . . . . . . . . . . . . . . . . . 29
3.3 Adaptive Decorrelation during Prediction Scheme . . . . . . . . . . . . . . . . . . . . . . . . 32
3.4 Comparison between practical results, pure mathematical, approximated quantized and contin-uous domain . . . . . . . . . . . . . . . . . . . . . . . . . . . . . . . . . . . . . . . . . . . . 42
3.5 Comparison between experimental and estimated MSE . . . . . . . . . . . . . . . . . . . . . 43
3.6 A priori quality estimation . . . . . . . . . . . . . . . . . . . . . . . . . . . . . . . . . . . . . 44
3.7 QM coding scheme with bit plane orientation . . . . . . . . . . . . . . . . . . . . . . . . . . 45
3.8 QM coding scheme with symbol orientation . . . . . . . . . . . . . . . . . . . . . . . . . . . 46
3.9 Example of QM coding with bit plane orientation . . . . . . . . . . . . . . . . . . . . . . . . 46
3.10 Example of QM coding with symbol orientation . . . . . . . . . . . . . . . . . . . . . . . . . 47
3.11 Magnitude coding process . . . . . . . . . . . . . . . . . . . . . . . . . . . . . . . . . . . . . 48
3.12 Compression ratios of QM encoding for both symbol oriented and bit plane oriented QM Coding 50
3.13 Compression ratios of QM encoding for both symbol oriented and bit plane oriented QM Coding 51
4.1 Visual quality versus watermarked block sizes. For each image, position of modified pixels hasbeen extracted (in white onto black background). . . . . . . . . . . . . . . . . . . . . . . . . 57
4.2 a) Source image - b) Image with inserted payload . . . . . . . . . . . . . . . . . . . . . . . . 57
4.3 Interleaved S+P hierarchical selective encryption principle . . . . . . . . . . . . . . . . . . . . 58
4.4 Visual comparison between original image and image obtained from partially encrypted LARencoded streams without encryption key. . . . . . . . . . . . . . . . . . . . . . . . . . . . . . 59
131

132 LIST OF FIGURES
4.5 Exchange protocol for client-server application . . . . . . . . . . . . . . . . . . . . . . . . . . 60
4.6 Achieved bitrate per second using our one-pass rate control scheme. . . . . . . . . . . . . . . 66
4.7 Achieved bitrates at frame level using our one-pass rate control scheme. . . . . . . . . . . . . 67
4.8 UEP principles: hierarchy and redundancy . . . . . . . . . . . . . . . . . . . . . . . . . . . . 68
4.9 Overall layout of the multi-layer transmission/compression system . . . . . . . . . . . . . . . 69
4.10 General joint LAR-Mojette coding scheme . . . . . . . . . . . . . . . . . . . . . . . . . . . . 69
5.1 Complexity - quality target of presented DFI method . . . . . . . . . . . . . . . . . . . . . . 73
5.2 Geometric duality across scale . . . . . . . . . . . . . . . . . . . . . . . . . . . . . . . . . . 74
5.3 DFI steps sequence . . . . . . . . . . . . . . . . . . . . . . . . . . . . . . . . . . . . . . . . 74
5.4 Step 1 - Pixel copy over an enlarged grid . . . . . . . . . . . . . . . . . . . . . . . . . . . . . 75
5.5 Step 2 - diagonal interpolation . . . . . . . . . . . . . . . . . . . . . . . . . . . . . . . . . . 76
5.6 Step 3 - vertical / horizontal interpolation . . . . . . . . . . . . . . . . . . . . . . . . . . . . 77
5.7 Step 4: diagonal interpolation for 1/2 pixel shifting . . . . . . . . . . . . . . . . . . . . . . . 77
5.8 Quality enhancement step illustration, 8× enlargement . . . . . . . . . . . . . . . . . . . . . 78
5.9 Image extension by symmetry for border handling . . . . . . . . . . . . . . . . . . . . . . . . 79
5.10 Subjective evaluation . . . . . . . . . . . . . . . . . . . . . . . . . . . . . . . . . . . . . . . 80
5.11 Combined approach: YCbCr color space + Hybrid DFI illustration, 2× enlargement . . . . . . 83
5.12 Few steps of the segmentation method in false colors . . . . . . . . . . . . . . . . . . . . . . 85
5.13 Segmentation method evaluation, Berkeley database . . . . . . . . . . . . . . . . . . . . . . 87
5.14 Segmentation method evaluation . . . . . . . . . . . . . . . . . . . . . . . . . . . . . . . . . 88
5.15 Multiresolution and hierarchical segmentation representations . . . . . . . . . . . . . . . . . . 90
5.16 JHMS general scheme . . . . . . . . . . . . . . . . . . . . . . . . . . . . . . . . . . . . . . . 91
5.17 Inter-level regions relationships. Four regions in Resl
, in a) regions are composed with blocksof the same region parent. However in b) there is one region composed from blocks belongingto the two regions parents . . . . . . . . . . . . . . . . . . . . . . . . . . . . . . . . . . . . . 91
5.18 Scalable segmentation results . . . . . . . . . . . . . . . . . . . . . . . . . . . . . . . . . . . 92
5.19 Image Boundaries, from the left: ground truth, Global Probability of Boundary GPB, ColorGradient (CG) and JHMS results . . . . . . . . . . . . . . . . . . . . . . . . . . . . . . . . . 93
6.1 Region based video coding framework . . . . . . . . . . . . . . . . . . . . . . . . . . . . . . 99
6.2 Simplified region based video coding framework . . . . . . . . . . . . . . . . . . . . . . . . . 100
6.3 Motion compensation and quadtree partitioning . . . . . . . . . . . . . . . . . . . . . . . . . 101
6.4 Spatio-temporal segmentation process: motion and spatial compliant hierarchy . . . . . . . . 101
6.5 Spatio-temporal segmentation process: motion and spatial compliant hierarchy . . . . . . . . 102
6.6 From a moving patch of texture towards the motion tube . . . . . . . . . . . . . . . . . . . . 102
6.7 Temporal consistency of regions: illustration on football sequence. First row shows the originalsequence, second raw the associated region representation, third row illustrates region labeling 103
6.8 Temporal persistence of textures in image sequences . . . . . . . . . . . . . . . . . . . . . . 104
6.9 From a moving patch of texture towards the motion tube . . . . . . . . . . . . . . . . . . . . 105
6.10 Trajectory and deformation of a motion tube . . . . . . . . . . . . . . . . . . . . . . . . . . 105
6.11 An image sequence partially reconstructed from a few motion tubes . . . . . . . . . . . . . . 106
6.12 GOP paradigm in the context of motion tubes . . . . . . . . . . . . . . . . . . . . . . . . . 107

LIST OF FIGURES 133
6.13 Preliminary example of motion tube based reconstruction - Connected and unconnected tubes 107
6.14 Forward motion compensation of a motion tube: in between OBMC and CGI . . . . . . . . . 108
6.15 Idealistic representation of the deformation for the three connected modes . . . . . . . . . . . 109
6.16 Various hybridizations of the different motion models . . . . . . . . . . . . . . . . . . . . . . 110
6.17 LAOTMC motion mode: automatic recursive partitioning of a motion tube . . . . . . . . . . 110
6.18 TMC versus OTMC motion modes: influence on the synthesized images . . . . . . . . . . . . 111
6.19 Hybridization of the four motion modes: influence on the synthesized images . . . . . . . . . 112
6.20 B-families of motion tubes: influence on the synthesis of the fourth image of sequence Foreman113
6.21 Framework overview. . . . . . . . . . . . . . . . . . . . . . . . . . . . . . . . . . . . . . . . 116
6.22 Descriptor computed on a 4x4 DCT block. . . . . . . . . . . . . . . . . . . . . . . . . . . . . 117
6.23 Descriptor Integral on a discrete array. . . . . . . . . . . . . . . . . . . . . . . . . . . . . . . 117
6.24 Texture patch design . . . . . . . . . . . . . . . . . . . . . . . . . . . . . . . . . . . . . . . 118
6.25 Impact of anchor blocks to synthesized areas . . . . . . . . . . . . . . . . . . . . . . . . . . . 118
6.26 Finding best matching neighborhood. . . . . . . . . . . . . . . . . . . . . . . . . . . . . . . . 119
6.27 Confidence map order. Confidences wa, wb and wc are computed for center pixels usingneighboring confidences. At initialization, wa = 0.64 for instance. After synthesizing pixel a,wb is updated by assigning w1
a. . . . . . . . . . . . . . . . . . . . . . . . . . . . . . . . . . . 119
6.28 Patch-based synthesis order . . . . . . . . . . . . . . . . . . . . . . . . . . . . . . . . . . . . 120
6.29 a: The red hatched region is used to search the best matching patch. b: the chosen patch ispasted on the new texture. c: the best cuts are found between overlapping regions . . . . . . 120
6.30 Texture spectrum for switching synthesizers . . . . . . . . . . . . . . . . . . . . . . . . . . . 120
6.31 Results on the Coastguard sequence . . . . . . . . . . . . . . . . . . . . . . . . . . . . . . . 121
6.32 Results on the Morocco Trial sequence . . . . . . . . . . . . . . . . . . . . . . . . . . . . . . 121
6.33 Resulting gradients for the 4 textures . . . . . . . . . . . . . . . . . . . . . . . . . . . . . . . 122
6.34 Global video encoding framework . . . . . . . . . . . . . . . . . . . . . . . . . . . . . . . . . 123
6.35 Bit-rate savings . . . . . . . . . . . . . . . . . . . . . . . . . . . . . . . . . . . . . . . . . . 124

134 LIST OF FIGURES

List of Tables
2.1 C4 quality assessments with different partitioning criteria and optimal threshold TH . . . . . . 17
2.2 WPSNR PIXRGB and bit-rate, YUV and CIELAB representations (image: barba) . . . . . 17
3.1 Compression results in bpp . . . . . . . . . . . . . . . . . . . . . . . . . . . . . . . . . . . . 31
3.2 Compression results in bpp . . . . . . . . . . . . . . . . . . . . . . . . . . . . . . . . . . . . 34
3.3 Quality results of proposed methods in PSNR (db) . . . . . . . . . . . . . . . . . . . . . . . 35
3.4 Rate results of proposed methods in bits per pixel (bpp) . . . . . . . . . . . . . . . . . . . . 35
4.1 Test scenarios for each type of scalability. . . . . . . . . . . . . . . . . . . . . . . . . . . . . 65
5.1 Local mean correction results on proposed interpolation method, average WPSNR scores on25 images . . . . . . . . . . . . . . . . . . . . . . . . . . . . . . . . . . . . . . . . . . . . . 78
5.2 Average WPSNR scores on 25 images of 512 by 512 pixels size. 2× enlargement. * : Im-ageMagick filter . . . . . . . . . . . . . . . . . . . . . . . . . . . . . . . . . . . . . . . . . . 79
5.3 Number of operations per pixel in the high resolution image for the proposed interpolationalgorithm . . . . . . . . . . . . . . . . . . . . . . . . . . . . . . . . . . . . . . . . . . . . . . 81
5.4 Benchmark of interpolation methods, enlargement by 2 of a 512 by 512 image . . . . . . . . 81
5.5 Execution times of the methods used in the subjective evaluation: 128 by 128 pixels imageenlarged to a 512 by 512 pixels image . . . . . . . . . . . . . . . . . . . . . . . . . . . . . . 81
5.6 Quantitative scores on Berkeley database BSDS30 . . . . . . . . . . . . . . . . . . . . . . . . 93
5.7 Multiresolution and quadtree partitioning influence on complexity and objective scores . . . . 94
6.1 Resulting bit-rate saving with respect to the Quantization parameter QP . . . . . . . . . . . . 122
135

136 LIST OF TABLES

Bibliography
[1] A. M. T. A. Leontaris. Rate control reorganization in the joint model soft reference. Technical report,Joint Video Team, doc. JVT-W042, 2007.
[2] A. Albanese, J. Blomer, J. Edmonds, M. Luby, and M. Sudan. Priority Encoding Transmission. IEEETransaction on Information Theory, 42(6):1737–1744, 1996.
[3] G. Allibert, E. Courtial, and F. Chaumette. Predictive control for constrained image-based visual servo-ing. Robotics, IEEE Transactions on, 26(5):933 –939, oct. 2010.
[4] Y. Altunbasak and N. Kamaci. An analysis of the DCT coefficient distribution with the h.264 videocoder. In IEEE International Conference on Acoustics, Speech, and Signal Processing, 2004. Proceedings.(ICASSP ’04), volume 3, pages 177–80. IEEE, May 2004.
[5] P. Arbelaez, M. Maire, C. C. Fowlkes, and J. Malik. From contours to regions: An empirical evaluation.In IEEE Conference on Computer Vision and Pattern Recognition, CVPR, pages 2294–2301, 2009.
[6] M. Ashikhmin. Synthesizing natural textures. In Proceedings of ACM Symposium on Interactive 3DGraphics, pages 217–226, 2001.
[7] N. Asuni and A. Giachetti. Accuracy improvements and artifacts removal in edge based image interpo-lation. In International Joint Conference on Computer Vision, Imaging and Computer Graphics Theoryand Applications, pages 58–65, 2008.
[8] E. Auvinet, F. Multon, and J. Meunier. Contactless Abnormal Gait Detection, Gait analysis with multipledepth cameras. In EMBC, Boston, Etats-Unis, 2011. IEEE, IEEE Press.
[9] E. Auvinet, F. Multon, A. Saint-Arnaud, J. Rousseau, and J. Meunier. Fall detection with multiplecameras: An occlusion-resistant method based on 3-d silhouette vertical distribution. InformationTechnology in Biomedicine, IEEE Transactions on, 15(2):290 –300, march 2011.
[10] W. A. B. Perceptual-components architecture for digital video. Journal of the Optical Society ofAmerica. A: Optics and image science, volume 7, issue 10, pages 1943–1954, Oct. 1990.
[11] M. Babel, L. Bedat, O. Deforges, and J. Motsch. Context-Based Scalable Coding and Representationof High Resolution Art Pictures for Remote Data Access. In Proc. of the IEEE International Conferenceon Multimedia and Expo, ICME’07, pages 460–463, July 2007. Projet ANR TSAR.
[12] M. Babel and O. Deforges. wg1n4870 Response to call for AIC technologies and evaluation methodolo-gies. Technical report, ISO/ITU JPEG commitee, San Francisco, USA, January 2009.
[13] M. Babel, O. Deforges, L. Bedat, C. Strauss, and F. Pasteau. wg1n5327 Answer for the AIC call -Medical Images database . Technical report, ISO/ITU JPEG commitee, Boston, USA, March 2010.
[14] M. Babel, O. Deforges, L. Bedat, C. Strauss, and F. Pasteau. wg1n5545 LAR Codec reference softwareoverview - Core Experiment 1.0 . Technical report, ISO/ITU JPEG commitee, Guangzhou, China,August 2010.
137

138 BIBLIOGRAPHY
[15] M. Babel, O. Deforges, L. Bedat, C. Strauss, and F. Pasteau. wg1n5630 LAR Codec reference softwareoverview - Intermediate Core Experiment 1.0. Technical report, ISO/ITU JPEG commitee, December2010.
[16] M. Babel, O. Deforges, L. Bedat, C. Strauss, and F. Pasteau. wg1n5631 LAR Codec reference software- Core Experiment 2.0 . Technical report, ISO/ITU JPEG commitee, January 2011.
[17] M. Babel, O. Deforges, L. Bedat, C. Strauss, and F. Pasteau. wg1n5804 LAR Codec reference software- Core Experiment 3.0. Technical report, ISO/ITU JPEG commitee, Berlin, July 2011.
[18] M. Babel, O. Deforges, L. Bedat, C. Strauss, and F. Pasteau. wg1n5812 LAR Objective QualityComparison. Technical report, ISO/ITU JPEG commitee, Berlin, July 2011.
[19] M. Babel, O. Deforges, L. Bedat, C. Strauss, F. Pasteau, and J. Motsch. WG1N5315 - Response toCall for AIC evaluation methodologies and compression technologies for medical images: LAR Codec.Technical report, ISO/ITU JPEG commitee, Boston, USA, March 2010.
[20] M. Babel, O. Deforges, L. Bedat, C. Strauss, F. Pasteau, and J. Motsch. wg1n5330 1003 Response -CFP AIC Medical images - IETR . Technical report, ISO/ITU JPEG commitee, Boston, USA, March2010.
[21] M. Babel, O. Deforges, and J. Ronsin. Interleaved S+P Pyramidal Decomposition with Refined Pre-diction Model. In IEEE International Conference on Image Processing, ICIP’05, pages 750–753. IEEE,Sept. 2005.
[22] M. Babel, B. Parrein, O. Deforges, N. Normand, J.-P. Guedon, and V. Coat. Joint source-channel coding:secured and progressive transmission of compressed medical images on the Internet. ComputerizedMedical Imaging and Graphics, 32(4):258–269, June 2008.
[23] M. Babel, F. Pasteau, C. Strauss, M. Pelcat, L. Bedat, B. Mederic, and O. Deforges. Preservingdata integrity of encoded medical images: the LAR compression framework. In R. Kountchev andK. Nakamatsu, editors, Advances in reasoning-based image processing, analysis and intelligent systems:Conventional and intelligent paradigms, Intelligent Systems Reference Library, pages 1–36. Springer,2011.
[24] W. Bender, D. Gruhl, N. Morimoto, and A. Lu. Techniques for data hiding. IBM Systems Journal,35(3/4):313 – 336, 1996.
[25] C. Bergeron, B. Gadat, C. Poulliat, and D. Nicholson. Extrinsic distortion based Source-Channel alloca-tion for Wireless JPEG2000 transcoding systems. In IEEE International Conference on Image Processing,Hong-Kong, September 2010.
[26] S. S. Bhattacharyya, J. Eker, J. Janneck, C. Lucarz, M. Mattavelli, and M. Raulet. Overview of theMPEG Reconfigurable Video Coding Framework. Journal of Signal Processing Systems, 63(2):251–263,2009.
[27] H. Boeglen. IT++ library for numerical communications simulations. http://herve.boeglen.free.fr/itpp windows/, 2007.
[28] W. Brendel and S. Todorovic. Video object segmentation by tracking regions. In IEEE 12th InternationalConference on Computer Vision, pages 833–840, oct 2009.
[29] N. Cammas and S. Pateux. Fine grain scalable video coding using 3d wavelets and active meshes. InSPIE Visual Communications and Image Processing, Jan 2003.
[30] W. Carey, D. Chuang, and S. Hemami. Regularity-preserving image interpolation. IEEE Transactionson Image Processing, 8(9):1293–1297, Sept. 1999.
[31] X. Chen, H. Ou, X. Luo, M. Chen, Y. Zhang, K. Hao, and S. Mi. The Progress of University DigitalMuseum Grid. In Proc. IEEE International Conference on Grid and Cooperative Computing Workshops,GCCW’06, 2006.

BIBLIOGRAPHY 139
[32] W.-C. S. Chi-Shing Wong. Further Improved Edge-directed Interpolation and Fast EDI for SDTV TOHDTV Conversion. In EUSIPCO 2010, Aalborg, Denmark, August 2010.
[33] B.-D. Choi, J.-W. Han, S.-W. Jung, J.-H. Nam, and S.-J. Ko. Overlapped Block Motion Compensationbased on irregular grid. In Proceedings of International Conference on Image Processing (ICIP’06),pages 1085–1088, 2006.
[34] CIE. CIE publication 116-1995 ”Industrial Colour-Difference evaluation”, 1995.
[35] A. Comport, E. Marchand, M. Pressigout, and F. Chaumette. Real-time markerless tracking for aug-mented reality: the virtual visual servoing framework. Visualization and Computer Graphics, IEEETransactions on, 12(4):615 –628, july-aug. 2006.
[36] J. Courbon, Y. Mezouar, and P. Martinet. Indoor navigation of a non-holonomic mobile robot using avisual memory. Auton. Robots, 25:253–266, October 2008.
[37] J. Cristy, A. Thyssen, and F. Weinhaus. ImageMagick. http://www.imagemagick.org.
[38] O. Deforges. Codage d’images par la methode LAR et Methodologie Adequation Algorithme Architecture: de la definition des algorithmes de compression ou prototypage rapide sur architectures parallelesheterogenes. Habilitation thesis, Universite de Rennes 1, November 2004.
[39] O. Deforges and M. Babel. LAR method: from algorithm to synthesis for an embedded low complexityimage coder. In 3rd International Design and Test Workshop - IDT’08, December 2008.
[40] O. Deforges, M. Babel, L. Bedat, and J. Ronsin. Color LAR codec: a color image representation andcompression scheme based on local resolution adjustment and self-extracting region representation. IEEETransactions on Circuits and Systems for Video Technology, 17(8):974–987, 2007.
[41] O. Deforges, M. Babel, and J. Motsch. The RWHT+P for an improved lossless multiresolution coding.In EUSIPCO proceedings, pages 1–5. EUSIPCO, 2006.
[42] O. Deforges and J. Ronsin. Locally adaptive resolution method for progressive still image coding.In Signal Processing and Its Applications, 1999. ISSPA ’99. Proceedings of the Fifth InternationalSymposium on, volume 2, pages 825 –829 vol.2, 1999.
[43] B. C. Dharaa and B. Chanda. Color image compression based on block truncation coding using patternfitting principle. In Pattern Recognition, volume 40, pages 2408–2417, September 2007.
[44] A. Dilshab and S. Chauhan. Latest advancements in mobile robot localization in manufacturing envi-ronment. In Second International Conference on Business and Technology, 2010.
[45] J. Dong and N. Ling. On model parameter estimation for h.264/avc rate control. In Circuits andSystems, 2007. ISCAS 2007. IEEE International Symposium on, pages 289 –292, may 2007.
[46] C. E. Duchon. Lanczos filtering in one and two dimensions. Journal of Applied Meteorology, 18(8):1016–1022, 1979.
[47] F. Dufaux and D. Nicholson. JWL: JPEG 2000 for wireless applications. In SPIE Proc. Applications ofDigital Image Processing XXVII, volume 5558, pages 309–318, 2004.
[48] A. Dumitras, B. Haskell, A. Inc, and C. Cupertino. A texture replacement method at the encoder forbit-rate reduction of compressed video. IEEE TCSVT, 13(2):163–175, 2003.
[49] P. T. Ebrahimi. wg1n5578 WebP vs. Standard Image Coding. Technical report, ISO/ITU JPEG com-mitee, ICT-Link, October 2010.
[50] J. Editors. JPEG 2000 image coding system - Part 11: Wireless JPEG2000 Committee Draft. in ISO/IECCD 15444-11 / ITU-T SG8, 2004.
[51] J. Eker and J. W. Janneck. Cal language report. Technical Report ERL Technical Memorandum No.UCB/ERL M03/48, University of California at Berkeley, December 2003.

140 BIBLIOGRAPHY
[52] P. Elias. Coding for Noisy Channels. Convention Record, 4:37–49, 1955.
[53] M. Fairchild. Color Appearance Models. John Wiley & Sons, Ltd, England, 2005.
[54] P. F. Felzenszwalb and D. P. Huttenlocher. Efficient Graph-Based image segmentation. InternationalJournal of Computer Vision, 59(2):167–181, 2004.
[55] E. Flecher, M. Babel, O. Deforges, and V. Coat. LAR Video: Hierarchical Representation for LowBit-Rate Color Image Sequence Coding. In Proc. of Picture Coding Symposium (PCS’07), page paper1175, Lisboa, Portugal, Nov. 2007.
[56] E. Flecher, M. Raulet, G. Roquier, M. Babel, and O. Deforges. Framework For Efficient CosimulationAnd Fast Prototyping on Multi-Components With AAA Methodology: LAR Codec Study Case. In Proc.of the 15th European Signal Processing Conference (Eusipco 2007), pages 1667–1671, Poznan, Poland,September 2007.
[57] C. Fonteneau, J. Motsch, M. Babel, and O. Deforges. A Hierarchical Selective Encryption Technique ina Scalable Image Codec. In Proc. of International Conference in Communications, June 2008.
[58] A. Franco. Rapport de la mission ”Vivre chez soi”. Report to mrs nora berra, secretary of state ofseniors, French ministry of Work, Health and Solidarity, June 2010.
[59] P. Fua and V. Lepetit. Emerging Technologies of Augmented Reality, Interfaces and Design, chapterVision Based 3D Tracking and Pose Estimation for Mixed Reality, pages 1–22. Idea Group Publishing.,2007.
[60] S. Gezici, Z. Tian, G. Giannakis, H. Kobayashi, A. Molisch, H. Poor, and Z. Sahinoglu. Localizationvia ultra-wideband radios: a look at positioning aspects for future sensor networks. Signal ProcessingMagazine, IEEE, 22(4):70 – 84, july 2005.
[61] A. Giachetti and N. Asuni. Real time artifact-free image upscaling. Image Processing, IEEE Transactionson, page 1, 2011.
[62] D. Glasner, S. Bagon, and M. Irani. Super-resolution from a single image. In ICCV, 2009.
[63] S. Golomb. Run-length encodings (Corresp.). IEEE Transactions on Information Theory, 12(3):399–401, July 1966.
[64] google.com. Webm: an open web media project. http://www.webmproject.org/tools/vp8-sdk/, 2011.
[65] google.com. Webp: A new image format for the web. http://code.google.com/speed/webp/, 2011.
[66] M. J. Gormish. Lossless and nearly lossless compression for high-quality images. In Proceedings of SPIE,pages 62–70, San Jose, CA, USA, 1997.
[67] T. Grandpierre and Y. Sorel. From algorithm and architecture specifications to automatic generationof distributed real-time executives: a seamless flow of graphs transformations. In First ACM and IEEEInternational Conference on Formal Methods and Models for Co-Design, Mont Saint-Michel, France,June 2003.
[68] R. Grossmann, J. Blumenthal, F. Golatowski, and D. Timmermann. Localization in zigbee-based sensornetworks. In 1st European Zigbee Developer’s Conference (EuZDC), Munchen-Dornach, Deutschland,2007.
[69] C. Gu, J. J. Lim, P. Arbelaez, and J. Malik. Recognition using regions ∗. In IEEE Conference onComputer Vision and Pattern Recognition, CVPR, pages 1030–1037, 2009.
[70] H264 MPEG-4 10 AVC. Joint Committee Draft (CD). Joint Video Team (JVT) of ISO/IEC MPEG andITU-T VCEGn 3rd Meeting: Fairfax, Virginia, USA, May 2002.

BIBLIOGRAPHY 141
[71] W. Hamidouche, C. Olivier, M. Babel, O. Deforges, H. Boeglen, and P. Lorenz. LAR Image transmissionover fading channels: a hierarchical protection solution. In Proc. of The Second International Conferenceon Communication Theory, Reliability, and Quality of Service, pages 1–4, Colmar France, 07 2009.
[72] Z. He and T. Chen. Linear rate control for JVT video coding. Information Tech.: Research andEducation, Int. Conf. on, pages 65–68, 2003.
[73] Z. He and S. Mitra. ρ-domain bit allocation and rate control for real time video coding. Image Processing,Int. Conf. on, 3:546–549, 2001.
[74] D. A. Huffman. A method for the construction of Minimum-Redundancy codes. Proceedings of theIRE, 40(9):1098–1101, Sept. 1952.
[75] R. S. Hunter. Photoelectric color difference meter. Journal of the Optical Society of America, 48(12):985,Dec. 1958.
[76] P. Ishwar and P. Moulin. Switched control grid interpolation for motion compensated video coding.In Proceedings of International Conference on Image Processing (ICIP’97), volume 3, pages 650–653,1997.
[77] P. Ishwar and P. Moulin. On spatial adaptation of motion field smoothness in video coding. IEEETransactions on circuits and systems for video technology, 10(6):980–989, Sep 2000.
[78] ISO/IEC 10918-1. Information technology - Digital compression and coding of continuous-tone stillimages - Requirements and guidelines, Mars 2009.
[79] ISO/IEC 14495-1. Information technology - Lossless and near-lossless compression of continuous-tonestill images - Baseline, Mars 2009.
[80] ISO/IEC 15444-1. JPEG 2000 image coding system Part 1, May 2000.
[81] ISO/IEC 15444-1. (JPEG-1)-based still-image coding using an alternative arithmetic coder , May 2006.
[82] ISO/IEC 15444-1. JPEG 2000 image coding system: Wireless , May 2006.
[83] ISO/IEC 15444-1. JPEG XR image coding system: Image coding specification , Mars 2009.
[84] ISO/IEC JTC1/SC29/WG11 MPEG2007/N9189. Svc verification test plan, version 1. Technical report,Joint Video Team, 2007.
[85] ITU-T. Recommendation E.800: QoS Terms and Definitions related to Quality of Service and NetworkPerformance including dependability. Technical report, International Telecommunication Union, August1994.
[86] ITU-T. Recommendation G.1080: Quality of Experience requirements for IPTV services. Technicalreport, International Telecommunication Union, May 2008.
[87] F. Jamil, R. Porle, A. Chekima, R. Lee, H. Ali, and S. Rasat. Preliminary study of block matchingalgorithm (bma) for video coding. In Mechatronics (ICOM), 2011 4th International Conference On,pages 1 –5, may 2011.
[88] K. Jerbi, M. Wipliez, M. Raulet, O. Deforges, M. Babel, and M. Abid. Automatic Method For EfficientHardware Implementation From RVC-CAL Dataflow: A LAR Coder baseline Case Study. ”Section E:Consumer Electronics” of the Journal of Convergence, pages 85–92, Dec. 2010.
[89] K. Jerbi, M. Wipliez, M. Raulet, O. Deforges, M. Babel, and M. Abid. Fast Hardware implementationof an Hadamard Transform Using RVC-CAL Dataflow Programming. In Proc. of 5th IEEE InternationalConference on Embedded and Multimedia Computing 5th IEEE International Conference on Embeddedand Multimedia Computing, pages 1–5, Philippines, 08 2010.
[90] F. Jurie and M. Dhome. Real time robust template matching. In in British Machine Vision Conference2002, pages 123–131, 2002.

142 BIBLIOGRAPHY
[91] D. Kelkar and S. Gupta. Improved quadtree method for split merge image segmentation. In IEEEInternational Conference on Emerging Trends in Engineering and Technology, volume 0, pages 44–47,Los Alamitos, USA, 2008.
[92] W. Kropatsch, Y. Haxhimusa, and A. Ion. Multiresolution image segmentations in graph pyramids.In A. Kandel, H. Bunke, and M. Last, editors, Applied Graph Theory in Computer Vision and Pat-tern Recognition, volume 52 of Studies in Computational Intelligence, pages 3–41. Springer Berlin /Heidelberg, 2007.
[93] W. Kropatsch, Y. Haxhimusa, and A. Ion. Multiresolution image segmentations in graph pyramids.In A. Kandel, H. Bunke, and M. Last, editors, Applied Graph Theory in Computer Vision and Pat-tern Recognition, volume 52 of Studies in Computational Intelligence, pages 3–41. Springer Berlin /Heidelberg, 2007.
[94] W. G. Kropatsch, Y. Haxhimusa, Z. Pizlo, and G. Langs. Vision pyramids that do not grow too high.Pattern Recogn. Lett., 26:319–337, February 2005.
[95] V. Kwatra, I. E. Aaron, and B. N. Kwatra. Texture Optimization for Example-based Synthesis. InProceedings of ACM SIGGRAPH, pages 795 – 802, 2005.
[96] V. Kwatra, A. Schodl, I. Essa, G. Turk, and A. Bobick. Graphcut textures: image and video synthesisusing graph cuts. In ACM SIGGRAPH 2003 Papers, SIGGRAPH ’03, pages 277–286, 2003.
[97] E. Y. Lam and J. W. Goodman. A mathematical analysis of the DCT coefficient distributions for images.IEEE Transactions on Image Processing, 9(10):1661–1666, Oct. 2000.
[98] C. Larabi. wg1n4805 Call for Advanced Image Coding and evaluation methodologies (AIC). Technicalreport, ISO/ITU JPEG commitee, University of Poitiers, October 2008.
[99] C. Larabi. wg1n5491 AIC core experiment on evaluation of LAR proposal (CO-LAR-01). Technicalreport, ISO/ITU JPEG commitee, University of Poitiers, July 2010.
[100] C. Larabi. wg1n5596 AIC core experiment on evaluation of LAR proposal (CO-LAR-02). Technicalreport, ISO/ITU JPEG commitee, University of Poitiers, October 2010.
[101] C. Larabi. wg1n5682 Subjective evaluation results for CO-LAR-02. Technical report, ISO/ITU JPEGcommitee, University of Poitiers, February 2011.
[102] C. Larabi. wg1n5712 AIC core experiment on performance evaluation and functionality analysis. Tech-nical report, ISO/ITU JPEG commitee, University of Poitiers, February 2011.
[103] B. Le Guen. Adaptation du contenu spatio-temporel des images pour un codage par ondelettes. PhDthesis, Universite de Rennes I, Rennes, France, Feb 2008.
[104] W. S. Lee. Edge adaptive prediction for lossless image coding. In Proc. Data Compression Conference,pages 483–490, 1999.
[105] X. Li, N. Oertel, A. Hutter, and A. Kaup. Laplace distribution based lagrangian rate distortion opti-mization for hybrid video coding. IEEE Trans. Cir. and Sys. for Video Technol., 19:193–205, February2009.
[106] X. Li and M. T. Orchard. New Edge-Directed interpolation. IEEE Transactions on Image Processing,10:1521–1527, 2001.
[107] Z. Li, F. Pan, K. Lim, G. Feng, and X. Lin. Adaptive basic unit layer rate control for JVT. Technicalreport, Joint Video Team, doc. JVT-G012, 2003.
[108] L.-J. Lin and A. Ortega. Bit-rate control using piecewise approximated rate-distortion characteristics.IEEE Trans. Circuits Syst. Video Tech., 8:446–459, 1998.
[109] D. Liu, X. Sun, F. Wu, S. Li, and Y.-Q. Zhang. Image compression with edge-based inpainting. Circuitsand Systems for Video Technology, IEEE Transactions on, 17(10):1273 –1287, Oct. 2007.

BIBLIOGRAPHY 143
[110] Y. Liu, Z. G. Li, and Y. C. Soh. Rate control of h.264/AVC scalable extension. Circuits and Systemsfor Video Tech., IEEE Trans. on, 18(1):116–121, 2008.
[111] Y. Liu and Y. Tsin. The promise and the perils of near-regular texture. International Journal of ComputerVision, 62:1–2, 2002.
[112] Z. Liu, L. Karam, and A. Watson. JPEG2000 encoding with perceptual distortion control. In ImageProcessing, 2003. ICIP 2003. Proceedings. 2003 International Conference on, volume 1, pages I–637–40vol.1, 2003.
[113] B. Ltd. PhotoZoomPro3. http://www.benvista.com/photozoompro.
[114] D. Lu and Q. Weng. A survey of image classification methods and techniques for improving classificationperformance. International Journal of Remote Sensing, 28(5):823–870, 2007.
[115] S. W. Ma, W. Gao, Y. Lu, and H. Q. Lu. Proposed draft description of rate control on JVT standard.Technical report, Joint Video Team, doc. JVT-F086, 2002.
[116] G. F. MacDonald. Digital visionary. Museum News, 79:34–41, March/April 2000.
[117] M. Maire, P. Arbelaez, C. C. Fowlkes, and J. Malik. Using contours to detect and localize junctions innatural images. In IEEE Conference on Computer Vision and Pattern Recognition, CVPR, 2008.
[118] S. Mallat. A Wavelet Tour of Signal Processing, Third Edition: The Sparse Way. Academic Press, 3rdedition, 2008.
[119] H. Malvar and G. Sullivan. Ycocg-r: A color space with rgb reversibility and low dynamic range. InJoint Video Team (JVT) of ISO-IEC MPEG and ITU-T VCEG, 22-24 July 2003.
[120] N. Mansard and F. Chaumette. Task sequencing for high-level sensor-based control. Robotics, IEEETransactions on, 23(1):60 –72, feb. 2007.
[121] D. Marpe, H. Schwarz, S. Bosse, B. Bross, P. Helle, T. Hinz, H. Kirchhoffer, H. Lakshman, T. Nguyen,S. Oudin, M. Siekmann, K. Suhring, M. Winken, and T. Wiegand. Video compression using nestedquadtree structures, leaf merging, and improved techniques for motion representation and entropy cod-ing. IEEE Trans. on Circuits and Systems for Video Technology, pages 1676–1687, 2010.
[122] F. Marques, M. Pardas, and R. Morros. Object matching based on partition information. In ICIP (2),pages 829–832, 2002.
[123] F. Marques, P. Salembier, M. Pardas, J. Morros, I. Corset, S. Jeannin, B. Marcotegui, and F. Meyer.A segmentation-based coding system allowing manipulation of objects (sesame). In IEEE InternationalConference of Image Processing, pages III: 679–682, 1996.
[124] D. Martin, C. Fowlkes, D. Tal, and J. Malik. A database of human segmented natural images and itsapplication to evaluating segmentation algorithms and measuring ecological statistics. In Proc. 8th Int’lConf. Computer Vision, volume 2, pages 416–423, July 2001.
[125] D. R. Martin, C. C. Fowlkes, and J. Malik. Learning to detect natural image boundaries using localbrightness, color, and texture cues. IEEE Trans. Pattern Anal. Mach. Intell., 26:530–549, May 2004.
[126] C. Mehlfuhrer, M. Wrulich, J. C. Ikuno, D. Bosanska, and M. Rupp. Simulating the Long Term EvolutionPhysical Layer. In Proc. of the 17th European Signal Processing Conference, August 2009.
[127] M. Mignotte. Mds-based multiresolution nonlinear dimensionality reduction model for color imagesegmentation. Neural Networks, IEEE Transactions on, 22(3):447 –460, march 2011.
[128] A. Mohr, E. A. Riskin, and R. E. Ladner. Unequal Loss Protection : Graceful degradation of imagequality over packet erasure channels through forward error correction. Journal on Selected Areas inCommunications, 18(6):819–828, June 2000.

144 BIBLIOGRAPHY
[129] L. Morin. Modelisation 3d pour la communication video. Habilitation a Diriger des Recherches -IRISA-IFSIC, Universite de Rennes 1, France, may 2006.
[130] J. Morros and F. Marques. A proposal for dependent optimization in scalable region-based codingsystems. In Image Processing, 1999. ICIP 99. Proceedings. 1999 International Conference on, volume 4,pages 295–299, October 1999.
[131] J. Motsch, M. Babel, and O. Deforges. Joint Lossless Coding and Reversible Data Embedding ina Multiresolution Still Image Coder. In Proc. of European Signal Processing Conference, EUSIPCO,pages 1–4, Glasgow UK, 08 2009.
[132] J. Motsch, O. Deforges, and M. Babel. Embedding Multilevel Image Encryption in the LAR Codec. InIEEE Communications International Conference 06, Bucharest, Romania, Juin 2006.
[133] P. Ndjiki-Nya, D. Doshkov, and M. Koppel. Optimization of video synthesis by means of cost-guidedmultimodal photometric correction. In Image and Signal Processing and Analysis, 2009. ISPA 2009.Proceedings of 6th International Symposium on, pages 111 –116, sept. 2009.
[134] P. Ndjiki-Nya, T. Hinz, and T. Wiegand. Generic and robust video coding with texture analysis andsynthesis. In 2007 IEEE ICME, pages 1447–1450, 2007.
[135] V. A. Nguyen, Z. Chen, and Y.-P. Tan. Video enhancement from multiple compressed copies in transformdomain. J. Image Video Process., 2010:5:1–5:18, January 2010.
[136] S. Nogaki and M. Ohta. An overlapped block motion compensation for high quality motion picturecoding. In Proceedings of IEEE International Symposium on Circuits and Systems, volume 5, pages427–440, Apr 1992.
[137] L. Nordenfelt. Dignity in Care for Older People. Wiley-Blackwell, 2009.
[138] T. Ochotta and D. Saupe. Edge-based partition coding for fractal image compression. The ArabianJournal for Science and Engineering, Special Issue on Fractal and Wavelet Methods, 29(2C):63–83,December 2004.
[139] M. S. Ogawa. wg1n5583 Compare experiment of execution speed JPEG/JPEG2000/JPEGXR. Technicalreport, ISO/ITU JPEG commitee, ICT-Link, October 2010.
[140] M. T. Orchard and G. J. Sullivan. Overlapped Block Motion Compensation: an estimation theoreticapproach. IEEE Transactions on Image Processing, 3(5):693–699, Sep 1994.
[141] C. Pang, O. C. Au, J. Dai, F. Zou, W. Yang, and M. Yang. Laplacian mixture model(lmm) basedframe-layer rate control method for h.264/avc high-definition video coding. In ICME, pages 25–29,2010.
[142] F. Pasteau. Statistical study of a predictive codec : a LAR-based robust and flexible framework. PhDthesis, INSA Rennes, November 2011.
[143] F. Pasteau, M. Babel, O. Deforges, and L. Bedat. Interleaved S+P Scalable Coding with Inter-CoefficientClassification Methods. In Proc. of the EUSIPCO’08, pages 1–5, Lausanne, Suisse, Aug. 2008.
[144] F. Pasteau, C. Strauss, M. Babel, O. Deforges, and L. Bedat. Improved colour decorrelation for losslesscolour image compression using the LAR codec. In Proceedings of EUSIPCO’09, pages 1–4, Glasgow,Royaume-Uni, Aug. 2009.
[145] F. Pasteau, C. Strauss, M. Babel, O. Deforges, and L. Bedat. Adaptive colour decorrelation for predictiveimage codecs. In Proc. of EUSIPCO 2011, pages 1–5, Barcelona, Espagne, Aug. 2011.
[146] B. Pesquet-Popescu. Scalabilite et robustesse en codage video. Habilitation thesis, Universite de NiceSophia-Antipolis, October 2005.
[147] Y. Pitrey. Strategies d’encodage pour codeur video scalable (Coding strategies for scalable video coder).PhD thesis, INSA Rennes, September 2009.

BIBLIOGRAPHY 145
[148] Y. Pitrey, M. Babel, O. Deforges, and J. Vieron. ρ-domain based rate control scheme for spatial,temporal and quality scalable video coding. SPIE Electronic Imaging (VCIP), 2008.
[149] D. Pitzalis, R. Pillay, and C. Lahanier. A new Concept in high Resolution Internet Image Browsing. In10th International Conference on Electronic Publishing (ELPUB), June 2006.
[150] M. Pressigout and E. Marchand. Real-time 3d model-based tracking: Combining edge and textureinformation. In IEEE ICRA06, pages 2726–2731, 2006.
[151] F. Racape. Mise en Oeuvre de Techniques d’Analyse/Synthese de Texture dans un Schema de Com-pression Video. PhD thesis, INSA Rennes, November 2011.
[152] F. Racape, S. Lefort, E. Francois, M. Babel, O. Deforges, and Racape. Adaptive pixel/patch-basedsynthesis for texture compression. In Proc. of ICIP 2011, pages 1–4, Brussels, Belgique, Sept. 2011.
[153] F. Racape, S. Lefort, D. Thoreau, M. Babel, and O. Deforges. Characterization and adaptive texturesynthesis-based compression scheme. In In Proc. of EUSIPCO 2011, pages 1–5, Espagne, Aug. 2011.
[154] M. Raulet, M. Babel, J.-F. Nezan, O. Deforges, and Y. Sorel. Automatic Coarse Grain Partitioning andAutomatic Code Generation for Heterogeneous Architectures. In IEEE Workshop on Signal ProcessingSystems (SIPS’03), pages 27–29, Seoul, Korea, August 2003.
[155] I. Reed and G. Solomon. Polynomial Codes Over Certain Finite Fields. Journal of the Society ofIndustrial and Applied Mathematics (SIAM), 2:300–304, June 1960.
[156] J. Reichel, H. Schwarz, and M. Wien. Scalable video coding - joint draft 4. Technical report, JointVideo Team, doc. JVT-Q201, 2005.
[157] A. Remazeilles and F. Chaumette. Image-based robot navigation from an image memory. Robot. Auton.Syst., 55:345–356, April 2007.
[158] J. Ribas-Corbera and S. Lei. Rate control in DCT video coding for low-delay communications. Circuitsand Systems for Video Tech., IEEE Trans. on, 9(1):172–185, Feb 1999.
[159] D. T. Richter. wg1n4558 JPEG-XR core experiment results with objectiv metrics. Technical report,ISO/ITU JPEG commitee, University of Stuttgart, April 2008.
[160] T. Richter. wg1n5681 AIC core experiment 2. Technical report, ISO/ITU JPEG commitee, UniversitatStuttgart, February 2011.
[161] J. Rissanen and G. G. Langdon. Arithmetic coding. IBM Journal of Research and Development,23(2):149–162, Mar. 1979.
[162] M. Robins. Delivering optimal Quality of Experience (QoE) for IPTV success. Whitepaper, SpirentCommunications, February 2006.
[163] C. Rougier, E. Auvinet, J. Rousseau, M. Mignotte, and J. Meunier. Fall detection from depth mapvideo sequences. In B. Abdulrazak, S. Giroux, B. Bouchard, H. Pigot, and M. Mokhtari, editors,ICOST, volume 6719 of Lecture Notes in Computer Science, pages 121–128. Springer, 2011.
[164] A. Roussos and P. Maragos. Reversible interpolation of vectorial images by an anisotropic Diffusion-Projection PDE. International Journal of Computer Vision, 84:130–145, 2009. 10.1007/s11263-008-0132-x.
[165] S. A. Ruzinski. SAR Image Processor. http://www.general-cathexis.com/.
[166] M. Sabha, P. Peers, and P. Dutre. Texture synthesis using exact neighborhood matching. ComputerGraphics Forum, 26(2):131–142, 2007.
[167] K. Sakamura. Digital Museum - Distributed Museum Concept for the 21st Century, 2000.

146 BIBLIOGRAPHY
[168] P. Salembier, F. Marques, M. Pardas, J. Morros, I. Corset, S. Jeannin, L. Bouchard, F. Meyer, andB. Marcotegui. Segmentation-based video coding system allowing the manipulation of objects. Circuitsand Systems for Video Technology, IEEE Transactions on, 7(1):60 –74, feb 1997.
[169] P. Schelkens, A. Skodras, and T. Ebrahimi. The JPEG 2000 Suite. John Wiley and Sons, Oct. 2009.
[170] H. Schwarz, D. Marpe, and T. Wiegand. Hierarchical b pictures. Technical report, Joint Video Team,doc. JVT-P014, 2002.
[171] H. Schwarz, D. Marpe, and T. Wiegand. Further results on constrained inter-layer prediction. Technicalreport, Joint Video Team, doc. JVT-O074, 2005.
[172] N. Sebe, M. S. Lew, and D. P. Huijsmans. Toward improved ranking metrics. IEEE Transactions onPattern Analysis and Machine Intelligence, 22:1132–1143, 2000.
[173] C. Shaffer and H. Samet. Optimal Quadtree Construction Algorithms. Computer Vision, Graphics,Image processing, 37(3):402–419, March 1987.
[174] G. Sharma, W. Wu, and E. N. Dalal. The CIEDE2000 color-difference formula: Implementation notes,supplementary test data, and mathematical observations. Color Research & Application, 30:21–30,2005.
[175] I. Shin, Y. Lee, and H. Park. Rate control using linear rate-ρ model for h.264. Signal Processing - ImageCommunication, 4:341–352, 2004.
[176] G. Simon and M.-O. Berger. Pose estimation for planar structures. Computer Graphics and Applications,IEEE, 22(6):46 – 53, nov/dec 2002.
[177] F. D. Simone, D. Ticca, F. Dufaux, M. Ansorge, and T. Ebrahimi. A comparative study of colorimage compression standards using perceptually driven quality metrics. In Proceedings of SPIE, pages70730Z–11, San Diego, CA, USA, 2008.
[178] F. Smach, C. Lemaıtre, J. Gauthier, J. Miteran, and M. Atri. Generalized Fourier descriptors withapplications to objects recognition in SVM context. Journal of Mathematical Imaging and Vision,30(1):43–71, 2008.
[179] http://ip.hhi.de/imagecom G1/savce/downloads/. JSVM Reference Software. Version 8.6.
[180] G. Sreelekha and P. Sathidevi. An improved jpeg compression scheme using human visual system model.Systems, Signals and Image Processing, 2007 and 6th EURASIP Conference focused on Speech andImage Processing, Multimedia Communications and Services. 14th International Workshop on, pages98–101, June 2007.
[181] M. Stojmenovic, A. Solis-Montero, and A. Nayak. Colour and texture based pyramidal image segmen-tation. In 2010 International Conference on Audio Language and Image Processing (ICALIP), pages778–786. IEEE, Nov. 2010.
[182] C. Strauss. Low complexity methods for interpolation and pseudo semantic extraction: applications inthe LAR codec. PhD thesis, INSA Rennes, November 2011.
[183] C. Strauss, F. Pasteau, F. Autrusseau, M. Babel, L. Bedat, and O. Deforges. Subjective and ObjectiveQuality Evaluation of LAR coded Art Images. In Proceedings of IEEE International Conference onMultimedia and Expo, ICME’09, pages 1–4, Cancun, Mexique, July 2009.
[184] P. Strobach. Tree-Structured Scene Adaptive Coder. IEEE Trans. on Communication, 38(4):477–486,April 1990.
[185] T. Strutz and E. Muller. Image data compression with pdf-adaptive reconstruction of wavelet coefficients.In Proceedings of SPIE - The International Society for Optical Engineering, pages 747–758, 1995.

BIBLIOGRAPHY 147
[186] G. J. Sullivan and R. L. Baker. Motion compensation for video compression using control grid interpo-lation. In Proceedings of International Conference on Speech and Signal Processing, pages 2713–2716.IEEE, 1991.
[187] K. Tahboub and H. Asada. A compliant semi-autonomous reactive control architecture applied to roboticholonomic wheelchairs. In Advanced Intelligent Mechatronics, 1999. Proceedings. 1999 IEEE/ASMEInternational Conference on, pages 665 –670, 1999.
[188] D. Taubman and A. Zakhor. Multirate 3-d subband coding of video. IEEE Transactions on ImageProcessing, 3(5):572–588, Sep 1994.
[189] D. S. Taubman and M. W. Marcellin. JPEG2000: Image Compression Fundamentals, Standards, andPractice. Kluwer Academic Publishers, 2001.
[190] D. M. Thomas. A study on block matching algorithms and gradient based method for motion esti-mation in video compression. In D. Nagamalai, E. Renault, and M. Dhanuskodi, editors, Advances inDigital Image Processing and Information Technology, volume 205 of Communications in Computer andInformation Science, pages 136–145. Springer Berlin Heidelberg, 2011.
[191] J. Tian and R. O. Wells. Reversible data-embedding with a hierarchical structure. In ICIP, volume 5,pages 3419–3422, Oct. 2004.
[192] A. M. Tourapis. Enhanced predictive zonal search for single and multiple frame motion estimation. InSPIE VCIP’02, pages 1069–1079, 2002.
[193] A. M. Tourapis. JM reference software version 14.0. Doc. JVT-AE010, Joint Video Team (JVT) ofISO/IEC MPEG & ITU-T VCEG, London, UK, 2009.
[194] D. Tschumperle and R. Deriche. Vector-valued image regularization with pdes: A common frameworkfor different applications. IEEE Transactions on Pattern Analysis and Machine Intelligence, 27:506–517,2005.
[195] M. Urvoy. Les tubes de mouvement : nouvelle representation pour les sequences d’images (Motiontubes: a new representation for image sequences). PhD thesis, INSA Rennes, March 2011.
[196] M. Urvoy, N. Cammas, S. Pateux, O. Deforges, M. Babel, and M. Pressigout. Motion tubes for therepresentation of images sequences. In Proceedings of ICME’09, pages 1–4, Cancun, Mexique, July2009.
[197] S. R. Vantaram, E. Saber, S. Dianat, M. Shaw, and R. Bhaskar. An adaptive and progressive approachfor efficient gradient-based multiresolution color image segmentation. In Proceedings of the 16th IEEEinternational conference on Image processing, ICIP’09, pages 2345–2348, Piscataway, NJ, USA, 2009.IEEE Press.
[198] A. Wang, Z. Xiong, P. A. Chou, and S. Mehrotra. Three-dimensional wavelet coding of video withglobal motion compensation. In Proceedings of Data Compression Conference (DCM’99), pages 404–413, 1999.
[199] Y. Wang, S. Rane, P. Boufounos, and A. Vetro. Distributed Compression of Zerotrees of WaveletCoefficients. In IEEE International Conference on Image Processing (ICIP), September 2011.
[200] A. Watson, G. Yang, J. Solomon, and J. Villasenor. Visibility of wavelet quantization noise. ImageProcessing, IEEE Transactions on, 6(8):1164–1175, 1997.
[201] L.-Y. Wei and M. Levoy. Fast texture synthesis using tree-structured vector quantization. In Proceedingsof ACM SIGGRAPH, pages 479–488, New York, USA, 2000.
[202] M. Weinberger, G. Seroussi, and G. Sapiro. Loco-i : a low complexity, context-based, lossless imagecompression algorithm. Proc. Of the IEEE Data Compression Conference, pages 141–150, 1996.

148 BIBLIOGRAPHY
[203] M. J. Weinberger, G. Seroussi, and G. Sapiro. LOCO-I: A low complexity, context-based, lossless imagecompression algorithm. In Proc. on Data Compression conference, pages 140–149, Snowbird, UT, March1996.
[204] W. Wharton. Principles of television reception. Pitman, London, 1971.
[205] T. Wiegand and H. Schwarz. Source Coding: Part I of Fundamentals of Source and Video Coding,Foundations and Trends in Signal Processing, volume 4. Foundations and Trends in Signal Processing,2011.
[206] T. Wiegand, G. Sullivan, G. Bjontegaard, and A. Luthra. Overview of the h.264/avc video codingstandard. Circuits and Systems for Video Tech., IEEE Trans. on, 13(7):560–576, July 2003.
[207] T. Wiegand, G. Sullivan, J. Reichel, H. Schwarz, and M. Wien. Joint Draft 10 of SVC amendment.Doc. JVT-W201, Joint Video Team (JVT) of ISO/IEC MPEG & ITU-T VCEG, San Jose, CA, USA,Apr. 2007.
[208] T. Wiegand, G. Sullivan, J. Reichel, H. Schwarz, and M. Wien. WD2: Working Draft 2 of High-EfficiencyVideo Coding. Doc. JCTVC-D503, Joint Collaborative Team on Video Coding (JCT-VC) ITU-T SG16WP3 and ISO/IEC JTC1/SC29/WG11, San Jose, CA, USA, Jan. 2011.
[209] P. Willemin, T. Reed, and M. Kunt. Image Sequence Coding by Split and Merge. IEEE Trans. onCommunication, 39(12):1845–1855, December 1991.
[210] J. Wolf, A. Wyner, and J. Ziv. Source coding for multiple description. Bell System Technical Journal,59(8):1417–1426, 1980.
[211] X. Wu. Lossless Compression of Continuous-Tone Images, via Context Selection, Quantization andModelling. IEEE Trans. on Image Processing, 6(5):656–664, May 1997.
[212] X. Wu, G. Zhai, X. Yang, and W. Zhang. Adaptive sequential prediction of multidimensional signalswith applications to lossless image coding. Image Processing, IEEE Transactions on, 20(1):36 –42, jan.2011.
[213] Z. Xiong, X. Sun, and F. Wu. Block-based image compression with parameter-assistant inpainting.Image Processing, IEEE Transactions on, 19(6):1651 –1657, June 2010.
[214] L. Xu, S. Ma, D. Zhao, and W. Gao. Rate control for scalable video model. In Visual Communicationsand Image Processing., volume 5960, pages 525–534, 2005.
[215] X. Yang and K. Ramchandran. A low-complexity region-based video coder using backward morphologicalmotion field segmentation. In IEEE Transactions on Image Processing, volume 8, pages 332–345, March1999.
[216] G. S. Yovanof and S. Liu. Statistical analysis of the DCT coefficients and their quantization error.In 1996 Conference Record of the Thirtieth Asilomar Conference on Signals, Systems and Computers,1996, volume 1, pages 601–605, Nov. 1996.
[217] L. Yuan Wu and Z. Shouxun. Optimum bit allocation and rate control for H.264/AVC. Technical report,Joint Video Team, doc. JVT-O016, 2005.
[218] L. L. Yz and S. K. M. Y. Color Image Segmentation: A State-of-the-Art Survey. Proceedings of theIndian National Science Academy, 67(2):207–221, 2001.
[219] X. Zhao, J. Sun, S. Ma, and W. Gao. Novel statistical modeling, analysis and implementation ofrate-distortion estimation for h.264/avc coders. IEEE Transactions on Circuits and Systems for VideoTechnology, 20(5):647–660, May 2010.
[220] C. Zhu, X. Sun, F. Wu, and H. Li. Video coding with spatio-temporal texture synthesis. In Multimediaand Expo, 2007 IEEE International Conference on, pages 112 –115, july 2007.

From image coding and representation to robotic vision
Abstract. This habilitation thesis is first devoted to applications related to image representation andcoding. If the image and video coding community has been traditionally focused on coding standardizationprocesses, advanced services and functionalities have been designed in particular to match content deliverysystem requirements. In this sense, the complete transmission chain of encoded images has now to beconsidered.
To characterize the ability of any communication network to insure end-to-end quality, the notionof Quality of Service (QoS) has been introduced. First defined by the ITU-T as the set of technologiesaiming at the degree of satisfaction of a user of the service, QoS is rather now restricted to solutionsdesigned for monitoring and improving network performance parameters. However, end users are usuallynot bothered by pure technical performances but are more concerned about their ability to experience thedesired content. In fact, QoS addresses network quality issues and provides indicators such as jittering,bandwidth, loss rate...
An emerging research area is then focused on the notion of Quality of Experience (QoE, also abbreviatedas QoX), that describes the quality perceived by end users. Within this context, QoE faces the challengeof predicting the behaviour of any end users. When considering encoded images, many technical solutionscan considerably enhance the end user experience, both in terms of services and functionalities, as wellas in terms of final image quality. Ensuring the effective transport of data, maintaining security whileobtaining the desired end quality remain key issues for video coding and streaming.
First parts of my work are then to be seen within this joint QoS/QoE context. From efficient codingframeworks, additional generic functionalities and services such as scalability, advanced entropy coders,content protection, error resilience, image quality enhancement have been proposed.
Related to advanced QoE services, such as Region of Interest definition of object tracking and recog-nition, we further closely studied pseudo-semantic representation. First designed toward coding purposes,these representations aim at exploiting textural spatial redundancies at region level.
Indeed, research, for the past 30 years, provided numerous decorrelation tools that reduce the amountof redundancies across both spatial and temporal dimensions in image sequences. To this day, the classicalvideo compression paradigm locally splits the images into blocks of pixels, and processes the temporal axison a frame by frame basis, without any obvious continuity. Despite very high compression performancessuch as AVC and forthcoming HEVC standards , one may still advocate the use of alternative approaches.Disruptive solutions have also been proposed, and offer notably the ability to continuously process thetemporal axis. However, they often rely on complex tools (e.g. Wavelets, control grids) whose use is ratherdelicate in practice.
We then investigate the viability of alternative representations that embed features of both classicaland disruptive approaches. The objective is to exhibit the temporal persistence of the textural information,through a time-continuous description.
At last, from this pseudo-semantic level of representation, texture tracking system up to object trackingcan be designed. From this technical solution, 3D object tracking is a logical outcome, in particular whenconsidering vision robotic issues.