Embed Size (px)
Citation preview
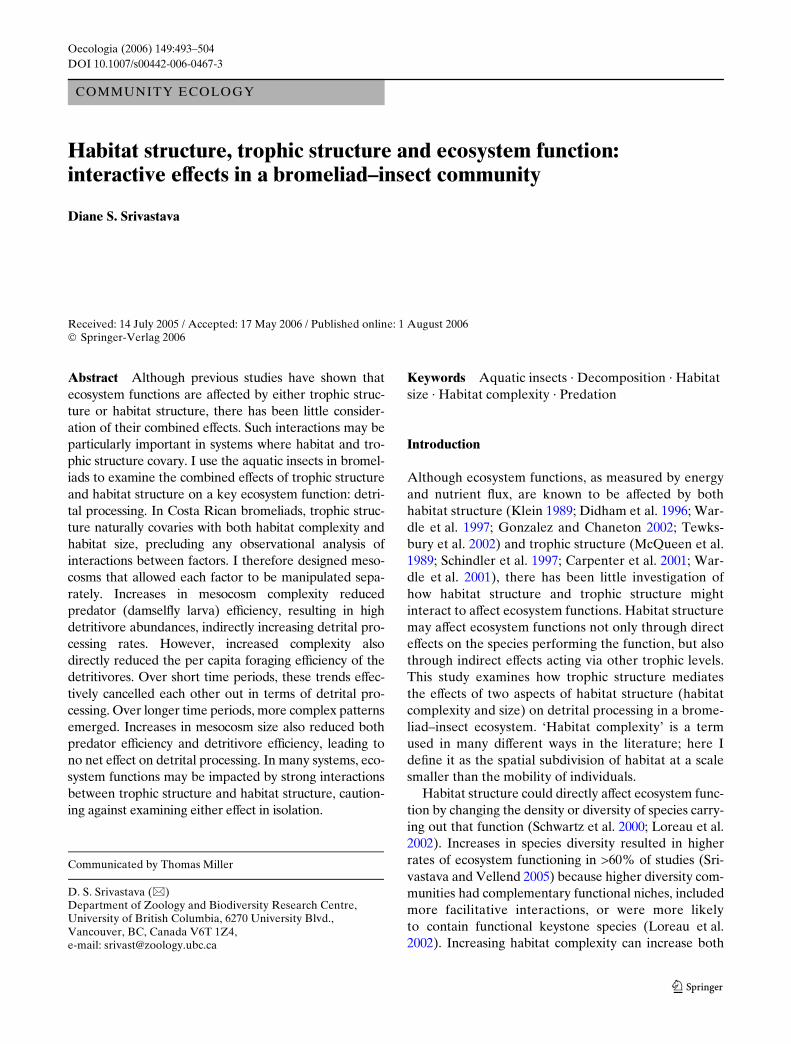
Oecologia (2006) 149:493–504
DOI 10.1007/s00442-006-0467-3COMMUNITY ECOLOGY
Habitat structure, trophic structure and ecosystem function: interactive eVects in a bromeliad–insect community
Diane S. Srivastava
Received: 14 July 2005 / Accepted: 17 May 2006 / Published online: 1 August 2006© Springer-Verlag 2006
Abstract Although previous studies have shown thatecosystem functions are aVected by either trophic struc-ture or habitat structure, there has been little consider-ation of their combined eVects. Such interactions may beparticularly important in systems where habitat and tro-phic structure covary. I use the aquatic insects in bromel-iads to examine the combined eVects of trophic structureand habitat structure on a key ecosystem function: detri-tal processing. In Costa Rican bromeliads, trophic struc-ture naturally covaries with both habitat complexity andhabitat size, precluding any observational analysis ofinteractions between factors. I therefore designed meso-cosms that allowed each factor to be manipulated sepa-rately. Increases in mesocosm complexity reducedpredator (damselXy larva) eYciency, resulting in highdetritivore abundances, indirectly increasing detrital pro-cessing rates. However, increased complexity alsodirectly reduced the per capita foraging eYciency of thedetritivores. Over short time periods, these trends eVec-tively cancelled each other out in terms of detrital pro-cessing. Over longer time periods, more complex patternsemerged. Increases in mesocosm size also reduced bothpredator eYciency and detritivore eYciency, leading tono net eVect on detrital processing. In many systems, eco-system functions may be impacted by strong interactionsbetween trophic structure and habitat structure, caution-ing against examining either eVect in isolation.
Keywords Aquatic insects · Decomposition · Habitat size · Habitat complexity · Predation
Introduction
Although ecosystem functions, as measured by energyand nutrient Xux, are known to be aVected by bothhabitat structure (Klein 1989; Didham et al. 1996; War-dle et al. 1997; Gonzalez and Chaneton 2002; Tewks-bury et al. 2002) and trophic structure (McQueen et al.1989; Schindler et al. 1997; Carpenter et al. 2001; War-dle et al. 2001), there has been little investigation ofhow habitat structure and trophic structure mightinteract to aVect ecosystem functions. Habitat structuremay aVect ecosystem functions not only through directeVects on the species performing the function, but alsothrough indirect eVects acting via other trophic levels.This study examines how trophic structure mediatesthe eVects of two aspects of habitat structure (habitatcomplexity and size) on detrital processing in a brome-liad–insect ecosystem. ‘Habitat complexity’ is a termused in many diVerent ways in the literature; here IdeWne it as the spatial subdivision of habitat at a scalesmaller than the mobility of individuals.
Habitat structure could directly aVect ecosystem func-tion by changing the density or diversity of species carry-ing out that function (Schwartz et al. 2000; Loreau et al.2002). Increases in species diversity resulted in higherrates of ecosystem functioning in >60% of studies (Sri-vastava and Vellend 2005) because higher diversity com-munities had complementary functional niches, includedmore facilitative interactions, or were more likelyto contain functional keystone species (Loreau et al.2002). Increasing habitat complexity can increase both
Communicated by Thomas Miller
D. S. Srivastava (&)Department of Zoology and Biodiversity Research Centre, University of British Columbia, 6270 University Blvd., Vancouver, BC, Canada V6T 1Z4, e-mail: [email protected]
123

494 Oecologia (2006) 149:493–504
density and diversity by creating new niches for species(MacArthur 1972; Denno and Roderick 1991; Uetz1991) or reducing rates of competitive encounters (Beck2000; Young 2001). Increases in habitat size may resultin increased density and diversity because of greateropportunities for specialization or increased likelihoodof immigration (MacArthur and Wilson 1967). Forexample, forest fragmentation in the Amazon results inreduced dung decomposition rates, likely due to reduc-tions in density, species richness and body size of dungand carrion beetles (Klein 1989). Habitat complexityand size could also aVect the per capita eYciency oforganisms performing the function. For example,increasing the complexity of saltmarsh vegetation resultsin greater eYciency of wolf spiders in herbivore suppres-sion—an ecosystem function (Denno et al. 2002).
Habitat structure could also have indirect eVects onecosystem functions, by changing either top–down orbottom–up control of the trophic level performing thefunction. Habitat complexity and size have often beenshown to aVect predation rates, for example by provid-ing absolute or stochastic refuges to prey (Luckinbill1974; Crowder and Cooper 1982; Beukers and Jones1997; Nemeth 1998; Floater 2001; Almany 2004; Langell-otto and Denno 2004). Such predator-mediated eVectsof complexity on prey densities can cascade throughmultiple trophic levels, aVecting ecosystem functionscarried out by lower trophic levels (Power 1992; Dennoet al. 2002; Finke and Denno 2002). Even the threat ofpredation is enough to potentially aVect ecosystem func-tions when prey species respond by modifying their for-aging behavior (Lima 1998; Warfe and Barmuta 2004).
The direct and indirect eVects of habitat structureare examined here in a bromeliad–insect ecosystem. Abroad suite of aquatic insect larvae and microbes colo-nize water trapped by the tightly interlocking leaves ofphytotelm bromeliads (Picado 1913; Laessle 1961;Frank 1983; Richardson 1999; Armbruster et al. 2002).The insects include both detritivores and their preda-tors. Phytotelm bromeliads are usually composed ofmultiple compartments, with each leaf collecting a sep-arate compartment of water and detritus. Most aquaticinsects (except mosquitoes) can move between com-partments by traversing the juncture between overlap-ping leaves. Thus bromeliads can provide highlycomplex habitats for insects. An useful index of habitatcomplexity in this system is the number of leaves subdi-viding a standard volume of water into compartments.Detritus is the basal resource of the insect and micro-bial food webs in bromeliads (Richardson 1999), andthe main source of nitrogen for epiphytic bromeliads(Reich et al. 2003). Processing of detritus by insects,when coupled with predation, facilitates the uptake of
nitrogen by bromeliads (J. Ngai and D. Srivastava,unpublished results). Detrital processing—the loss ofintact detritus through insect feeding—is therefore akey process in this miniature ecosystem.
Growth of bromeliads, conversely, aVects theiraquatic insect communities. In bromeliads in northwestCosta Rica, increases in bromeliad size covary withchanges in both habitat and trophic structure. Largerbromeliads have lower detritivore densities, reducedhabitat complexity (deWned as the number of leavessubdividing a standard volume of water) and increasedincidence of predacious damselXy larvae (Fig. 1).Other phytotelm studies show covariance betweenhabitat size, habitat complexity and insects. Macrofa-unal richness in Ecuadorian bromeliads is positivelycorrelated with both bromeliad complexity and brome-liad size (Armbruster et al. 2002). Larger treeholes arereported to have higher occurrence of predatory dam-selXy larvae (Fincke 1992) and predatory mosquitolarvae (Bradshaw and Holzapfel 1988).
Fig. 1 Bromeliad architecture and the aquatic insect communitychange over a gradient in bromeliad water-holding capacity. Hab-itat complexity (measured as the number of bromeliad leavessubdividing a standard volume of water) decreases as bromeliadcapacity increases (ANCOVA F1,87 =1,193, P <0.0001, both vari-ables log-transformed). Detritivore density also declines as bro-meliad capacity increases (ANCOVA, F1,52 =32.2, P <0.0001,both variables log-transformed). The two main genera of tank-forming bromeliads, Guzmania (circles) and Vriesea (triangles),diVer slightly in complexity (ANCOVA F1,87 =11.6, P =0.001,small symbols) but not in detritivore density (genera: F2,51 =0.003,P =0.96; genera £ capacity: F2,50 =0.54, P =0.46, large symbols).DamselXy occurrence increases with bromeliad capacity (opensmall symbols damselXies absent, solid small symbols damselXiespresent). Bromeliad complexity and damselXy occurrence dataare from 92 bromeliads collected in 1997 (22 bromeliads), 2000(51 bromeliads including 31 previously reported in Melnychukand Srivastava 2002) and 2002 (19 bromeliads). Detritivore den-sity data were recorded for 58 of these bromeliads (20 bromeliadsin both 1997 and 2000, and 18 in 2002). Methods for bromeliadmeasurements and insect surveys followed those described inMelnychuk and Srivastava (2002)
0.001
0.01
0.1
1
10
100
0.1 1 10 100 1000 100000.001
0.01
0.1
1
10
100
0.1 1 10 100 1000 10000
Det
riti
vore
den
sity
(i
nse
cts
ml-1
)
0.0001
0.001
0.01
0.1
1
10
Guzmania Vriesea
Detritivore densityComplexity
Co
mp
lexi
ty (
leav
es m
l-1)
Damselflies absent Damselflies present
Bromeliad capacity (ml)
123

Oecologia (2006) 149:493–504 495
This strong covariance between habitat characteristicsand the insect community precludes any observationalanalysis of how each factor aVects detrital processingrates. Instead, I designed mesocosms to disentangle thepotential inXuences of habitat size, habitat complexity,and predator presence on detrital processing rates. Thesefactorial experiments examine the eVects of changinghabitat structure on a constant community of insects,allowing any treatment eVects to be unambiguouslyattributed to changes in habitat structure rather thancovarying changes in insect abundance. Note that detriti-vore density is thus manipulated solely by changing mes-ocosm size. I predicted that bromeliad structure wouldaVect detrital processing through both direct eVects ondetritivore insects (changes in detritivore foraging rates)and by indirect eVects via predatory insects (changes inpredation rates on detritivores). SpeciWcally, I hypothe-sized that: (1) increased habitat complexity—but notsize—will impede the mobility of the detritivores andtherefore their eYciency in locating resources, directlyreducing rates of detrital processing; and (2) bothincreased habitat complexity and size will reduce the rateat which predators encounter detritivores, thus reducingtop–down control of detrital processing.
Materials and methods
Study site and system
All experiments and surveys were carried out at theEstación Biológica Pitilla (10°59�N, 85°26�W) in theÁrea de Conservación Guanacaste, north-westernCosta Rica. The mid-elevation tropical rainforestsurrounding the station has high densities of bromel-iads, particularly in the genera Guzmania and Vrie-sea (Melnychuk and Srivastava 2002). The speciespool for bromeliad-dwelling insects in this region isin excess of 50 species. Aquatic insects occur only aslarvae in the bromeliad; the adults are all winged andterrestrial except in the case of a rare hydrophilidbeetle (aquatic larvae and adults). The dominantdetritivores in the system are larvae of tipulids(Trentepholia spp., undescribed: Diptera), chirono-mids (especially Polypedilum sp.: Diptera), and scirt-ids (Coleoptera). The dominant predator in thesystem is Mecistogaster modesta Selys (Pseudostig-matidae: Odonata), common in bromeliads > 100 mlin capacity (Fig. 1). This damselXy larvae accountsfor 85–90% of total predator biomass in bromeliadswhere it occurs; the remaining predator biomass iscomposed of tabanids, tanypodine chironomids,ceratopogonids and hydrophilid beetles.
Mesocosms as experimental units
Two experiments were conducted in artiWcial meso-cosms that mimicked bromeliad structure (Fig. 2).Mesocosms were necessary to allow assembly of repli-cate insect communities as it is impossible to removeall insects from a real bromeliad without destroying thewater-holding capability of the plant. Insect growthappears roughly comparable between artiWcial and nat-ural bromeliads. For example, the damselXy larvae inthe experiments grew in mass from 0 to 2.2% per day(mean =0.45%, SD =0.67, n =46) in mesocosms. In nat-ural bromeliads we have measured growth rates of sim-ilar range, 0–2.1% per day, but with a higher mean(mean =1.20%, SD =0.98, n =10; D. Srivastava, J. Wareand J. HuV, unpublished data). Mesocosms wereplaced in a random array on a 1.3£1.3 m table, andkept on a shaded outdoor veranda, that is, at ambientconditions similar to those in the adjacent rainforestbut with no natural detrital or insect inputs.
Experiment 1: complexity, predation and decomposition rate
In this experiment, two levels of predation (predatorpresent or absent) were crossed with three levels ofmesocosm complexity (one, three or six leaves), withsix replicates per treatment.
ArtiWcial bromeliads (Fig. 2) were constructed fromgreen plastic cut into leaf shapes and sequentially gluedtogether using aquarium-safe silicon, replicating asmuch as possible the architecture of natural bromel-iads. The outer leaf of each plastic bromeliad was gluedto the inside of a 220 ml plastic cup, this mesocosm sizewill be referred to as “small”. Bromeliad mesocosmswere constructed out of one, three or six leaves, allwith a total mesocosm volume of 95 ml water (i.e. the
Fig. 2a, b The experimental design for both experiments de-scribed in this study. The artiWcial bromeliad mesocosms areshown from the top (a) or side (b)
Top trophic level
(Expt. 1 & 2)
Bromeliad complexity(Expt. 1 & 2)
Bromeliad size (Expt. 2 only)
X
X
1 leaf 3 leaves 6 leaves
Small Large
Present Absent
Plasticcup
Plasticleaf
Water line
Small 3-leaf bromeliad
mimic
Top trophic level
(Expt. 1 & 2)
Bromeliad complexity(Expt. 1 & 2)
Bromeliad size (Expt. 2 only)
X
X
1 leaf 3 leaves 6 leaves
Small Large
Present Absent
Plasticcup
Plasticleaf
Water line
Small 3-leaf bromeliad
mimic
Top trophic level
(Expt. 1 & 2)
Bromeliad complexity(Expt. 1 & 2)
Bromeliad size (Expt. 2 only)
X
X
1 leaf 3 leaves 6 leaves1 leaf 3 leaves 6 leaves1 leaf 3 leaves 6 leaves
Small LargeSmall Large
Present Absent
Plasticcup
Plasticleaf
Water line
Small 3-leaf bromeliad
mimic
(a) (b)
123

496 Oecologia (2006) 149:493–504
one-leaf mesocosms had one large compartmentwhereas the six-leaf mesocosms had six small compart-ments). Recently fallen dead leaves, representing avariety of species, were collected from nearby rainfor-est and dried at low temperature for 2 h. The driedleaves were hand-crumbled and separated using soilsieves into three size categories: large (2 cm–7 mm),medium (7 mm–850 �m), and Wne (850–250 �m).
A total of 2.2 g (weighed §0.002 g) of leaves wasadded to each mesocosm, based on surveys of detritalto volume ratios in natural bromeliads (D. Srivastava,unpublished data). The size of detrital fragmentsadded to each individual leaf was: 45.5% large frag-ments, 45.5% medium and 9% Wne, simulating thesize distribution of detritus in natural bromeliads (D.Srivastava, unpublished data). Detritus was distrib-uted between leaves of the same mesocosm to obtaina coeYcient of variation of 0.333, similar to thatobserved in natural bromeliads (D. Srivastava,unpublished data). On 28 September 1999, each mes-ocosm received debris, 85 ml settled stream water and10 ml water extracted from nearby natural bromeliadsas a microbial inoculant (all insects were Wrstremoved from this water under £10 magniWcation).Water levels were maintained during the course ofthe experiment by adding appropriate amounts ofstream water.
Three of the most common species of detritivo-rous insect larvae were added to each mesocosm atdensities comparable to that observed in nature(Table 1). Insects were added between 30 Septemberand 2 October (day 1 staggered to allow for harvest-ing over a period of days): ten chironomid larvae(Polypedilum sp., 4 mm), one tipulid larva (an unde-scribed Trentepholia sp., 11–12 mm long), and two
scirtid beetle larvae (unidentiWed sp. 4 and 5 mmlong). Detritivores were randomly distributed amongmesocosm compartments. Twenty-four hours afterall detritivores were added, one damselXy larva (M.modesta, 13–16 mm long, excluding caudal lamellae)was added to the central compartment of half thebromeliads. A second round of detritivore insectswas added mid-experiment, to simulate natural colo-nization: a tipulid larva (12–20 mm long) was addedto all mesocosms on day 14, and on day 25 a scirtidlarva (5–6 mm long) was added. DamselXies were notadded mid-experiment as oviposition by M. modestais rare in the wet season; oviposition occurs primarilyin April and May at this site, and the larval periodlasts more than half a year (D. Srivastava and J. Ngai,unpublished results).
The experiment was destructively sampled on day33. This experimental duration allowed measurableloss of detrital mass while minimizing loss of detriti-vores through pupation (all detritivores in this studyhave larval stages greater than 1 month). Plastic leaveswere removed from each mesocosm, separated, and alllarvae were retrieved. Body lengths of larvae weremeasured, and converted to biomass using empiricallyderived relationships. Pupal cases were recorded. Thequantity of detritus remaining at the end of the experi-ment was measured by sieving the detritus-water mix-ture through an 850 �m soil sieve. Particles retained onthe sieve were dried for 2 days at 55°C and weighed(§0.0001 g).
Growth rates were estimated for tipulid larvae, theonly detritivore species with enough diVerence in ini-tial size between individuals to allow individuals to betracked through time. I restricted the analysis to bro-meliads without predators; otherwise growth and
Table 1 Comparison of insect densities in natural bromeliads and experimental mesocosms
a Only data for bromeliads that contained at least one damselXy larva are reported here. Bromeliads were collected in both primary andsecondary forest in 1997, entirely in primary forest in 2000, and entirely in secondary forest in 2002. Insect densities in experimentalmesocosms are given as a range, where appropriate, to represent net densities before and after mid-experiment addition of further lar-vaeb Predator treatments
Insect densities (individuals per gram dry detritus)a
Polypedilum chironomid larvae
Scirtid beetle larvae
Trentepohlia tipulid larvae
Mecistogaster modesta damselXy larvae
Natural bromeliads with damselXy larvae1997 (mean § SE, n =9) 5.96 § 1.43 7.08 § 1.11 1.60 § 0.41 0.56 § 0.172000 (mean § SE, n =5) 14.25 § 4.38 7.15 § 3.21 1.72 § 0.59 0.17 § 0.052002 (mean § SE, n =11) 6.84 § 2.36 3.27 § 0.97 0.97 § 0.18 0.75 § 0.20
Experimental mesocosmsExperiment 1 4.54 0.9–1.4 0.45–0.91 0.45b
Experiment 2 10–13 3–5 2 1b
123
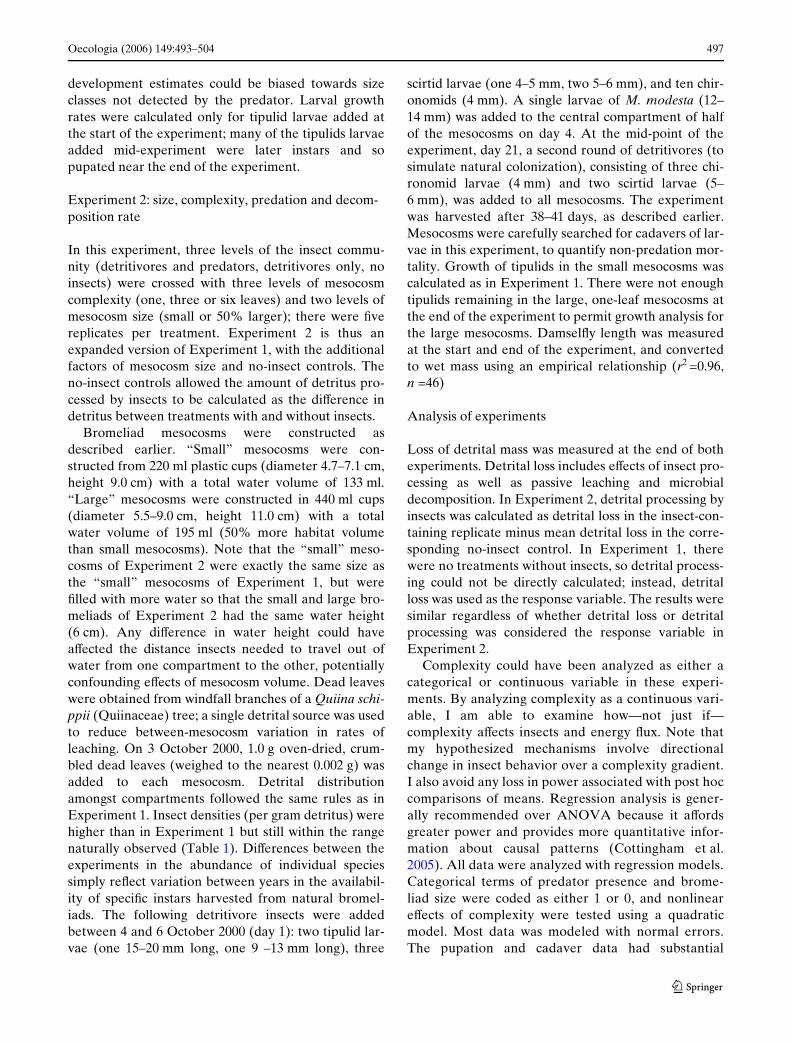
Oecologia (2006) 149:493–504 497
development estimates could be biased towards sizeclasses not detected by the predator. Larval growthrates were calculated only for tipulid larvae added atthe start of the experiment; many of the tipulids larvaeadded mid-experiment were later instars and sopupated near the end of the experiment.
Experiment 2: size, complexity, predation and decom-position rate
In this experiment, three levels of the insect commu-nity (detritivores and predators, detritivores only, noinsects) were crossed with three levels of mesocosmcomplexity (one, three or six leaves) and two levels ofmesocosm size (small or 50% larger); there were Wvereplicates per treatment. Experiment 2 is thus anexpanded version of Experiment 1, with the additionalfactors of mesocosm size and no-insect controls. Theno-insect controls allowed the amount of detritus pro-cessed by insects to be calculated as the diVerence indetritus between treatments with and without insects.
Bromeliad mesocosms were constructed asdescribed earlier. “Small” mesocosms were con-structed from 220 ml plastic cups (diameter 4.7–7.1 cm,height 9.0 cm) with a total water volume of 133 ml.“Large” mesocosms were constructed in 440 ml cups(diameter 5.5–9.0 cm, height 11.0 cm) with a totalwater volume of 195 ml (50% more habitat volumethan small mesocosms). Note that the “small” meso-cosms of Experiment 2 were exactly the same size asthe “small” mesocosms of Experiment 1, but wereWlled with more water so that the small and large bro-meliads of Experiment 2 had the same water height(6 cm). Any diVerence in water height could haveaVected the distance insects needed to travel out ofwater from one compartment to the other, potentiallyconfounding eVects of mesocosm volume. Dead leaveswere obtained from windfall branches of a Quiina schi-ppii (Quiinaceae) tree; a single detrital source was usedto reduce between-mesocosm variation in rates ofleaching. On 3 October 2000, 1.0 g oven-dried, crum-bled dead leaves (weighed to the nearest 0.002 g) wasadded to each mesocosm. Detrital distributionamongst compartments followed the same rules as inExperiment 1. Insect densities (per gram detritus) werehigher than in Experiment 1 but still within the rangenaturally observed (Table 1). DiVerences between theexperiments in the abundance of individual speciessimply reXect variation between years in the availabil-ity of speciWc instars harvested from natural bromel-iads. The following detritivore insects were addedbetween 4 and 6 October 2000 (day 1): two tipulid lar-vae (one 15–20 mm long, one 9 –13 mm long), three
scirtid larvae (one 4–5 mm, two 5–6 mm), and ten chir-onomids (4 mm). A single larvae of M. modesta (12–14 mm) was added to the central compartment of halfof the mesocosms on day 4. At the mid-point of theexperiment, day 21, a second round of detritivores (tosimulate natural colonization), consisting of three chi-ronomid larvae (4 mm) and two scirtid larvae (5–6 mm), was added to all mesocosms. The experimentwas harvested after 38–41 days, as described earlier.Mesocosms were carefully searched for cadavers of lar-vae in this experiment, to quantify non-predation mor-tality. Growth of tipulids in the small mesocosms wascalculated as in Experiment 1. There were not enoughtipulids remaining in the large, one-leaf mesocosms atthe end of the experiment to permit growth analysis forthe large mesocosms. DamselXy length was measuredat the start and end of the experiment, and convertedto wet mass using an empirical relationship (r2 =0.96,n =46)
Analysis of experiments
Loss of detrital mass was measured at the end of bothexperiments. Detrital loss includes eVects of insect pro-cessing as well as passive leaching and microbialdecomposition. In Experiment 2, detrital processing byinsects was calculated as detrital loss in the insect-con-taining replicate minus mean detrital loss in the corre-sponding no-insect control. In Experiment 1, therewere no treatments without insects, so detrital process-ing could not be directly calculated; instead, detritalloss was used as the response variable. The results weresimilar regardless of whether detrital loss or detritalprocessing was considered the response variable inExperiment 2.
Complexity could have been analyzed as either acategorical or continuous variable in these experi-ments. By analyzing complexity as a continuous vari-able, I am able to examine how—not just if—complexity aVects insects and energy Xux. Note thatmy hypothesized mechanisms involve directionalchange in insect behavior over a complexity gradient.I also avoid any loss in power associated with post hoccomparisons of means. Regression analysis is gener-ally recommended over ANOVA because it aVordsgreater power and provides more quantitative infor-mation about causal patterns (Cottingham et al.2005). All data were analyzed with regression models.Categorical terms of predator presence and brome-liad size were coded as either 1 or 0, and nonlineareVects of complexity were tested using a quadraticmodel. Most data was modeled with normal errors.The pupation and cadaver data had substantial
123
498 Oecologia (2006) 149:493–504
heteroscedasticity, so Poisson errors with a log-linkfunction were used in a generalized linear model. Thepupation but not the cadaver data was initially under-dispersed (residual deviance: df =0.65), and this wascorrected with an empirical scale parameter. Analy-ses used GENSTAT 5, release 3.2 (Lawes Agricul-tural Trust) and R version 1.8.0 (http://www.r-project.org).
Results
Two experiments were conducted. Experiment 1 exam-ined the eVects of habitat complexity on detrital lossand predation. Experiment 2 examined the eVects ofboth habitat complexity and habitat size on detritalprocessing and predation. Similar results between thetwo experiments indicate robustness of the conclu-sions, whereas diVerent results suggest either lowpower or strong context-dependence. To facilitate suchcomparisons, I have grouped results from both experi-ments under several themes.
Net eVects of habitat and predation on detrital processing
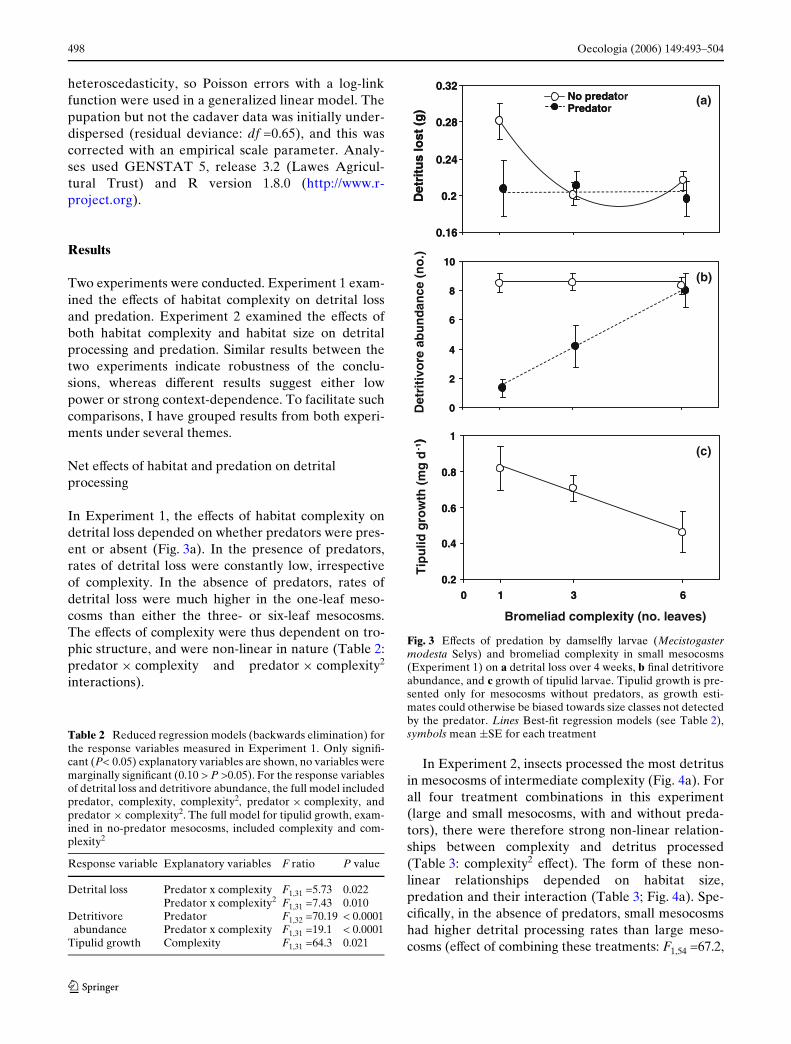
In Experiment 1, the eVects of habitat complexity ondetrital loss depended on whether predators were pres-ent or absent (Fig. 3a). In the presence of predators,rates of detrital loss were constantly low, irrespectiveof complexity. In the absence of predators, rates ofdetrital loss were much higher in the one-leaf meso-cosms than either the three- or six-leaf mesocosms.The eVects of complexity were thus dependent on tro-phic structure, and were non-linear in nature (Table 2:predator £ complexity and predator £ complexity2
interactions).
In Experiment 2, insects processed the most detritusin mesocosms of intermediate complexity (Fig. 4a). Forall four treatment combinations in this experiment(large and small mesocosms, with and without preda-tors), there were therefore strong non-linear relation-ships between complexity and detritus processed(Table 3: complexity2 eVect). The form of these non-linear relationships depended on habitat size,predation and their interaction (Table 3; Fig. 4a). Spe-ciWcally, in the absence of predators, small mesocosmshad higher detrital processing rates than large meso-cosms (eVect of combining these treatments: F1,54 =67.2,
Table 2 Reduced regression models (backwards elimination) forthe response variables measured in Experiment 1. Only signiW-cant (P< 0.05) explanatory variables are shown, no variables weremarginally signiWcant (0.10 > P >0.05). For the response variablesof detrital loss and detritivore abundance, the full model includedpredator, complexity, complexity2, predator £ complexity, andpredator £ complexity2. The full model for tipulid growth, exam-ined in no-predator mesocosms, included complexity and com-plexity2
Response variable Explanatory variables F ratio P value
Detrital loss Predator x complexity F1,31 =5.73 0.022Predator x complexity2 F1,31 =7.43 0.010
Detritivore abundance
Predator F1,32 =70.19 < 0.0001Predator x complexity F1,31 =19.1 < 0.0001
Tipulid growth Complexity F1,31 =64.3 0.021
Fig. 3 EVects of predation by damselXy larvae (Mecistogastermodesta Selys) and bromeliad complexity in small mesocosms(Experiment 1) on a detrital loss over 4 weeks, b Wnal detritivoreabundance, and c growth of tipulid larvae. Tipulid growth is pre-sented only for mesocosms without predators, as growth esti-mates could otherwise be biased towards size classes not detectedby the predator. Lines Best-Wt regression models (see Table 2),symbols mean §SE for each treatment
0.2
0.4
0.6
0.8
1
0 1 3 6
0.16
0.2
0.24
0.28
0.32
0
2
4
6
8
10
0.2
0.4
0.6
0.8
1
0 1 3 6
0.16
0.2
0.24
0.28
0.32
0
2
4
6
8
10
Bromeliad complexity (no. leaves)
(b)
(a)
(c)
No predatorPredatorNo predatPredato
Det
ritu
s lo
st (
g)
Tip
ulid
gro
wth
(m
g d
-1)
-1)
Det
riti
vore
ab
un
dan
ce (
no
.)D
etri
tus
lost
(g
)
123

Oecologia (2006) 149:493–504 499
P << 0.0001, Fig. 5b), but in the presence of predators,this diVerence disappeared (eVect of combining thesetreatments: F1,53 =0.008, P =0.92; Fig. 5b).
At Wrst glance, the eVect of habitat complexity ondetrital processing appears quite diVerent between theexperiments: maximal detrital processing occurred inone-leaf mesocosms in Experiment 1 but in three-leafmesocosms in Experiment 2. It will be argued later thatsuch diVerences in patterns of detrital processing arean artifact of diVerences between experiments, such as
duration. However, there are important similaritiesbetween the experiments. In Experiment 1 mesocosmsand the similar-sized small mesocosms of Experiment2, predators reduced daily rates of detrital processingby comparable amounts (Fig. 5a), and this predatoreVect depended on habitat complexity Tables 2, 3:predation £ complexity interactions). SpeciWcally, pre-dation reduced detrital loss in the one-leaf mesocosmsmarginally in Experiment 1 (two-tailed t test: t10 =2.00,P =0.073) and substantially in Experiment 2 (t8 =5.06,P =0.0010), but as complexity increased, the eVects ofpredation on detrital loss diminished to insigniWcant insix-leaf mesocosms (Experiment 1: t10 =0.89, P =0.39;Experiment 2: t8 =1.25, P =0.25).
In summary, detrital processing was reduced bylarge habitat size and high habitat complexity and—particularly in small, low-complexity habitats—by pre-dation. To understand the mechanisms underlyingthese patterns, I now examine the eVects of habitatstructure on the foraging eYciency of both predatorsand detritivores.
Fig. 4 EVects of predation, bromeliad complexity and bromeliadsize in Experiment 2 on a detrital processing over 6 weeks, andgrowth rate of b M. modesta larvae and c tipulid larvae. Tipulidgrowth is presented only for mesocosms without predators, asgrowth estimates could otherwise be biased towards size classesnot detected by the predator. There were not enough tipulidsremaining in the large, one-leaf mesocosms at the end of theexperiment to permit growth calculations. Lines Best-Wt regres-sion models (see Table 3) and, in the case of the small and largemesocosms with predators in (a), are so similar as to be indistin-guishable; symbols mean §SE for each treatment
-0.05
0
0.05
0.1
0.15
0.2
-0.01
0.01
0.02
0.03
0.2
0.4
0.6
0.8
0 1 3 6
-0.05
0
0.05
0.1
0.15
0.2
-0.01
0
0.01
0.02
0.03
0
0.2
0.4
0.6
0.8
0 1 3 6
Bromeliad complexity (no. leaves)
(b)
(a)
(c)
(b)
(a)
(c)
Tip
ulid
gro
wth
(m
g d
-1 )
Det
ritu
s p
roce
ssed
by
inse
cts
(g)
-M
. mo
des
tag
row
th(g
per
6 w
eeks
) No predator; SmallPredator; Small
No predator; LargePredator; Large
Fig. 5 a EVects of predation on detrital processing over a gradi-ent in bromeliad complexity, for both experiments. Negative val-ues indicate that predators reduce detrital processing. b EVects ofhabitat size on detrital processing over a gradient in complexityfor Experiment 2. Negative values indicate that increasing habitatsize reduces detrital processing. Bars Mean (§ SE) diVerencesbetween appropriate treatments
-1
-0.5
0
0.5
1
1.5
2
No predatorsPredators
-2
-1
0
1
2
3
4
Expt. 1 - small
Expt. 2 - small
Expt. 2 - large
-1
-0.5
0
0.5
1
1.5
2
No predatorsPredators
-2
-1
0
1
2
3
4
Expt. 1 - Small
Expt. 2 - Small
Expt. 2 - Large
Bromeliad complexity (no. leaves)
Eff
ect o
n d
etri
tal p
roce
ssin
g r
ate
(mg
d )
(a) Predator effect
(b) Mesocosm size effect
1 3 61 3 6
-1
123

500 Oecologia (2006) 149:493–504
EVects of habitat on predation rates
High habitat complexity reduced predation rates. Thiscan easily be seen in Experiment 1, in which predatorsreduced larval abundance by 85% in one-leaf bromel-iads, 50% in three-leaf bromeliads, and not at all insix-leaf bromeliads (Fig. 3b, signiWcant predator£ complexity eVect: Table 2). Larvae were also lost inthe absence of predators (due to other causes of mor-tality and pupation), but Wnal abundances were similaracross complexity levels. The frequency of pupationwas greater in the longer-running Experiment 2. Pupa-tion rates were not independent of predator presence,as described later, preventing the estimation of preda-tion rates as simply the diVerence in abundancebetween treatments with and without predators (as inExperiment 1). However, predation rates could bemeasured indirectly by examining the growth rate ofthe damselXy, M. modesta. DamselXy growth rateswere signiWcantly higher in the one-leaf mesocosmsthan in more complex mesocosms in Experiment 2(Fig. 4b, Table 3: complexity eVects). Although dam-selXies tended to grow more slowly in large than smallmesocosms, this size eVect was not signiWcant (Table 3,Fig. 4b, F1,25 =2.72, P =0.11).
EVects of habitat on detritivore foraging eYciency
High habitat complexity also reduced the foragingeYciency of detritivores. In Experiment 1, in theabsence of predators, total detrital processingdecreased as complexity increased yet detritivoresmaintained a constant abundance across the complex-ity gradient; in other words, each individual detritivoreconsumed less detritus as complexity increased. In thepresence of predators, detritivore abundance increasedwith complexity, yet total detritus processed remainedconstant over the complexity gradient. Thus, again, percapita foraging eYciency must have decreased as com-plexity increased.
These reductions in foraging eYciency as a result ofhigh habitat complexity had important consequencesfor detritivores: slower growth, lower pupation rates,and higher mortality rates. In both experiments, tipu-lids had slower growth rates in the more complex mes-ocosms (Figs. 3, 4; Tables 2, 3). In Experiment 2,pupation rates of all species declined with increasingmesocosm complexity, particularly in the small meso-cosms, and non-predation deaths increased with meso-cosm complexity (Table 3; Fig. 6; comparable data isnot available for Experiment 1). A likely cause of non-predation deaths is starvation due to low foragingeYciency, though further experiments are required forconWrmation. In general, each extra compartment inthe mesocosm resulted in an additional 1.47 larvalcadavers, and a reduction of 1.43 pupal cases.
Predation also aVected pupation rates in Experi-ment 2. In the absence of predators, one-leaf meso-cosms had higher pupation rates than more complexmesocosms (57% of all pupations) but, in the presenceof predators, had no pupations since as many detriti-vores were consumed as larvae. Thus, the low detritalprocessing rates in one-leaf mesocosms in Experiment2 (Fig. 4a) was due to loss of detritivores to pupationwhen predators were absent, but loss of detritivores topredation when predators were present. The low detri-tal processing rates in six-leaf mesocosms (Fig. 4a) wasdue to high detritivore mortality in both cases. Thecombination of both patterns resulted in maximumdetrital processing in the three-leaf mesocosms ofExperiment 2 (Fig. 4a).
Discussion
In manipulations with bromeliad mesocosms, habitatstructure had both direct (detritivore-mediated) andindirect (predator-mediated) eVects on detritalprocessing. Increasing habitat complexity reduced the
Table 3 Reduced regression models (backwards elimination) forthe response variables measured in Experiment 2. Only explana-tory variables signiWcant (P< 0.05) or marginally signiWcant (inparentheses, 0.10 > P >0.05) are shown. The full model for all re-sponse variables except damselXy and tipulid growth includedpredator, size, complexity, complexity2, and all two- and three-way interactions between predator, size and complexity (linearand quadratic forms). The full model for both tipulid anddamselXy growth included size, complexity, complexity2, size£ complexity, size £ complexity2. Tipulid growth was examinedonly in small mesocosms without predators, damselXy growth wasexamined only in mesocosms with predators
Response variable Explanatory variables
F ratio P value
Detrital processing Complexity F1,53 = 3.14 < 0.0001Complexity2 F1,53 = 35.6 < 0.0001Size F1,53 = 6.64 0.013Predator F1,53 = 20.8 < 0.0001Predator £
complexityF1,53 = 3.34 (0.072)
Predator £ size F1,53 = 3.20 (0.080)DamselXy growth Complexity F1,26 = 8.59 0.007
Complexity2 F1,26 = 7.09 0.013Tipulid growth
(in absence of predators)Complexity F1,12 = 4.67 0.05
Pupation rate (all species) Complexity £size
F1,58 = 6.32 0.01
Non-predation mortality (all species)
Complexity F1,58 = 17.2 < 0.0001
123

Oecologia (2006) 149:493–504 501
foraging eYciency of detritivores, and so directlyreduced rates of detrital processing. However, increas-ing habitat complexity simultaneously increased ratesof detrital processing by decreasing the eYciency ofdamselXies preying on detritivores. Thus, increasinghabitat complexity resulted in opposing eVects ondetrital processing rates: more surviving detritivores(due to reduced predation) but less processing per det-ritivore (Fig. 3). These opposing eVects of complexitywere of similar magnitude in Experiment 1—there wasno net eVect of complexity on detrital loss in the pres-ence of predators (Fig. 3a)—but not in Experiment 2(Fig. 4a). Habitat size may have also had similar directand indirect eVects on detrital processing; increasinghabitat size led to reductions in detrital processing inthe absence, but not in the presence, of predators(Fig. 5b). However, the corollaries of reduced predatorand detritivore growth with increased habitat size arenot as well supported as with increased habitat com-plexity. Note that habitat structure aVected not onlydetrital processing, but more generally the Xux ofenergy from detritus to detritivores to damselXy larvae:complex mesocosms had lower growth rates of bothdetritivores and damselXies.
High habitat complexity likely reduced predationrates by providing detritivores with a stochastic refuge:
reduced probability of detritivores and damselXies co-occurring in the same leaf compartment. Co-occur-rence probably occurs when detritivores, not damsel-Xies, move compartments in search of resources. M.modesta damselXies are sit-and-wait predators, andhave been recorded residing in the same leaf compart-ment for at least 2 weeks at a time, whereas detriti-vores normally move compartments within 2 weeks (D.Srivastava, unpublished observation). EVects of habitatcomplexity on predation rates have been shown formany other aquatic communities (Crowder and Coo-per 1982; Heck and Crowder 1991; Sebens 1991;Nemeth 1998; Warfe and Barmuta 2004), as well as ter-restrial insect communities (Casas and Djemai 2002).In a few cases, such as the current study, complexityeVects have been documented to cascade throughmultiple trophic levels. For example, increases in thecomplexity of Spartina tussocks improve predatoreYciency in reducing planthopper abundance, which inturn increases Spartina biomass (Denno et al. 2002).Similarly, rock size in stream beds aVects the strengthof a Wsh–damselXy–chironomid-algae trophic cascade,as the complex habitat provided by gravel creates ref-uges for invertebrates from Wsh predation (Power1992).
High habitat complexity also reduced detritivoreforaging rates, even in the absence of predators. Com-plexity may reduce the ability of detritivores to Wndhigh-quality patches of resources (detritus in the meso-cosms was heterogeneously distributed amongst com-partments, as in natural bromeliads). Detritivores incomplex bromeliads may also delay moving to a newcompartment to search for better resources, trading-oVthe beneWts of Wnding new resources against the ener-getic costs of moving, or the risk of encountering apredator. Such trade-oVs between feeding and preda-tor avoidance have been shown for many organisms(Lima 1998).
Increasing habitat size also reduced detrital process-ing rates in the absence of predators. The mechanism isnot clear here, for detritivores might be expected toeasily Wnd detritus within 6 weeks in even the largestcompartment (though arguably at a slower rate, due toreduced density of both insects and detritus). Thisstudy was designed so that increases in habitat sizeresulted in reduced detritivore density, to mimic pat-terns in real bromeliads (Fig. 1). Reduced encounterrates between detritivores in large mesocosms mighthave been expected to reduce interference competi-tion, promoting detrital processing, but the oppositetrend was observed. This experiment does not allow adirect assessment of resource competition, but note thatdetritivores consumed only a fraction of the detritus
Fig. 6 EVects of bromeliad complexity, size and predator pres-ence on the number of detritivore larvae that a died due to non-predation causes or b reached pupation. Values are mean (+ SE)number of occurrences per mesocosm measured over the 6 weeksof Experiment 2
0
0.2
0.4
0.6
0.8
1
0
0.5
1
1.5
2
2.5
3
No predator; Small Predator; Small
No predator; Large Predator; Large
Bromeliad complexity (no. leaves)
Pu
pat
ion
s (n
o.)
No
n-p
red
atio
n
dea
ths
(no
.)
1 63
123

502 Oecologia (2006) 149:493–504
provided. In general, detritivore species in phytotelmatahave more often been shown to have facilitative thancompetitive interactions (Bradshaw and Holzapfel1992; Heard 1994a; Paradise and Dunson 1997).
The patterns in detrital processing observed in thisstudy may, in addition to the mechanisms alreadyaddressed, involve disruption of two types of facilita-tive interactions. First, damselXy predation on detriti-vores reduced the fragmentation of detritus, and mayhave thus reduced the colonization of detritus by bac-teria and fungi. Microbial decomposition, which isessential to the breakdown of detritus, may be facili-tated by insects (Cummins and Klug 1979). Second,increases in either predation or complexity may havedisrupted detrital processing chains. A processingchain occurs when some detritivores convert intactdetritus into Wner organic particles (by shredding detri-tus or scraping mesophyll layers), facilitating otherdetritivores that collect or Wlter Wne particulate matter(Heard 1994b). Processing chains have been docu-mented in phytotelmata, but only under certain condi-tions (Heard 1994a; Paradise and Dunson 1997;Paradise 1999; Daugherty and Juliano 2002). We haverecently found evidence for processing chains in bro-meliads (B. Starzomski, D. Suen and D. Srivastava,unpublished results). Tipulids are particularly vulnera-ble to damselXy predation and loss of this dominantshredder may have disrupted any processing chain.Spatial partitioning of both insects and detritus in com-plex mesocosms may have also disrupted potential pro-cessing chains; this could have resulted in the observedreduction in detritivore eYciency. Such mechanismscan only be tested with additional experiments.
The two experiments exhibited very diVerent pat-terns between complexity and detrital loss (process-ing), despite similar underlying mechanisms. In theabsence of predators, maximal detrital loss occurred atthe lowest complexity in Experiment 1. By contrast,maximal detrital processing occurred at intermediatecomplexity in Experiment 2. The proximate reasonsfor these diVerences were more pupations (especiallyin one-leaf bromeliads) and more non-predationdeaths (especially in six-leaf bromeliads) in Experi-ment 2. Both of these eVects probably occurredbecause of the longer duration of Experiment 2 (38–41 days for Experiment 2 vs 33 days for Experiment 1),although this cannot be isolated from other diVerencesbetween the experiments (year, detritus type andamount, detritivore abundances). The contrastbetween the two experiments suggests that, in naturalbromeliads, net eVects of complexity on detrital pro-cessing may be quite sensitive to seasonal variation inoviposition rates and detrital inputs.
Understanding the direct and indirect eVects of hab-itat structure on ecosystem function is not just impor-tant in pristine systems like the bromeliad–insect foodweb. Whether habitat structure is changed throughnatural or anthropogenic eVects, systems experiencingreductions in habitat structure may be expected toshow concomitant decreases in trophic structure. Forexample, extinction of predator species has beenlinked to reductions in habitat size (Luckinbill 1974;Holt et al. 1999; Brashares et al. 2001) and increases inhabitat fragmentation (Gilbert et al. 1998). Similarly,decreases in habitat complexity lead to reductions inpredator abundance (meta-analysis: Langellotto andDenno 2004). The bromeliad example shows that,when trophic structure and habitat structure covary, itwill be particularly important to understand how thetwo factors interact to aVect ecosystem functions.Despite interest in biotic regulation of ecosystem func-tion (Loreau et al. 2002) and the ecological conse-quences of changed habitat structure (Langellotto andDenno 2004), there is still remarkably little research onthe combined eVects of species loss and habitat changeon function (Srivastava 2002; Srivastava and Vellend2005).
Acknowledgments Volunteer assistance by Kate Edwards,Michael Melnychuk, Jennifer Passmore and Jessica Ware was vi-tal to this project. Personnel of the Área de Conservación Gua-nacaste provided logistical support, particular thanks to RógerBlanco, María Marta Chavarría, Calixto Moraga, Petrona Rios,and Carlos Zuñiga. John Epler, Jon Gelhaus, Dennis Paulson andDaryl Suen aided with identiWcations. The manuscript was im-proved by the careful reading of Jacqueline Ngai, Jordan Rosen-feld, Thomas Miller and several anonymous reviewers. Fundingwas provided by the Biodiversity Research Centre, UBC, and byNSERC grants to W.E. Neill and D.S.
References
Tewksbury JJ et al (2002) Corridors aVect plants, animals, andtheir interactions in fragmented landscapes. Proc Natl AcadSci USA 99:12923–12926
Almany GR (2004) DiVerential eVects of habitat complexity, pre-dators and competitors on abundance of juvenile and adultcoral reef Wshes. Oecologia 141:105–113
Armbruster P, Hutchinson RA, Cotgreave P (2002) Factors inXu-encing community structure in a South American tank bro-meliad fauna. Oikos 96:225–234
Beck MW (2000) Separating the elements of habitat structure:independent eVects of habitat complexity and structuralcomponents on rocky intertidal gastropods. J Exp Mar BiolEcol 249:29–49
Beukers JS, Jones GP (1997) Habitat complexity modiWes the im-pact of piscivores on a coral reef Wsh population. Oecologia114:50–59
Bradshaw WE, Holzapfel CM (1988) Drought and the organiza-tion of tree-hole mosquito communities. Oecologia 74:507–514
123
Oecologia (2006) 149:493–504 503
Bradshaw WE, Holzapfel CM (1992) Resource limitation, habitatsegregation, and species interactions of British tree-holemosquitos in nature. Oecologia 90:227–237
Brashares JS, Arcese P, Sam MK (2001) Human demography andreserve size predict wildlife extinction in West Africa. Proc RSoc Lond B Biol Sci 268:2473–2478
Carpenter SR et al (2001) Trophic cascades, nutrients, and lakeproductivity: whole-lake experiments. Ecol Monogr 71:163–186
Casas J, Djemai I (2002) Canopy architecture and multitrophicinteractions. In: Tscharntke T, Hawkins BA (eds) Multi-trophic level interactions. Cambridge University Press, Cam-bridge, pp 174–196
Cottingham KL, Lennon JT, Brown BL (2005) Knowing when todraw the line: designing more informative ecological experi-ments. Front Ecol Environ 3:145–152
Crowder LB, Cooper WE (1982) Habitat structural complexityand the interaction between bluegills and their prey. Ecology63:1802–1813
Cummins KW, Klug MJ (1979) Feeding ecology of stream inver-tebrates. Annu Rev Ecol Syst 10:147–172
Daugherty MP, Juliano SA (2002) Testing for context-depen-dance in a processing chain interaction among detrius-feed-ing aquatic insects. Ecol Entomol 27:541–553
Denno RF, Roderick GK (1991) InXuence of patch size, vegeta-tion texture, and host plant architecture on the diversity,abundance, and life history styles of sap-feeding herbivores.In: Bell SS, McCoy ED, Mushinsky HR (eds) Habitat struc-ture: the physical arrangement of objects in space. Chapmanand Hall, New York, pp 169–196
Denno RF, Gratton C, Peterson MA, Langellotto GA, Finke DL,Huberty AF (2002) Bottom-up forces mediate natural-ene-my impact in a phytophagous insect community. Ecology83:1443–1458
Didham RK, Ghazoul J, Stork NE, Davis AJ (1996) Insects infragmented forests: a functional approach. Trends Ecol Evol11:255–260
Fincke OM (1992) Consequences of larval ecology for territorial-ity and reproductive success of a neotropical damselXy. Ecol-ogy 73:449–462
Finke DL, Denno RF (2002) Intraguild predation diminished incomplex-structured vegetation: implications for prey sup-pression. Ecology 83:643–652
Floater GJ (2001) Habitat complexity, spatial interference, and“minimum risk distribution”: a framework for populationstability. Ecol Monogr 71:447–468
Frank JH (1983) Bromeliad phytotelmata and their biota, espe-cially mosquitoes. In: Frank JH, Lounibos LP (eds) Phytotel-mata: terrestrial plants as hosts of aquatic insectcommunities. Plexus, Medford, pp 101–128
Gilbert F, Gonzalez A, Evans-Freke I (1998) Corridors maintainspecies richness in the fragmented landscapes of a microeco-system. Proc R Soc Lond B 265:577–582
Gonzalez A, Chaneton EJ (2002) Heterotroph species extinc-tion, abundance and biomass dynamics in an experimen-tally fragmented microecosystem. J Anim Ecol 71:594–602
Heard SB (1994a) Pitcher-plant midges and mosquitoes: a pro-cessing chain commensalism. Ecology 75:1647–1660
Heard SB (1994b) Processing chain ecology: resource conditionand interspeciWc interactions. J Anim Ecol 63:451–464
Heck KL Jr, Crowder LB (1991) Habitat structure and predator–prey interactions in vegetated aquatic systems. In: Bell SS,McCoy ED, Mushinsky HR (eds) Habitat structure: thephysical arrangement of objects in space. Chapman and Hall,New York pp 281–299
Holt RD, Lawton JH, Polis GA, Martinez ND (1999) Trophicrank and the species-area relationship. Ecology 80:1495–1504
Klein BC (1989) EVects of forest fragmentation on dung and car-rion beetle communities in Central Amazonia. Ecology70:1715–1725
Laessle AM (1961) A micro-limnological study of Jamaican bro-meliads. Ecology 42:499–517
Langellotto GA, Denno RF (2004) Responses of invertebratenatural enemies to complex-structured habitats: a meta-ana-lytical synthesis. Oecologia 139:1–10
Lima SL (1998) Non-lethal eVects in the ecology of predator-preyinteractions. BioScience 48:25–34
Loreau M, Naeem S, Inchausti P (eds) (2002) Biodiversity andecosystem functioning: synthesis and perspectives. OxfordUniversity Press, Oxford
Luckinbill LS (1974) The eVects of space and enrichment on apredator–prey system. Ecology 55:1142–1147
MacArthur RH (1972) Geographical ecology. Harper and Row,New York
MacArthur RH, Wilson EO (1967) The theory of island biogeog-raphy. Princeton Univeristy Press, Princeton
McQueen DJ, Johannes MRS, Post JR, Stewart TJ, Lean DRS(1989) Bottom-up and top-down impacts on freshwater pe-lagic community structure. Ecol Monogr 59:289–309
Melnychuk MC, Srivastava DS (2002) Abundance and verticaldistribution of a bromeliad-dwelling zygopteran larva, Me-cistogaster modesta, in a Costa Rican rainforest (Odonata:Pseudostigmatidae). Int J Odonatol 5:81–97
Nemeth RS (1998) The eVect of natural variation in substratearchitecture on the survival of juvenile bicolor damselWsh.Environ Biol Fishes 53:129–141
Paradise CJ (1999) Interactive eVects of resources and a process-ing chain interaction in treehole habitats. Oikos 85:529–535
Paradise CJ, Dunson WA (1997) Insect species interactions andresource eVects in treeholes: are helodid beetles bottom-upfacilitators of midge populations? Oecologia 109:303–312
Picado C (1913) Les broméliacées épiphytes considerées commemilieu biologique. Bull Sci Fr Belg 47:215–360
Power ME (1992) Habitat heterogeneity and the functional sig-niWcance of Wsh in river food webs. Ecology 73:1675–1688
Reich A, Ewel JJ, Nadkarni NM, Dawson T, Evans RD (2003)Nitrogen isotope ratios shift with plant size in tropical bro-meliads. Oecologia 137:587–590
Richardson BA (1999) The bromeliad microcosm and the assess-ment of faunal diversity in a Neotropical forest. Biotropica31:321–336
Schindler DE, Carpenter SR, Cole JJ, Kitchell JF, Pace ML(1997) InXuence of food web structure on carbon exchangebetween lakes and atmosphere. Science 277:248–251
Schwartz MW, Brigham CA, Hoeksema JD, Lyons KG, vanMantgem PJ (2000) Linking biodiversity to ecosystem func-tion: implications for conservation ecology. Oecologia122:297–305
Sebens KP (1991) Habitat structure and community dynamics inmarine benthic systems. In: Bell SS, McCoy ED, MushinskyHR (eds) Habitat structure: the physical arrangement of ob-jects in space. Chapman and Hall, New York, pp 211–234
Srivastava DS (2002) The role of conservation in expanding bio-diversity research. Oikos 98:351–360
Srivastava DS, Vellend M (2005) Biodiversity-ecosystem func-tion research: is it relevant to conservation? Annu Rev EcolEvol Syst 36:267–294
Uetz GW (1991) Habitat structure and spider foraging. In: BellSS, McCoy ED, Mushinsky HR (eds) Habitat structure: thephysical arrangement of objects in space. Chapman and Hall,New York, pp 325–348
123

504 Oecologia (2006) 149:493–504
Wardle DA, Zackrisson O, Hörnberg G, Gallet C (1997) TheinXuence of island area on ecosystem properties. Science277:1296–1299
Wardle DA, Barker GM, Yeates GW, Bonner KI, Ghani A(2001) Introduced browsing mammals in New Zealand natu-ral forests: aboveground and belowground consequences.Ecol Monogr 71:587–614
Warfe DM, Barmuta LA (2004) Habitat structural complexitymediates the foraging success of multiple predator species.Oecologia 141:171–178
Young K (2001) Habitat diversity and species diversity: testingthe competition hypothesis with juvenile salmonids. Oikos95:87–93
123