Embed Size (px)
Citation preview
HABITAT CHARACTERIZATION, TROPHIC POSITION
AND SEASONAL INFLUENCE ON AQUATIC INSECTS
IN THE SELECTED FEEDER STREAMS OF
BELUM-TEMENGOR FOREST COMPLEX (BTFC),
PERAK
DHIYA SHAFIQAH BINTI RIDZUAN
UNIVERSITI SAINS MALAYSIA
2015

HABITAT CHARACTERIZATION, TROPHIC POSITION
AND SEASONAL INFLUENCE ON AQUATIC INSECTS
IN THE SELECTED FEEDER STREAMS OF
BELUM-TEMENGOR FOREST COMPLEX (BTFC),
PERAK
By
DHIYA SHAFIQAH BINTI RIDZUAN
Thesis submitted in fulfillment of the requirements for the degree of
Master of Science
February 2015
ii
ACKNOWLEDGEMENTS
First and foremost, I am grateful to Allah S.W.T. for His blessing in giving me the
strength and guidance in completing my study. I would like to express my deepest
gratitude to my supervisor, Prof. Che Salmah Md Rawi and my co-supervisor, Dr.
Suhaila Ab Hamid for their patience and guidance, enthusiastic encouragement and
useful critiques from the beginning until I finish my research. Without their guidance,
this research would not have been possible. I have learned a lot from both of them during
my study at Universiti Sains Malaysia. I could not have imagined having better
supervisors for my M.Sc. study.
My genuine appreciation goes to Prof. Abu Hassan Ahmad, former Dean and
Assoc. Prof. Ahmad Sofiman Othman, Dean of School of Biological Sciences, Universiti
Sains Malaysia, Penang, for giving me opportunity and providing all the necessary
facilities that made my study possible.
I also gratefully acknowledged the Pulau Banding Foundation and Yayasan
EMKAY for providing me a financial support to carry out research in Belum-Temengor
Forest Complex (BTFC), Perak as well as to the Ministry of Higher Education, Malaysia
for funding my study through a research grant awarded to my supervisors. Thanks are
also extended to Dr. Daniel Baskaran and all staffs in Pulau Banding Research Centre for
tireless help and providing facilities during my research.
I am indebted to many individuals who contributed to the completion of this
thesis in many ways. I would like to offer my special thanks to Dr.Salman Al-Shami for
his tremendous ideas and comments through the writing process of this master thesis. He
has been an excellent mentor for me. My sincere gratitudes go to the entomology
laboratory assistant, Pn. Siti Khadijah and drivers, En. Kalimuthu, En. Nordin, En.
Shukor and En. Somasundram, for their invaluable help during the field works and
laboratory study.
Gratitude is also extended to all colleagues in the laboratory of Aquatic
Entomology for creating a friendly atmosphere during my stay in USM. Many thanks to
sampling team mates; Kak Huda, Kak Wani, Kak Farha, Abang Zul, Aiman, Ili and
Soleh, for your help in collecting samples from the field. I owe you big time.
A special thanks to my family. Words cannot express how grateful I am to papa,
mama, brothers and sister for all your sacrifices. Your prayer for me was what sustained
me this far. Not to forget to all of my comrades who always there for me through my
thick and thin, supported me in writing and encouraged me to strive towards my goal.
Last but not least, I also place on record, my sense of gratitude to one and all who,
directly or indirectly, have lent their helping hand in this research. Thank you all.
iii
TABLE OF CONTENTS
Page
ACKNOWLEDGEMENT ii.
TABLE OF CONTENTS iii.
LIST OF TABLES vii.
LIST OF FIGURES ix.
LIST OF PLATES x.
LIST OF APPENDICES xi.
LIST OF CONFERENCES ATTENDED xii. LIST OF ABBREVIATIONS AND SYMBOLS xiii.
ABSTRAK xv.
ABSTRACT xvii.
CHAPTER 1: INTRODUCTION
1.1 Background 1
1.2 Objectives 7
CHAPTER 2: LITERATURE REVIEW
2.1 Aquatic macroinvertebrate distribution 8
2.2 Habitat heterogeneity and aquatic insects’ composition 11
2.2.1 Application of gravelometer and pebble counts technique
14
2.3 Seasonal changes and water characteristics influence on aquatic insect
distribution
16
2.4 Measuring river performance using ecological indices 20
2.4.1 Shannon-Wiener Index (H’) 21
2.4.2 Margalef’s (R1) and Menhinick’s Richness Index (R2) 22
2.4.3 Pielou’s Evenness Index (J’) 22
2.4.4 Beta Diversity Whittaker’s Index (ẞw) 23
2.5 Stream food webs and stable isotope analysis
25
iv
CHAPTER 3: PREVALENCE OF AQUATIC INSECTS ON DIFFERENT
SIZES OF STONY SUBSTRATE UNDER THE
INFLUENCE OF OTHER ENVIRONMENTAL
PARAMETERS
3.1 Introduction 31
3.2 Materials and methods 34
3.2.1 Study areas 34
3.2.2 Aquatic insect sampling and measurements of substrate size, physical
parameters of the river
41
3.2.2.1 Aquatic insect collection 41
3.2.2.2 Substrate composition 43
3.2.2.3 Measurements of environmental parameters 46
3.2.3 Data Analysis 47
3.2.3.1 Substrate size classification 47
3.2.3.2 Bed roughness and mean grain size calculation 50
3.2.3.γ Aquatic insects’ data
50
3.3 Results 52
3.3.1 Substrate types composition 52
γ.γ.β Aquatic insects’ assemblages in different classes of stony substrate types
53
3.3.3 Prevalence of aquatic insects (abundance and richness) in relation to
physical parameters
57
γ.γ.4 Aquatic insects’ taxonomic composition in relation to the rivers’ physical characteristics.
61
3.4 Discussion
65
3.5 Conclusion 72
CHAPTER 4: DETERMINATION OF FOOD SOURCES AND TROPHIC
POSITION IN FRESHWATER ECOSYSTEM BY CARBON AND
NITROGEN STABLE ISOTOPES
4.1 Introduction 73
4.2 Materials and methods 77
4.2.1 Study areas 77
4.2.2 Collecting samples for stable isotope analyses (plants, algae, aquatic 77
v
macroinvertebrates and fish)
4.2.3 Stable isotope analysis 79
4.2.4 Trophic position estimation 80
4.2.5 Two-source mixing model 81
4.3 Results 82
4.3.1 Organic materials in the collected samples 82
4.3.2 The δ13C and δ 15N signatures of potential producers and consumers. 83
4.4 Discussion 93
4.5 Conclusion 100
CHAPTER 5: SEASONAL INFLUENCE ON STRUCTURING AQUATIC
INSECTS COMMUNITIES IN TROPICAL HIGHLAND
RIVERS
5.1 Introduction 101
5.2 Materials and methods 103
5.2.1 Study areas 103
5.β.β Collection of aquatic insects’ composition 103
5.2.3 Measurements of physical parameters such as water velocity, water
depth and canopy cover
104
5.2.4 Measurement of water quality parameters 105
5.2.5 Climatic data 106
5.2.6 Data Analysis 108
5.4 Results 110
5.4.1 The composition and distribution of aquatic insect communites in
rivers of Belum-Temengor Forest Complex (BTFC), Perak during wet and
dry season.
110
5.4.2 The assessment of physico-chemical parameters in rivers of Belum-
Temengor Forest Complex (BTFC), Perak during wet and dry season.
117
5.4.3 Influence of physicochemical water parameters and rainfall amount on
the aquatic insect composition and distribution.
119
5.5 Discussion 131
5.6 Conclusion 140

vi
CHAPTER 6: GENERAL CONCLUSION AND RECOMMENDATION
6.1 Conclusion 141
6.2 Recommendations 144
REFERENCES 145
APPENDICES 175
vii
LIST OF TABLES Page
Table 2.1 Index value indicator from the calculation of Shannon-Wiener Index
21
Table 3.1 Characteristics of sampling sites and locations of five rivers
investigated in Belum – Temengor Forest Complex (BTFC), Perak
37
Table 3.2 Table of particle size category according Wentworth’s Classification
System (1922)
49
Table 3.3 Percentage of substrate class represented by the rivers of Belum
Temengor Forest Complex
52
Table 3.4 The composition (number individual) of aquatic insects in five classes
of stony substrate in rivers of Belum- Temengor Forest Complex, Perak
54
Table 3.5 Ecological indices (diversity, richness, evenness and beta diversity) in
the five investigated substrate classes in rivers of Belum-Temengor
Forest Complex, Perak
56
Table 3.6 Correlations between physical parameters and aquatic insects’ abundance and richness in rivers of Belum-Temengor Forest Complex,
Perak
58
Table 3.7 Multiple Regression Coefficient (R-Adjusted) between bed roughness
with the abundance and richness of aquatic insects in rivers of Belum-
Temengor Forest Complex (BTFC), Perak
60
Table 3.8 Correlation, eigenvalues, and variance explained for the four axes of
canonical correspondence analysis (CCA) for aquatic insects’ taxonomic composition and physical variables in six rivers of Belum
Temengor Complex, Perak, Malaysia
63
Table 4.1 Total individuals of aquatic insects collected from streams of Belum-
Temengor Forest Complex (BTFC)
82
Table 4.2 The mean value of δ13C or δ 15N signatures for each producers and
consumers in freshwater ecosystem
83
Table 4.3 Relative contribution of allochthonous and autochthonous food sources
(%) to the potential consumers in the streams of Belum-Temengor
Forest Complex (BTFC)
87
Table 4.4 Trophic position values for prey items and consumers in the stable
isotope study
90
viii
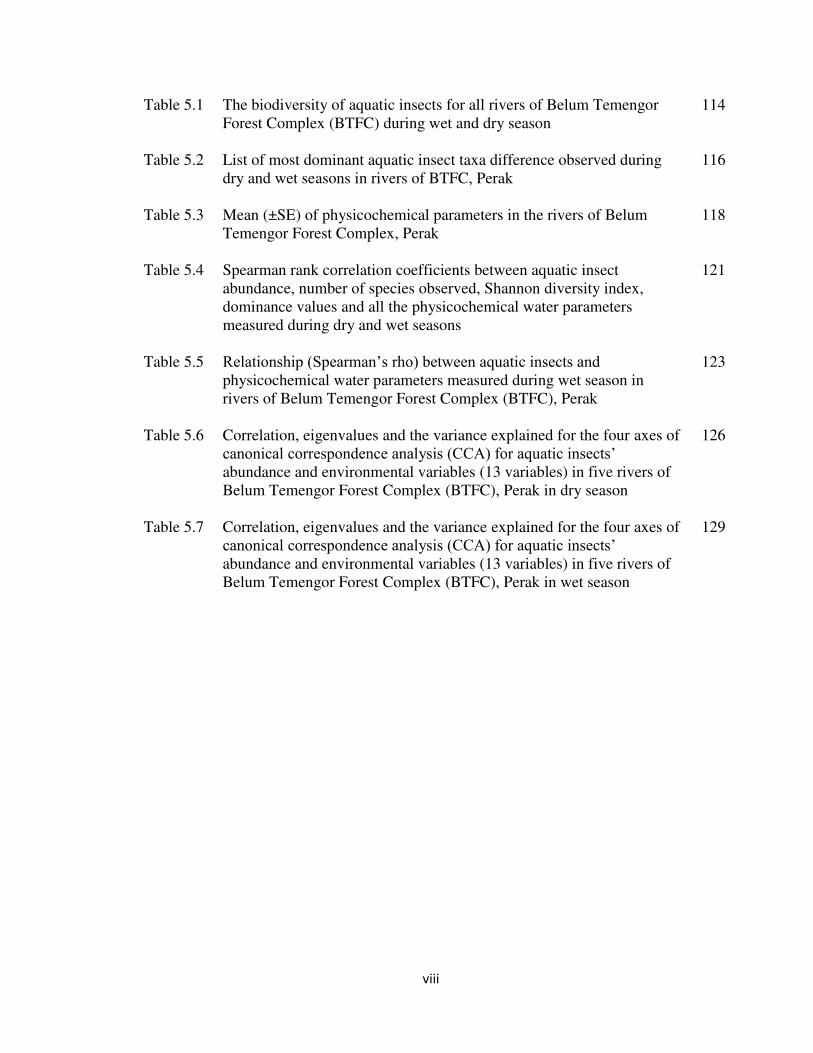
Table 5.1 The biodiversity of aquatic insects for all rivers of Belum Temengor
Forest Complex (BTFC) during wet and dry season
114
Table 5.2 List of most dominant aquatic insect taxa difference observed during
dry and wet seasons in rivers of BTFC, Perak
116
Table 5.3 Mean (±SE) of physicochemical parameters in the rivers of Belum
Temengor Forest Complex, Perak
118
Table 5.4 Spearman rank correlation coefficients between aquatic insect
abundance, number of species observed, Shannon diversity index,
dominance values and all the physicochemical water parameters
measured during dry and wet seasons
121
Table 5.5 Relationship (Spearman’s rho) between aquatic insects and physicochemical water parameters measured during wet season in
rivers of Belum Temengor Forest Complex (BTFC), Perak
123
Table 5.6 Correlation, eigenvalues and the variance explained for the four axes of
canonical correspondence analysis (CCA) for aquatic insects’ abundance and environmental variables (13 variables) in five rivers of
Belum Temengor Forest Complex (BTFC), Perak in dry season
126
Table 5.7 Correlation, eigenvalues and the variance explained for the four axes of
canonical correspondence analysis (CCA) for aquatic insects’ abundance and environmental variables (13 variables) in five rivers of
Belum Temengor Forest Complex (BTFC), Perak in wet season
129
ix
LIST OF FIGURES Page
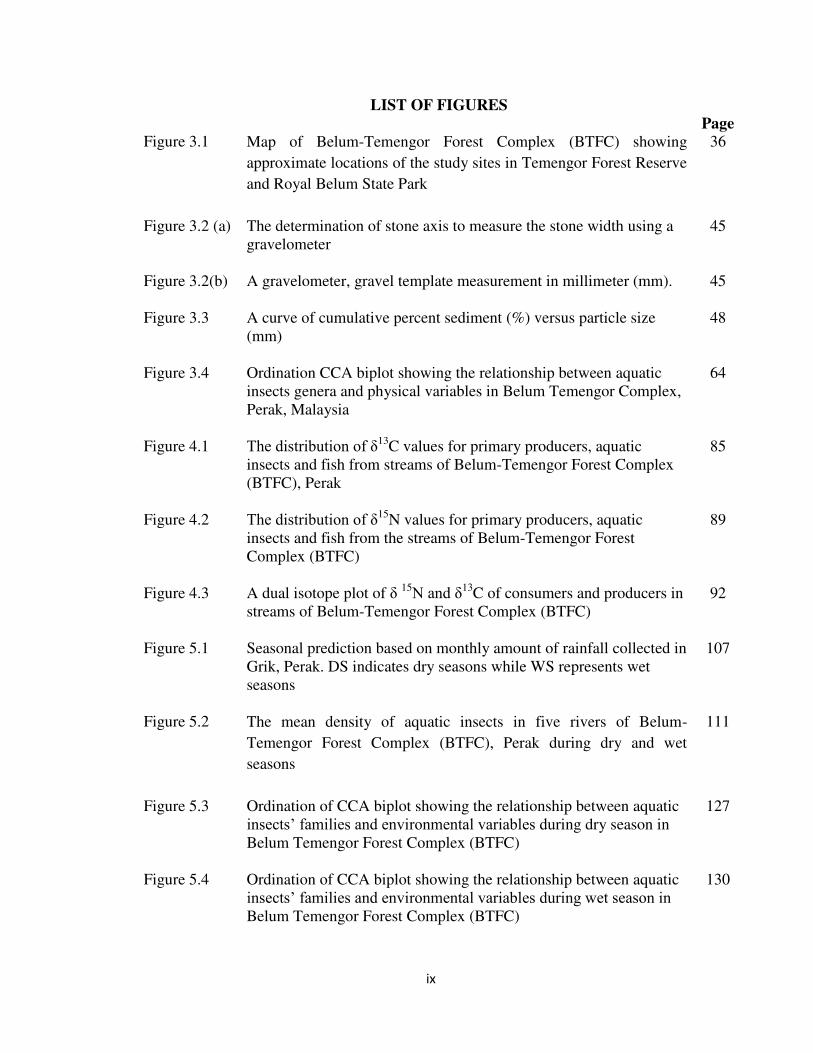
Figure 3.1 Map of Belum-Temengor Forest Complex (BTFC) showing
approximate locations of the study sites in Temengor Forest Reserve
and Royal Belum State Park
36
Figure 3.2 (a) The determination of stone axis to measure the stone width using a
gravelometer
45
Figure 3.2(b) A gravelometer, gravel template measurement in millimeter (mm).
45
Figure 3.3 A curve of cumulative percent sediment (%) versus particle size
(mm)
48
Figure 3.4 Ordination CCA biplot showing the relationship between aquatic
insects genera and physical variables in Belum Temengor Complex,
Perak, Malaysia
64
Figure 4.1 The distribution of δ13C values for primary producers, aquatic
insects and fish from streams of Belum-Temengor Forest Complex
(BTFC), Perak
85
Figure 4.2 The distribution of δ15N values for primary producers, aquatic
insects and fish from the streams of Belum-Temengor Forest
Complex (BTFC)
89
Figure 4.3 A dual isotope plot of δ 15N and δ13
C of consumers and producers in
streams of Belum-Temengor Forest Complex (BTFC)
92
Figure 5.1 Seasonal prediction based on monthly amount of rainfall collected in
Grik, Perak. DS indicates dry seasons while WS represents wet
seasons
107
Figure 5.2 The mean density of aquatic insects in five rivers of Belum-
Temengor Forest Complex (BTFC), Perak during dry and wet
seasons
111
Figure 5.3 Ordination of CCA biplot showing the relationship between aquatic
insects’ families and environmental variables during dry season in
Belum Temengor Forest Complex (BTFC)
127
Figure 5.4 Ordination of CCA biplot showing the relationship between aquatic
insects’ families and environmental variables during wet season in Belum Temengor Forest Complex (BTFC)
130
x
LIST OF PLATES
Page
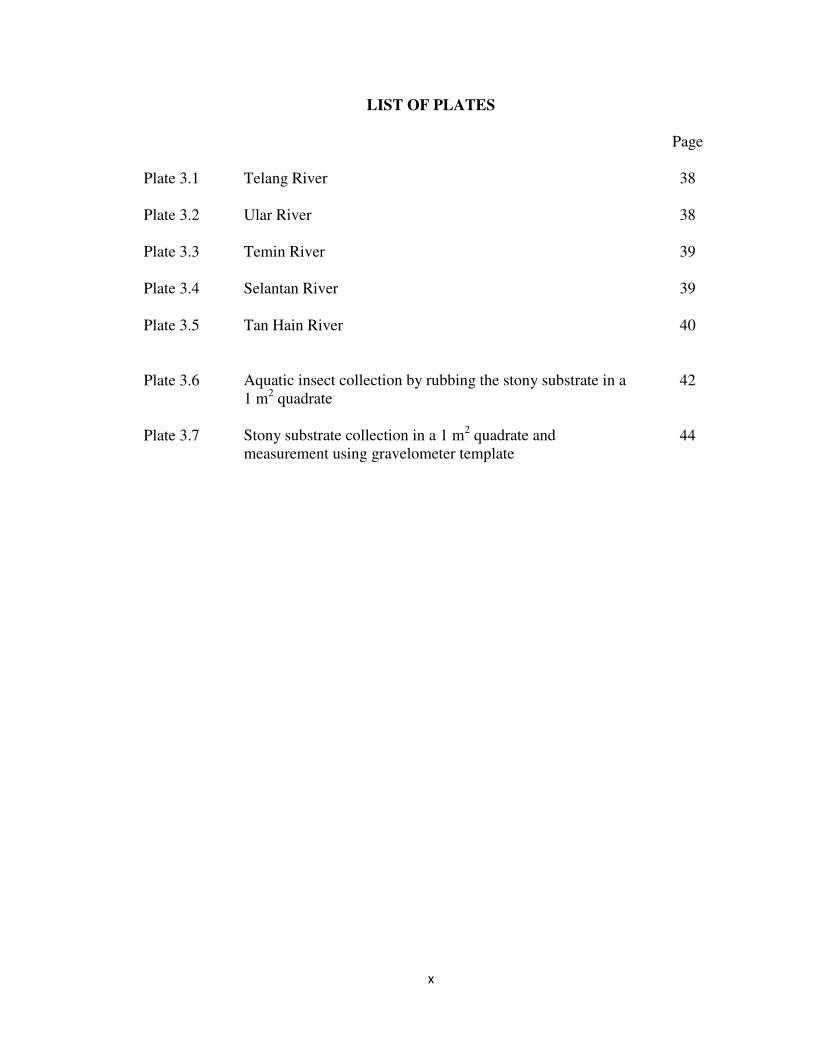
Plate 3.1 Telang River 38
Plate 3.2 Ular River
38
Plate 3.3 Temin River
39
Plate 3.4 Selantan River
39
Plate 3.5 Tan Hain River
40
Plate 3.6 Aquatic insect collection by rubbing the stony substrate in a
1 m2 quadrate
42
Plate 3.7 Stony substrate collection in a 1 m2 quadrate and
measurement using gravelometer template
44
xi
LIST OF APPENDICES
Page
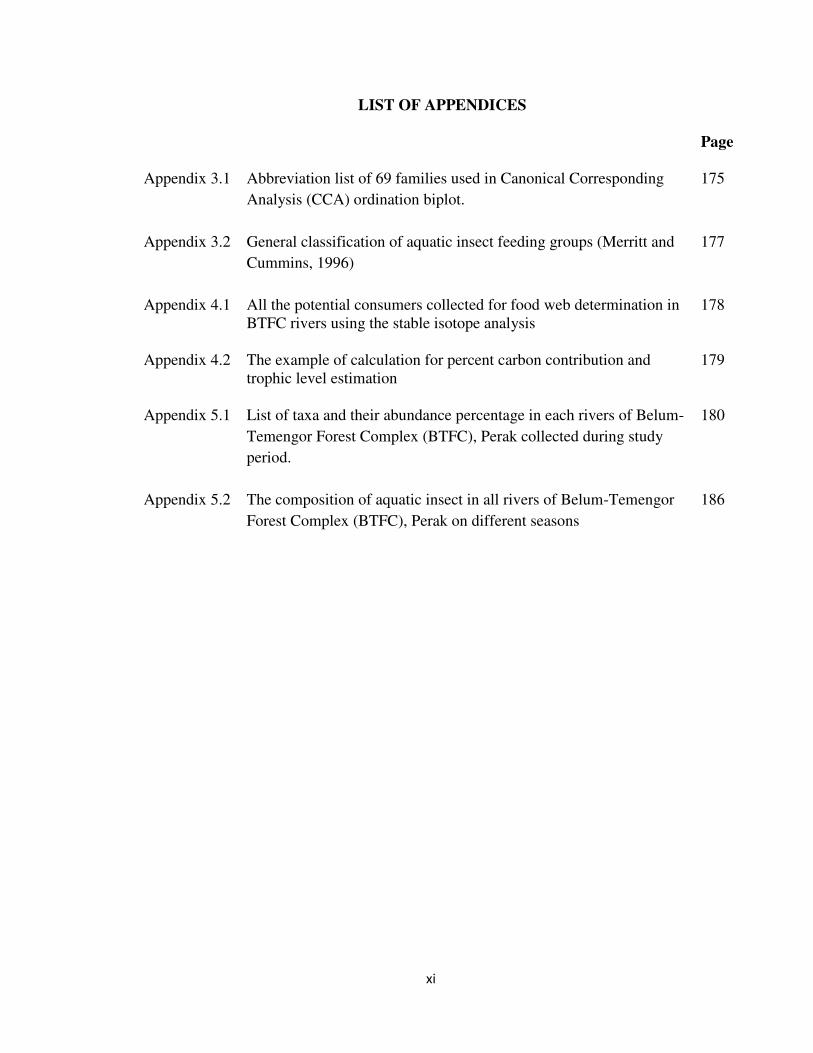
Appendix 3.1 Abbreviation list of 69 families used in Canonical Corresponding
Analysis (CCA) ordination biplot.
175
Appendix 3.2 General classification of aquatic insect feeding groups (Merritt and
Cummins, 1996)
177
Appendix 4.1 All the potential consumers collected for food web determination in
BTFC rivers using the stable isotope analysis
178
Appendix 4.2 The example of calculation for percent carbon contribution and
trophic level estimation
179
Appendix 5.1 List of taxa and their abundance percentage in each rivers of Belum-
Temengor Forest Complex (BTFC), Perak collected during study
period.
180
Appendix 5.2 The composition of aquatic insect in all rivers of Belum-Temengor
Forest Complex (BTFC), Perak on different seasons
186
xii
LIST OF CONFERENCES ATTENDED
1. Dhiya Shafiqah Ridzuan, Che Salmah Md Rawi and Suhaila Abd Hamid. (2014).
Understanding a tropical rainforest stream food web by using stable isotope analysis: In:
International Symposium on Insects (ISoI 2014); Insects: Harnessing the Power,
Unlocking Its Potential, 1st December 2014, Bayview Hotel, Melaka.
2. Che Salmah Md Rawi and Dhiya Shafiqah Ridzuan. (2013). Status of aquatic insects in
Sungai Enam, Temengor Lake: In: Symposium on the 2nd
Temengor Scientific
Expedition (2012), Pulau Banding Foundation, 23rd
August 2013, Belum-Rainforest
Resort, Perak.
3. Bio Colloqium 2013, School of Biological Sciences, Universiti Sains Malaysia
(Proposal) – June 2013.
4. Bio Colloqium 2013, School of Biological Sciences, Universiti Sains Malaysia
(Progress) – November 2013.

xiii
LIST OF ABBREVIATIONS AND SYMBOLS
ANOVA = Analysis of Variance
BOD = Biological Oxygen Demand
BTFC = Belum-Temengor Forest Complex
C = Carbon
CCA = Canonical Correspondence Analysis
COD = Chemical Oxygen Demand
CPOM = Coarse Particulate Organic Matter
DO = Dissolved Oxygen
DS = Dry Season
EA-IRMS = Elemental Analysis-Isotope Ration Mass
Spectrometry
EPT = Ephemeroptera Plecoptera Trichoptera
ETOH = Ethanol
FFGs = Functional Feeding Groups
FPOM = Fine Particulate Organic Matter
GJFR = Gunung Jerai Forest Reserve
IUCN = International Union for Conservation of
Nature
L = Liter
m = Meter
mg = Miligram
MMD = Malaysian Meteorological Department
N = Nitrogen
NH3 =Ammonia
NH3-N = Nitrate
OM = Organic Matter
P = Proton
PBRRC = Pulau Banding Rainforest Research
xiv
Centre
PO43-
= Phosphorus
PSPC = Perak State Parks Corporation
RCC = River Continuum Concept
S = Sulfur
SCA = Stomach Content Analysis
SIA = Stable Isotope Analysis
SPSS = Statistical Package for the Social
Sciences
TI = Total Inertia
TSS = Total Suspended Solid
TVE = Total Variation Explained
VPDB = Vienna Pee Dee Belemnite
WS = Wet Season
α = Alpha
= Beta
w = Beta Diversity
= Gamma
δ = Delta notation
δ13C = Stable Carbon Isotope Signatures
δ15N = Stable Nitrogen Isotope Signatures
Δdt = Diet-tissue Discrimination
0/00 = Part per thousand
xv
PENCIRIAN HABITAT, KEDUDUKAN TROFIK DAN PENGARUH MUSIM KE
ATAS SERANGGA AKUATIK DI BEBERAPA SUNGAI PEMBEKAL TERPILIH
DI KOMPLEKS HUTAN BELUM-TEMENGOR (BTFC), PERAK
ABSTRAK
Kajian serangga akuatik dan tindak balas mereka terhadap keadaan persekitaran
telah digunakan di seluruh dunia sebagai pemantauan biologi kesihatan sungai. Oleh itu,
tujuan kajian ini adalah untuk menentukan pengaruh ciri-ciri fizikal sungai terhadap
kelimpahan dan kepelbagaian invertebrata akuatik dan bagi menentukan sumber makanan
yang berpotensi untuk organisma air tawar. Dalam kajian ini, lima sungai pembekal ke
Kompleks Hutan Belum-Temengor (BTFC) telah dipilih sebagai tapak persampelan.
Dengan menggunakan prosedur pengukuran substrat berbatu dan pengelasan substrat,
substrat utama yang didapati di kawasan kajian adalah kelikir kasar (17 - 32 mm) tetapi
kelimpahan serangga akuatik yang tinggi ditemui pada batu bulat kecil (51.54 %).
Terdapat korelasi yang tinggi di antara kekasaran permukaan (kepelbagaian susunan saiz
substrat dan taburannya di dasar sungai) dan kelimpahan serangga akuatik serta
kepelbagaiannya (kedua-dua korelasi Spearman’s Rho dan ujian regresi berganda pada p
= 0.05). Hubungan rangkaian trofik dalam ekosistem akuatik dikaji melalui analisis
isotop stabil berasaskan bahan organik yang dikutip di kawasan kajian. Anggaran
kedudukan trofik berserta model rantaian makanan mendedahkan bahawa nilai δ13C
tertinggi yang diperoleh adalah daripada alga berfilamen( - 22.68 ± 0.126 0/00) dan δ13
C
terendah pada pek daun alokton ( - 31.58 ± 0.187 0/00). Nilai δ15
N tertinggi telah
diperolehi daripada ikan (8.45 ± 0.177 0/00) dan paling rendah δ15
N dicatatkan pada
makrofit akuatik autokton (2.00 ± 1.234 0/00). ). Berdasarkan keputusan kandungan δ15
N,
xvi
terdapat tiga aras trofik didalam sungai ini dan dicadangkan aras trofik bermula dengan
bahan organik diikuti dengan kumpulan serangga dan berakhir dengan ikan (bahan
organik < serangga < ikan). Kesan perubahan bermusim (basah dan kering) terhadap
taburan serangga akuatik telah menunjukan penurunan ketara (pengurangan 45 %) bagi
kelimpahan dan kepelbagaian (98 genera) pada musim basah berbanding musim kering
(114 genera) (p = 0.000; Ujian Mann-Whitney U). Penurunan yang mendadak pada
kelimpahan subfamili Limoniinae dan Ceratopsyche sp., menunjukkan taksa ini sangat
dipengaruhi oleh arus air yang deras pada musim basah. Suhu air, kedalaman, BOD, DO
dan COD pula berbeza secara ketara antara musim (ujian Kruskal Wallis, p < 0.05).
Fosforus dan nitrogen-ammonia sangat mempengaruhi kelimpahan serangga akuatik
pada musim kering manakala taburan hujan adalah faktor utama yang mengawalatur
komuniti serangga pada musim basah. Hasil daripada kajian ini menekankan pentingnya
komponen substrat sungai, interaksi biologi antara komponen di dalam rantaian makanan
akuatik dan perubahan parameter air mengikut musim terhadap taburan serangga akuatik.
Gabungan di antara pengetahuan ini dengan pelan pemuliharaan akan dapat
meningkatkan pemuliharaan biodiversiti dalam ekologi perhutanan.
xvii
HABITAT CHARACTERIZATION, TROPHIC POSITION AND SEASONAL
INFLUENCE ON AQUATIC INSECTS IN THE SELECTED FEEDER
STREAMS OF BELUM-TEMENGOR FOREST COMPLEX (BTFC), PERAK
ABSTRACT
The study of aquatic insects and their response towards environmental conditions
has been used worldwide for biomonitoring of river health. Thus the purposes of this
study were to determine the influence of physical characteristics of the streams towards
abundance and diversity of aquatic macroinvertebrates and to ascertain potential food
sources of freshwater organism. In this study, five feeder streams of Belum-Temengor
Forest Complex (BTFC) were chosen as sampling sites. Using stony substrate
measurement and substrate classification procedures, the major substrate occupied the
study areas was coarse gravel (17 – 32 mm) but high abundance of aquatic insects was
found on small cobble (51.54%). There was a strong correlation between bed roughness
(arrangement of different mean grain size and their distribution in riverbed) and aquatic
insect abundance as well as its richness (Spearman’s Rho correlation and multiple
regressions tests both at p=0.05). The linkages of the trophic chain in the aquatic
ecosystem were determined by analyzing stable isotope-based organic materials collected
at the study areas. Estimated trophic position in a food web paradigm revealed that the
highest δ13C value was acquired from filamentous algae (-22.68 ± 0.126
0/00) and the
lowest δ13C was in allocthonous leaf packs (-31.58 ± 0.187
0/00). The highest δ15
N value
was obtained from fish (8.45 ± 0.1770/00) and the lowest was recorded in autochthonous
aquatic macrophytes (2.00 ±1.2340/00). Based on the δ 15
N contents, there were three
trophic levels in these streams and it was suggested that the trophic chain began with

xviii
organic matter followed by group of insects and ended with fish (OM<insects<fish).
Plausible effect of seasonal change (wet and dry) on the distribution of aquatic insects
was indicated by significant decrease (45% reduction) in their abundance and richness
(98 genera) in the wet compared to dry seasons (114 genera) (p = 0.000; Mann-Whitney
U test). Large reduction in abundance of the subfamily Limoniinae and Ceratopsyche
sp., implied that these taxa were the most affected by heavy water flow in the wet season.
Water temperature, depth, BOD, DO and COD were significantly different between
seasons (Kruskal Wallis test, p<0.05). Phosphorus and ammonia-nitrogen affected the
abundance of aquatic insects the most in the dry season while rainfall was the main factor
regulating the insect communities in the wet season. The outcome of this study
highlighted the importance river substrate components, biological interaction among
components of aquatic food chain and seasonal variation of water parameters on the
distribution of aquatic insects. Incorporation of this knowledge into the conservation
planning would enhance the preservation of biodiversity in the forested ecosystem.
1
CHAPTER 1
GENERAL INTRODUCTION
1.1 Background
Tropical region is made up of high diversity of biota associated with conducive
environment. Insect populations dominate in large proportion of local biodiversity
especially the aquatic insects (Clarke et al., 2008) in freshwater ecosystem (Bonada et
al., 2006). Out of 30-31 orders of insects, 13 orders of aquatic insects have been
described by Merrit et al., (2008) in the North American freshwater rivers. The
freshwater insects in Malaysian region also constitute almost the similar number of
orders (11 orders) (Yule and Yong, 2004) but may vary by the numbers of families
compared to other regions. The high number of insect population in an ecosystem is
highly associated with the availability of habitat. Most of them inhabit wide range of
aquatic microhabitats from lakes to rivers and from tiny water container to stagnant
water (Voshell, 2009).
In running waters such as rivers, the composition of aquatic insect communities
inhabiting headwater and downstream reaches are different based on available
microhabitats (Meyer et al., 2007). Many earlier studies on the assemblages of
aquatic insects in headwater have found most pollution-sensitive insects such as
ephemeropterans, plecopterans, trichopterans and coleopterans inhabit upper
catchment that provide healthy environment (Hodkinson and Jackson, 2005; Bispo et
al., 2006; Hughes, 2006; Miserendino, 2006). Meanwhile, these groups of insect also
can be found in the lowland rivers but in different quantity of taxa and abundance
2
with an addition of other communities such as snails, oligochaetes, fly larvae and
others. The relationship of different habitat characteristics and taxa composition has
been exploited for water quality assessment using aquatic biota in freshwater
ecosystem.
The usage of aquatic insect as an indicator of water quality is strongly related to
spatial and temporal distribution which closely follows the physical, biological and
chemical conditions of the river (Merritt et al., 2008). Spending most of their life
cycle in the water and having limited mobility, they are easy to collect and identify
thus aquatic insects are suitable to be used in river assessment (Kamsia et al., 2008).
Most of aquatic insects prefer a healthy river habitat with riparian vegetation that may
provide shades and filter the pollutants before entering the river. In addition, insect
assemblages in river are also determined by some of environmental factors for shelter
such as rocks, overhanging tree limbs, logs and roots, vegetation as a place to breed
and hatch their young and sufficient preys to eat (Stuart et al., 2008). In addition,
physicochemical parameters of water bodies such as specific velocity, depth and
temperature are important factors for aquatic living insects.
Fluvial geomorphology also has become one of the important tools in river
management (Thorne et al., 1997; Newson et al., 2002; Downs and Gregory, 2004).
Hydromorphological features of a river can reflect a long term climatic and
geomorphological processes being influenced by the anthropogenic impacts and
global changes (Syrovatka et. al., 2009). Lancaster and Hildrew (1993) have
examined the relationship between the fluctuation of flow and microdistibution of
aquatic macroinvertebrates in structuring the benthic community. Concomitantly, the
3
benthic community composition, abundance and distribution are affected by river
hydraulic and substratum (Quin and Hickey, 1994), including source availability
(Richardson, 1993), water chemistry (Giberson and Hall, 1988), temperature
(Bournaud et al., 1987) and light (Robinson and Minshall, 1986).
Aquatic and terrestrial habitats are interdependent and have been described as
intricate and complex continuum of linked habitat by VanDongen et al. (2011). The
river continuum concept introduced by Vannote et al. (1980) explained that the river
from headwaters to downstream provide different continuous physical gradient of
water depth, river width, water velocity and temperature which also progressively
increase with energy inputs and rate of entropy gain. Thus, it is important to
understand interaction among smaller habitats within the whole environment. The
interaction between terrestrial and aquatic habitats can be quantified by measuring the
rates of energy exchange between trophic levels and proximate habitat using stable
isotopes analysis (Ballinger and Lake, 2006).
Stable isotopes analysis (SIA) has been used as a tool to answer questions in plant
and animal physiology, biogeochemistry, migration patterns, diet composition,
trophic level estimations and food web functioning (Fry, 2006; Bouillon et al., 2012).
In this study, SIA has been applied to determine the trophic base of food webs in
aquatic systems. Salas and Dudgeon (2001) reported that the analysis allowed for the
determination of relative contribution of allochthonous and autochthonous sources
toward the production of consumer biomass. The organic carbon in rivers is derived
from either allochthonous (terrestrial) sources, primarily plant litter, or from
autochthonous sources such as primary producers within the river itself. According to
4
Dudgeon and Bretschko (1996), low order rivers in tropical Asia are generally
considered to be heterotrophics, with high allochthonous inputs and primary
production limited by riparian shading and scouring caused by spates.
Another important factors influencing biological assessments programs of aquatic
ecosystem are seasonal fluctuation and climatic change. In tropical country, seasonal
changes cause by variation in precipitation (Flecker and Feifarek, 1994) play
important role for the aquatic insect assemblages especially the ephemeropterans,
plecopterans and trichopterans (EPT) (Robinson and Minshall, 1986). In addition, the
quantity of precipitation is closely related to the climate change.
According to Milly et al. (2005) and Kundzewics et al. (2008), future climatic
impacts on global freshwaters are important and there will be an increase in
temperature and decrease in rainfall (Lawrence et al., 2010). Furthermore, these
impacts will be compounded by increasing water withdrawal (Palmer et al., 2008).
However, Feio et al. (2010) stated that temporal instability of invertebrate
communities in rivers over long time scale (> 10years) is not well understood. Short
term interval research done by Reynoldson et al. (1997) on community bioassessment
might be less accurate. The temporal variability is a serious issue under a global
climate change scenario in which the benthic communities are expected to drift as
temperature changes and extreme events increase in frequency and intensity
(Easterling et al., 2000; Diffenbaugh et al., 2005; DeToffol et al., 2009). Recently,
several studies have begun to describe some long-term shifts in freshwater
macroinvertebrates assemblages towards directional climatic changes (Daufresne et
al., 2004; Mouthon and Daufresne, 2006; Burgmer et al., 2007; Durance and

5
Ormerod, 2007). A study by Hickling et al. (2005) showed climatic changes had
affected the phenology and distribution of aquatic macroinvertebrate community.
Many Malaysian river ecologists have focused on the use of aquatic
macroinvertebrates as bioindicator in running water since the last decade. The study of
habitat deterioration and water quality assessment on diversity and distribution of benthic
macroinvertebrates have expanded all over Malaysian waters such as at Linggi River,
Negeri Sembilan (Ahmad et al., 2002), Langat River, in Selangor (Azrina et al., 2006),
Belum-Temengor catchment, in Perak (Che Salmah et al., 2007), Telipok River, in Sabah
(Kamsia et al., 2008), Juru River, in Penang (Al-Shami et al., 2010; Al-Shami et al.,
2011) and Kerian River Basin, in Kedah (Nurul Huda, 2011; Nur Adibah, 2011). The
studies of benthic invertebrates encompassed urban rivers and especially pristine forested
upstream rivers. Anthropogenic disturbance becomes a serious threat to the loss of
biodiversity in tropical Asian rivers (Dudgeon, 2000b) and thus receive more attention
from many researchers.
Belum-Temengor Forest Complex (BTFC) is one of the largest protected areas in
northern Peninsular Malaysia, located in state of Perak. BTFC has been gazetted into a
state park in order to conserve and protect the natural heritage in the rain forests. The
areas can be divided into three parts; lower Belum forest reserve, Temengor forest
reserve and Royal Belum State Park. Except for the Royal Belum State Park, the other
two protected areas are allowed for logging and hunting activities through official permits
issued by Perak State Parks Corporation (PSPC). BTFC comprises of a man-made
Temengor Lake due to damming of several rivers for the purpose of generating hydro-
electric power and water supply into Perak River. In 1996, BTFC was developed as one

6
of the ecotourism areas in Malaysia (MOCAT, 1996). As a consequence, more
development and forest clearing were carried out to meet the plan, threatening its pristine
environments.
Jongkar (2000) has initiated a study of aquatic insect diversity in Temengor Dam,
Perak and verified that the distribution of aquatic insects was influenced by the seasonal
changes and the physicochemical characteristics of water. In the same areas, several other
studies had produced important findings on the relationships of habitat and
physicochemical characteristics of river ecosystems with communities of
ephemeropterans (Wan Mohd Hafezul, 2011), trichopterans (Mariam Zhafarina, 2011)
and plecopterans (Wan Nur Asiah, 2011).
To further understand the factors influencing the assemblages of aquatic insects
living in pristine environment, this study examined; i). The influence of fluvial
geomorphology on distribution of aquatic insects ii). The components of trophic level
which linked to the aquatic food chain and iii). The importance of seasonal variation on
aquatic insect distribution in forested river environment. The knowledge gained from this
study would contribute to sustainable development of pristine areas in Malaysia.
7
1.2 Objectives
The study of aquatic insects in selected rivers of BTFC, Perak was focusing on
the following objectives:
1. To identify the importance of physical characteristics of the rivers on the
abundance and diversity of aquatic macroinvertebrates in feeder streams of Belum
– Temengor Complex, Perak.
2. To determine the food sources of aquatic macroinvertebrates and pattern of
nutrient flow along the trophic levels.
3. To determine the impacts of physico chemical parameters on macroinvertebrate
communities in different rivers and seasons.
8
CHAPTER 2
LITERATURE REVIEW
2.1 Aquatic macroinvertebrate distribution
Macroinvertebrates are organisms that are large (macro) enough to be seen with
naked eyes and lack of backbone (invertebrate) (Jacobsen et al., 2008).
Macroinvertebrates are important links between primary producers and higher tropic
levels in aquatic food chains (McIntosh, 2007) and their role in the environment has been
studied widely. Their habitats are closely associated with riparian vegetation, aquatic
plant, biotic and abiotic factor and hydrological factors (Mesa, 2010). They inhabit all
types of running waters, from fast-flowing mountain rivers to slow-moving muddy rivers.
Most of their live parts or life cycles are attached to submerged rocks, logs, and
vegetation. Examples of aquatic macroinvertebrate are insects in their larval or nymphal
forms, crayfish, clams, snails, and worms. Freshwater macroinvertebrate assemblages
may vary at upstream and downstream sites of the same river because they response to
longitudinal gradients in the physical environment and hydrologic conditions, changes in
water quality, proportion of allochthonous and autochthonous organic matter and riparian
vegetation (Cowell et al., 2004).
The tropical river faunas usually have distinctive features in relation to the
abundance and richness orders compared to higher latitudes rivers. It has its own unique
characteristics in seasonality patterns, geographical evolution, temperature and humidity
(Helson et al., 2006; Gopal, 2005). Specifically, the Asian tropical river ecosystems are
inhabited by a diverse fauna composition especially aquatic insect (Jacobsen et al., 2008)
9
with the availability of various habitats and ecological patterns (Dudgeon, 2000a;
Dudgeon, 2000b). However, in terms of abundance, more insects are found in the
temperate region than in the tropics (Dudgeon et al., 2006).
Despite variation between regions, a lowland river and upland river also are
inhabited by different insect communities. In tropical high-altitude river, most of the
faunas are dominated by insects especially Plecoptera, Ephemeroptera, Coleoptera,
Trichoptera and Diptera (Jacobsen, 2008). Meanwhile, the tropical lowland rivers are
relatively rich with crustaceans, snails, insects such as Odonata, Heteroptera and
Trichoptera (Jacobsen et al., 2008). Variation of insects communities in different part of
rivers are determined by various geographical, biological and physicochemical factors.
The distribution and abundance of aquatic macroinvertebrate in rivers are mainly
determined by the association of individuals with the changes in the aquatic environment.
Many earlier studies on freshwater aquatic ecosystem worked on the relationship of
relative abundance and species assemblages with the physical gradients (Slack, 1955;
Minshall, 1968; Ziemer, 1973; Platts, 1979). Later, Vannote et al. (1980) came out with a
River Continuum Concept (RCC), describing the structure and function of communities
along a river system. Generally, the concept proposed that the energy input in the river,
organic matter transport and storage, also the interaction of macroinvertebrate functional
feeding groups along the river systems are regulated largely by the fluvial geomorphic
process. It has been predicted that insects’ communities that consumed allocthonous food
source in head water river have shifted to autocthonous food source in the mid-order
rivers and consequently increase the species richness along the river order (Arscott et al.,
2005).
10
In addition, the aquatic assemblages in rivers are also related to the changes in
environmental factors (Miserendino and Pizzalon, 2003) and habitat stability (Death,
1996). The physicochemical of water characteristics including water temperature,
dissolved oxygen, pH and total suspended solids (Dudgeon, 1999) also contributed to the
variation of insects’ abundance and diversity in certain microhabitat. Most of freshwater
ecologists considered water temperature and dissolved oxygen play important roles in
benthic distribution in aquatic environment (Singh and Sharma, 2014). The oxygen
concentration is higher in cooler water due to high solubility (Bispo et al., 2006). As
described by Lewis (2008), rivers at higher altitude usually low in temperature and high
oxygen in water favored the assemblages of insects compared to lowland rivers. Several
sensitive case insect especially mayflies showed high sensitivity to low oxygen
concentration.
Suspended solid concentration in water flow also need to be considered in the
study of aquatic insect ecology. Although the upland rivers are believed to be less
exposed to the suspended solid loads, the ecological process in rivers such as
photosynthesis are vulnerable to the sediment concentration in water (Lewis, 2008).
Walling and Web (1992) studied several factors that contributed to the presence of
suspended solids in a water catchment such as precipitation, vegetation, soil types and
human activities. Anthropogenic disturbance associated with decreasing of pH level in
water reduced the species richness (Petrin et al., 2008). The nutrients input such as
phosphorus, nitrogen and carbon in tropical rivers also related to the changes in water pH
(Lewis, 2008). Instead of physicochemical factors solely affecting the aquatic
11
assemblages, the biotic interaction such as insects’ predation and competition also need
to be considered (Creed, 2006).
2.2 Habitat heterogeneity and aquatic insect composition
The stability of microhabitat also contributed to aquatic insect allocation in rivers.
Most of Asian upland rivers including Malaysian freshwater rivers composed of stony
bed substrate and covered with canopy vegetation. However, the topography of river at
upland which is steeper and less covered with vegetation cause the river vulnerable to
spate-prone (Jacobsen, 2008). Spate in river consequently cause aquatic insect to drift
from their microhabitat. This kind of disturbance affected the composition and
distribution of aquatic insects in rivers.
Several studies on the interaction of fluvial geomorphology factors with insects’
fauna have been documented such as composition of substrate types (Gurtz and Wallace,
1984), physical features of substrate types (Downes and Jordan, 1993), flow refugia
availability (Gjerlov et al., 2003), disturbance (Leopold, 1994) and food source
availability (Sanson et al., 1995). Meanwhile, Silveira et al. (2006) has suggested the
main factor influencing the microdistribution of macroinvertebrate in river is substrate
size while other factors such as water current, water chemistry and food availability are
also important. The substrate size and water velocity are intercorrelated. The basic
interaction was different substrate types in riverbed could produce different rate of water
current (Jowett et al., 1991). The interaction of these two factors has been documented to
be a major factor in determining distribution of taxa in riverbed (Minshall and Minshall,
1977; Statzner et al., 1988; Rempel et al., 2000; Buss et. al., 2004). Substrate surface

12
types are important for insect colonization. Boyero (2003) reported that river
macroinvertebrate in Penalara Natural Park, Central Spain prefer to colonize on cobble
stones and are found abundant in rough substrate types. Parallel to his finding, other
studies also discovered the preference of insect over various substrates such as non-stony
substrate complexity of wood (O’Connor, 1991) and macrophytes (Jeffries, 1993). The
accumulation of insect over rougher and complex substrate is related to the availability of
food. A rough substrate surface would enhance a development of epilithic layer (Sanson
et al., 1995) and favors community of insect functional feeding group such as scrapers
(Boyero, 2003).
Besides substrate surface preference, some other studies have considered substrate
complexity like the presence of pits and grooves which serve as refugia from predators
and heavy flow (Downes and Jordan, 1993; Way et al., 1995). Hart (1978) also stated
that substrate with more complex shapes were inhabited by many taxa of
macroinvertebrate rather than simpler building structure of substrate. As reported by
Jowett and Richardson (2010), many macroinvertebrates such as mayflies, stoneflies,
cased caddisflies and insects from order Diptera prefer to colonize moderate to large size
substrates such as cobble and boulder while beetle community prefer smaller substrate
sizes such as gravel and small cobble. The preferences of aquatic fauna over substrate
microhabitat gradually changes with their life-stage (Minshall, 1984). The hydrological
study and substrate stability of upland river need further research in order to further
understand the aquatic insect preferences over habitat heterogeneity.
In Malaysia, several studies from freshwater researchers have focused on the
selection of substrate types on macroinvertebrate communities (Suhaila and Che Salmah,

13
2010; Nur Adibah, 2011; Che Salmah et al., 2013; Cob et al., 2014) and the assessment
of substrate thus far relates substrate size measurement and percentage of substrate
embeddedness. Che Salmah et al., (2013) appointed that substrate qualities as the
determinant factor that controls the diversity pattern of aquatic insects in uphill rivers.
The finding showed several orders of aquatic insects including Odonata, Plecoptera,
Ephemeroptera and Trichoptera preferred suitable size substrate as a better habitat
together with other factors such as high canopy cover, fast water flow and high dissolved
oxygen in river. Another study on Ephemeroptera, Plecoptera and Trichoptera (EPT)
assemblages on stony substrate riverbed by Suhaila and Che Salmah (2010) has shown
that these insects especially Phanoperla sp. (Plecoptera) and Macrostemum sp.
(Trichoptera) increase in abundance along with substrate embeddedness. Aquatic fauna
also have high preference for other type of microhabitat heterogeneity in spite of
microhabitat stony substrate stability alone. Cob et al. (2013) found that conch snails
(Gastropoda: Strombidae) accumulated most on the mixture of sea grasses and it could be
possibly explained by the association with feeding strategies and inter-specific
interactions.
Further influence of embedded substrate surface on distribution of
macroinvertebrate taxa was described by Nur Adibah (2011) using a modified substrate
sizes classification of Substrate Codes by Krstolic et al. (2006). She discovered a high
diversity of aquatic macroinvertebrate in Class 2 (large cobble; 12.9 cm) substrate
embeddedness of which 25-49% of the surface area was within sand bed. According to
Death and Winterbourn (1995), substrate embeddedness is closely related to the habitat
stability. Moderately embedded substrate are more stable and can support a diverse

14
community of macroinvertebrates than the loosely, slightly embedded substrate (Melo
and Froehlich, 2001).
2.2.1 Application of gravelometer and pebble counts technique
Studies on particle size distribution usually used a visual estimation technique and
comprised of substrate codes classification (Kondolf and Li, 1992). However, there are
some weaknesses with the visual estimates of surface bed material. First, the estimation
of bed material would rely on the judgment of an observer whereby the observer need to
look at a particular assigned small area of riverbed and do the estimation in a percentage
value (Platts et al., 1983; Bain et al., 1985). Thus, in this study, a sampling coarse
riverbed material method applied is modified from the pebble count technique (Wolman,
1954) using a gravel template called a gravelometer (Stream Systems Technology Center,
1996) for pebble counting in gravel-bed rivers to produce more precise riverbed materials
assessment.
The pebble count method (Wolman, 1954) needs approximately 100 stones which
are randomly collected in an establish area in a river. Then, intermediate axes on each
stone were measured and recorded according to stony size classes following the
Wentworth Scale (Wentworth, 1922). Based on the classification sizes, a cumulative size
distribution curve was produced and a median grain size class can be determined directly
from the graph. The pebble selection must be random in which the investigator must not
try to look at the riverbed while picking the stones. Moreover, to be consistent, use a
specific finger as a specific point when touch the substrate. This method can be applied in
various types of desired reach areas such as pool and riffle, riffle alone or pool alone
15
(Wolman, 1954). The pebble count technique has been applied by many earlier studies
due to its convenient to perform along a river gradient (Brush, 1961; Hey and Thorne,
1983; Mosley and Tinsdale, 1985).
However, this study has employed different method from standard practice by
Wolman (1954). Instead of measuring all three mutually perpendicular axes of a stone (a-
axis, the largest dimension; b-axis, the intermediate; c-axis, the smallest axis), a gravel
template has been used to simplifies the technique. In fact, a determination of particle
size frequency from a b-axis alone could lead to systematic bias especially in sieving
method. The method usually produced a measurement slightly smaller than the particle
size. To overcome this problem, a gravelometer has been created and was proven that the
operator bias is minimized (Stream Systems Technology Center, 1996). The gravelometer
usage has been applied in broad ranges of study especially in river restoration (Parkyn et
al., 2010), freshwater ecology study (Sponseller and Benfield, 2001; Scott et al., 2008;
Peterson, 2010), biological assessment (Joy and Death, 2003), hydraulic modeling (Clark
et al., 2008) and sediment assessment (Clapcott et al., 2011). Thus, the application of
gravelometer in research is suitable especially in freshwater ecological study in Malaysia.
16
2.3 Seasonal changes and water characteristics influence on aquatic insect
distribution
Freshwater rivers which are located in upland usually encounter water flow
fluctuation due to its natural condition such as rainfall or drought. Understanding the
rainfall variability would improve knowledge on water balance dynamics on various
scales including water resources management and ecosystem (Wong et al., 2009).
However, lack of study in peninsular Malaysia concerning rainfall variation was due to
limited numbers of weather stations and encountered problem with missing data (Moten,
1993). Generally, tropical rivers including Malaysia are mainly stable in thermal
condition but seasonality is considered as a resultant from hydrological changes and some
climatic aspects (Dudgeon, 1999). Jacobsen et al. (2008) classified tropical rivers into
aseasonality in equatorial headwater rivers to a truly marked seasonality, wet and dry
season within monsoonal regions. Latitude, local topography, wind patterns and
continentality are the factors influencing the variation of precipitation and altitude in
different regions (Beniston, 2006). Precipitation level is lesser at the higher than in lower
altitudes (Jacobsen, 2008), but heavy rainfall in upland is most likely to cause high
velocity of water and often affect the population of benthic organisms (Death and
Winterbourn, 1995; Townsend et al., 1997).
Based on the River Continuum Concept (RCC) introduced by Vannote et al.
(1980), there is a consequence topic focusing on a prevalence of equilibrium and non-
equilibrium states of a community structure. As discussed by Minshall et al. (1985), in
equilibrium state, most of insects are controlled by biotic factors such as predation and
competition while in non-equilibrium condition, community are influenced by abiotic
17
factors such as spates. Dudgeon (1999) and Death (2008) discovered in tropical river, the
community structure is assumed to be in a non-equilibrium state because the hydrological
variability is still an important factor contributing to decreases in macroinvertebrate
abundances. Various studies have found decrease in macroinvertebrate communities
during wet season and this has generally been attributed to the scouring effects of
increased flow (Flecker and Feifarek, 1994; Bispo et al., 2001).
The fluvial geomorphic process also has potential to change the river landscape
(Stanford et al., 2005) by producing high water discharge at a time. Water discharge was
defined as a volume of water flowing through a cross section of a river channel per unit
time (Gore, 2006). It may produce a river power which able to dislocated suspended
sediment, bed material, particulate organic matter and other nutrients in river. The
allocation of river material has substantial influence on the distribution of living organism
in rivers by altering physical habitat conditions such as dislocation of the substrates and
the availability of energy, as measured by primary production or the state of particulate
organic matter (Vannote et al., 1980; Vannote and Minshall, 1984; Statzner et al., 1988).
The hydrological changes in river water column also will lead to the colonization
of insects at microhabitat. The period of insects’ colonization ranges from few days to
several years depending on the environment and impact of perturbation (Bispo et al.,
2006). Several studies have found a rapid colonization of insects after experiencing
habitat disturbance (Flecker and Feifarek, 1994). According to Flecker and Feifarek
(1994), the abundance of insects in microhabitat has positive correlation with the days of
last perturbation and peak of precipitation. It is indicated that, a longer days elapsed since
last perturbation, more times for insects to reconstruct their population. Bispo et al.
18
(2006) also reported rainy season might cause entry of organic discharge into river that
enhanced insect abundance during that season. In fact, the positive correlation of insects’
density with rainy season was related to the improvement of water quality due to dilution
of organic matter concentration. However, other studies show unremarkable influence of
rainfall over aquatic insect. Melo and Froehlich (2001) stated that insect population was
probably adapted to the predictable drought condition. Poff (1992) also agreed that
seasonal spates are predictable and insects are potentially resistant over disturbances.
Many temporal studies have been performed especially on aquatic insects in
tropical freshwater rivers (Owen and Owen, 1974; Wolda, 1978, 1979; Denliger, 1980;
Wolda and Flowers, 1985). However, in peninsular Malaysia, only several researchers
have worked on the seasonal effects in abundance and diversity of aquatic insects
(Bishop, 1973; Bright, 1982; Jongkar, 2000; Suhaila et al., 2014). A study conducted by
Suhaila et al. (2014) in rivers of Gunung Jerai Forest Reserve, Malaysia has found a
significant influence of seasonal changes on the aquatic insect distribution especially the
Ephemeroptera, Plecoptera and Trichoptera (EPT) orders. The insect abundance and
seasonal relationship was different for all insect orders. The seasonal variation caused by
rainfall changed the environmental characteristics as well as the number of insect
population in the upland rivers. Meanwhile, a study on diversity and habitat preference in
rivers of Rio de Janeiro, Brazil (Baptista et al., 2001) revealed that richness and diversity
of aquatic insects were the highest during the dry season. This was explained by the
presence of habitat stability and availability during the dry season. Baptista et al. (2001)
have found high colonization of insects on leaf litters was favored with the presence of
food and good shelter during that period.
19
However, seasonal changes caused by rainfall also influence the physicochemical
variation in water. Ramirez et al. (2006) found a negative relationship among rainfall,
water level and pH in the water. It is indicated that high water level during rainy season
caused runoff of materials from floodplains and contirubuted to decrease in pH level.
During wet season, many allochthonous inputs from riparian vegetation enter the water
column and produce suspended humic acids that decrease the pH level in water (Clark et
al., 2003). In contrast, increase in water turbidity during rainy season caused reduction in
dissolved oxygen (Ishaq and Khan, 2013). The deficiency of oxygen level in water
influenced the diversity of macroinvertebrate (Ward, 1992) because Sharma et al. (2009)
had found that the diversity of macroinvertebrate was positively correlated with dissolved
oxygen.
In addition, seasonal variation caused by precipitation level also may affect the
insect growth by altering the hatching period and mortality rates (Jacobsen et al., 2008).
Reduced flow due to drought may result in extreme temperature which is harmful to the
aquatic fauna (Singh and Sharma, 2014). Temperature is the most important factor that
influence the life cycle of aquatic insects (Resh et al., 1988). Bispo et al. (2006) stated
that the increase in temperature reduced the oxygen solubility. Thus, the distribution of
some groups of insect is restricted to certain microhabitat of cooler environment
(Dominguez and Ballesteros, 1992). Several studies have showed diversity of
invertebrates decreases as water temperature increases (Stanford and Ward, 1982;
Sharma et al., 2004; Palit et al., 2013). Pinto and Uieda (2007) discovered that seasonal
changes also influence food availability in forest rivers by focusing on forest canopy. The
importance of forest canopy is for controlling water discharge, retaining excessive
20
draining during heavy rainfall and keeping water flow during dry season, and also
providing shade in order to keep the water temperature stable (Pinto and Uieda, 2007).
Consequently, it also controls the distribution of aquatic fauna in river.
2. 4 Measuring river performance using ecological indices
The ecological indices is a basic approach to quantify changes in ecosystem in
order to have better understanding in biological pollution impacts on aquatic fauna (Nur
Adibah, 2011). Generally, the ecological indices are applied to diversity, richness and
evenness of community structure while biological indices are used to measure indicator
organisms. However, only ecological indices were employed in this study to assess
quality of environment on aquatic insect communities. According to Magurran (2004),
different ecological indices yield different function, reliability and effectiveness. In fact,
each of them has potential advantages and limitations.
21
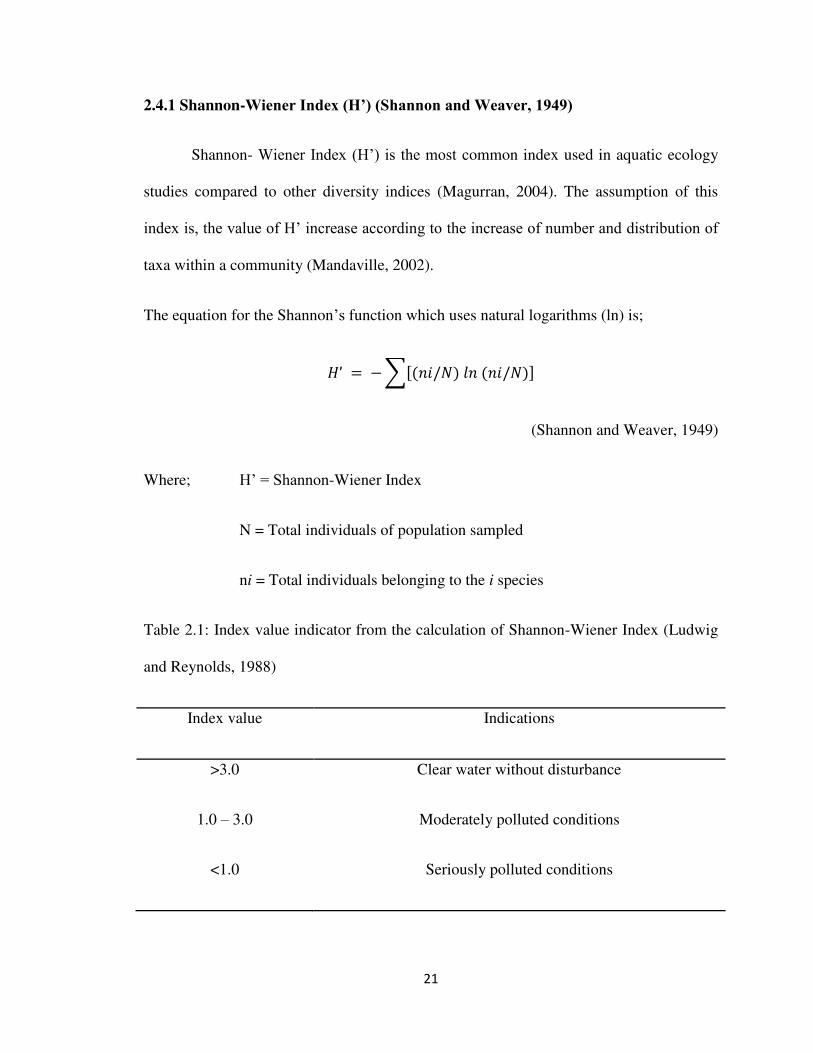
2.4.1 Shannon-Wiener Index (H’) (Shannon and Weaver, 1949)
Shannon- Wiener Index (H’) is the most common index used in aquatic ecology
studies compared to other diversity indices (Magurran, 2004). The assumption of this
index is, the value of H’ increase according to the increase of number and distribution of
taxa within a community (Mandaville, 2002).
The equation for the Shannon’s function which uses natural logarithms (ln) is;
�’ = − ∑[ ��/� �� ��/� ]
(Shannon and Weaver, 1949)
Where; H’ = Shannon-Wiener Index
N = Total individuals of population sampled
ni = Total individuals belonging to the i species
Table 2.1: Index value indicator from the calculation of Shannon-Wiener Index (Ludwig
and Reynolds, 1988)
Index value Indications
>3.0 Clear water without disturbance
1.0 – 3.0 Moderately polluted conditions
<1.0 Seriously polluted conditions
22
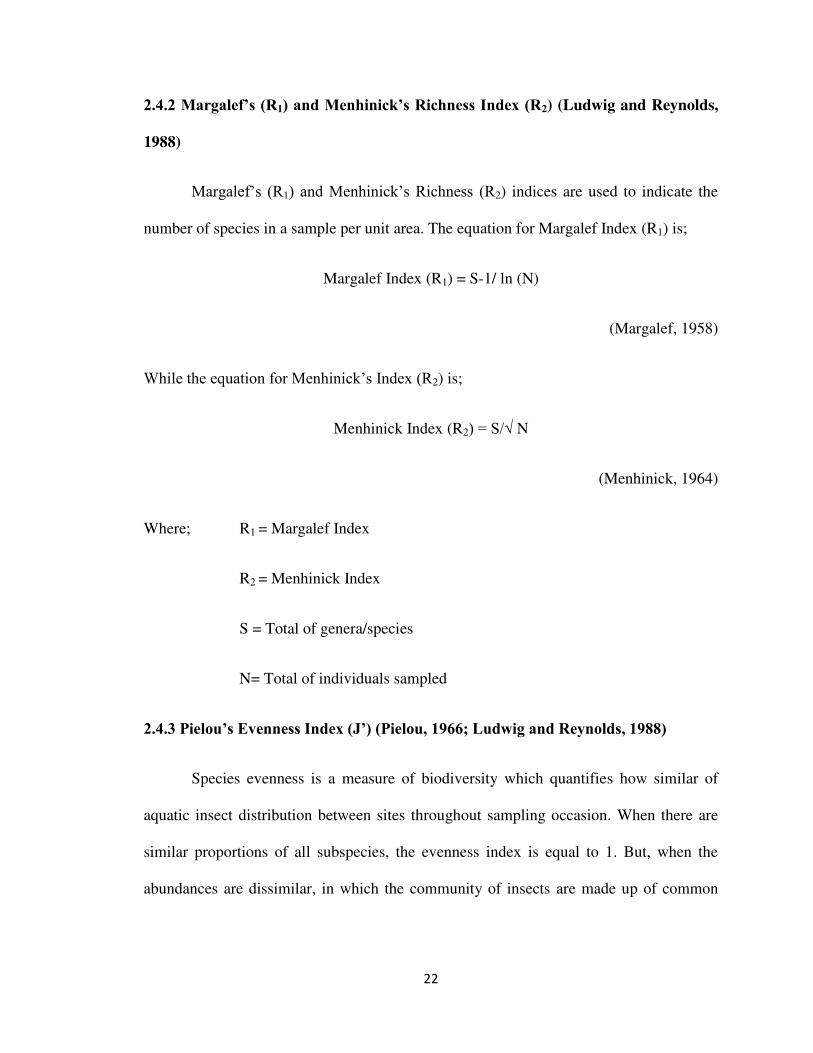
β.4.β Margalef’s (R1) and Menhinick’s Richness Index (R2) (Ludwig and Reynolds,
1988)
Margalef’s (R1) and Menhinick’s Richness (R2) indices are used to indicate the
number of species in a sample per unit area. The equation for Margalef Index (R1) is;
Margalef Index (R1) = S-1/ ln (N)
(Margalef, 1958)
While the equation for Menhinick’s Index (R2) is;
Menhinick Index (R2) = S/√ N
(Menhinick, 1964)
Where; R1 = Margalef Index
R2 = Menhinick Index
S = Total of genera/species
N= Total of individuals sampled
β.4.γ Pielou’s Evenness Index (J’) (Pielou, 1966; Ludwig and Reynolds, 1988)
Species evenness is a measure of biodiversity which quantifies how similar of
aquatic insect distribution between sites throughout sampling occasion. When there are
similar proportions of all subspecies, the evenness index is equal to 1. But, when the
abundances are dissimilar, in which the community of insects are made up of common
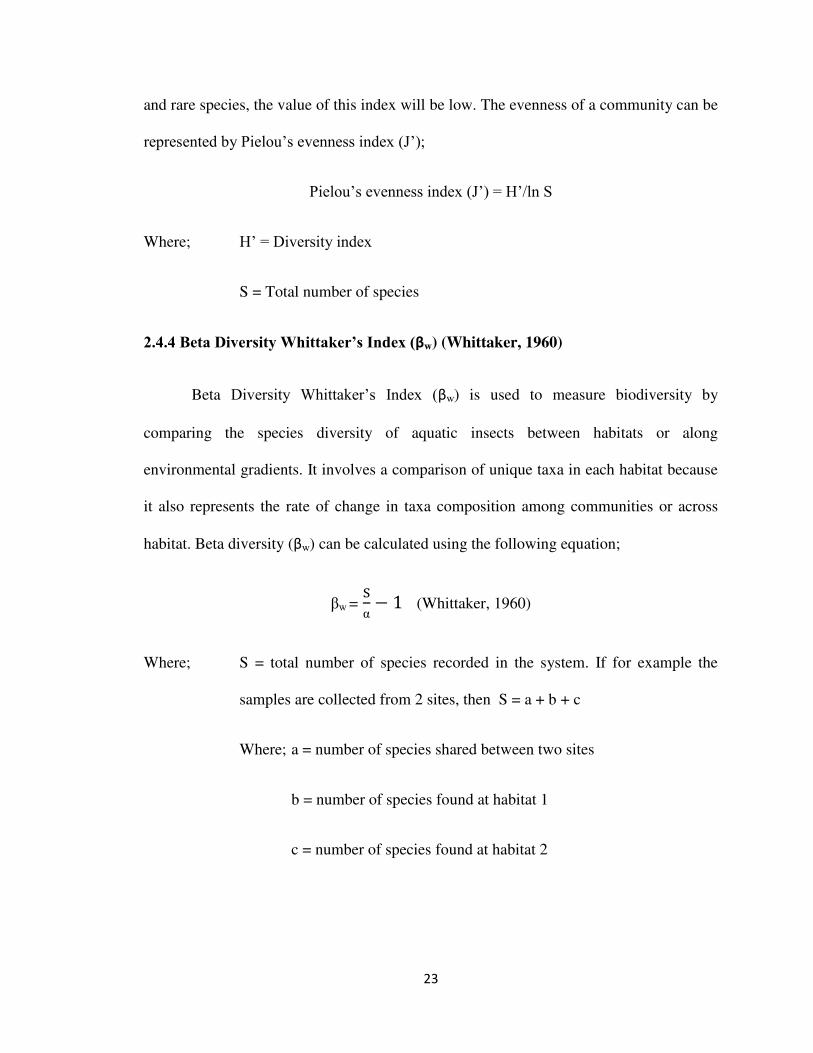
23
and rare species, the value of this index will be low. The evenness of a community can be
represented by Pielou’s evenness index (J’);
Pielou’s evenness index (J’) = H’/ln S
Where; H’ = Diversity index
S = Total number of species
β.4.4 Beta Diversity Whittaker’s Index (βw) (Whittaker, 1960)
Beta Diversity Whittaker’s Index (βw) is used to measure biodiversity by
comparing the species diversity of aquatic insects between habitats or along
environmental gradients. It involves a comparison of unique taxa in each habitat because
it also represents the rate of change in taxa composition among communities or across
habitat. Beta diversity (βw) can be calculated using the following equation;
w = Sα
− 1 (Whittaker, 1960)
Where; S = total number of species recorded in the system. If for example the
samples are collected from 2 sites, then S = a + b + c
Where; a = number of species shared between two sites
b = number of species found at habitat 1
c = number of species found at habitat 2
24
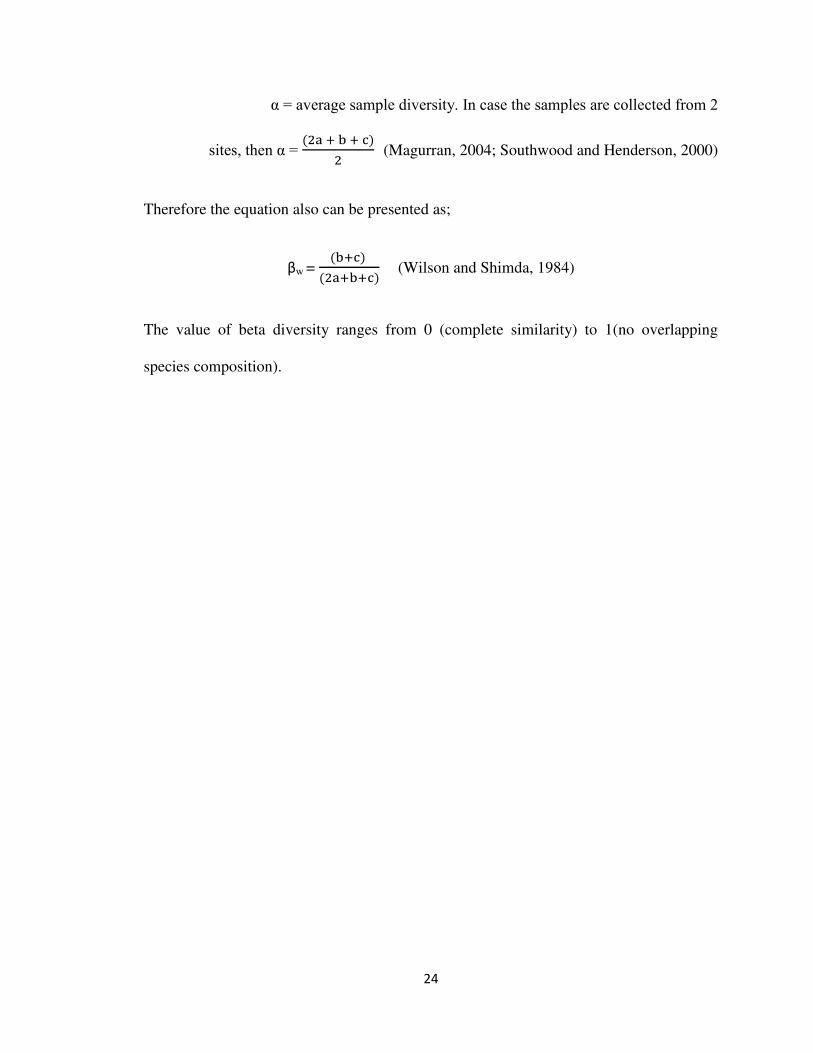
α = average sample diversity. In case the samples are collected from β
sites, then α = 2 + + 2 (Magurran, 2004; Southwood and Henderson, 2000)
Therefore the equation also can be presented as;
βw = + 2 + + (Wilson and Shimda, 1984)
The value of beta diversity ranges from 0 (complete similarity) to 1(no overlapping
species composition).