Embed Size (px)
Citation preview

© 2
018
Nat
ure
Am
eric
a, In
c., p
art
of
Sp
rin
ger
Nat
ure
. All
rig
hts
res
erve
d.
l e t t e r s
nature medicine advance online publication �
Genomic analyses of cancer have identified recurrent point mutations in the RNA splicing factor–encoding genes SF3B1, U2AF1, and SRSF2 that confer an alteration of function1–6. Cancer cells bearing these mutations are preferentially dependent on wild-type (WT) spliceosome function7–11, but clinically relevant means to therapeutically target the spliceosome do not currently exist. Here we describe an orally available modulator of the SF3b complex, H3B-8800, which potently and preferentially kills spliceosome-mutant epithelial and hematologic tumor cells. These killing effects of H3B-8800 are due to its direct interaction with the SF3b complex, as evidenced by loss of H3B-8800 activity in drug-resistant cells bearing mutations in genes encoding SF3b components. Although H3B-8800 modulates WT and mutant spliceosome activity, the preferential killing of spliceosome-mutant cells is due to retention of short, GC-rich introns, which are enriched for genes encoding spliceosome components. These data demonstrate the therapeutic potential of splicing modulation in spliceosome-mutant cancers.
Heterozygous hotspot mutations in the genes encoding the RNA splic-ing factors splicing factor 3B subunit 1 (SF3B1), U2 small nuclear RNA auxiliary factor 1 (U2AF1), and serine and arginine rich splicing factor 2 (SRSF2) are among the most common mutations in patients with myelodysplastic syndromes (MDS)1,12, chronic myelomonocytic leukemia (CMML)1, and chronic lymphocytic leukemia (CLL)2, and they also occur in a number of solid tumors (including breast6, lung4, uveal melanoma3, and pancreatic carcinomas5). RNA splicing is the process through which introns are removed from precursor mRNAs (pre-mRNAs) to produce mature mRNAs13,14. Introns typically fea-ture a short consensus sequence at the 5′ splice site and three ele-ments, namely the branchpoint sequence (BPS), a polypyrimidine tract (Py-tract), and an AG dinucleotide at the intron–exon junction,
at the 3′ splice site. Recent work has demonstrated that mutations in the genes encoding SF3B1, U2AF1, and SRSF2 alter their func-tions in a manner distinct from that underlying loss of function15–17. Specifically, SF3B1 mutations induce cryptic 3′ splice site selection through reduction of branchpoint fidelity17,18. In contrast, mutations in SRSF2 alter its RNA-binding preferences in a sequence-specific manner, thereby changing the efficiency of exon inclusion15,19. Although the mechanisms through which these effects in RNA splicing promote cancer are still being investigated, several groups have demonstrated that cells with a mutant splicing factor are exquisitely sensitive to genetic or pharmacologic perturbation of splicing7–11. However, the splice modulators used in these preclinical studies were not optimized to induce preferential lethality in spliceosome-mutant cells, are not orally bioavailable, and are not progressing for clinical development11,20.
To address these issues, we specifically set out to identify orally bioavailable small molecules with preferential cytotoxicity in spliceosome-mutant cells. Through an iterative medicinal chemis-try effort starting from a scaffold based on pladienolide, we identi-fied the small molecule H3B-8800, which potently competed with pladienolide for binding to SF3b complexes containing either WT or mutant SF3B1 (Fig. 1a and Supplementary Fig. 1a). The com-petitive binding between pladienolide and H3B-8800 was similar for SF3b complexes containing WT SF3B1 and those containing each of eight different cancer-associated SF3B1 mutants (Fig. 1b, Supplementary Fig. 1b, and Supplementary Table 1). In accord-ance with these binding data and similarly to E7107, a pladienolide analog20, H3B-8800 demonstrated dose-dependent inhibition of both canonical splicing and aberrant splicing induced by mutant SF3B1 in in vitro assays of biochemical splicing (Fig. 1c,d and Supplementary Fig. 1c,d). These results indicate that H3B-8800 potently binds and inhibits splicing catalysis by both WT SF3B1 and its mutant forms in vitro.
H3B-8800, an orally available small-molecule splicing modulator, induces lethality in spliceosome-mutant cancersMichael Seiler1,6, Akihide Yoshimi2,6, Rachel Darman1,6, Betty Chan1, Gregg Keaney1, Michael Thomas1, Anant A Agrawal1, Benjamin Caleb1, Alfredo Csibi1, Eckley Sean3, Peter Fekkes1, Craig Karr1, Virginia Klimek4, George Lai3, Linda Lee1, Pavan Kumar1, Stanley Chun-Wei Lee2, Xiang Liu1, Crystal Mackenzie1, Carol Meeske1, Yoshiharu Mizui1, Eric Padron5, Eunice Park1, Ermira Pazolli1, Shouyong Peng1, Sudeep Prajapati1, Justin Taylor2 , Teng Teng1 , John Wang1, Markus Warmuth1, Huilan Yao1, Lihua Yu1, Ping Zhu1, Omar Abdel-Wahab2,4, Peter G Smith1 & Silvia Buonamici1
1H3 Biomedicine Inc., Cambridge, Massachusetts, USA. 2Human Oncology and Pathogenesis Program, Memorial Sloan Kettering Cancer Center, New York, New York, USA. 3Eisai Inc., Andover, Massachusetts, USA. 4Leukemia Service, Department of Medicine, Memorial Sloan Kettering Cancer Center, New York, New York, USA. 5Department of Hematologic Malignancies and Immunology Program, H. Lee Moffitt Cancer Center and Research Institute, Tampa, Florida, USA. 6These authors contributed equally to this work. Correspondence should be addressed to S.B. ([email protected]).
Received 27 March 2017; accepted 10 January 2018; published online 19 February 2018; doi:10.1038/nm.4493

© 2
018
Nat
ure
Am
eric
a, In
c., p
art
of
Sp
rin
ger
Nat
ure
. All
rig
hts
res
erve
d.
l e t t e r s
� advance online publication nature medicine
We next investigated the cellular activity of H3B-8800 using a panel of SF3B1 WT or mutant pancreatic cancer cell lines. H3B-8800 treatment for 72 h resulted in cellular lethality only in the SF3B1-mutant cell line Panc05.04; this lethality was accompa-nied by caspase-3/7 cleavage as early as 24 h following incubation (Fig. 1e). In contrast, E7107 did not show clear differential effects in the same cell panel (Supplementary Fig. 1e), suggesting that H3B-8800 has increased selectivity for SF3B1-mutant cells. Next, we tested the ability of H3B-8800 to modulate canonical and aberrant splicing in Panc05.04 (SF3B1-K700E) cells using a TaqMan Low Density Array
(TLDA), which is designed to evaluate expression of pre-mRNA and mature mRNA isoforms impacted by SF3B1 modulation as well as aberrant RNA splicing events induced by mutations in SF3B117 (Online Methods). H3B-8800 modulated both canonical and aberrant splicing catalysis as revealed by a dose-dependent decrease in the levels of mature methyl-CpG binding domain 4 (MBD4) mRNA and an accu-mulation of MBD4 pre-mRNA in addition to decreased SF3B1-mutant-induced aberrant splicing of MAP3K7 (Fig. 1f,g). Similar results were observed for additional mRNAs in the pancreatic cell lines tested as well as for K562 cells expressing SF3B1WT or SF3B1K700E at the SF3B1
e
g h i
f
SF3B1-R1074H
17S
12S
– + – +
Parental
– +
– + – +
– +ATP:
H3B-8800:
0.33
0.33
0.60
0.47
0.38
0.36
0.60
0.61
0.20
0.20
0.62
0.64
32P-labeled BBR oligonucleotide sequence (2′-O-methyl) mCmAmGmAmUmAmCmUmAmAmCmAmCmUmUmGmA
– + +–
– +
PHF5A-Y36C
–100
–50
0
50
100
150
10–1 100 101 102 103 104 10–1 100 101 102 103 104 10–2 10–1 100 101 102 103 104 10–2 10–1 100 101 102 103 1040
500
1,000
1,500
2,000
2,500
H3B-8800 (nM) H3B-8800 (nM)
% g
row
th
% c
aspa
se-3
/7 a
ctiv
atio
n
Viability (72 h) Apoptosis (24 h)
–100
–50
0
H3B-8800 (nM)
% v
iabi
lity
chan
ge r
elat
ive
to D
MS
O
ParentalPHF5AY36C
SF3B1R1074H
Aberrant junction
ExonExon
–100
–50
0
50
H3B-8800 (nM)
MA
P3K
7 ab
erra
nt ju
nctio
nex
pres
sion
rel
ativ
e to
DM
SO
Pre-mRNAMature mRNA
ExonExon ExonIntron
Exon
0
500
1,000
1,500
H3B-8800 (nM)
MB
D4
pre-
mR
NA
exp
ress
ion
rela
tive
to D
MS
O
–100
–50
0
50
H3B-8800 (nM)
MB
D4
mat
ure
mR
NA
expr
essi
on r
elat
ive
to D
MS
O
a b c d Aberrant junction
ExonExonSF3B1-K700E
SF3B1-H662QSF3B1-K666N
SF3B1-G742D
SF3B1-WTCanonical junction
ExonExon
H3B-8800 (nM)
% r
espo
nse
–100
–75
–50
–25
0
25
% r
espo
nse
–100
–75
–50
–25
0
25
H3B-8800 (nM)
–150
–100
–50
0
50
H3B-8800 (nM)
% s
peci
fic b
indi
ng
10–3 10–1 100 101 102 103 104 10–1 100 101 102 103 10410–2 10–1 100 101 102 103
OHO
O
O
O
N
N
N
OH
10–2 10–1 100 101 102 103 104 10–1 100 101 102 103 104 5′- -3′
Figure 1 H3B-8800 modulates splicing of WT and mutant SF3B1 spliceosomes in vitro and preferentially kills SF3B1-mutant cells. (a) The chemical structure of H3B-8800. (b) Competitive binding of increasing concentrations of H3B-8800 to SF3b complexes isolated from cells overexpressing WT or mutant SF3B1 in the presence of 1 nM pladienolide B. The y axis represents the percentage change (% response) of specific binding relative to the DMSO control of 0%. Data are represented as mean ± s.d.; n = 3 experimental replicates. (c,d) Quantification of canonical (c) and aberrant (d) junctions using the Ad2-ZDHHC16 pre-mRNA substrate, in which the original Ad2 intron was substituted with intron 9 of ZDHHC16, in an in vitro splicing assay using nuclear extracts from 293FT cells overexpressing SF3B1K700E and treated with increasing concentrations of H3B-8800. The y axis represents the percent response relative to the DMSO control (0%). Data are represented as mean ± s.d.; n = 3 technical replicates. (e) Viability and apoptosis of pancreatic cells bearing WT (Panc10.05, HAPFII, CFPAC1, and Panc04.03 in green) or mutant (Panc05.04 in violet) SF3B1 treated with increasing concentrations of H3B-8800. Data are represented as mean ± s.d.; n = 3 technical replicates. (f,g) Effect of increasing concentrations of H3B-8800 on splicing of MBD4 mature mRNA (open circles) and MBD4 pre-mRNA (black circles) (f) and MAP3K7 aberrant junction expression (open diamonds) (g) in Panc05.04 cells as quantified by TLDA after 6 h of treatment with H3B-8800. Data are represented as mean ± s.e.m.; n = 3 technical replicates. (h) Viability of HCT116 parental cells and clones carrying the pladienolide-resistance mutation SF3B1R1074H or PHF5AY36C. Data are represented as mean ± s.d.; n = 3 technical replicates. (i) Binding of U2 snRNA to the canonical branchpoint sequence (2′-O-methyl BBR oligonucleotide in red with the branchpoint adenosine bolded) in nuclear extracts from the same HCT116 cells as in h. Nuclear extracts were incubated in the presence or absence of ATP and H3B-8800; band quantification is shown below each lane. The functional 17S U2 snRNP was formed via ATP-dependent binding of the SF3b complex to the nonfunctional 12S U2 snRNP particle.

© 2
018
Nat
ure
Am
eric
a, In
c., p
art
of
Sp
rin
ger
Nat
ure
. All
rig
hts
res
erve
d.
l e t t e r s
nature medicine advance online publication �
endogenous locus (Supplementary Fig. 2). In addition, H3B-8800, but not E7107, demonstrated preferential killing of K562 cells bear-ing SF3B1K700E as compared to their isogenic SF3B1WT counterparts (Supplementary Fig. 1f).
To verify the selectivity of H3B-8800 for the SF3b complex, we tested the activity of H3B-8800 in HCT116 cells with acquired resist-ance to pladienolides21 due to mutations in SF3B1 or PHF5A, which encode components of the SF3b complex involved in branchpoint recognition22. SF3B1-R1074H or PHF5A-Y36C mutants conferred resistance to H3B-8800, whereas resistance to bortezomib, a com-pound whose mechanistic effects are not splicing dependent, was not observed in cells with these mutants (Fig. 1h and Supplementary Fig. 1g). These data indicate the selectivity of H3B-8800 for the SF3b complex and suggest that H3B-8800 may function through interfering with the interaction between the SF3b complex and the branchpoint. To test this hypothesis, we incubated nuclear extract from HCT116 parental cells with H3B-8800, ATP, and a 32P-2′-O-methyl oligonucle-otide complementary to the U2 small nuclear RNA (snRNA) branch-point binding region (BBR). H3B-8800 inhibited ATP-dependent 17S U2 small nuclear ribonucleoprotein (snRNP) complex formation (Fig. 1i), providing evidence that H3B-8800 abolishes precatalytic spliceosome assembly, as was previously proposed for E7107 (ref. 23). This inhibition was not observed for nuclear extracts from the two H3B-8800-resistant cell lines (Fig. 1i), suggesting that H3B-8800 modulates splicing through interfering with the interaction between the SF3b complex and the branchpoint region.
We next tested the antitumor effects of H3B-8800 in vivo in NOD-SCID interleukin-2 receptor gamma (IL2Rγ)null (NSG) mice bear-ing xenografts of isogenic K562 cells with SF3B1WT or SF3B1K700E (p.K700E was introduced through genetic modification of the endog-enous SF3B1 locus). Oral administration of 2 or 4 mg H3B-8800 per kg body weight (mg/kg) daily slowed the growth of xenografts with SF3B1K700E (P < 0.003, two-way ANOVA followed by Dunnett’s mul-tiple comparison test) but had no effect on SF3B1WT xenografts. Although a dose of 8 mg/kg did slow the growth of SF3B1WT tumors, it completely abrogated growth of SF3B1K700E tumors (P < 0.003; Fig. 2a,b). H3B-8800 similarly demonstrated signifi-cant antitumor activity against xenografts of human HNT-34 acute myeloid leukemia (AML) cells bearing the endogenous mutation encoding SF3B1-K700E (Supplementary Fig. 3a). H3B-8800 reached similar concentrations in plasma as well as in tumors of mice harbor-ing SF3B1WT or SF3B1K700E xenografts, and H3B-8800 modulated both canonical and aberrant splicing in a dose-dependent manner (Fig. 2c and Supplementary Fig. 4). Splicing modulation was observed as early as 1 h following treatment, and splicing returned to pretreatment levels within 24 h following treatment, in accordance with the H3B-8800’s pharmacokinetic profile (Fig. 2c).
H3B-8800 treatment resulted in antileukemic efficacy and splicing modulation in mice bearing AML patient-derived xenografts (PDXs) with a mutation in SF3B1 but had little effect in mice bearing SF3B1WT AML PDXs. In this experiment, NSGS mice (NSG mice with trans-genic expression of human granulocyte-macrophage colony-stimu-lating factor (GM-CSF), IL-3, and SCF) were engrafted with AML cells from a patient with AML harboring SF3B1K700E, NRASA59T, and inv(3)(q21q26.2) or from a patient with AML harboring variations in KRAS, WT1, and MLL1 but lacking any mutations in spliceosome-related genes (Supplementary Table 2). In mice engrafted with the SF3B1K700E PDX, 10 d of H3B-8800 treatment significantly reduced leukemic burden relative to that in vehicle-treated mice, but this treat-ment had negligible effects in the SF3B1WT PDX recipients (Fig. 2d–g
and Supplementary Fig. 5a–c). Analysis of human leukemic cells purified from the mice 3 h after the last dose of H3B-8800 revealed reduced mature mRNA levels and accumulation of pre-mRNA result-ing from canonical splicing events in all H3B-8800-treated mice, regardless of SF3B1 genotype. In contrast, reduced levels of aberrant splicing events induced by a mutation in SF3B1 were observed only in the SF3B1-mutant model (Fig. 2h and Supplementary Fig. 5d).
Given the activity and preferential efficacy of H3B-8800 on SF3B1-mutant human AML xenografts in vivo, we next tested H3B-8800 in mouse models with mutated SRSF2. After observing clear anti-tumor activity of H3B-8800 in mice bearing xenografts compris-ing SRSF2P95H K052 cells (Supplementary Fig. 3b), we generated six PDX models derived from patients with CMML, three of whom harbored SRSF2 mutations (Supplementary Table 2). A PDX model from each patient was generated, and the models were randomized to receive vehicle or H3B-8800 (8 mg/kg orally for 10 d) once human CD45 (hCD45)+ cells in the peripheral blood made up >3% of total mononuclear cells or the concentration of hemoglobin was ≤11 g/dl (Fig. 3a). Of note, leukemic burden was equivalent in mice bearing SRSF2P95H tumors and those with SRSF2WT tumors at the onset of treatment (Supplementary Fig. 6a). H3B-8800 treatment reduced human leukemic burden in peripheral blood and all organs exam-ined in PDX models with SRSF2P95H but not in those with SRSF2WT (Fig. 3b–h and Supplementary Figs. 6b and 7). Moreover, we observed splenomegaly and hepatomegaly due to leukemic cell infiltration, and H3B-8800 treatment for 10 d substantially reduced spleen and liver size only in the SRSF2P95H PDX models (Fig. 3d,e). In accordance with the reduced number of mature leukemic cells observed in H3B-8800-treated PDX models of CMML bearing a mutant spliceosome, but not in those with a WT spliceosome, H3B-8800 treatment reduced the number of immunophenotypically defined leukemia-initiating cells only in spliceosome-mutant PDX models of CMML (Supplementary Fig. 8). Evaluation of RNA splicing in hCD45+ cells 3 h after the last dose of vehicle or H3B-8800 revealed that in vivo H3B-8800 treatment modulated aberrant splicing mediated by mutant SRSF2 (Fig. 3i,j). In addition, H3B-8800 treatment resulted in decreased lev-els of mature MBD4 mRNA and accumulation of MBD4 pre-mRNA (Fig. 3j) as noted for the cell lines treated with H3B-8800 (Fig. 1f). These data further suggest the efficacy and preferential activity H3B-8800 in treating spliceosome-mutant malignancy in vivo.
To further understand the preferential effects of H3B-8800 on spliceosome-mutant cells, we performed RNA-seq analysis of iso-genic SF3B1WT and SF3B1K700E K562 cells treated with DMSO or H3B-8800. We observed enrichment of alternative 3′ splice sites in DMSO-treated K562 SF3B1K700E cells as compared to DMSO-treated SF3B1WT cells (Supplementary Fig. 9a and Supplementary Table 3), consistent with prior reports on the effects of SF3B1 muta-tions on splicing17,18. At a concentration of 13 nM, the half-maximal inhibitory concentration (IC50) of H3B-8800 in a cell viability assay at 72 h following treatment (Supplementary Fig. 1f), H3B-8800 treatment for 6 h primarily induced exon-skipping and intron-retention events in K562 cells expressing SF3B1-K700E as compared to untreated (DMSO control) cells (Supplementary Fig. 9c and Supplementary Table 3). Genes in which splicing events in these categories occurred (n = 4,353) were more likely to show downregulated expression following H3B-8800 treatment as compared to DMSO treatment (P = 2.1 × 10⁻²⁶, bino-mial proportion test; Supplementary Fig. 9d,e and Supplementary Table 4). Expression of genes with intron-retention events that were predicted to induce degradation through the nonsense-mediated decay (NMD) pathway were further downregulated as compared to

© 2
018
Nat
ure
Am
eric
a, In
c., p
art
of
Sp
rin
ger
Nat
ure
. All
rig
hts
res
erve
d.
l e t t e r s
� advance online publication nature medicine
genes with other types of intron-retention events (P = 6.37 × 10⁻²², Kruskal–Wallis H test; Supplementary Fig. 9h). Notably, when we compared the effects of treatment with 13 nM H3B-8800 in K562 cells with SF3B1K700E and in those with SF3B1WT, we observed few effects on alternative 3′ splice site usage but a clear increase in exon-skipping
and intron-retention events; however, the magnitude of these changes was minimal overall (75th quartile < (2 × log2 (fold change)); Supplementary Fig. 9b and Supplementary Table 4). These results suggest that the splicing changes induced by H3B-8800 treatment are similar in WT and SF3B1K700E K562 cells.
a b K562 SF3B1K700E K562 SF3B1WT
10 150
500
1,000
1,500
2,000
2,500 Vehicle
H3B-8800 8 mg/kgH3B-8800 4 mg/kgH3B-8800 2 mg/kg
10 150
500
1,000
1,500
2,000
2,500
Time following initial treatment (d) Time following initial treatment (d)
Vehicle
H3B-8800 8 mg/kgH3B-8800 4 mg/kgH3B-8800 2 mg/kg
Tum
or v
olum
e (m
m3 )
Tum
or v
olum
e (m
m3 )
50 50
*
*
*
*
c Pre-mRNAMature mRNA Aberrant junction
ExonExon ExonIntron
Exon ExonExon
0
50
100
150
200
0.1
1
10
100
1,000
Time (h)
MA
P3K
7 ab
erra
nt ju
nctio
nex
pres
sion
rel
ativ
e to
veh
icle H
3B-8800 concentration
0 1284 16 20 24 0 1284 16 20 24 0 1284 16 20 240
50
100
150
1
10
100
1,000
Time (h)
MB
D4
mat
ure
mR
NA
expr
essi
on r
elat
ive
to v
ehic
le H3B
-8800 concentration
0
200
400
600
1
10
100
1,000
Time (h)
MB
D4
pre-
mR
NA
expr
essi
on r
elat
ive
to v
ehic
le H3B
-8800 concentration
d
h
f
hCD
45
mCD45
Veh
icle
H3B
-880
0
93%
0
500
1,000
1,500
0
20
40
60
80
100*P = 0.015
**P = 0.011
hCD
45
mCD45
89%
90%
69%
65%
77%
85%
AML 24 (SF3B1K700E)
AML 1 (SF3B1WT)
e
g
0
100
200
300
400
500
Spl
een
wei
ght (
mg)
**P = 0.047
0
500
1,000
1,500
2,000
Live
r w
eigh
t (m
g)
P = 0.11
SF3B1WT
–6
–5
–4
–3
–2
–1
0
1
2
log 2
(H3B
-880
0 / v
ehic
le)
BM Spleen Liver Lung PB
*P = 0.037 P = 0.051 **P < 0.01 **P < 0.01 *P = 0.028
51%
11%
1% 7%
23%
BM PBLungLiverSpleen
Veh
icle
H3B
-880
0
BM PBLungLiverSpleen
93%
90%
71%
67%
62%
26%
41%
14%
SF3B1K700E
SF3B1WT SF3B1K700E
Vehicle H3B-8800 Vehicle H3B-8800
Vehicl
e
H3B-8
800
Vehicl
e
H3B-8
800
SF3B1K700ESF3B1WT
0
50
100
150
Rel
ativ
e ex
pres
sion
MBD4 mature mRNAexpression
Vehicle:
MBD4 pre-mRNAexpression
0Rel
ativ
e ex
pres
sion
Aberrant ZDHHC16expression
0Rel
ativ
e ex
pres
sion
100
200
300
400
AML 24mutant
AML 1WT
AML 24mutant
AML 1WT
AML 24mutant
AML 1WT
**P < 0.01 **P < 0.01
**P < 0.01**P < 0.01
**P < 0.01
Notpresent
H3B-8800:+–
+–
–+
–+
Vehicle:H3B-8800:
+–
+–
–+
–+
Vehicle:H3B-8800:
+–
+–
–+
–+
50
100
150
*P < 0.0003 *P < 0.0003
0.1 0.1
Figure 2 H3B-8800 modulates splicing and selectively kills SF3B1-mutant leukemia cells in vivo. (a,b) Mean tumor volume in NSG mice subcutaneously implanted with K562 isogenic cells with (b) or without (a) endogenous mutations in SF3B1. Mice were orally treated with vehicle or H3B-8800 daily at the indicated doses. Mean tumor volumes ± s.e.m. are shown; n = 8 mice per group. (c) Splicing of MBD4 mature mRNA (black open circles), MBD4 pre-mRNA (black circles), and MAP3K7 aberrant junction expression (black open diamonds) in K562 SF3B1K700E tumors after a single oral dose of H3B-8800 (8 mg/kg) as quantified by TLDA. The drug concentration in H3B-8800-treated mice was determined in plasma (red open circles) and tumor (red open squares). Data are represented as mean ± s.e.m.; n = 4 mice per group. The H3B-8800 concentration is shown in ng/ml for plasma and ng/g for tumor. (d) Results from flow cytometry analysis of human versus mouse hematopoietic cells (hCD45 cells versus mCD45 cells) in bone marrow (BM), spleen, liver, lung, and peripheral blood (PB) of PDX-bearing mice with (top) or without (bottom) mutation in SF3B1 following 10 d of vehicle or H3B-8800 treatment (8 mg/kg). Cells were gated on DAPI–mTer119– cells, and the percentages of live Ter119– cells are shown. (e) Quantification of human leukemic cells (hCD45), expressed as log2 of the percentage of hCD45+ cells in HRB-8800-treated mice divided by the percentage of hCD45+ cells in vehicle-treated mice, in each tissue compartment in all PDX models treated with vehicle or H3B-8800. Data are represented as mean ± s.d.; n = 3 mice for SF3B1K700E and 4 for SF3B1WT. (f,g) Spleen (f) and liver (g) weight in PDX mice treated with vehicle or H3B-8800 (8 mg/kg). Data are represented as mean ± s.d.; n = 3 mice for SF3B1K700E and 4 for SF3B1WT. (h) Effects of H3B-8800 (8 mg/kg) on mature mRNA and pre-mRNA MBD4 levels (canonical splicing) and aberrant ZDHHC16 splicing in human cells isolated from PDX mice. The cells were isolated 3 h after the final dose of H3B-8800. Data are represented as mean ± s.d.; n = 3 mice per group. All P values were calculated using a two-tailed Student’s t-test.

© 2
018
Nat
ure
Am
eric
a, In
c., p
art
of
Sp
rin
ger
Nat
ure
. All
rig
hts
res
erve
d.
l e t t e r s
nature medicine advance online publication �
a
Genetically annotatedpatient with CMML
hCD34+ cellselection
NSGShostIntrafemoral
injection
200 cGy
Vehicle
8 mg/kg orallyH3B-8800
5 d per week, daily
5 d per week, daily
Analysis
Analysis
hCD
45
mCD45
BM LiverSpleen PBLung
Veh
icle
H3B
-880
0
15% 49%54%31% 3%
1% 5%9%4% 1%
f
h
b
g
hCD
45
mCD45
BM LiverSpleen PBLung
Veh
icle
H3B
-880
0
13% 7%70%64% 16%
6% 28%69%47% 10%
CMML 5 (SRSF2P95H)
CMML 8 (SRSF2WT)
c
0
1
2
3
4
Time following transplant (d)
hCD
45+ (
%)
VehicleH3B-8800
Treatment period Treatment period
0 10 20 30Time following transplant (d)
hCD
45+ (
%)
VehicleH3B-8800
40 60
20
15
10
0
5
200
dP = 0.74 P = 0.33
e
–6
–5
–4
–3
–2
–1
0
1
2
3
log 2
(H3B
-880
0 / v
ehic
le)
BM Spleen Liver Lung PB
*P = 0.016 *P = 0.016 *P = 0.022 *P = 0.020P = 0.34
i
EZH2
GAPDH
CMML 5Mutant
CMML 7Mutant
CMML 9Mutant
CMML 8WT
CMML 18WTSRSF2 genotype:
j
0
50
100
150
Rel
ativ
e ex
pres
sion
MBD4 mature mRNA expression
Vehicle:
MBD4 pre-mRNA expression
0
100
200
300
400
500
Rel
ativ
e ex
pres
sion
Aberrant CEP57 expression
0
100
200
300
400
Rel
ativ
e ex
pres
sion
Low-power field High-power field
Veh
icle
H3B
-880
0V
ehic
leH
3B-8
800
BM
Slp
een
CMML 5 (SRSF2P95H)
Low-power field High-power field
CMML 8 (SRSF2WT)
CMML 7Mutant
CMML 8WT
CMML 7Mutant
CMML 8WT
CMML 7Mutant
CMML 8WT
**P = 0.0078 P = 0.051 *P = 0.017 **P = 0.0040 **P = 0.0083 *P = 0.045
*P = 0.023 *P = 0.043
H3B-8800:+–
+–
–+
–+
Vehicle:H3B-8800:
+–
+–
–+
–+
Vehicle:H3B-8800:
+–
+–
–+
–+
Vehicle:H3B-8800:
+–
–+
+–
–+
+–
–+
+–
–+
+–
–+
SRSF2P95HSRSF2WT SRSF2P95HSRSF2WT
CMML 5 (SRSF2P95H) CMML 8 (SRSF2WT)
SRSF2P95H
SRSF2WT
Vehicle H3B-88000
100
200
300
400
500
Spl
een
wei
ght (
mg)
Vehicle H3B-88000
20
40
60
80
Spl
een
wei
ght (
mg)
Vehicle H3B-88000
500
1,000
1,500
2,000
Live
r w
eigh
t (m
g)
Vehicle H3B-88000
500
1,000
1,500
Live
r w
eigh
t (m
g)
Figure 3 H3B-8800 demonstrates preferential activity on SRSF2-mutant leukemia in PDX mice. (a) Schematic of H3B-8800 testing in CMML PDX mice. Mice were treated orally with 8 mg/kg of H3B-8800 or vehicle for 10 d (in 2 intervals of 5 d each, separated by 2 d). Each sample was engrafted into two NSGS recipient mice, which were then treated with vehicle or H3B-8800 once human CD45+ (hCD45+) cells in peripheral blood were >3% of total peripheral blood mononuclear cells or hemoglobin was ≤11 g/dl. The mice were killed 2 h after the last dose and were analyzed. (b,c) The effect of H3B-8800 on the percentage of peripheral blood hCD45+ cells in spliceosome-mutant (b) and WT (c) PDX models engrafted with an individual spliceosome-mutant or WT tumor (patient numbering is shown in Supplementary Table 2). The treatment period is marked in gray. (d,e) The effect of H3B-8800 on spleen (d) and liver (e) weight in spliceosome-mutant and WT PDX models bearing tumors derived from 3 patients per genotype. Data are represented as mean ± s.d.; n = 3 mice per group. (f) Flow cytometric analysis of hCD45 versus mCD45 cells in bone marrow, spleen, liver, lung, and peripheral blood of vehicle- or H3B-8800-treated mice engrafted with an individual spliceosome-mutant or WT tumor (cells were gated on DAPI−mTer119− cells, and the percentages of live Ter119− cells are shown). (g) Quantification of the proportion of human leukemic cells in H3B-8800- versus vehicle-treated mice (expressed as log2 of the percentage of hCD45+ cells in H3B-8800-treated mice divided by the percentage of hCD45+ cells in vehicle-treated mice) in each tissue compartment in all PDX models. Data are represented as mean ± s.d.; n = 3 mice per group. (h) Immunohistochemical stains for hCD45+ cells in bone marrow or spleen from H3B-8800- versus vehicle-treated mice. Scale bars, 1,000 µm (CMML 5 low-power field), 200 µm (CMML 8 low-power field) and 50 µm (high-power field). (i,j) EZH2 aberrant junction formation as assessed through RT-PCR (i), and mature mRNA and pre-mRNA MBD4 levels as well as levels of CEP57 aberrant junction expression (j) in cDNA from hCD45+ cells isolated 3 h following the last dose of vehicle or H3B-8800. Data are represented as expression relative to GAPDH; mean ± s.d.; n = 3 technical replicates. All P values were calculated using a two-tailed Student’s t test.
© 2
018
Nat
ure
Am
eric
a, In
c., p
art
of
Sp
rin
ger
Nat
ure
. All
rig
hts
res
erve
d.
l e t t e r s
� advance online publication nature medicine
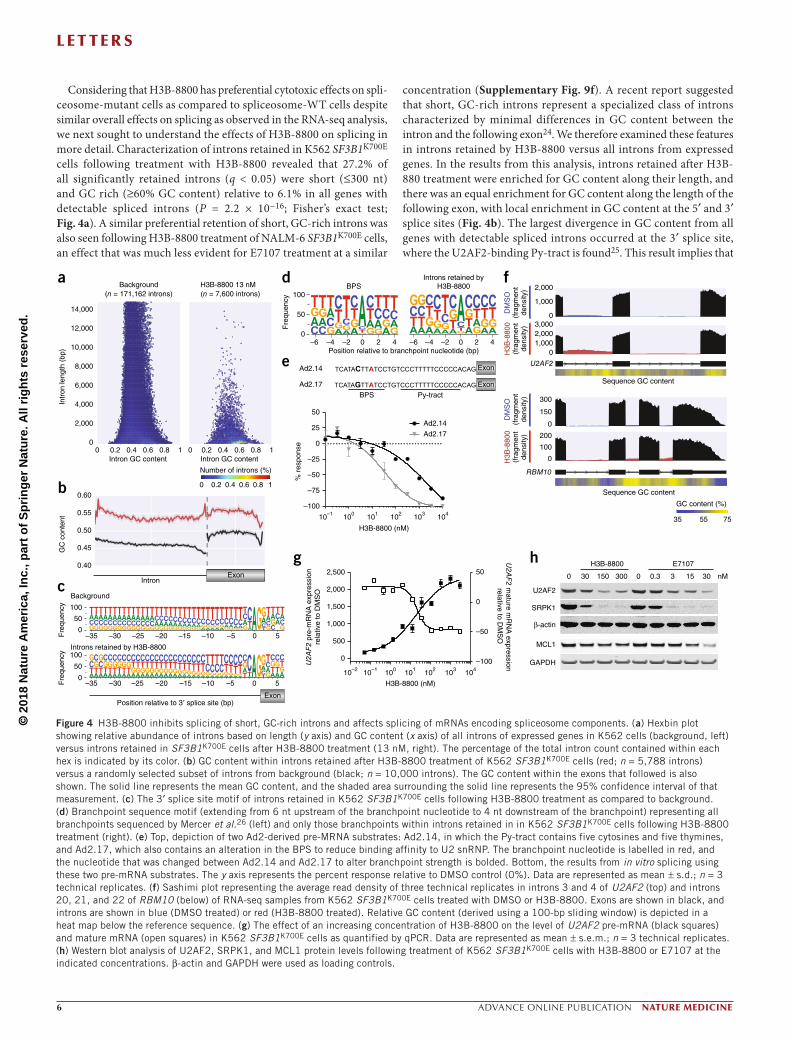
Considering that H3B-8800 has preferential cytotoxic effects on spli-ceosome-mutant cells as compared to spliceosome-WT cells despite similar overall effects on splicing as observed in the RNA-seq analysis, we next sought to understand the effects of H3B-8800 on splicing in more detail. Characterization of introns retained in K562 SF3B1K700E cells following treatment with H3B-8800 revealed that 27.2% of all significantly retained introns (q < 0.05) were short (≤300 nt) and GC rich (≥60% GC content) relative to 6.1% in all genes with detectable spliced introns (P = 2.2 × 10⁻¹⁶; Fisher’s exact test; Fig. 4a). A similar preferential retention of short, GC-rich introns was also seen following H3B-8800 treatment of NALM-6 SF3B1K700E cells, an effect that was much less evident for E7107 treatment at a similar
concentration (Supplementary Fig. 9f). A recent report suggested that short, GC-rich introns represent a specialized class of introns characterized by minimal differences in GC content between the intron and the following exon24. We therefore examined these features in introns retained by H3B-8800 versus all introns from expressed genes. In the results from this analysis, introns retained after H3B-880 treatment were enriched for GC content along their length, and there was an equal enrichment for GC content along the length of the following exon, with local enrichment in GC content at the 5′ and 3′ splice sites (Fig. 4b). The largest divergence in GC content from all genes with detectable spliced introns occurred at the 3′ splice site, where the U2AF2-binding Py-tract is found25. This result implies that
b
f
hgIntron
0.40
0.45
0.50
0.55
0.60
GC
con
tent
Fre
quen
cy
Fre
quen
cy
Fre
quen
cy
0 0.2 0.4
Number of introns (%)
0.6 0.8 1
Exon
d
c
Position relative to 3′ splice site (bp)
Introns retained by H3B-8800
–35 –30 –25 –20 –15 –10 –5 0 5
Background
50
100
0
–35 –30 –25 –20 –15 –10 –5 0 5
50
100
0
0
1,000
2,000
01,0002,0003,000
Sequence GC content
Sequence GC content
U2AF2
DM
SO
(fra
gmen
tde
nsity
)
H3B
-880
0(f
ragm
ent
dens
ity)
DM
SO
(fra
gmen
tde
nsity
)
H3B
-880
0(f
ragm
ent
dens
ity)
–100
–75
–50
–25
0
25
50
H3B-8800 (nM)
% r
espo
nse
100 101 102 103 10410–1
100 101 102 103 10410–110–2
Ad2.14
Ad2.17
0
500
1,000
1,500
2,000
2,500
–100
–50
0
50
H3B-8800 (nM)
U2A
F2
pre-
mR
NA
exp
ress
ion
rela
tive
to D
MS
O
U2A
F2 m
ature mR
NA
expressionrelative to D
MS
O
0
150
300
0
100
200
RBM10
35
GC content (%)
55 75
a
0 0.2 0.4 0.6 0.8 1Intron GC content
0
2,000
4,000
6,000
8,000
10,000
12,000
14,000
Intr
on le
ngth
(bp
)
Background(n = 171,162 introns)
0 0.2 0.4 0.6 0.8 1Intron GC content
H3B-8800 13 nM(n = 7,600 introns)
0 030 150 300 0.3 3 15 30
H3B-8800 E7107
nM
U2AF2
SRPK1
β-actin
MCL1
GAPDH
Exon
e
BPSIntrons retained by
H3B-8800
Ad2.14
Ad2.17
Exon
Py-tractExon
BPS
50
100
0–6 –4 –2 0 2 4 –6 –4 –2 0 2 4
Position relative to branchpoint nucleotide (bp)
Figure 4 H3B-8800 inhibits splicing of short, GC-rich introns and affects splicing of mRNAs encoding spliceosome components. (a) Hexbin plot showing relative abundance of introns based on length (y axis) and GC content (x axis) of all introns of expressed genes in K562 cells (background, left) versus introns retained in SF3B1K700E cells after H3B-8800 treatment (13 nM, right). The percentage of the total intron count contained within each hex is indicated by its color. (b) GC content within introns retained after H3B-8800 treatment of K562 SF3B1K700E cells (red; n = 5,788 introns) versus a randomly selected subset of introns from background (black; n = 10,000 introns). The GC content within the exons that followed is also shown. The solid line represents the mean GC content, and the shaded area surrounding the solid line represents the 95% confidence interval of that measurement. (c) The 3′ splice site motif of introns retained in K562 SF3B1K700E cells following H3B-8800 treatment as compared to background. (d) Branchpoint sequence motif (extending from 6 nt upstream of the branchpoint nucleotide to 4 nt downstream of the branchpoint) representing all branchpoints sequenced by Mercer et al.26 (left) and only those branchpoints within introns retained in in K562 SF3B1K700E cells following H3B-8800 treatment (right). (e) Top, depiction of two Ad2-derived pre-MRNA substrates: Ad2.14, in which the Py-tract contains five cytosines and five thymines, and Ad2.17, which also contains an alteration in the BPS to reduce binding affinity to U2 snRNP. The branchpoint nucleotide is labelled in red, and the nucleotide that was changed between Ad2.14 and Ad2.17 to alter branchpoint strength is bolded. Bottom, the results from in vitro splicing using these two pre-mRNA substrates. The y axis represents the percent response relative to DMSO control (0%). Data are represented as mean ± s.d.; n = 3 technical replicates. (f) Sashimi plot representing the average read density of three technical replicates in introns 3 and 4 of U2AF2 (top) and introns 20, 21, and 22 of RBM10 (below) of RNA-seq samples from K562 SF3B1K700E cells treated with DMSO or H3B-8800. Exons are shown in black, and introns are shown in blue (DMSO treated) or red (H3B-8800 treated). Relative GC content (derived using a 100-bp sliding window) is depicted in a heat map below the reference sequence. (g) The effect of an increasing concentration of H3B-8800 on the level of U2AF2 pre-mRNA (black squares) and mature mRNA (open squares) in K562 SF3B1K700E cells as quantified by qPCR. Data are represented as mean ± s.e.m.; n = 3 technical replicates. (h) Western blot analysis of U2AF2, SRPK1, and MCL1 protein levels following treatment of K562 SF3B1K700E cells with H3B-8800 or E7107 at the indicated concentrations. β-actin and GAPDH were used as loading controls.
© 2
018
Nat
ure
Am
eric
a, In
c., p
art
of
Sp
rin
ger
Nat
ure
. All
rig
hts
res
erve
d.
l e t t e r s
nature medicine advance online publication �
the Py-tract of introns retained by H3B-8800 might be predominantly cytosine-rich although it was expected to be thymine-rich; we con-firmed this inference via sequence motif analysis (Fig. 4c). In contrast, introns retained by E7107 treatment were less GC-rich than those retained by H3B-8800, and they demonstrated a clear increase in GC content in the following exon (Supplementary Fig. 9g).
As the 3′ region of the intron also contains the BPS, we next explored whether the BPS in introns retained following H3B-8800 treatment might also be GC rich. Using branchpoint location data from deep sequencing of K562 cells in Mercer et al.26, we discovered that, within introns retained by H3B-8800, the branchpoint nucleotide was less likely to be the preferred adenosine (68.8% versus 78.7%; P = 4.32 × 10⁻⁹; Fisher’s exact test; Fig. 4d). This result strongly suggests that the BPS might play a role in determining which introns are more likely to be retained following H3B-8800 treatment. To test this hypoth-esis, we designed two substrates, Ad2.14 and Ad2.17, based on the Ad2 construct27; both contain a partially cytosine-rich Py-tract conforming to the observed 3′ splice site sequence motif (Fig. 4e). In addition, a base substitution in the BPS of in Ad2.17 was created to reduce bind-ing fidelity to the U2 snRNP. Using these constructs, we observed that H3B-8800 exhibited a greater modulation of splicing for Ad2.17, the substrate with a weakened BPS (Fig. 4e), suggesting that H3B-8800 selectively modulates splicing of introns with a GC-rich 3′ splice site and a weak BPS. In contrast, in the same experiment, E7107 showed a much smaller shift in IC50 values (Supplementary Fig. 10a). Results from similar experiments using two other sets of Ad2 constructs, each with identical pairs of weak and strong BPS sequences but with differ-ing 3′ splice sites, revealed selective modulation by H3B-8800 of the construct with a weakened BPS in sequences with a Py-tract composed completely of cytosine (Supplementary Fig. 10c) or with a partially cytosine-rich Py-tract that was dissimilar to the observed 3′ splice site sequence motif (Supplementary Fig. 10e). In contrast, E7107 inhibited splicing of both sets of constructs equally (Supplementary Fig. 10b,d). Moreover, in constructs in which the BPS was changed to increase fidelity for binding with the U2 snRNP, E7107 showed potent splicing inhibition (IC50, 8.8 nM), whereas H3B-8800 showed no inhibition (Supplementary Fig. 11a,b). Taken together, these results demonstrate that H3B-8800 exhibits sequence-specific properties that modulate splicing that are distinct from those of E7107.
To test whether genes containing short, GC-rich introns retained following H3B-8800 treatment are involved in pathways that might explain the preferential killing of spliceosome-mutant cells exhib-ited by the drug, we performed pathway enrichment analysis of genes whose splicing was affected by H3B-8800 treatment in the K562 isogenic cell lines. Pathways involved in mRNA splicing were among those significantly enriched for such genes (Supplementary Table 5). Considering the prior data showing that WT spliceosome components are necessary for the survival of spliceosome-mutant cells7–11, we focused on the disruption of mRNA splicing as a possible mechanism underlying the preferential lethality of H3B-8800 against spliceosome-mutant cells. First, we curated a complete list of genes encoding spliceosome components using information from several studies28–30 (Supplementary Table 6 and Online Methods). Short, GC-rich introns retained by H3B-8800 were present in 41 of 404 genes encoding proteins in spliceosome complexes (P = 0.017; binomial proportion test; Supplementary Fig. 11c), including genes encoding RNA binding motif protein 10 (RBM10) and the essential splicing factor U2AF2 (Fig. 4f and Supplementary Fig. 11d,f). H3B-8800 treatment induced intron retention of U2AF2 in a dose-dependent manner (Fig. 4g), indicating that H3B-8800 directly modulated the
splicing of genes encoding proteins required for splicing catalysis, and this modulation resulted in a corresponding loss of U2AF2 protein expression in K562 cells (Fig. 4h). Despite the effects of H3B-8800 on U2AF2 splicing and expression, stable reintroduction of full-length U2AF2 cDNA was unable to rescue H3B-8800-induced cell death (Supplementary Fig. 12), likely because H3B-8800 treatment affects expression of many additional splicing factors. For example, H3B-8800 treatment also induced a dose-dependent reduction in protein expression of SRPK1, a kinase involved in splicing factor regulation. Although both H3B-8800 and E7107 treatment reduced U2AF2 and SRPK1 protein expression, only E7107 treatment induced intron retention of MCL1 and reduced MCL1 protein expression (Fig. 4h and Supplementary Fig. 13), further indicating that E7107 has a more pleiotropic effect on splicing modulation than H3B-8800.
The data presented here identify H3B-8800 as a small molecule that selectively modulates splicing to induce preferential lethality in cancer cells bearing a mutant spliceosome. Recent work has shown that short, GC-rich introns are recognized by an intron-defined splic-ing mechanism that is associated with intron retention observed in cells under normal conditions24. We demonstrate that H3B-8800 preferentially induces retention of these introns, which are charac-terized by short length, high GC content, and low differentiation in GC content compared with the following exon. Together, these findings suggest that H3B-8800 treatment selectively modulates a pre-existing mechanism for splicing recognition, and this selectivity is not shared with other small-molecule modulators of splicing. The enrichment for intron retention in mRNAs encoding RNA splicing factors provides an explanation for H3B-8800’s preferential killing of spliceosome-mutant tumor cells, which are already deficient in splicing, as compared to spliceosome-WT cells. As the expression of numerous RNA splicing factors was influenced by H3B-8800 treat-ment, the killing effects of the drug are not attributable to altered expression of any single target.
Despite the fact that the global alterations in splicing conferred by mutant SF3B1 (refs. 17,18), SRSF2 (refs. 15,19), and U2AF1 (ref. 16) are distinct from one another, cells bearing any of the corresponding mutations have been shown to exhibit dependency on the remaining WT spliceosome7–11. It is therefore predicted that expression of any of these cancer-associated RNA splicing factor mutations would confer sensitivity to H3B-8800. The preferential vulnerability of SRSF2- and SF3B1-mutant cells to H3B-8800 results in the differential lethality observed in vitro and in vivo. The selective mechanism of action of H3B-8800 in combination with its unique pharmacological profile among previously described direct modulators of splicing supports clinical testing of H3B-8800 in genetically defined subsets of cancer with RNA splicing factor mutations.
MeTHodSMethods, including statements of data availability and any associated accession codes and references, are available in the online version of the paper.
Note: Any Supplementary Information and Source Data files are available in the online version of the paper.
ACKnOWLEDGMEnTSWe thank H3 Biomedicine employees for their support in this project. A.Y. was supported by grants from the Aplastic Anemia and Myelodysplastic Syndromes (MDS) International Foundation and the Lauri Strauss Leukemia Foundation. O.A.-W. was supported by grants from the Edward P. Evans Foundation, the Taub Foundation, the Department of Defense Bone Marrow Failure Research Program (BM150092 and W81XWH-12-1-0041), National Institutes of Health National Heart,

© 2
018
Nat
ure
Am
eric
a, In
c., p
art
of
Sp
rin
ger
Nat
ure
. All
rig
hts
res
erve
d.
l e t t e r s
� advance online publication nature medicine
Lung and Blood Institute (R01 HL128239), the Josie Robertson Investigator Program, an award from the Starr Foundation (I8-A8-075), the Leukemia and Lymphoma Society (2314-17) and the Pershing Square Sohn Cancer Research Alliance.
AUTHOR COnTRIBUTIOnSG.K., S. Prajapati, J.W., and X.L guided and performed the medicinal chemistry efforts that led to identification of H3B-8800. E. Park, A.A.A., B.C., and P.F. performed the in vitro biochemical assays. A.Y., A.C., B.C., R.D., C.K., L.L., P.K., C. Mackenzie, Y.M., T.T., H.Y., P.Z., P.G.S., and S.B. performed experiments and analyses of H3B-8800 performance in in vitro cellular assays. M.T., E.S., G.L., E. Pazolli, C. Meeske, P.G.S., M.W., and S.B. performed studies and analyzed data from the cell line xenografts. V.K. and E. Padron provided patient materials used for PDX models. A.Y., S.C-W.L., J.T., and O.A.-W. generated PDX models and performed PDX experiments and analyses. M.S., S. Peng, and L.Y. performed RNA-seq analyses. O.A.-W., M.S., A.A.A., P.G.S., and S.B. wrote the manuscript.
COMPETInG FInAnCIAL InTERESTSThe authors declare competing financial interests: details are available in the online version of the paper.
Reprints and permissions information is available online at http://www.nature.com/reprints/index.html. Publisher’s note: Springer Nature remains neutral with regard to jurisdictional claims in published maps and institutional affiliations.
1. Yoshida, K. et al. Frequent pathway mutations of splicing machinery in myelodysplasia. Nature 478, 64–69 (2011).
2. Wang, L. et al. SF3B1 and other novel cancer genes in chronic lymphocytic leukemia. N. Engl. J. Med. 365, 2497–2506 (2011).
3. Harbour, J.W. et al. Recurrent mutations at codon 625 of the splicing factor SF3B1 in uveal melanoma. Nat. Genet. 45, 133–135 (2013).
4. Imielinski, M. et al. Mapping the hallmarks of lung adenocarcinoma with massively parallel sequencing. Cell 150, 1107–1120 (2012).
5. Bailey, P. et al. Genomic analyses identify molecular subtypes of pancreatic cancer. Nature 531, 47–52 (2016).
6. Ciriello, G. et al. Comprehensive molecular portraits of invasive lobular breast cancer. Cell 163, 506–519 (2015).
7. Zhou, Q. et al. A chemical genetics approach for the functional assessment of novel cancer genes. Cancer Res. 75, 1949–1958 (2015).
8. Fei, D.L. et al. Wild-Type U2AF1 antagonizes the splicing program characteristic of U2AF1-mutant tumors and is required for cell survival. PLoS Genet. 12, e1006384 (2016).
9. Obeng, E.A. et al. Physiologic expression of Sf3b1(K700E) causes impaired erythropoiesis, aberrant splicing, and sensitivity to therapeutic spliceosome modulation. Cancer Cell 30, 404–417 (2016).
10. Shirai, C.L. et al. Mutant U2AF1-expressing cells are sensitive to pharmacological modulation of the spliceosome. Nat. Commun. 8, 14060 (2017).
11. Lee, S.C. et al. Modulation of splicing catalysis for therapeutic targeting of leukemia with mutations in genes encoding spliceosomal proteins. Nat. Med. 22, 672–678 (2016).
12. Papaemmanuil, E. et al. Somatic SF3B1 mutation in myelodysplasia with ring sideroblasts. N. Engl. J. Med. 365, 1384–1395 (2011).
13. Lee, Y. & Rio, D.C. Mechanisms and regulation of alternative pre-mRNA splicing. Annu. Rev. Biochem. 84, 291–323 (2015).
14. Nguyen, T.H. et al. CryoEM structures of two spliceosomal complexes: starter and dessert at the spliceosome feast. Curr. Opin. Struct. Biol. 36, 48–57 (2016).
15. Kim, E. et al. SRSF2 mutations contribute to myelodysplasia by mutant-specific effects on exon recognition. Cancer Cell 27, 617–630 (2015).
16. Ilagan, J.O. et al. U2AF1 mutations alter splice site recognition in hematological malignancies. Genome Res. 25, 14–26 (2015).
17. Darman, R.B. et al. Cancer-Associated SF3B1 hotspot mutations induce cryptic 3′ splice site selection through use of a different branch point. Cell Rep. 13, 1033–1045 (2015).
18. Alsafadi, S. et al. Cancer-associated SF3B1 mutations affect alternative splicing by promoting alternative branchpoint usage. Nat. Commun. 7, 10615 (2016).
19. Zhang, J. et al. Disease-associated mutation in SRSF2 misregulates splicing by altering RNA-binding affinities. Proc. Natl. Acad. Sci. USA 112, E4726–E4734 (2015).
20. Kotake, Y. et al. Splicing factor SF3b as a target of the antitumor natural product pladienolide. Nat. Chem. Biol. 3, 570–575 (2007).
21. Teng, T. et al. Splicing modulators act at the branch point adenosine binding pocket defined by the PHF5A-SF3b complex. Nat. Commun. 8, 15522 (2017).
22. Cretu, C. et al. Molecular Architecture of SF3b and structural consequences of its cancer-related mutations. Mol. Cell 64, 307–319 (2016).
23. Folco, E.G., Coil, K.E. & Reed, R. The anti-tumor drug E7107 reveals an essential role for SF3b in remodeling U2 snRNP to expose the branch point-binding region. Genes Dev. 25, 440–444 (2011).
24. Amit, M. et al. Differential GC content between exons and introns establishes distinct strategies of splice-site recognition. Cell Rep. 1, 543–556 (2012).
25. Jenkins, J.L., Agrawal, A.A., Gupta, A., Green, M.R. & Kielkopf, C.L. U2AF65 adapts to diverse pre-mRNA splice sites through conformational selection of specific and promiscuous RNA recognition motifs. Nucleic Acids Res. 41, 3859–3873 (2013).
26. Mercer, T.R. et al. Genome-wide discovery of human splicing branchpoints. Genome Res. 25, 290–303 (2015).
27. Corrionero, A., Miñana, B. & Valcárcel, J. Reduced fidelity of branch point recognition and alternative splicing induced by the anti-tumor drug spliceostatin A. Genes Dev. 25, 445–459 (2011).
28. Cvitkovic, I. & Jurica, M.S. Spliceosome database: a tool for tracking components of the spliceosome. Nucleic Acids Res. 41, D132–D141 (2013).
29. Hegele, A. et al. Dynamic protein–protein interaction wiring of the human spliceosome. Mol. Cell 45, 567–580 (2012).
30. Barbosa-Morais, N.L., Carmo-Fonseca, M. & Aparício, S. Systematic genome-wide annotation of spliceosomal proteins reveals differential gene family expansion. Genome Res. 16, 66–77 (2006).

© 2
018
Nat
ure
Am
eric
a, In
c., p
art
of
Sp
rin
ger
Nat
ure
. All
rig
hts
res
erve
d.
nature medicinedoi:10.1038/nm.4493
oNLINe MeTHodSCell culture. The cell lines HCT-116, Panc05.04, Panc10.05, HPAF-II, CFPAC1, and Panc04.03 were obtained from the American Type Culture Collection (ATCC) or from RIKEN BioResource Center and cultured as instructed. The isogenic paired cell lines (K562 and NALM-6 SF3B1K700E and SF3B1WT) were generated at Horizon Discovery and were cultured in the presence of Geneticin (0.7 mg/ml, Life Technologies) for selection. HCT116 clones resistant to H3B-8800 were generated by treating cells with 4 nM of splicing modulator for 2 weeks. Splicing modulator was refreshed every 4 d. When needed, confluent cells were split in a 1:3 ratio and were allowed to recover overnight without splicing modulator treatment after reseeding. At the end of the 2 weeks of compound selection, individual clones were transferred to 12-well plates and further expanded without splicing modulator. Genomic DNA was extracted using the DNeasy Blood & Tissue Kit from Qiagen. The resistance mutations SF3B1R1074H and PHF5AY36C were identified by whole exome sequencing.
Cell viability and apoptosis assays. Pancreatic cancer cells were seeded at 750 cells per well in a 384 well plate and treated with compound on day 2. K562 isogenic cells (K562-SF3B1K700E and K562-SF3B1K700K) were seeded at 10,000 cells per well in 96-well plates and treated with compound 4 h later. The relative numbers of viable and apoptotic cells were measured via luminescence using CellTiter-Glo or Caspase-Glo 3/7 (Promega) at the indicated time points as instructed. Bortezomib was obtained from Selleckchem.
Expression plasmids. The plasmids used in the scintillation proximity assay were generated through cloning the cDNA of mxSF3B1 (cloned by ligating the N-terminal half of the product of the mouse Sf3b1 open reading frame (ORF) and the C-terminal half of the product of the Xenopus Sf3b1 ORF, followed by replacement of three amino acid residues in the product of the Xenopus ORF with three human amino acid residues) into the HindIII and KpnI sites of pFlag-CMV2 (Sigma). The mutations corresponding to mxSF3B1-E622D, mxSF3B1-R625L, mxSF3B1-H662Q, mxSF3B1-K666E, mxSF3B1-K666N, mxSF3B1-K666R, mxSF3B1-K700E, and mxSF3B1-G742D were introduced using a site-directed mutagenesis kit (QuikChange II XL, Agilent). Mammalian U2AF2 expression plasmids were generated using Gateway cloning technology (Life Technologies). N-terminal hemagglutinin (HA)-tagged U2AF2 (NP_009210.1) was cloned into the pLenti6.3-V5 Dest vector (Life Technologies), which was used to transfect LentiX293 cells (Promega). Viral supernatants from these cells were then used to infect K562 isogenic cells. These isogenic K562 cells were selected for construct expression using 4 µg/ml blasticidin.
Nuclear extract preparation. Nuclear extracts were prepared from either HeLaS3 or 293F cells expressing pFLAG-mxSF3B1 plasmids, 293FT cells expressing mxSF3B1, or HCT116 cells. Expression of mxSF3B1 was achieved in 293F cells by transfecting pFLAG-CMV-2-mxSF3B1 plasmids using Lipofectamine 2000 (Life Technologies) and in 293FT cells using the PiggyBac transposon system. Cell pellets were resuspended in hypotonic buffer (10 mM HEPES pH 7.9, 1.5 mM MgCl2, 10 mM KCl, 0.2 mM phenylmethylsulfonyl flu-oride (PMSF), and 0.5 mM dithiothreitol (DTT)). The suspension was brought up to a total of 5 packed cell volumes (PCV). After centrifugation (3,000 r.p.m. for 5 min at 4 °C), the supernatant was discarded, and the cells were brought up to 3 PCV with hypotonic buffer and incubated on ice for 10 min. Cells were lysed using a dounce homogenizer and then centrifuged (4,000 r.p.m. for 15 min at 4 °C). The supernatant was discarded, and the pellet was resuspended with ½ packed nuclear volume (PNV) of low-salt buffer (20 mM HEPES pH 7.9, 1.5 mM MgCl2, 20 mM KCl, 0.2 mM EDTA, 25% glycerol, 0.2 mM PMSF, 0.5 mM DTT), followed by ½ PNV of high-salt buffer (same as low salt buffer except 1.4M KCl was used). The nuclei were gently mixed by rotating for 30 min before centrifuging (10,000 r.p.m. for 30 min at 4 °C). The supernatant (nuclear extract) was then dialyzed into storage buffer (20 mM HEPES pH 7.9, 100 mM KCl, 0.2 mM EDTA, 20% glycerol, 0.2 mM PMSF, 0.5 mM DTT). Protein concentration was determined using a NanoDrop 8000 UV-Vis spec-trophotometer (Thermo Scientific).
In vitro splicing reaction. The Ad2-derived31 sequence was cloned into the pGEM-3Z vector (Promega) using 5′ EcoRI and 3′ XbaI restriction sites. The
Ad2 variants (Ad2.12–Ad2.17; all modifications are described in Fig. 4e and Supplementary Fig. 10) were cloned into the pcDNA3.1(+) vector (Promega) using the same restriction sites. The Ad2-ZDHHC16 hybrid substrate, which contained exons from the Ad2 vector and intron 9 from ZDHHC16, was cloned into the pcDNA3.1(+) vector using the same restriction sites. The plasmids were linearized using XbaI and then were used as DNA templates in the in vitro transcription reactions. The Ftz plasmid that lacked introns (Ftz∆i) was obtained from Luo & Reed32 and linearized using EcoRI. All RNAs were in vitro transcribed using the MEGAScript T7 kit and then purified using the MegaClear kit (Invitrogen).
For splicing reactions using pre-mRNAs of Ad2 variants, reactions were prepared using 8 µg of HeLa S3 nuclear extract, 2 ng pre-mRNA, 0.2 ng con-trol, and varying concentrations of H3B-8800, E7107, or DMSO to reach a final reaction volume of 1 µl in this high-throughput assay. After a 15-min preincubation at 30 °C, 1 µl of splicing-activation buffer (0.5 mM ATP, 20 mM creatine phosphate, 1.6 mM MgCl2) was added, and the reactions were incubated for 90 min at 30 °C. The reactions were then quenched with 13 µl DMSO, and 25 nl was used for RT-qPCR.
For splicing reactions using pre-mRNA of the Ad2-ZDHHC16 hybrid, 1 µl reactions were prepared using 10 µg nuclear of extract prepared from 293FT PiggyBac cells, 8 ng pre-mRNA, and varying concentrations of H3B-8800, E7107, or DMSO. After a 15-min preincubation at 30 °C, 2 µl splicing-activation buffer was added, and the reactions were incubated for 90 min at 30 °C. RNA was extracted using a modified protocol from a RNeasy 96 Kit (Qiagen). The splicing reactions were quenched in 350 µl Buffer RLT Plus (Qiagen), and 1.5 volume of ethanol (555 µl) was added. 100 nl of quenched splicing reactions was used for RT-qPCR.
RT-qPCR reactions were prepared using the TaqMan RNA-to-CT 1-step kit (Life Technologies), RNA from splicing reactions, Ad2 canonical junction (forward: 5′-ACTCTCTTCCGCATCGCTGT-3′; reverse: 5′-CCGACGGGTTTCCGATCCAA-3′; probe: 5′-CTGTTGGGCTCGCGGTTG-3′) or Ad2 aberrant junction (probe: 5′-CCAGCTGTTGGGTCTTCGCCC-3′) and Ftz (forward: 5′-TGGCATCAGATTGCAAAGAC-3′; reverse: 5′-ACGCCGGGTGATGTATCTAT-3′; probe: 5′-CGAAACGCACCCGTCAGACG-3′) mRNA primer–probe sets.
Competitive binding assay. SF3B complexes were immunoprecipitated from nuclear extracts prepared from 293F cells overexpressing Flag-tagged SF3B1. First, batch immobilization of antibody to beads was performed through incu-bating 80 µg of anti-SF3B1 antibody (MBL International D221-3, Anti-Sap155 monoclonal antibody) and 24 mg anti-mouse PVT scintillation proximity assay (SPA) beads (PerkinElmer) for 30 min. After centrifugation (14,000 r.p.m. for 5 min at 4 °C), the antibody–bead mixture was resuspended in PBS sup-plemented with PhosSTOP phosphatase inhibitor cocktail (Roche) and cOmplete ULTRA protease inhibitor cocktail (Roche). Nuclear extracts were prepared through diluting 40 mg into a total volume of 16 ml PBS with phosphatase and protease inhibitors, and the mixture was centrifuged (14,000 r.p.m. for 10 min at 4 °C). The supernatant was transferred into a clean tube, and the antibody–bead mixture was added and incubated for 2 h. The beads were collected via centrifuging, washed twice with PBS + 0.1% Triton X-100, and resuspended with 4.8 ml of PBS. 100 µl binding reac-tions were prepared using slurry and varying concentrations of H3B-8800. After 15 min preincubation at room temperature, 1 nM 3H-probe used in Kotake et al.20 was added. The mixture was incubated at room temperature for 15 min, and luminescence signals were read using a MicroBeta2 Plate Counter (PerkinElmer).
RNA-seq sample preparation. NALM-6 and K562 isogenic cell lines were treated with H3B-8800 or E7107 at the indicated doses (in Fig. 4) for 6 h. After treatment, the cells were washed with PBS, and RNA was isolated using PureLink (Life Technology) according to the manufacturer’s instructions. cDNA library preparation, sequencing, and raw read filtering methods were described previously17.
U2 snRNP complex assembly assay. This assay was performed as previously described by Folco23. The BBR 2′-O-methyl oligonucleotide complementary
© 2
018
Nat
ure
Am
eric
a, In
c., p
art
of
Sp
rin
ger
Nat
ure
. All
rig
hts
res
erve
d.
nature medicine doi:10.1038/nm.4493
to the branch point binding region (5′-mCmAmGmAmUmAmCmU-mAmAmCmAmCmUmUmGmA-3′) and the control oligonucleotide (5′-mAmCmUmGmGmCmAmGmCmAmAmUmGmAmCmUmG-3′) were 32P-labeled using γ-ATP (6,000 Ci/mmol, Perkin Elmer) and T4 poly-nucleotide kinase. For all assays, ATP was depleted from nuclear extracts through incubation for 20 min at room temperature. Reaction mixtures (25 µl) containing the depleted nuclear extract (15 µl) were preincubated with or without 1 µM H3B-8800 for 5 min at 30 °C, followed by incubation with 0.5 mM ATP, 3.2 mM MgCl2, and 20 mM creatine phosphate (di-Tris salt) for 5 min at 30 °C. For reactions carried out in the absence of ATP, water was used to sup-plement the reaction mixture. The radiolabeled BBR or control 2′-O-methyl oligonucleotide (30 ng of each) was added to the reaction mixture last, and the reaction mixture was incubated for 5 min at 30 °C. G50 columns (GE Healthcare) were used to purify the samples before adding 6× DNA loading dye and running 1.2% native low-melting agarose (Invitrogen) gels in Tris/borate/EDTA (TBE) buffer at 70 V for 2 h at room temperature to resolve the 17S and 12S U2 snRNPs. Gels were dried, exposed overnight to a PhosphorImager screen, and imaged.
Real time qPCR and RT-PCR. RNA was extracted from K562 cells using PureLink (Life Technology) according to the manufactur-er’s instructions. cDNA was synthesized using the SuperScript VILO II (Life Technologies) according to the manufacturer’s instructions. cDNA was diluted to 20 ng input for qPCR using the Viia7 system (Life Technologies). For detection of U2AF2 mature mRNA, the following primer–probe set was used: forward: 5′-GAGCACGGTGGACTGATTC-3′; reverse: 5′-GGTGATGTGCTCAAAGCCT-3′; and probe: 5′-CCGCCACGAGAAGAAGAAGAAGGT-3′. For detection of U2AF2 pre-mRNA, the following primer–probe set was used: forward: 5′-TGTTGGTCAGACTGAGGTTG-3′; reverse: 5′-GTGGCACGTCCCAGT ATTTA-3′; and probe: 5′-CCGCCACGAGAAGAAGAAGAAGGT-3′.
RNA was extracted from patient material and PDX models and was used to generate cDNA as previously described11. RT-PCR analyses for expression of EZH2 and GAPDH were also performed using methods and primers as previ-ously described11. For detection of the CEP57 aberrant junction, the following primer–probe set was used: forward: 5′-TGCAGACTGGTCTAGAAACAAA-3′; reverse: 5′-GCTAGGGCTTGTGGACTTT-3′; and probe: 5′-ACTCCGTG TGTTCCCAATGCAAGA-3′. Statistical comparison of the expression of mRNA isoforms as determined through qPCR data was performed using the Student’s t-test.
TaqMan low-density arrays. K562 isogenic cell lines were seeded at 1 × 10⁵ cells per well in 96-well plates, and Panc05.04 and Panc10.05 cells were seeded at 1.5 × 10⁴ cells per well in a 96-well plate and treated with various concen-trations of H3B-8800 for 6 h. RNA (0.5 µg for in vitro studies and 2 µg for in vivo studies) was reverse transcribed using the SuperScript VILO cDNA Synthesis Kit (Thermo Fisher Scientific, CA, USA) following the standard pro-tocol. The resulting cDNA was diluted, and the equivalent of 100 ng was used to prepare a sample specific PCR mix by combining with 50 µl TaqMan Gene Expression Master Mix (Thermo Fisher Scientific, CA, USA) and water up to a final volume of 100 µl. The PCR mix was loaded into the sample fill port of a 24-gene custom developed TaqMan Low-Density Array Card (Thermo Fisher Scientific, CA, USA), which contained two printed technical replicates of each assay per fill port. The TLDA was loaded with eight individual samples and prepared and run on the ViiA7 Real-Time PCR system following the manu-facturer’s recommendations (Thermo Fisher Scientific, CA, USA). Threshold PCR cycle (Ct) was determined by the ViiA7 RUO software v 1.2.3 (Thermo Fisher Scientific, CA, USA) using a relative threshold. A Ct greater than or equal to 35 was considered undetectable. Two technical replicates were averaged, and the geometric mean of the expression of five housekeeping genes (B2M, EEF1A1, GAPDH, RPLP0, TUBB) was calculated and used to normalize data as the first step in the comparative ∆∆Ct method followed for analysis. Data shown repre-sent three experimental replicates. The list of primers and probes included in the TLDA are reported in Supplementary Table 7.
K562 isogenic lines, HNT-34 and K052 xenograft models efficacy and pharmacokinetic/pharmacodynamic modeling. 1 × 10⁷ K562 isogenic, HNT-34,
or K052 cells were subcutaneously implanted into the flank of female NSG or CB17-SCID mice of 6–8 weeks of age. Mice were treated with H3B-8800 (10% ethanol, 5% Tween-80, 85% saline) or vehicle control. For the efficacy studies, the mice were orally dosed daily, and the mice were monitored until they reached either of the following endpoints: (i) excessive tumor volume (≥20 mm in its longest diameter), which was measured three times a week (tumor volume calculated by using the ellipsoid formula: (length × width2) / 2), or (ii) development of any health problem, such as paralysis or excessive body weight loss. The differences in tumor volume during the study period between the vehicle-treated and H3B-8800-treated groups were analyzed by two-way analysis of variance (ANOVA) followed by the Dunnett’s multiple comparison test. For the pharmacokinetic/pharmacodynamic modeling (PK/PD) studies, the mice were treated with one dose, and the tumors were collected at the indicated times (in Figs. 2 and 3) after treatment for further analysis. RNA was isolated using RiboPure RNA purification kit (Ambion) and used for TLDA. All mouse studies were carried out under protocols approved by the Institutional Animal Care and Use Committee at H3 Biomedicine.
Patient samples. Diagnostic bone marrow or peripheral blood aspirates were obtained from a total of 6 patients with CMML and 2 patients with AML. This includes 5 patients with CMML who were treated at the Memorial Sloan Kettering Cancer Center (MSKCC) and 1 from the Moffitt Cancer Center as well as 2 patients with AML treated at the MSKCC. Patient sam-ples were collected after obtaining written informed consent. The use of human materials was approved by the Institutional Review Board of MSKCC, the Moffitt Cancer Center Scientific Review Committee, and the University of South Florida Institutional Review Board in accordance with the Declaration of Helsinki. Detailed patient characteristics are listed in Supplementary Table 2.
Generation of PDX models. Generation of CMML PDX models was performed as described in detail by Yoshimi et al.33. Briefly, 6- to 10-week-old NSGS (stock no. 013062) female mice were purchased from the Jackson Laboratory and sub-lethally irradiated (200 cGy) 3–24 h before transplantation followed by direct intrafemoral injection. CD34+ cells were purified from viably frozen patient bone marrow mononuclear cells (MNCs) through immunomagnetic selection (Miltenyi Biotec). CBC analysis was performed on peripheral blood collected from submandibular bleeding or cardiac puncture post-euthanasia using a Procyte Dx Hematology Analyzer (IDEXX Veterinary Diagnostics). Each of the CMML PDX models used has been previously described33. Genomic analysis of patient bone marrow MNCs and FACS-purified hCD45+ cells from corresponding xenografts was performed using a targeted next-generation sequencing assay as previously described34.
AML PDX models were generated as previously described11, with the excep-tion that NSGS mice were used as recipients (as was done for CMML PDX models described above). All mouse studies were carried out according to the MSKCC Guide for the Care and Use of Laboratory Animals.
Flow cytometric analysis of PDX models. All flow cytometric antibodies (for both human and mouse studies) were purchased from BD Pharmingen, Biolegend, or eBioscience. Mononuclear cells (MNCs) from patient samples, xenografted tissues, or PB were stained with a combination of antibodies against human CD3 (hCD3, clone: OKT3, purchased from eBioscience), hCD14 (61D3, eBioscience), hCD16 (3G8, Biolegend), hCD19 (HIB19, eBio-science), hCD33 (WM-53, eBioscience), hCD34 (4H11, eBioscience), hCD38 (HB-7, Biolegend), hCD45 (2D1, eBioscience), hCD45RA (HI100, Biolegend), hCD90 (5E10, Biolegend), and hCD123 (7G3, BD Bioscience). Antibodies against mouse CD45.1 (A20, eBioscience) and Ter119 (catalog no. 116223, Biolegend) were used to exclude host-derived cells.
Quantification of RNA-seq data. Raw sequence reads were aligned to the human reference sequence hg19 by STAR 2.4.2a using two-pass alignment35, and isoform quantification was performed using Kallisto 0.42.4 (ref. 36) against GENCODE annotation v 25 mapped to GRCh37. Estimation of the count of retained introns was performed by defining 6 nt (−3 nt from the splice site and +3 following the splice site) exon–intron boundary regions and counting

© 2
018
Nat
ure
Am
eric
a, In
c., p
art
of
Sp
rin
ger
Nat
ure
. All
rig
hts
res
erve
d.
nature medicinedoi:10.1038/nm.4493
alignments, which fully overlapped these regions, as previously described17. All raw junction counts, including those from exon–intron boundaries, were pooled over all technical replicates per cohort.
Identification of differential splicing events. Differential junction usage was assessed using a binomial z test for differences in proportion between treated and untreated sample pools. Proportions were calculated on the basis of all splice junctions (and exon–intron boundaries) which shared a splice site, similar to the percent spliced in (PSI) measurement17. In order to preserve Gaussian assumptions, only those shared splice sites with total junction count (sum raw count over all junctions sharing that splice site) greater than or equal to 10 reads in both treated and untreated cohorts were considered for analysis. z-scores corresponding to a false discovery rate (FDR)-corrected q value of ≤0.05 for treated (‘aberrant’) junctions and ≤0.20 for untreated (‘canonical’) junctions were considered significant.
Two or more splice junctions that share a splice site and have at least one junction that is significantly upregulated in treated and/or mutant samples or at least one junction significantly upregulated in untreated WT samples were considered aberrant or canonical junctions, respectively. Both aberrant and canonical junctions were required to be present in an event for it to be considered differential splicing. In the case of intron-retention events, both exon–intron boundaries (5′ and 3′ splice sites) as well as the junction bridg-ing the two were required to be significant. We report all differential splicing events in Supplementary Table 3.
Gene expression analysis. Raw gene counts provided by Kallisto v 0.42.4 (ref. 36) were compiled into total gene counts, then analyzed using EdgeR 3.20.2 (ref. 37) to assess the significance of changes between cohorts. Gene changes with a q value < 0.05 were considered significant. Significant gene expression changes are provided in Supplementary Table 4. Prediction of splice variation leading to degradation via the nonsense mediated decay (NMD) pathway was performed as previously described17. For each gene, all associated coding transcripts were assessed to determine whether any annotated exons shared a splice site with a junction found to be significant in treated samples that would modify the protein sequence. If the modified sequence of any transcript would result in a stop codon found >50 nt from the last exon–exon junction—the so-called ‘NMD rule’17 —that transcript is predicted to be targeted by the NMD pathway. Genes for which all transcripts were predicted to be degraded were marked as NMD targeted, and genes for which no transcripts were predicted to be targeted were not. Ambiguous genes, for which some, but not all, transcripts were predicted to be degraded, were ignored. All NMD calls for genes with splicing events are found in Supplementary Table 4.
Analysis of short, GC-rich introns. A hexbin plot was produced using the matplotlib v 2.0.2 library38. Each hex corresponds to a region of length (y axis) and average overall GC content (x axis) space where introns are found. All colored hexes have at least one intron that matches length and GC content within the bounds defined by the hexagon shape. The color of each hex cor-responds to the fraction of the total number of introns represented by introns found in that hex alone.
GC content across an intron and following an exon was assessed by fraction-ating all intronic and exonic sequences into 100 and 50 bins, respectively, of equal sequence length. The average GC content of each bin was assessed, and then the 95% confidence interval was derived using a permutation test by boot-strapping these averages 5,000 times each. Only introns with sequence length ≥100 nt with at least one known following exon (via RefSeq) of length ≥50 nt were considered. If more than one following exon could be used, one was ran-domly selected. The resulting figure was drawn using the tsplot function from the seaborn library (https://zenodo.org/record/12710#.WmeMaHlOmUk).
For all sequence analyses, background introns were sampled from a random subset of all genes with at least one intron expressed in the untreated cellular context (n = 6,405 and n = 5,500 for K562 and NALM-6, respectively) that have an expression distribution that is not significantly different from those genes that contained intron retention events in the treated context, measured by Kruskal H test (P = 0.12 and P = 0.55 for K562 and NALM-6, respectively). Genes with
matching expression levels were identified using Matching Quantiles Estimation (MQE) in seaborn39. Ideally, background transcripts would also be matched on the basis of transcript turnover rate, however to our knowledge, a comprehensive database in the presented cellular contexts is not currently available.
Pathway analysis. Overrepresentation analysis of genes containing short (≤300 nt), GC-rich (≥60%) introns retained by H3B-8800 in K562 SF3B1-K700E cells in the most current Reactome40 pathway reference database was accomplished using PANTHER 11.1 (ref. 41). Pathways significant after correction (q < 0.1) using the Benjamini–Hochberg procedure with at least a twofold enrichment over back-ground are reported in Supplementary Table 5. To build a complete database of spliceosome-related genes, we collected 1,512 spliceosome and splicing-related proteins from three sources: (i) 244 spliceosome proteins provided by Hegele et al.29, (ii) 255 spliceosome proteins annotated by Barbosa-Morais et al.30, and (iii) 1,100 proteins from SpliceosomeDB28. Genes were considered splicesome-related if they were found in (i) or (ii). Genes found in (iii) were considered only if they were found in the same protein family as any protein in (i) or (ii) or they were clearly annotated with specific splicing roles. The final table of 404 spliceo-some genes is given in Supplementary Table 6. Enrichment of intron-retention events among 404 spliceosome genes was accomplished by adding these genes as a separate pathway to the existing Reactome database and performing a binomial proportion test followed by Bonferroni correction as previously described41.
Western blotting. SF3B1-WT or mutant SF3B1-K700E K562 isogenic cell lines were lysed in RIPA buffer (Boston BioProducts) or IP Lysis Buffer (Thermo Fisher Scientific) plus protease-inhibitor cocktail (Mini-complete, EDTA-free, Roche). Forty to fifty micrograms of protein were loaded per well in SDS-PAGE gels (Novex, Life Technologies). Gels were transferred to nitrocel-lulose membranes using iBlot (Life Technologies). Membranes were blocked in Odyssey Blocking Buffer (LiCor) or 5% milk in Tris-buffered saline and 0.1% Tween20 and were probed overnight at 4 °C with antibodies against the following targets: U2AF2 (1:5,000, Sigma, U4758), HA-Tag (1:1,000, Abcam, 18181), SRPK1 (1:1,000, Bethyl, A302-461A), MCL1 (1:1,000, Cell Signaling Technologies, 5453), β-Actin (1:1,000; Sigma-Aldrich, A5441) or GAPDH (1:5,000, Sigma, G8795 and G9545). After washing, blots were probed at room temperature with secondary antibodies labeled with LI-COR IRDye fluorescent dye or conjugated to HRP. Target proteins were detected using the LI-COR system or the ImageQuant (GE) for enhanced chemiluminescence. Uncropped blots are available in Supplementary Figure 14.
Statistical analysis. For all results, the relevant statistical tests are provided in the figure legends as well as the total number of samples (n) in each case and control condition. Unless otherwise specified, P < 0.05 was considered significant. Multiple testing correction was performed where applicable using the Benjamini–Hochberg FDR correction, and q < 0.05 was considered significant unless otherwise specified.
Life Sciences Reporting Summary. Further information on experimental design is available in the Life Sciences Reporting Summary.
Data availability statement. All RNA sequencing data used in this manuscript are available in GEO under accession number GSE95011.
31. Pellizzoni, L., Kataoka, N., Charroux, B. & Dreyfuss, G. A novel function for SMN, the spinal muscular atrophy disease gene product, in pre-mRNA splicing. Cell 95, 615–624 (1998).
32. Luo, M.J. & Reed, R. Splicing is required for rapid and efficient mRNA export in metazoans. Proc. Natl. Acad. Sci. USA 96, 14937–14942 (1999).
33. Yoshimi, A. et al. Robust patient-derived xenografts of MDS/MPN overlap syndromes capture the unique characteristics of CMML and JMML. Blood 130, 397–407 (2017).
34. Cheng, D.T. et al. Memorial Sloan Kettering-integrated mutation profiling of actionable cancer targets (MSK-IMPACT): a hybridization capture-based next-generation sequencing clinical assay for solid tumor molecular oncology. J. Mol. Diagn. 17, 251–264 (2015).
35. Dobin, A. et al. STAR: ultrafast universal RNA-seq aligner. Bioinformatics 29, 15–21 (2013).

© 2
018
Nat
ure
Am
eric
a, In
c., p
art
of
Sp
rin
ger
Nat
ure
. All
rig
hts
res
erve
d.
nature medicine doi:10.1038/nm.4493
36. Bray, N.L., Pimentel, H., Melsted, P. & Pachter, L. Near-optimal probabilistic RNA-seq quantification. Nat. Biotechnol. 34, 525–527 (2016).
37. Robinson, M.D., McCarthy, D.J. & Smyth, G.K. edgeR: a Bioconductor package for differential expression analysis of digital gene expression data. Bioinformatics 26, 139–140 (2010).
38. Hunter, J. D. Matplotlib: A 2D Graphics Environment. Computing in Science and Engineering 9, 90–95 (2007).
39. Sgouropoulos, N., Yao, Q. & Yastremiz, C. Matching a Distribution by Matching Quantiles Estimation. J. Am. Stat. Assoc. 110, 742–759 (2015).
40. Croft, D. et al. The Reactome pathway knowledgebase. Nucleic Acids Res. 42, D472–D477 (2014).
41. Thomas, P.D. et al. PANTHER: a browsable database of gene products organized by biological function, using curated protein family and subfamily classification. Nucleic Acids Res. 31, 334–341 (2003).

1
nature research | life sciences reporting summ
aryJune 2017
Corresponding Author: Silvia Buonamici
Date: Jan 8, 2018
Life Sciences Reporting SummaryNature Research wishes to improve the reproducibility of the work we publish. This form is published with all life science papers and is intended to promote consistency and transparency in reporting. All life sciences submissions use this form; while some list items might not apply to an individual manuscript, all fields must be completed for clarity.
For further information on the points included in this form, see Reporting Life Sciences Research. For further information on Nature Research policies, including our data availability policy, see Authors & Referees and the Editorial Policy Checklist.
Experimental design1. Sample size
Describe how sample size was determined. For the in vivo experiments the number of animals included in each arm of the efficacy study was decided based on the variability of the tumor growth within the animals. The variability of tumor growth was evaluated during the model development study for each model. For the RNAseq experiments 3 replicates were included for each condition.
2. Data exclusions
Describe any data exclusions. No data excluded
3. Replication
Describe whether the experimental findings were reliably reproduced. The experiments were repeated a minimum of 3 times for all the in vitro experiments.
4. Randomization
Describe how samples/organisms/participants were allocated into experimental groups.
For the efficacy study the animals were randomized to have a mean tumor volume and weight similar across the different groups.
5. Blinding
Describe whether the investigators were blinded to group allocation during data collection and/or analysis.
No blinding was used in these studies as the person that performed the experiment also analyzed the data.
Note: all studies involving animals and/or human research participants must disclose whether blinding and randomization were used.
6. Statistical parameters For all figures and tables that use statistical methods, confirm that the following items are present in relevant figure legends (or the Methods section if additional space is needed).
n/a Confirmed
The exact sample size (n) for each experimental group/condition, given as a discrete number and unit of measurement (animals, litters, cultures, etc.)
A description of how samples were collected, noting whether measurements were taken from distinct samples or whether the same sample was measured repeatedly.
A statement indicating how many times each experiment was replicated
The statistical test(s) used and whether they are one- or two-sided (note: only common tests should be described solely by name; more complex techniques should be described in the Methods section)
A description of any assumptions or corrections, such as an adjustment for multiple comparisons
The test results (e.g. p values) given as exact values whenever possible and with confidence intervals noted
A summary of the descriptive statistics, including central tendency (e.g. median, mean) and variation (e.g. standard deviation, interquartile range)
Clearly defined error bars
See the web collection on statistics for biologists for further resources and guidance.
Nature Medicine: doi:10.1038/nm.4493

2
nature research | life sciences reporting summ
aryJune 2017
SoftwarePolicy information about availability of computer code
7. Software
Describe the software used to analyze the data in this study. Kallisto 0.42.4, STAR 2.4.2a, EdgeR 3.20.2, matplotlib 2.0.2, PANTHER 11.1
For all studies, we encourage code deposition in a community repository (e.g. GitHub). Authors must make computer code available to editors and reviewers upon request. The Nature Methods guidance for providing algorithms and software for publication may be useful for any submission.
Materials and reagentsPolicy information about availability of materials
8. Materials availability
Indicate whether there are restrictions on availability of unique materials or if these materials are only available for distribution by a for-profit company.
All materials will be available by request and MTA will be required
9. Antibodies
Describe the antibodies used and how they were validated for use in the system under study (i.e. assay and species).
SF3B1 (MBL International D221-3, Anti-Sap155 mAb), U2AF2 (Sigma, U4758), HATag (Abcam, 18181), SRPK1 (Bethyl, A302-461A), MCL1 (Cell Signaling Technologies, #5453), beta-Actin (Sigma-Aldrich, A5441) or GAPDH (Sigma G8795 and G9545).
10. Eukaryotic cell linesa. State the source of each eukaryotic cell line used. HCT-116, Panc05.04, Panc10.05, HPAF-II, CFPAC1 and Panc04.03 were
obtained from the American Type Culture Collection (ATCC) . The isogenic paired cell lines (K562 and Nalm-6 SF3B1K700E and SF3B1WT) generated at Horizon Discovery.
b. Describe the method of cell line authentication used. An aliquote of each cell lines were authenticated using ATCC DNA fingerprinting.
c. Report whether the cell lines were tested for mycoplasma contamination.
All cell lines were tested at IDEXX using IMPACT1 testing.
d. If any of the cell lines used in the paper are listed in the database of commonly misidentified cell lines maintained by ICLAC, provide a scientific rationale for their use.
No commonly misidentified cell lines were used.
Animals and human research participantsPolicy information about studies involving animals; when reporting animal research, follow the ARRIVE guidelines
11. Description of research animalsProvide details on animals and/or animal-derived materials used in the study.
Female NSG mice were purchased from Charles river and female CB17-SCID or NSGS mice from the Jackson Laboratory (6-10 weeks old).
Policy information about studies involving human research participants
12. Description of human research participantsDescribe the covariate-relevant population characteristics of the human research participants.
The study did not involve human research participants.
Nature Medicine: doi:10.1038/nm.4493

nature research | flow cytom
etry reporting summ
aryJune 2017
1
Corresponding author(s): Silvia Buonamici
Initial submission Revised version Final submission
Flow Cytometry Reporting Summary Form fields will expand as needed. Please do not leave fields blank.
Data presentationFor all flow cytometry data, confirm that:
1. The axis labels state the marker and fluorochrome used (e.g. CD4-FITC).
2. The axis scales are clearly visible. Include numbers along axes only for bottom left plot of group (a 'group' is an analysis of identical markers).
3. All plots are contour plots with outliers or pseudocolor plots.
4. A numerical value for number of cells or percentage (with statistics) is provided.
Methodological details5. Describe the sample preparation. The bone marrow (BM), spleen, liver, lung, and peripheral blood (PB) from
NSGS xenograft mice were used for flow cytometric analysis. BM, spleen, and PB were lysed with ACK (Ammonium-Chloride-Potassium) lysing buffer to collect mononuclear cells and then washed with ice-cold PBS. The samples were stained with a combination of antibodies against human CD3 (hCD3, SK7/HIT3a), hCD14 (61D3/MφP9), hCD16 (3G8), hCD19 (HIB19), hCD33 (WM-53/P67.6), hCD34 (4H11/581), hCD38 (HIT2), hCD45 (HI30), hCD45RA (HI100), hCD90 (5E10), and hCD123 (7G3) in PBS with 2% BSA for 30 min on ice. Antibodies against mouse CD45.1 (A20) and Ter119 were used to exclude host-derived cells. DAPI was used to exclude dead cells. The final staining volume was 100 μl, and the final concentration for all antibodies used was 1:200.
6. Identify the instrument used for data collection. All FACS sorting was performed on FACS Aria, and analysis was performed on an LSRII or LSR Fortessa (BD Biosciences).
7. Describe the software used to collect and analyze the flow cytometry data.
FlowJo Ver.9 was used for analysis of flow cytometry data.
8. Describe the abundance of the relevant cell populations within post-sort fractions.
To check the purity of human CD45 (hCD45) positivity in post-sort samples, the sorted samples were analyzed for hCD45 in FACS Aria (BD Biosciences) and samples with >99% hCD45 cells were used for RNA extraction.
9. Describe the gating strategy used. The FSC/SSC gates of the starting cell population was set in order to include all the lineages of human and mouse hematopoietic cells such as granulocytes, monocytes, and lymphocytes. Then doublet cells were excluded by SSC-H vs SSC-W and FSC-H vs FSC-W gating. The boundaries between “positive” and “negative” staining cell population were defined by using unstained and single color-stained controls that were prepared by staining the whole BM mononuclear cells from B6 mice at 8-12 weeks with antibodies against mouse CD11b. “Positive” staining cell population was defined as CD11b+ population and “negative” staining cell population was defined by unstained control. The boundary for each fluorescence was set between these “positive” and “negative” staining cell populations.
Tick this box to confirm that a figure exemplifying the gating strategy is provided in the Supplementary Information.
Nature Medicine: doi:10.1038/nm.4493


![Untitled-1 [uralbeznarkotikov.ru]uralbeznarkotikov.ru/cat/paper/1-2016.pdf · 800 3333 118 8800 3333 118 "talbeznarkotihov.ru 8800 3333 8800 3333 118 8800 3333 118 B 800 3333 118](https://img.dokumen.tips/doc/110x75/5fa8ba52bd5e685c68532c8a/untitled-1-800-3333-118-8800-3333-118-talbeznarkotihovru-8800-3333-8800.jpg)