Embed Size (px)
Citation preview

H1 2017 RESULTS PRESENTATION
August 24th 2017
#GrupaAzoty1H17@Grupa_Azoty
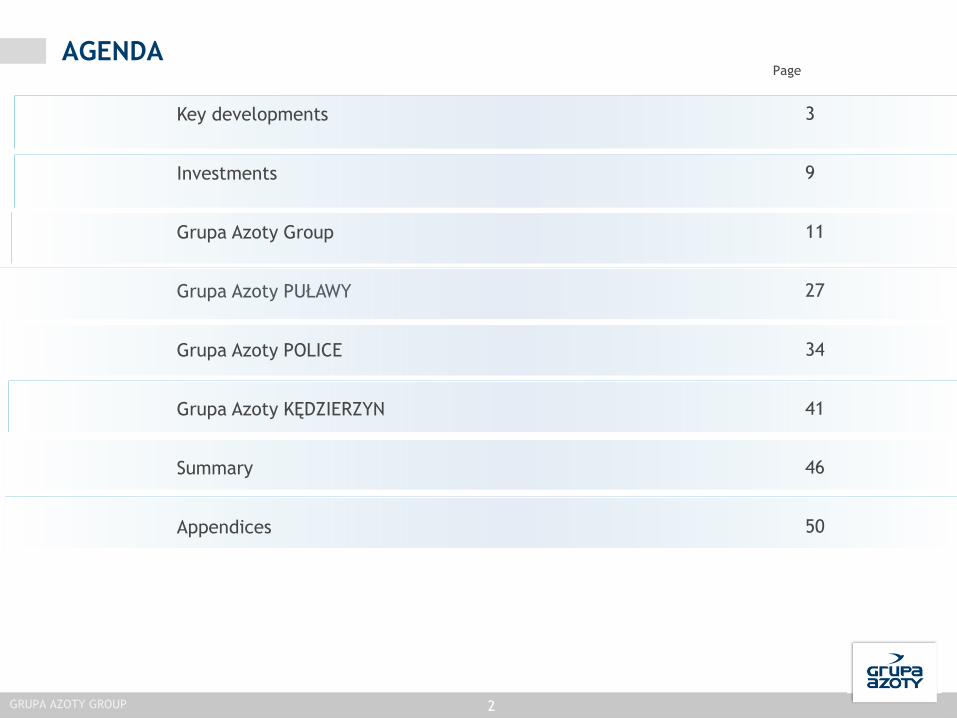
PageAGENDA
3
9
11
27
34
41
46
50
Key developments
Investments
Grupa Azoty Group
Grupa Azoty PUŁAWY
Grupa Azoty POLICE
Grupa Azoty KĘDZIERZYN
Summary
Appendices
2
GRUPA AZOTY GROUP 2

KEY DEVELOPMENTS IN H1 2017
RAISING FUNDS FOR
CAPITAL PROJECTS
FEEDSTOCK SUPPLY
SECURED – GAS
CONTRACT
PDH PROJECT WITH
PREDOMINANT
POLYPROPYLENE
OPTION
LETTER OF INTENT
FOR COAL
GASIFICATION
PROJECT
UPDATE OF 2013–
2020 STRATEGY
GRUPA AZOTY IN
FTSE4GOOD
EMERGING
GRUPA AZOTY GROUP
imag
e
AWARDS: LEADER
OF POLISH EXPORT
AND TRANSPARENT
COMPANY OF THE YEAR
2016
INVESTMENTS IN
INNOVATION
R&D
3

H1 2017 PERFORMANCE DRIVERS
STRONG DEMAND FOR
PLASTICS SUPPORTS HIGH
POLYAMIDE–BENZENE DELTAS
CONTINUED STRENGTH IN
MANUFACTURING AND
CONSTRUCTION CONTRIBUTES
TO SIGNIFICANT
IMPROVEMENT IN PIGMENTS
PERFORMANCE
STRATEGY TO GROW NPK
SALES VOLUMES TO OFFSET
FALLING PRICES AND RETAIN
MARKET SHARE
RISING PROPYLENE PRICES
SQUEEZE MARGINS ON OXO
ALCOHOLS
GROWING COMPETITION IN
NITRATE FERTILIZERS
(AN/CAN) DRIVES DOWN
SALES VOLUMES
HIGHER GAS PRICES AFFECT
PERFORMANCE IN
FERTILIZERS AND CHEMICALS
4
GRUPA AZOTY GROUP

GRUPA AZOTY GROUP H1 2017 FINANCIAL HIGHLIGHTS
(PLNm)
Financial results improve year
on year
Strong GDP growth across EU
supports record earnings in
Plastics
Wide margins on pigments in
the Chemicals segment driven
by uptrends in manufacturing
and construction
EBITDA triples in Tarnów
GRUPA AZOTY GROUP
REVENUE
4,870
EBITDA
714
EBITDA MARGIN
14.7%
NET PROFIT
378
COMMENTARY
5

GROUP COMPANIES' PERFORMANCE IN H1 2017
880
1,350
1,791
856
Grupa Azoty Kędzierzyn
Grupa Azoty PoliceGroup
Grupa Azoty PuławyGroup
Grupa Azoty S.A.(stand-alone data)
101
177
282
145
(PLNm)
REVENUE EBITDA
6

CONSOLIDATED REVENUE BY SEGMENT
3,055
1,210
676
2,742
1,128
571
2,673
1,264
743
Agro Fertilizers Chemicals Plastics
(PLNm)
1H2015 1H2016 1H2017 1H2015 1H2016 1H20171H2015 1H2016 1H2017
7

DIVIDENDS PAID BY THE PARENT
GRUPA AZOTY GROUP
78.4
83.3
19.9
148.8
39.9
Dividend for 2016
Dividend for 2015
Dividend for 2013
Dividend for 2012
Dividend for 2009
Dividend amount Profit earned
(PLNm)
GRUPA AZOTY HAS PAID OVER PLN 370M TO SHAREHOLDERS SINCE IPO
8

INVESTMENTS

INVESTMENTS
10GRUPA AZOTY GROUP
Tarnów
26%Puławy
26%
Police
24%
Kędzierzyn
20%
Other
4%
BY COMPANY
Expansion
49%
Maintenance
30%
Mandatory
8%
Purchase of finished
goods
3%
Other
10%
BY TYPE
COMPLETED INVESTMENT PROJECTS: PLN 501m
2017 CAPEX – PLN 1.3bn

GRUPA AZOTY
GROUP

GRUPA AZOTY GROUP FINANCIAL HIGHLIGHTS
12GRUPA AZOTY GROUP
2,159 2,0002,323
2,687
2,183
2Q2016 3Q2016 4Q2016 1Q2017 2Q2017
REVENUE
(PLNm)
* The 2016 figures adjusted for impairment losses associated with subsidiary AIG and impairment losses on the fat processing unit; the 2017 figures
adjusted for impairment losses on the fat processing unit.
177131
180
453
261201
150 191276
8.2% 6.6% 7.7%
16.9%
12.0%
2Q 2016 3Q 2016 4Q 2016 1Q2017 2Q2017
EBITDA
EBITDA(adjusted)*
EBITDA MARGIN
47
-10
29
255
12366 5
38 135
2.2%
-0.5%
1.2%
9.5%
5.6%
2Q 2016 3Q 2016 4Q 2016 1Q2017 2Q2017
NET PROFIT
NET PROFIT(adjusted)*
NET PROFITMARGIN
4 634
4 870
1H2016 1H2017
694
714718 729
1H2016 1H2017
354
378373
390
1H2016 1H2017

GRUPA AZOTY GROUP H1 2017 EBITDA BY SEGMENT
13GRUPA AZOTY GROUP
694 714
146 16 14
17 111
positive effect on EBITDA
negative effect on EBITDA
(PLNm)
Marked improvement in Plastics performance, driven by record-high PA6/caprolactam-benzene
deltas
A deterioration in earnings reported by Fertilizers and Chemicals (technical-grade urea/melamine),
mainly as a result of higher gas prices and increased imports of nitrate fertilizers affecting prices

REVENUE BY SEGMENT
Agro Fertilizers
Other
Chemicals
Plastics
Energy
H/H CHANGE IN REVENUE
-3%
+12%
+30%
-1%
-3%
14GRUPA AZOTY GROUP
Agro Fertilizers
55%
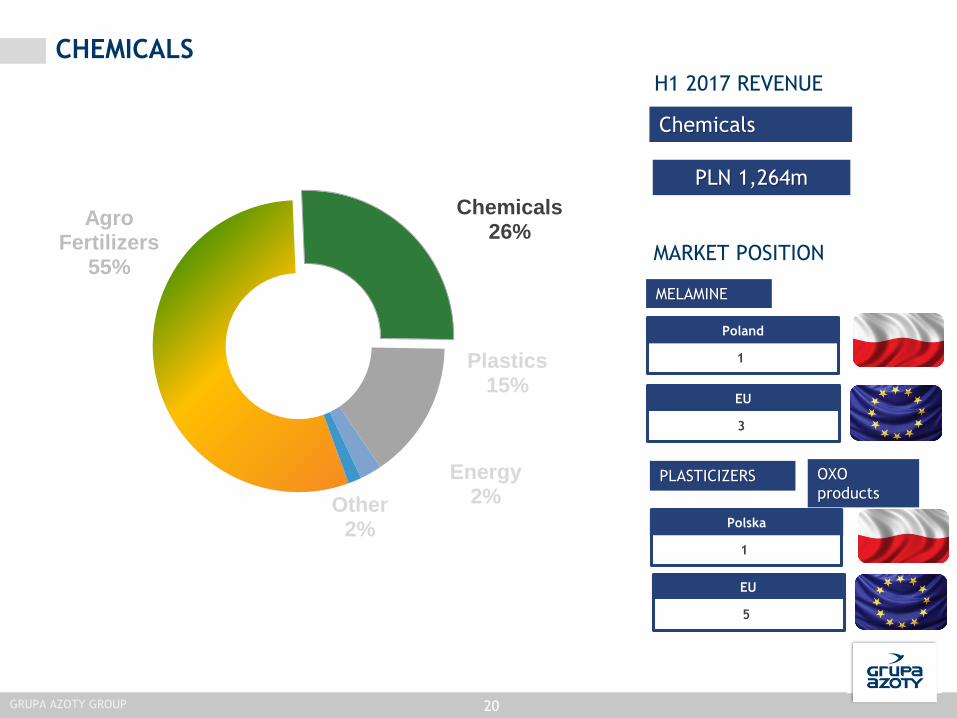
Chemicals 26%
Plastics15%
Energy2%Other
2%

EU
AGRO FERTILIZERS
15
H1 2017 REVENUE
Poland
1
Agro Fertilizers
PLN 2,673mAgro
Fertilizers 55%
Chemicals26%
Plastics 15%
Energy2%Other
2%
2
MARKET POSITION
GRUPA AZOTY GROUP
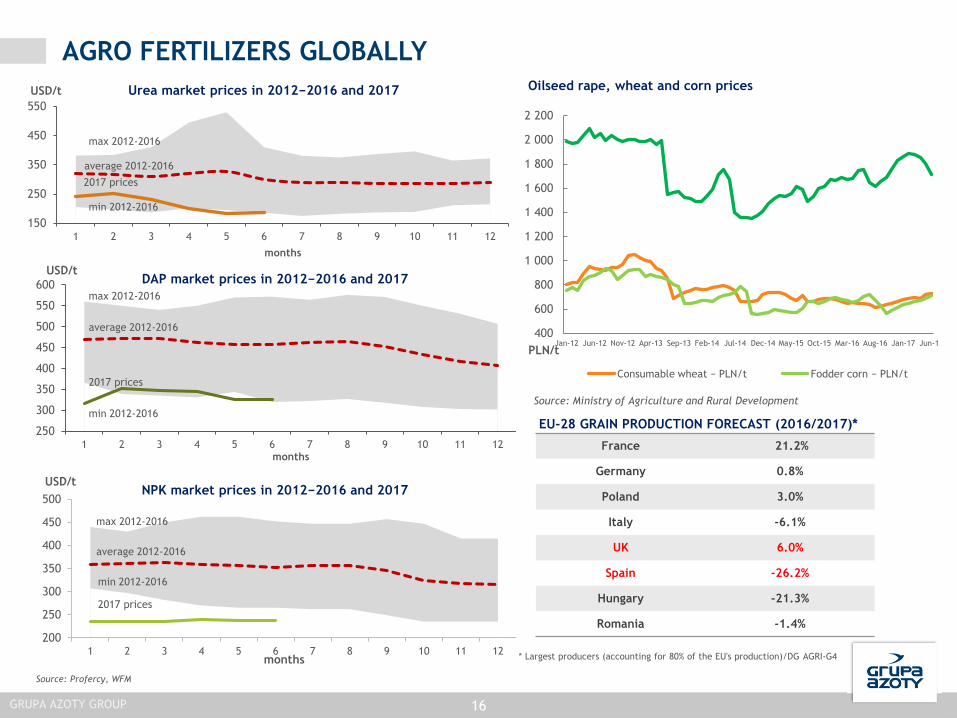
AGRO FERTILIZERS GLOBALLY
16
EU-28 GRAIN PRODUCTION FORECAST (2016/2017)*
Oilseed rape, wheat and corn prices
400
600
800
1 000
1 200
1 400
1 600
1 800
2 000
2 200
Jan-12 Jun-12 Nov-12 Apr-13 Sep-13 Feb-14 Jul-14 Dec-14 May-15 Oct-15 Mar-16 Aug-16 Jan-17 Jun-17PLN/t
Consumable wheat − PLN/t Fodder corn − PLN/t
Source: Ministry of Agriculture and Rural Development
Source: Profercy, WFM
150
250
350
450
550
1 2 3 4 5 6 7 8 9 10 11 12
USD/t
months
Urea market prices in 2012−2016 and 2017
max 2012-2016
average 2012-2016
min 2012-2016
2017 prices
250
300
350
400
450
500
550
600
1 2 3 4 5 6 7 8 9 10 11 12months
USD/tDAP market prices in 2012−2016 and 2017
average 2012-2016
min 2012-2016
2017 prices
max 2012-2016
200
250
300
350
400
450
500
1 2 3 4 5 6 7 8 9 10 11 12
USD/t
months
NPK market prices in 2012−2016 and 2017
average 2012-2016
min 2012-2016
2017 prices
max 2012-2016
* Largest producers (accounting for 80% of the EU's production)/DG AGRI-G4
France 21.2%
Germany 0.8%
Poland 3.0%
Italy -6.1%
UK 6.0%
Spain -26.2%
Hungary -21.3%
Romania -1.4%
GRUPA AZOTY GROUP

AGRO FERTILIZERS GLOBALLY
17
MARKET SPREADS PER N
PRICING TRENDS
0
100
200
300
400
500
600
Jan-1
4
Feb-1
4
Mar-
14
Apr-
14
May-1
4
Jun-1
4
Jul-
14
Aug-1
4
Sep-1
4
Oct-
14
Nov-1
4
Dec-1
4
Jan-1
5
Feb-1
5
Mar-
15
Apr-
15
May-1
5
Jun-1
5
Jul-
15
Aug-1
5
Sep-1
5
Oct-
15
Nov-1
5
Dec-1
5
Jan-1
6
Feb-1
6
Mar-
16
Apr-
16
May-1
6
Jun-1
6
Jul-
16
Aug-1
6
Sep-1
6
Oct-
16
Nov-1
6
Dec-1
6
Jan-1
7
Feb-1
7
Mar-
17
Apr-
17
May-1
7
Jun-1
7
DAP NPK 3x16 Phosphate rock
0
50
100
150
200
250
300
Jan-1
4
Feb-1
4
Mar-
14
Apr-
14
May-1
4
Jun-1
4
Jul-
14
Aug-1
4
Sep-1
4
Oct-
14
Nov-1
4
Dec-1
4
Jan-1
5
Feb-1
5
Mar-
15
Apr-
15
May-1
5
Jun-1
5
Jul-
15
Aug-1
5
Sep-1
5
Oct-
15
Nov-1
5
Dec-1
5
Jan-1
6
Feb-1
6
Mar-
16
Apr-
16
May-1
6
Jun-1
6
Jul-
16
Aug-1
6
Sep-1
6
Oct-
16
Nov-1
6
Dec-1
6
Jan-1
7
Feb-1
7
Mar-
17
Apr-
17
May-1
7
Jun-1
7
CAN (27%N) Urea (27%N) Ammonia (27%N)
CAN equivalent
NPK equivalent
EUR/t
USD/t
OUTLOOK
Weather conditions in the spring
with a minor impact on grain
yields in Poland
Global oversupply of grains
Low oil prices likely to drive
oilseed prices
Economic upturn and growth in
demand for food products
expected in Poland
Direct subsidies support demand
for fertilizers
Low ammonia prices;
potassium chloride prices
expected to remain strong
Oversupply of DAP fertilizers
and urea − production cuts likely
to help stabilize prices
GRUPA AZOTY GROUP

NITROGEN FERTILIZER IMPORTS 2016–2017
18
COMPARISON OF AMMONIUM NITRATE IMPORT VOLUMES
Jan Feb Mar Apr May Jun Jul Aug Sep Oct Nov Dec
Source: Analytical Centre, the Tax Administration Chamber in Warsaw
MONTHLY
Jan Feb Mar Apr May Jun Jul Aug Sep Oct Nov Dec
2016 2017CUMULATIVELY
131%
COMPARISON OF UREA IMPORT VOLUMES
Jan Feb Mar Apr May Jun Jul Aug Sep Oct Nov Dec Jan Feb Mar Apr May Jun Jul Aug Sep Oct Nov Dec
2016 2017MONTHLY CUMULATIVELY
-21%
GRUPA AZOTY GROUP

GRUPA AZOTY GROUP: AGRO FERTILIZERS
VOLUMES
19
'000 tonnes
(PLNm) 1H2016 1H20172Q
2016
2Q
2017
Change
Q/Q
Segment revenue
including:2,742 2,673 1,166 1,150 -1%
Nitrogen fertilizers,
and ammonia1,645 1,614 653 684 5%
Compound fertilizers 877 836 410 404 -1%
EBITDA 496 385 117 124 6%
EBITDA margin 18% 14% 10% 11% +1pp
0
300
600
900
1H2016 1H2017
0
100
200
300
400
2Q2016 2Q2017
GRUPA AZOTY GROUP
CHEMICALS
Other
Plastics
Chemicals
Energy
+XX%
+XX%
+XX%
+XX%
MARKET POSITION
EU
5
Polska
1
Chemicals
PLN 1,264m
PLASTICIZERS
MELAMINE
EU
3
Poland
1
OXO
products
H1 2017 REVENUE
20GRUPA AZOTY GROUP
Agro Fertilizers
55%
Chemicals26%
Plastics15%
Energy2%Other
2%

CHEMICALS GLOBALLY
MARKET SPREADS
PRICING TRENDS
0
200
400
600
800
1 000
1 200
1 400
1 600
1 800
DEHT (DOTP) 2-EH Propylene
EUR/t
OUTLOOK
Expected double-digit rise in
melamine prices
Projected rise in titanium white
prices
Increase in titanium white
feedstock prices
Movements in feedstock prices,
chiefly propylene, likely to trigger
strong reactions
Growing demand and higher prices
expected in the plasticizers market
during maintenance shutdowns
21GRUPA AZOTY GROUP

GRUPA AZOTY GROUP: CHEMICALS
VOLUMES
22
(PLNm) 1H2016 1H20172Q
2016
2Q
2017
Change
Q/Q
Segment revenue
including:1 128 1 264 593 617 4%
OXO alcohols 209 251 113 115 2%
Plasticizers 96 115 49 54 10%
Urea (technical grade) 208 248 98 122 24%
Melamine 216 227 116 108 -7%
Titanium white 150 178 82 93 13%
EBITDA 165 151 78 52 -33%
EBITDA margin 15% 12% 13% 8% -5pp
'000 tonnes
0
100
200
300
OXO alcohols Plasticizers Urea (technicalgrade)
Melamine Titanium white
1H2016 1H2017
0
50
100
150
OXO alcohols Plasticizers Urea (technicalgrade)
Melamine Titanium white
2Q2016 2Q2017
GRUPA AZOTY GROUP

PLASTICS
Other
Plastics
Chemicals
Energy
+XX%
+XX%
+XX%
+XX%
MARKET POSITION – PA6
EU *
5
Poland
1
Plastics
PLN 743m
* Integrated basis
H1 2017 REVENUE
23GRUPA AZOTY GROUP
PA6
Agro Fertilizers
55%
Chemicals26%
Plastics15%
Energy2%Other
2%

GLOBAL PLASTICS MARKET
24
WIDER MARKET SPREADS
PRICING TRENDS
0
500
1 000
1 500
2 000
2 500
Jan-1
4
Feb-1
4
Mar-
14
Apr-
14
May-1
4
Jun-1
4
Jul-
14
Aug-1
4
Sep-1
4
Oct-
14
Nov-1
4
Dec-1
4
Jan-1
5
Feb-1
5
Mar-
15
Apr-
15
May-1
5
Jun-1
5
Jul-
15
Aug-1
5
Sep-1
5
Oct-
15
Nov-1
5
Dec-1
5
Jan-1
6
Feb-1
6
Mar-
16
Apr-
16
May-1
6
Jun-1
6
Jul-
16
Aug-1
6
Sep-1
6
Oct-
16
Nov-1
6
Dec-1
6
Jan-1
7
Feb-1
7
Mar-
17
Apr-
17
May-1
7
Jun-1
7
EUR/t
Polyamide 6 Benzene
OUTLOOK
Strong impact of supply-demand
dynamics and oil prices
PA6 prices trending upwards in H1
2017
CPL and PA6 shortages due to
unscheduled plant shutdowns and
market conditions in Asia
Reduced PA6 oversupply; upswing
in the automotive and textile sectors
Year-on-year improvement in PA6
and CPL price spread
Changes expected in PA6 demand
structure, with the engineering
plastics, film and flexible packaging
sector gaining prominence
GRUPA AZOTY GROUP
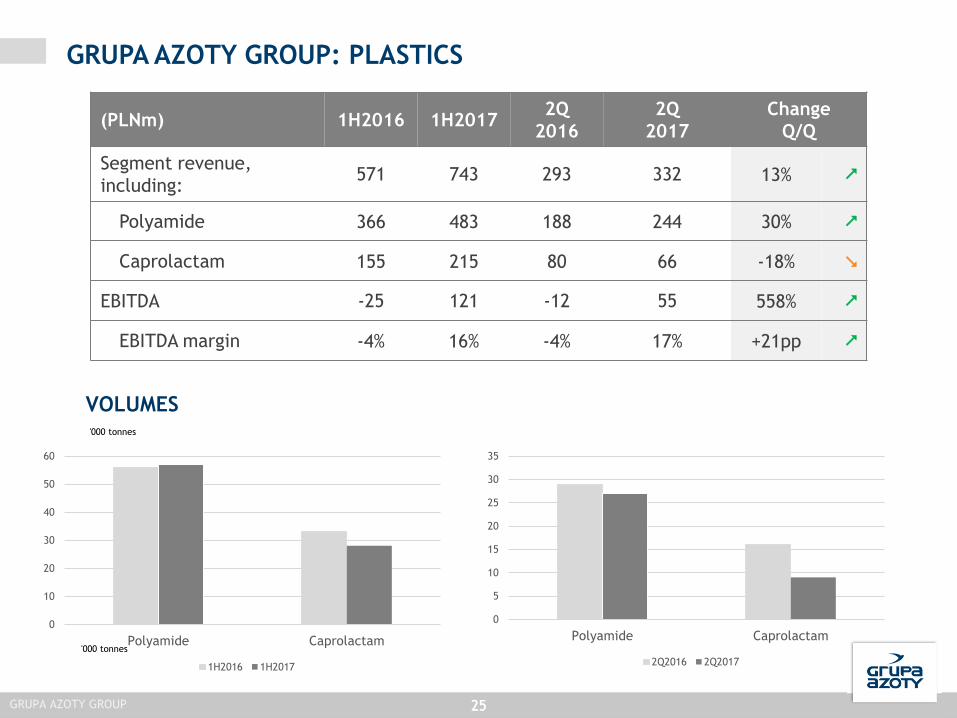
GRUPA AZOTY GROUP: PLASTICS
VOLUMES
25
(PLNm) 1H2016 1H20172Q
2016
2Q
2017
Change
Q/Q
Segment revenue,
including:571 743 293 332 13%
Polyamide 366 483 188 244 30%
Caprolactam 155 215 80 66 -18%
EBITDA -25 121 -12 55 558%
EBITDA margin -4% 16% -4% 17% +21pp
'000 tonnes
25
'000 tonnes
0
10
20
30
40
50
60
Polyamide Caprolactam
1H2016 1H2017
0
5
10
15
20
25
30
35
Polyamide Caprolactam
2Q2016 2Q2017
GRUPA AZOTY GROUP

GRUPA AZOTY GROUP FINANCING SOURCES AT JUNE 30TH 2017
26GRUPA AZOTY GROUP
RATIOS 1H2016 1H2017
Net debt (PLNm) 134 631
12-month net debt/EBITDA (ratio) 0.11 0.62
81%
10%
9%
FINANCING STRUCTURE
923
489 3
AVAILABLE FUNDS
Corporate credit facilities
Overdraft and multi-purposefacilities
(PLNm)

GRUPA AZOTY PUŁAWY GROUP

GRUPA AZOTY PUŁAWY GROUP FINANCIAL HIGHLIGHTS
28GRUPA AZOTY PUŁAWY
808 710 875 1,003788
2Q2016 3Q2016 4Q2016 1Q2017 2Q2017
REVENUE*
(PLNm)
11765 81
204
78119
65 93
212
93
14.4%
9.2% 9.2%
20.3%
9.9%
2Q 2016 3Q 2016 4Q 2016 1Q2017 2Q2017
EBITDA*
EBITDA(adjusted)**
EBITDA MARGIN
66 1627
138
2669 16
39
146
41
8.2%
2.2%3.1%
13.8%
3.3%
2Q 2016 3Q 2016 4Q 2016 1Q2017 2Q2017
NET PROFIT
NET PROFIT(adjusted)**
NET PROFITMARGIN
1 759
1 791
1H2016 1H2017
343282
346305
1H2016 1H2017
227
164
230187
1H2016 1H2017
* Restated initially to ensure data comparability following changes to the accounting policy as of January 1st 2017
** Adjusted for impairment losses on assets, including mainly the fat processing unit at ZA Chorzów and Elektrownia Puławy's assets
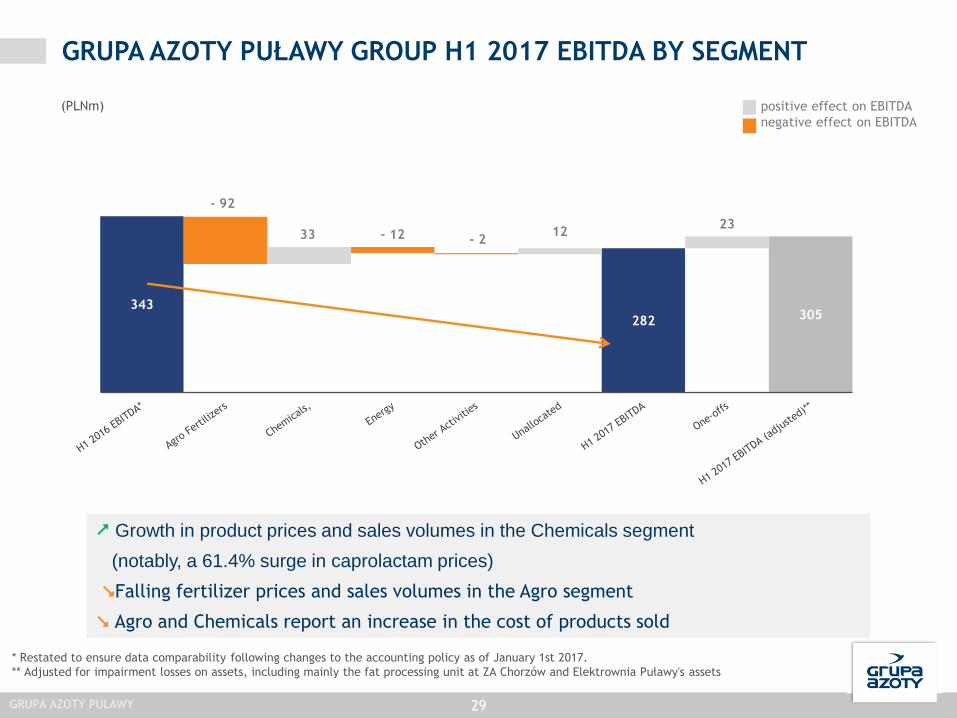
GRUPA AZOTY PUŁAWY GROUP H1 2017 EBITDA BY SEGMENT
29
343
282 305
- 92
33 - 12 - 212
23
positive effect on EBITDA
negative effect on EBITDA
(PLNm)
GRUPA AZOTY PUŁAWY
Growth in product prices and sales volumes in the Chemicals segment
(notably, a 61.4% surge in caprolactam prices)
Falling fertilizer prices and sales volumes in the Agro segment
Agro and Chemicals report an increase in the cost of products sold
* Restated to ensure data comparability following changes to the accounting policy as of January 1st 2017.
** Adjusted for impairment losses on assets, including mainly the fat processing unit at ZA Chorzów and Elektrownia Puławy's assets

GRUPA AZOTY PUŁAWY GROUP BY SEGMENT
Fertilizers
Other
Chemicals
Energy
H/H CHANGE IN REVENUE
-7%
+22%
- 11%
-9%
GRUPA AZOTY PUŁAWY 30
Fertilizers59%
Chemicals 37%
Energy2%
Other2%
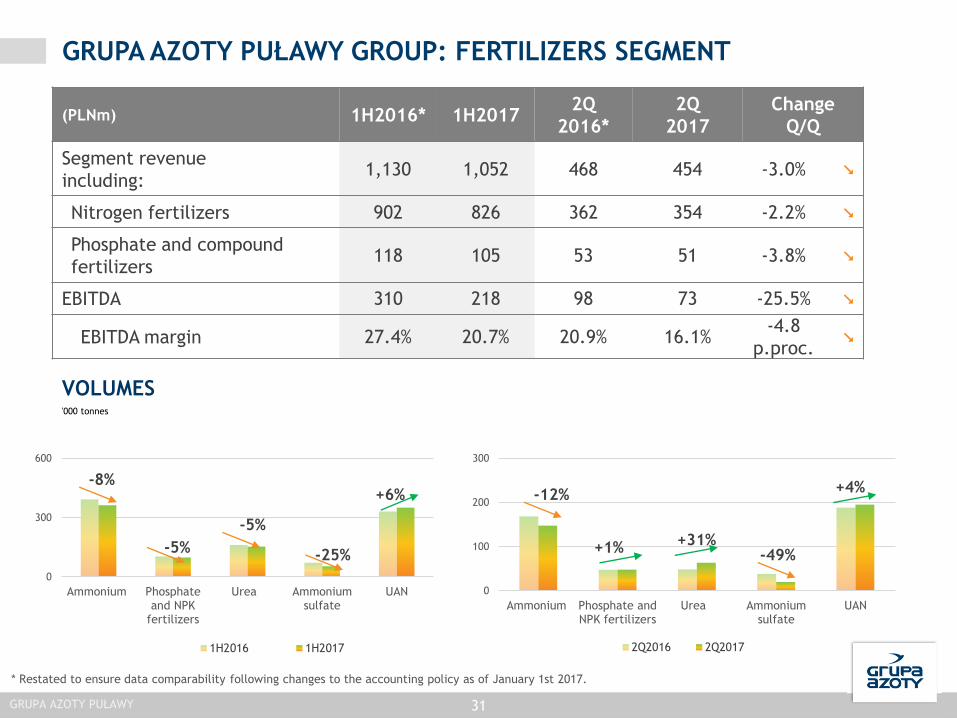
GRUPA AZOTY PUŁAWY GROUP: FERTILIZERS SEGMENT
VOLUMES
31
(PLNm) 1H2016* 1H20172Q
2016*
2Q
2017
Change
Q/Q
Segment revenue
including:1,130 1,052 468 454 -3.0%
Nitrogen fertilizers 902 826 362 354 -2.2%
Phosphate and compound
fertilizers118 105 53 51 -3.8%
EBITDA 310 218 98 73 -25.5%
EBITDA margin 27.4% 20.7% 20.9% 16.1%-4.8
p.proc.
'000 tonnes
GRUPA AZOTY PUŁAWY
0
300
600
Ammonium Phosphateand NPK
fertilizers
Urea Ammoniumsulfate
UAN
1H2016 1H2017
0
100
200
300
Ammonium Phosphate andNPK fertilizers
Urea Ammoniumsulfate
UAN
2Q2016 2Q2017
+6%-8%
-5%
-5%
-25%
+4%
-49%
-12%
+1%+31%
* Restated to ensure data comparability following changes to the accounting policy as of January 1st 2017.

GRUPA AZOTY PUŁAWY GROUP: CHEMICALS
VOLUMES
32
(PLNm) 1H2016* 1H20172Q
2016*
2Q
2017
Change
Q/Q
Segment revenue
including:543 661 291 296 1.7%
Melamine 216 227 116 108 -6.9%
Caprolactam 162 228 92 87 -5.4%
Urea 102 136 52 67 28.8%
EBITDA 98 131 56 40 -28.6%
EBITDA margin 18.0% 19.8% 19.2% 13.5%-5.7
p.proc.
'000 tonnes
GRUPA AZOTY PUŁAWY
-50
50
150
250
Melamine Caprolactam Urea
1H2016 1H2017
0
20
40
60
80
Melamine Caprolactam Urea
2Q2016 2Q2017
+30%
-35%
+28%
-13%-10%+2%
* Restated to ensure data comparability following changes to the accounting policy as of January 1st 2017.

GRUPA AZOTY PUŁAWY FINANCING SOURCES AT JUNE 30TH 2017
33
RATIOS 1H2016 1H2017
Net debt (PLNm) -682.9 -514.8
6-month net debt/EBITDA (ratio) -2.0 -1.8
500
97
AVAILABLE FUNDS
Corporate credit facilities
Overdraft and multi-purposefacilities
GRUPA AZOTY PUŁAWY
(PLNm)

GRUPA AZOTY POLICE GROUP

GRUPA AZOTY POLICE GROUP FINANCIAL HIGHLIGHTS
35
1,4541,249 1,440 1,292 1,350
1H 2013 1H 2014 1H 2015 1H 2016 1H 2017
REVENUE
(PLNm)
114 105
178136
177170
7.8%
8.4%
12.4%10.5%
13.1%
1H 2013 1H 2014 1H 2015 1H 2016 1H 2017
EBITDA
EBITDA (adjusted)*
EBITDA MARGIN
56 48107
77 100102
3.9%3.8%
7.4% 6.0% 7.4%
1H 2013 1H 2014 1H 2015 1H 2016 1H 2017
NET PROFIT
NET PROFIT (adjusted)*
NET PROFIT MARGIN
GRUPA AZOTY POLICE GROUP
* Net of one-off items relating to AFRIG
The H1 2013, H1 2014 and H1 2015 results are reported data; they do not include impairments recognised through profit or loss brought forward.

136
177
34 17
34 10
170
EBITDA net of
one-off items
GRUPA AZOTY POLICE GROUP H1 2017 EBITDA BY SEGMENT
36
(PLNm)
GRUPA AZOTY POLICE GROUP
positive effect on EBITDA
negative effect on EBITDAone-off items concerning
AFRIG
- effect on EBITDA

GRUPA AZOTY POLICE GROUP BY SEGMENT
Fertilizers
Other
Pigments
H/H CHANGE IN REVENUE
+3%
+19%
-3%
GRUPA AZOTY POLICE GROUP 37
Fertilizers84%
Pigments14%
Other2%

GRUPA AZOTY POLICE GROUP: FERTILIZERS
VOLUMES
38GRUPA AZOTY POLICE GROUP
+14%
+4%
0
300
600
900
1H2016 1H2017 1H2016 1H2017 1H2016 1H2017
Poland Exports
Urea Ammonia
+40%
+53%
+1%
+14%
Compound
fertilizers,
0
300
600
2Q2016 2Q2017 2Q2016 2Q2017 2Q2016 2Q2017
Poland Exports
Urea AmmoniaCompound
fertilizers
'000 tonnes
(PLNm) 1H2016 1H20172Q
2016
2Q
2017Change
Q/Q
Segment revenue, including: 1,112 1,141 507 543 7%
Compound fertilizers, 792 745 366 351 -4%
Urea 173 192 72 85 18%
Ammonia 106 158 47 82 74%
EBITDA 122 139 20 75 275%
EBITDA margin 11% 12% 4% 14% +10pp.

GRUPA AZOTY POLICE GROUP: PIGMENTS
VOLUMES
39
(PLNm) 1H2016 1H20172Q
2016
2Q
2017Q/Q change
Segment revenue, including: 157 186 85 97 14%
Titanium white 150 178 82 93 13%
Other 7 8 3 4 33%
EBITDA 10 44 8 24 200%
EBITDA margin 6% 24% 9% 25% +16pp.
+2%
'000 tonnes
GRUPA AZOTY POLICE GROUP
15
20
25
1H2013 1H2014 1H2015 1H2016 1H2017
Titanium white

GRUPA AZOTY POLICE GROUP FINANCING SOURCES AT JUNE 30TH 2017
40
RATIOS 1H2016 1H2017
Net debt (PLNm) 275 319
6-month net debt/EBITDA (ratio) 2.03 1.80
14%
52%
34%
FINANCING STRUCTURE
438
209
AVAILABLE FUNDS
Corporate creditfacilities
Overdraft and multi-purpose facilities
(PLNm)
GRUPA AZOTY POLICE GROUP

GRUPA AZOTY ZAKŁADY AZOTOWE KĘDZIERZYN S.A.

GRUPA AZOTY KĘDZIERZYN: FINANCIAL HIGHLIGHTS
42
411 379 465 485 395
2Q2016 3Q2016 4Q2016 1Q2017 2Q2017
REVENUE
(PLNm)
50
1830
81
20
12.2%
4.8%6.6%
16.6%
5.1%
2Q2016 3Q2016 4Q2016 1Q2017 2Q2017
EBITDA
EBITDA MARGIN
28-3
8
48
-3
6.8%
-0.7%
1.6%
9.8%
-0.8%
-3,0%
-1,0%
1,0%
3,0%
5,0%
7,0%
9,0%
11,0%
2Q2016 3Q2016 4Q2016 1Q2017 2Q2017
NET PROFIT
NET PROFITMARGIN
852880
1H2016 1H2017
154
101
1H2016 1H2017
94
44
1H2016 1H2017
GRUPA AZOTY KĘDZIERZYN

GRUPA AZOTY KĘDZIERZYN BY SEGMENT
Fertilizers
Other
OXO alcohols
Fertilizers48%
OXO alcohols
46%
Other6%
H/H CHANGE IN REVENUE
-8.8%
+18.9%
+9.1%
43GRUPA AZOTY KĘDZIERZYN
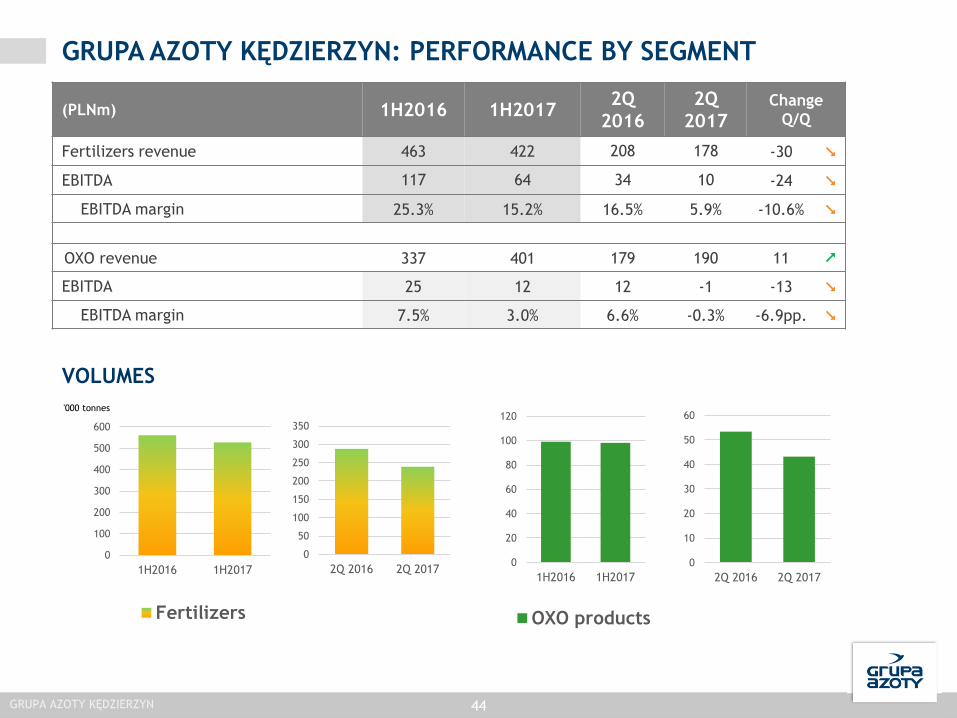
GRUPA AZOTY KĘDZIERZYN: PERFORMANCE BY SEGMENT
0
20
40
60
80
100
120
1H2016 1H2017
OXO products
0
10
20
30
40
50
60
2Q 2016 2Q 2017
44
(PLNm) 1H2016 1H20172Q
2016
2Q
2017Change
Q/Q
Fertilizers revenue 463 422 208 178 -30
EBITDA 117 64 34 10 -24
EBITDA margin 25.3% 15.2% 16.5% 5.9% -10.6%
OXO revenue 337 401 179 190 11
EBITDA 25 12 12 -1 -13
EBITDA margin 7.5% 3.0% 6.6% -0.3% -6.9pp.
'000 tonnes
GRUPA AZOTY KĘDZIERZYN
0
100
200
300
400
500
600
1H2016 1H2017
Fertilizers
VOLUMES
0
50
100
150
200
250
300
350
2Q 2016 2Q 2017

GRUPA AZOTY KĘDZIERZYN FINANCING SOURCES AT JUNE 30TH 2017
45
RATIOS 1H2016 1H2017
Net debt (PLNm) 140 219
12-month net debt/EBITDA (ratio) 0.57 1.60
90%
9% 1%
FINANCING STRUCTURE
210 62
AVAILABLE FUNDS
Corporate creditfacilities
Overdraft and multi-purpose facilities
* footnotes
(PLNm)
GRUPA AZOTY KĘDZIERZYN

SUMMARY
GRUPA AZOTY'S PRIORITIES

GRUPA AZOTY'S PRIORITIES
NEAR TERM
OPERATIONAL
PHASE
INNOVATION
Successful completion of the
Polyamides project
Securing funding for the project
Grupa Azoty Research and Development
Centre
Biotechnology
Innovations − services for precision
agriculture, plasticizers, catalysts, plastics.
SUMMARY
Corporate decisions:
- on the PDH project including PP production
plant
- on the coal gasification project once the
PREFEED stage is completed. Working with
Tauron on the project implementation
47

DISCLAIMER
48
The information presented below has been prepared by the Grupa Azoty Group (the “Group”) solely for the purpose of presentation to investors and market analysts on
August 24th 2017 (the “Presentation”). By participating in the meeting at which the Presentation is presented or by referring to this Presentation, you agree to the following
specific restrictions and disclaimers.
This Presentation does not constitute or form any part of, and should not be considered as, an offer to sell or as an invitation to subscribe for, or as a guarantee to purchase
or acquire in other way, any securities of any company of the Group. Neither this Presentation nor any part hereof may form the basis of, or be relied upon in connection
with, any subscription for any securities of the Group, or their acquisition. Neither this Presentation nor any part hereof may form the basis of, or be relied upon in
connection with, any investment agreement, commitment or decision relating to securities of the Group companies. This Presentation does not constitute a recommendation
regarding any securities of the Group companies.
No statement or assurance, expressed or implied, has been made by or on behalf of the Group or any of its shareholders, members of its bodies, officers, employees, agents
or advisers or any other person, as to the accuracy, completeness or reliability of information or opinions contained in this Presentation.
This Presentation may contain forward-looking statements. Forward-looking statements are different from statements of historical facts. Statements containing such words as
"expects", "intends", "plans", "believes", "anticipates", "will", "aims", "can", "would", "could", "continues" or similar words are examples of such forward-looking statements.
Forward-looking statements include statements about the financial performance, business strategy, plans and objectives of the Group (including development plans relating
to the Group). All forward-looking statements contained in this Presentation relate to matters involving known and unknown risks, issues that are impossible to predict, and
other factors. Actual results and achievements of the Group may be materially different from those described in statements concerning the past, and from the results and
achievements of the Group in the past.
Forward-looking statements are made based on various assumptions of future events, including numerous assumptions regarding present and future business strategies of the
Group and its future business environment. Although the Group believes that its estimates and assumptions are reasonable, they may prove to be incorrect. The information,
opinions and forward-looking statements contained herein are valid only on the date of this Presentation and are subject to change without notice. The Group and its
advisers are not obliged to publish any updates or modify any information, data or statements contained in this Presentation in the event of a change of strategy or the
intentions of the Group, or of facts or circumstances that will have an impact on the strategy or intentions of the Group, unless such an obligation arises under law. Please
note that the only reliable source of data on the Group's financial results, forecasts, events and indicators of the Group are the current and periodic reports released by the
Group as part of its disclosure obligations under Polish law.
Neither the Group nor any of its shareholders, members of its bodies, officers, employees, agents or advisers nor any other person shall be liable for any loss arising from the
use of this Presentation or its contents or otherwise arising in connection with this Presentation.
Neither the Group nor any of its shareholders, members of its bodies, officers, employees, agents or advisers nor any other person shall be required to provide the recipients
of this Presentation with any additional information or to update this Presentation.
This Presentation contains information on the chemical industry in Poland and globally, including information on market shares of the Company and some of its competitors.
The source of this information is always provided in this Presentation and the Group or any other entity acting on behalf of the Group has independently verified the
information referred to above.
This Presentation is not intended for distribution to or use by any person or any entity in any jurisdiction where such distribution or use would be contrary to local law or
oblige the Group or any of its affiliates to obtain an authorization or licence, or to comply with the registration requirements under applicable laws. Neither this Presentation
nor any part hereof may be copied or transmitted into the United States of America, and cannot be disseminated, directly or indirectly, in the United States of America.
Failure to comply with this restriction may constitute a violation of U.S. securities laws. Persons who come into possession of this Presentation are required to inform
themselves of, and to observe all of the above restrictions. None of the securities referred to herein
have been or will be registered under the U.S. Securities Act of 1933. Any such securities
may not be offered or sold in the United States of America, except pursuant to an exemption
or in a transaction not required to be registered under the Act.
Thank you for your attention.For more information, visit www.grupaazoty.com
APPENDIX 1 THE PARENT

GRUPA AZOTY S.A.: FINANCIAL HIGHLIGHTS
51
436 357 366 393 479377
1Q 2016 2Q2016 3Q2016 4Q2016 1Q2017 2Q2017
REVENUE
56
-7
5 11
8659
12.8%
-2.0% 1.4%
2.8%
18.0%15.6%
1Q 2016 2Q 2016 3Q 2016 4Q 2016 1Q2017 2Q2017
EBITDA
EBITDA(adjusted)*
EBITDAMARGIN
(PLNm)
22
236
-17 -16
45
283
-37
-19 51
5.0%
66.1%
-4.6%-4.1%
9.4%
75.1%
-50
50
150
250
1Q 2016 2Q 2016 3Q 2016 4Q 2016 1Q2017 2Q2017
NET PROFIT
NET PROFIT(adjusted)*
NET PROFITMARGIN
* NET PROFIT was adjusted for dividends received (in all periods).
** Restated following application of uniform accounting policies across the Grupa Azoty Group
GRUPA AZOTY S.A.
793
856
1H2016 1H2017
49
145
1H2016 1H2017
258328
-15
96
1H2016 1H2017

0
100
200
300
400
Nitrogen fertilizers
1H2016 1H2017
GRUPA AZOTY S.A.: FERTILIZERS
VOLUMES
GRUPA AZOTY S.A. 52
(PLNm) 1H2016 1H20172Q
2016
2Q
2017
Change
Q/Q
Segment revenue
including344 333 126 121 -4%
Nitrogen fertilizers, 310 296 110 102 -7%
EBITDA 40 43 -9 1 111%
EBITDA margin 12% 13% -7% 1% +8pp
0
50
100
150
Nitrogen fertilizers
2Q2016 2Q2017
'000 tonnes

0
5
10
15
20
25
30
Polyamide Caprolactam
2Q2016 2Q2017
0
10
20
30
40
50
60
Polyamide Caprolactam
1H2016 1H2017
GRUPA AZOTY S.A.: PLASTICS
VOLUMES
GRUPA AZOTY S.A. 53
(PLNm) 1H2016 1H20172Q
2016
2Q
2017
Change
Q/Q
Segment revenue
including423 488 217 233 7%
Polyamide 306 236 156 110 -29%
Caprolactam 22 151 12 73 508%
EBITDA -2 87 -3 50 1 767%
EBITDA margin -0.5% 18% -1% 21% +22pp.
'000 tonnes

Increase since June 30th 2008: 328%
High (Dec 8 2015) PLN 113.00
Low (Feb 3 2009) PLN 6.00
SHARE PERFORMANCE
GRUPA AZOTY S.A.
60
62
64
66
68
70
72
74
76
78
80
0
50
100
150
200
250
300
350
400
450
Jan-17 Jul-17Volume Price
54

APPENDIX 2
MARKET PRICES

PRICES OF AMMONIA, AMMONIUM SULFATE AND CALCIUM AMMONIUM NITRATE
100
150
200
250
300
50
150
250
350
450
550
Q1 2015 Q2 2015 Q3 2015 Q4 2015 Q1 2016 Q2 2016 Q3 2016 Q4 2016 Q1 2017 Q2 2017EUR/tUSD/t
Ammonia USD/t Ammonium sulfate AS USD/t Calcium ammonium nitrate CAN EUR/t
56

NATURAL GAS PRICES
10
15
20
25
30
Q1 2015 Q2 2015 Q3 2015 Q4 2015 Q1 2016 Q2 2016 Q3 2016 Q4 2016 Q1 2017 Q2 2017
EUR/MWh
PGNiG tariff TTF DA net of transmission costs EEX GPL DA net of transmission costs
57

PRICES OF BENZENE, PHENOL, CPL, PA6
250
750
1 250
1 750
2 250
Q1 2015 Q2 2015 Q3 2015 Q4 2015 Q1 2016 Q2 2016 Q3 2016 Q4 2016 Q1 2017 Q2 2017
EUR/t
Benzene Liquid caprolactam PA6 Phenol
58

150
200
250
300
100
200
300
400
Q1 2015 Q2 2015 Q3 2015 Q4 2015 Q1 2016 Q2 2016 Q3 2016 Q4 2016 Q1 2017 Q2 2017USD/t
EUR/t
Ammonium nitrate EUR/t UAN EUR/t Urea USD/t
PRICES OF AN, UAN AND UREA
59

MELAMINE AND CAPROLACTAM PRICES
1000
1400
1800
2200
1300
1400
1500
Q1 2015 Q2 2015 Q3 2015 Q4 2015 Q1 2016 Q2 2016 Q3 2016 Q4 2016 Q1 2017 Q2 2017USD/tEUR/t
Melamine EUR/t Crystalline caprolactam USD/t
60

PRICES OF NPK, DAP, PHOSPHATE ROCK, POTASSIUM CHLORIDE
50
150
250
350
450
550
Q1 2015 Q2 2015 Q3 2015 Q4 2015 Q1 2016 Q2 2016 Q3 2016 Q4 2016 Q1 2017 Q2 2017
USD/t
NPK DAP Phosphate rock Potassium chloride
61

PRICES OF TITANIUM WHITE, ILMENITE AND TITANIUM SLAG
0
100
200
300
400
500
600
700
800
1900
2000
2100
2200
2300
2400
Q1 2015 Q2 2015 Q3 2015 Q4 2015 Q1 2016 Q2 2016 Q3 2016 Q4 2016 Q1 2017 Q2 2017
USD/tEUR/t
Titanium white EUR/t Ilmenite USD/t Titanium slag USD/t
62