Embed Size (px)
Citation preview

H. Maesaka*, H. Ego, T. Hara, A. Higashiya, S. Inoue, S. Matsubara, T. Ohshima, K. Tamasaku, H. Tanaka, T. Tanikawa, T. Togashi, K. Togawa, H. Tomizawa,
M. Yabashi, K. Yanagida, T. Shintake
and Y. OtakeFLS 2010
March, 2010
Outline• Introduction
– X‐ray FEL Project at SPring‐8– SCSS Test Accelerator
• Transverse Distribution Diagnostics– Transverse Beam Profile Monitor
• OTR and Fluorescence• Longitudinal Distribution Diagnostics
– Transverse RF deflecting cavity– RF zero phasing method– Streak camera– EO sampling
• Summary
2

Introduction

X‐ray FEL Project at SPring‐8
• X‐ray wavelength: < 0.1 nm• Self‐amplified spontaneous emission (SASE) process• Beam energy: 8 GeV• Key technologies
– Low‐emittance
thermionic electron gun: 0.6
mm mrad– High‐gradient C‐band accelerator: 35 MV/m– Short‐period in‐vacuum undulator: u
= 18 mm, K < 2.2• First XFEL light will be delivered in 2011.
XFEL 70
0m
4

SCSS Test Accelerator• To check the feasibility of XFEL• To develop each subsystem• Extreme ultraviolet (EUV) FEL facility
– Wavelength: 50 – 60 nm for saturated output– Beam energy: 250 MeV
• Saturated EUV laser light has been stably generated since 2007.
Trend graph of FEL intensity
5

XFEL Machine Layout
• 8GeV linear accelerator– 238 MHz, 476 MHz, L‐band (1428 MHz), S‐band (2856 MHz) and
C‐band (5712 MHz)• Bunch compression
– Velocity bunching in the low energy region– Three bunch compressors– Bunch length: 1 ns 30 fs
(FWHM)
– Peak current: 1 A
3 kA• Coherent X‐rays are generated by in‐vacuum undulators
6

Transverse Distribution Diagnostics

Transverse Distribution Diagnostics• Requirements
– Spatial resolution < 10 m– Beam radius: 40 m (RMS) in the undulator
section
– For emittance
and Twiss
parameter measurement etc.
• High‐resolution beam profile monitor– Optical transition radiation (OTR) monitor (> ~100 MeV)
• Target: Stainless steel foil with polished surface– Phosphor screen monitor (< ~100 MeV)
• Target: Ce:YAG
(0.1mm‐thick) or Desmarquest
AF995
– Custom‐made imaging system– We didn’t observe COTR
K. Yanagida
et al., “Development of Screen Monitor with a Spatial Resolution
of Ten Micrometers for XFEL/SPring‐8”, Proceedings of LINAC’08.
8

Imaging System
• Custom‐made lens system• Variable magnification: x1 – x4
– Lens and CCD camera are mounted on a motorized stage– x1 optics: Beam finding– x4 optics: Precise measurement (2.5 m resolution) 9
Ray tracing simulation
Beam

Beamspot Images
• Taken at the SCSS test accelerator– Beam energy: 250 MeV– Horizontally focused by Q‐magnet.
• Image width is consistent with the natural divergence due to
beam
emittance
• Deterioration of Ce:YAG image is small (< 10 m).
OTR Ce:YAG (0.1mm thick)
13.4 m (std. dev.)
15.8 m (std. dev.)
10

Projected Emittance Measurement
• Q‐scan method at SCSS test accelerator
• Projected emittance ~ 3
mm mrad (normalized)
– Consistent with simulation– Slice emittance of the
lasing part is better than this value.
< 1
mm
mrad
50 MeV0.25 nC/bunch

Longitudinal Distribution Diagnostics

Requirements for Longitudinal Distribution Diagnostics
• Bunch length and peak current measurement• Slice emittance measurement
– Thermionic‐cathode injector causes a difference between projected
emittance and slice emittance.
• Energy v.s. Time distribution measurement– Strongly related to bunch compression
• Wide range of bunch length
13
~20ps ~3ps
~300fs ~30fs

Longitudinal Diagnostic Methods• Transverse RF deflecting cavity
– C‐band RAIDEN cavity– 10 fs resolution
• RF zero phasing method– ~100 fs resolution
• Streak camera– OTR is observed– 200 fs resolution
• EO sampling– ~100 fs resolution
14

Transverse RF Deflecting Cavity

Temporal Profile Measurement
• The electron bunch is vertically pitched by transverse RF voltage and the temporal structure is
converted to a spatial distribution.• Beam image is taken by an OTR monitor.• Required temporal resolution: < 10 fs
– 100 fs/mm on the screen (after 5–10m drift space)– Peak deflecting voltage: 40 MV
• Installed downstream of 3rd
Bunch compressor
1.4 GeV
5-10m~4m
16
C-band

• Racetrack‐shaped Iris‐coupling DEflectioN
structure
– To separate x‐
and y‐modeH. Ego et al., “Design of the Transverse C‐band
Deflecting Structure for Measurement of
Bunch Length in X‐FEL”, Proceedings of
EPAC’08.
• Resonant Frequency: 5712 MHz– To obtain higher kick voltage– To fully utilize the C‐band
accelerator resource
• Backward traveling wave of HEM11‐5/6 mode
• Deflecting voltage: 40 MV– When two 1.7m‐cavities
are
driven by a 50 MW klystron.
C‐band RAIDEN Cavity
17

Slice Emittance Measurement
• Measure the horizontal slice emittance.• Transverse RF cavity pitches the beam.• Longitudinally sliced beamlet is extracted by a slit.• Q‐scan method is applied to the beamlet.• We put a BPM before the slit in order to monitor
which part of the beam is extracted.– The net kick angle is affected by RF phase jitter and
beam arrival timing jitter.
18

Energy v.s. Time Measurement
• Leak dispersion from bunch
compressor by using a Q‐magnet at
the dispersive part.• Kick the beam with the transverse
cavity.• OTR monitor observes energy v.s.
time distribution.• A simulation showed that the bunch
compression ratio is not affected by
the Q‐magnet.
19

RF Zero Phasing

RF Zero Phasing Method• Accelerate the beam at the zero‐crossing phase before the bunch
compressor– Large energy chirp is given to the bunch
• In the dispersive part, the temporal structure can be seen as an
energy distribution by an OTR monitor.– Temporal structure is horizontally yawed at the monitor. Possibility to measure the vertical slice emittance
21
Energy spreadProportional to bunch length
C‐band Accelerator
Zero‐crossing phase
Vacc
OTR monitor
Bunch compressor
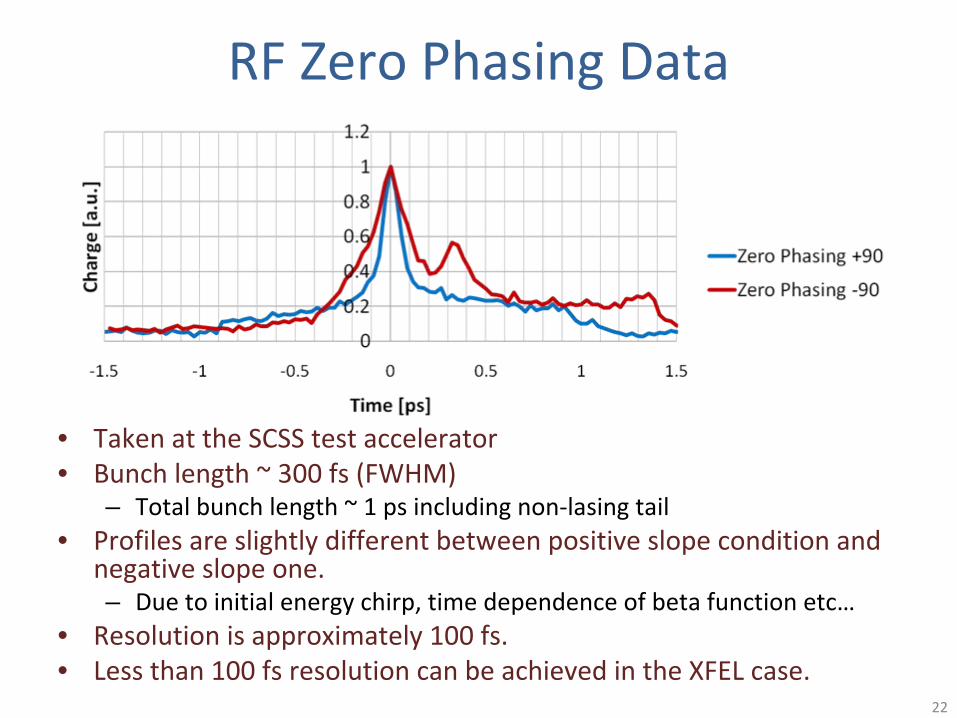
RF Zero Phasing Data
• Taken at the SCSS test accelerator• Bunch length ~ 300 fs (FWHM)
– Total bunch length ~ 1 ps including non‐lasing tail• Profiles are slightly different between positive slope condition
and
negative slope one.– Due to initial energy chirp, time dependence of beta function etc…
• Resolution is approximately 100 fs.• Less than 100 fs resolution can be achieved in the XFEL case.
22

Streak Camera
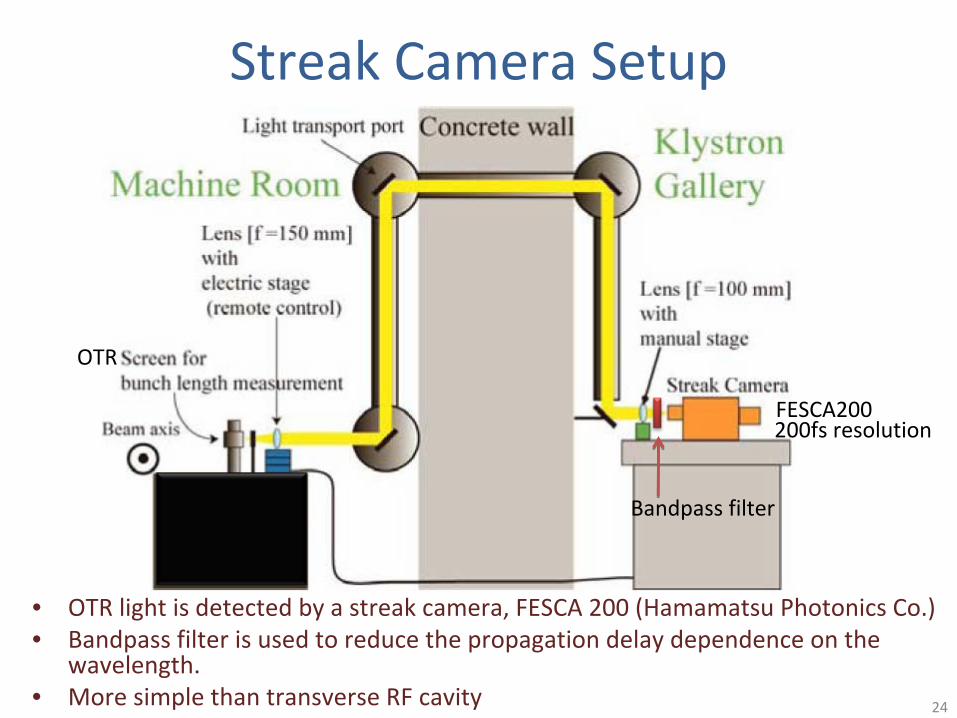
Streak Camera Setup
• OTR light is detected by a streak camera, FESCA 200 (Hamamatsu Photonics Co.)• Bandpass filter is used to reduce the propagation delay dependence on the
wavelength.
• More simple than transverse RF cavity 24
OTR
Bandpass filter
FESCA200200fs resolution

Streak Camera Results
• ~ 300 fs (FWHM) bunch length• Consistent with zero‐phasing method
25
Individual shotsNot enough intensity
Time jitter comes from
the trigger circuit of
the streak camera
20 ps
Accumulated after jitter correction by using the peak
of each shot

Streak Camera Results (cont’d)
26
• Accumulated after the jitter correction by the gravity
center
of each shot.
• In this case, bunch length is ~ 1 ps (FWHM)
– Error on the jitter correction?– Due to the tail component?
• Need to reduce the error from jitter correction.

Possible Improvements• Reduce the trigger jitter itself of the streak camera• Provide time reference light synchronized to the
beam– Jitter correction is done by using the reference light– Use 5.712 GHz optical comb generator
• Wavelength: 1550 nm• Pulse width: 1 ps• Jitter < 100 fs• Converted to 775 nm with SHG (Second Harmonic Generator)
27
Streak camera
OTR
Optical Comb
Generator SHG OTRReference
1550nm1ps
775nmReference light

Energy v.s. Time by Streak Camera
• Streak camera can also observe energy v.s. time distribution in
the same way as transverse cavity.– Time resolution is 200 fs, so this method can be
employed at BC1 and BC2.
28

EO Sampling

EO Sampling
30
Ti:Saphire Laser
Beam
• Electro‐optical (EO) crystal rotates the polarization of reference
light depending on the electric field pattern of the beam.
Courtesy of K. Tamasaku and T. Togashi
Temporal decoding

EO Sampling Results
31
• ~100 fs resolution is expected
Courtesy of K. Tamasaku and T. Togashi

Summary• Transverse Distribution Diagnostics
– OTR and phosphor screen monitors with custom‐made lens system• < 10 m resolution
– Use Q‐scan method to obtain the emittance• Longitudinal Distribution Diagnosis
– To measure bunch length, slice emittance, energy v.s. time
distribution, etc.
– C‐band transverse RF deflecting cavity (10 fs resolution)– RF zero phasing (~100 fs resolution)– Streak camera (~200 fs resolution)– EO sampling (~100 fs resolution)
• Slice emittance– Transverse RF cavity with slit and Q‐scan. (Horizontal slice emittance)– RF zero phasing also has a possibility. (Vertical slice emittance)
• Energy v.s. time– Leak dispersion from a bunch compressor and use transverse RF
cavity or streak camera
32

33

Supplements
34

XFEL Machine Parameters
35
Beam Energy 8 GeV
Bunch Charge 0.3 nC
Normalized Slice Emittance 0.7
mm mrad
Repetition Rate 60 pps maximum
Peak Current 3 kA
Bunch Length 30 fs (FWHM)
Beam Radius 40 m (RMS)
Undulator Period 18 mm
Undulator K‐value 2.2 maximum
Undulator Gap 3 mm minimum
Number of Periods 275 x 18 = 4950

Target• OTR target (> ~100MeV)
– Thin stainless steel foil• Thickness: 0.1 mm• To reduce radiation
damage of other
components.
– 1mm‐thick frame to support the foil• Ten 0.1 mm‐thick foils are stacked and joined by a diffusion
bonding technique.
– Surface roughness: several 10 nm– Flatness: 3 m
• Phosphor screen (< ~100 MeV)
– Ce:YAG scintillator (0.1mm‐thick)– Alumina fluorescent plate
• Desmarquest Co. AF99536

Spatial Resolution• Spatial resolution of the imaging system was
measured by using a grid distortion pattern.• Spatial resolution: 2.5 m (HWHM)
– Optical magnification: x4– Consistent with ray‐tracing simulation
Grid distortion pattern
37
A‐A’
cross‐section

Screen Actuator
• 3‐state pneumatic actuator– 2 screens and a beam hole– For the beam energy of 30 – 300 MeV
• Because of the poor OTR yield
Air cylinder
(OTR)
(YAG)
38

Projection of Beam Image
39

Coherent OTR Search
40
1mm
Superposition of 5 shots
Very stable
Observed point
SCSS test accelerator
Bunch compression ratio was changed by the RF phase of S‐band accelerator.
Courtesy of K. Togawa
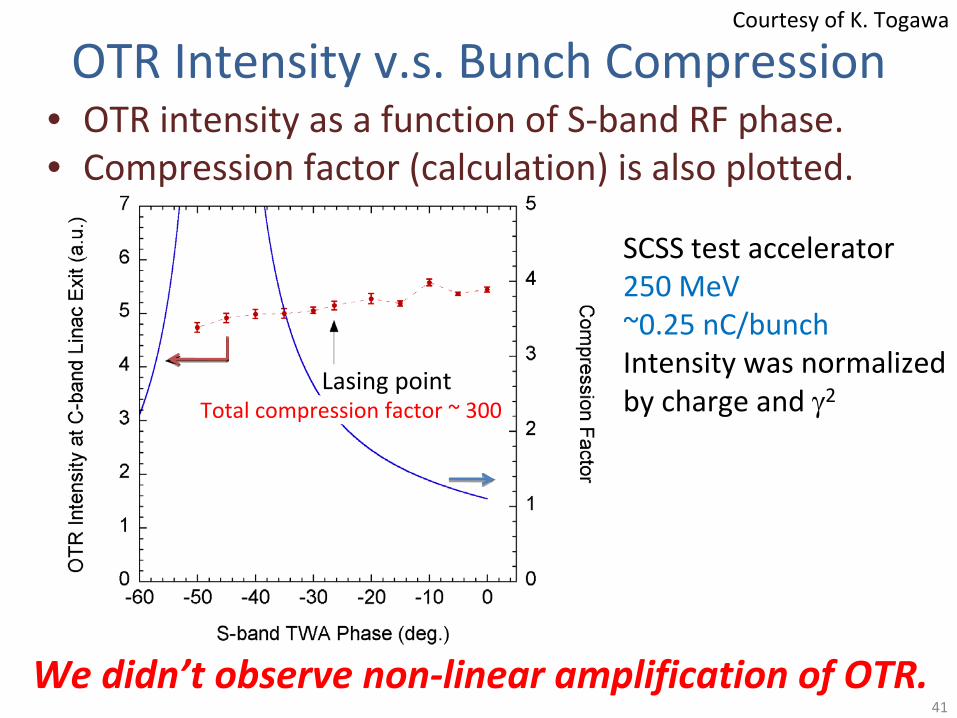
OTR Intensity v.s. Bunch Compression• OTR intensity as a function of S‐band RF phase.• Compression factor (calculation) is also plotted.
41
Lasing pointTotal compression factor ~ 300
SCSS test accelerator250 MeV~0.25 nC/bunchIntensity was normalized
by charge and 2
We didn’t observe non‐linear amplification of OTR.
Courtesy of K. Togawa
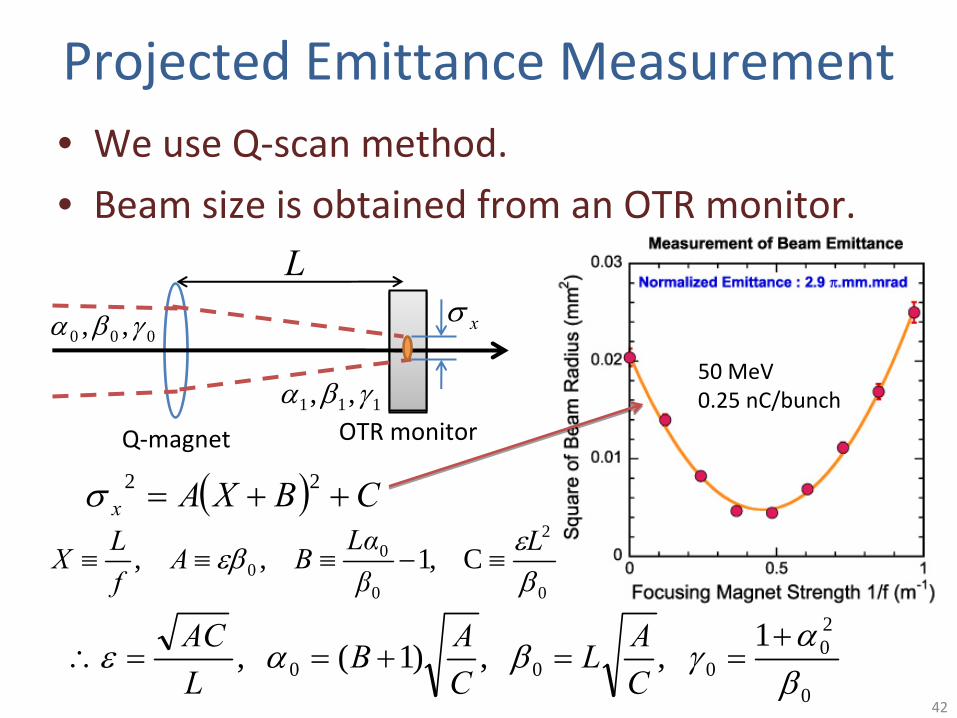
Projected Emittance Measurement• We use Q‐scan method.
• Beam size is obtained from an OTR monitor.
42
50 MeV0.25 nC/bunch
CBXAx 22
0
2
0
00 C ,1 , ,
L
βLα
BAfLX
0
20
0001
, ,)1( ,
CAL
CAB
LAC
OTR monitor
L
Q‐magnet111 ,,
000 ,, x

Estimation of Slice Emittance from SASE‐FEL Energy Curve
• FEL energy curve was compared with simulation
43
Slice emittance of
SCSS test accelerator:~ 0.7
mm mrad
Gun emittance is
conserved

COTR Measurement at Undulator Exit
• Due to micro‐bunching in the undulator44
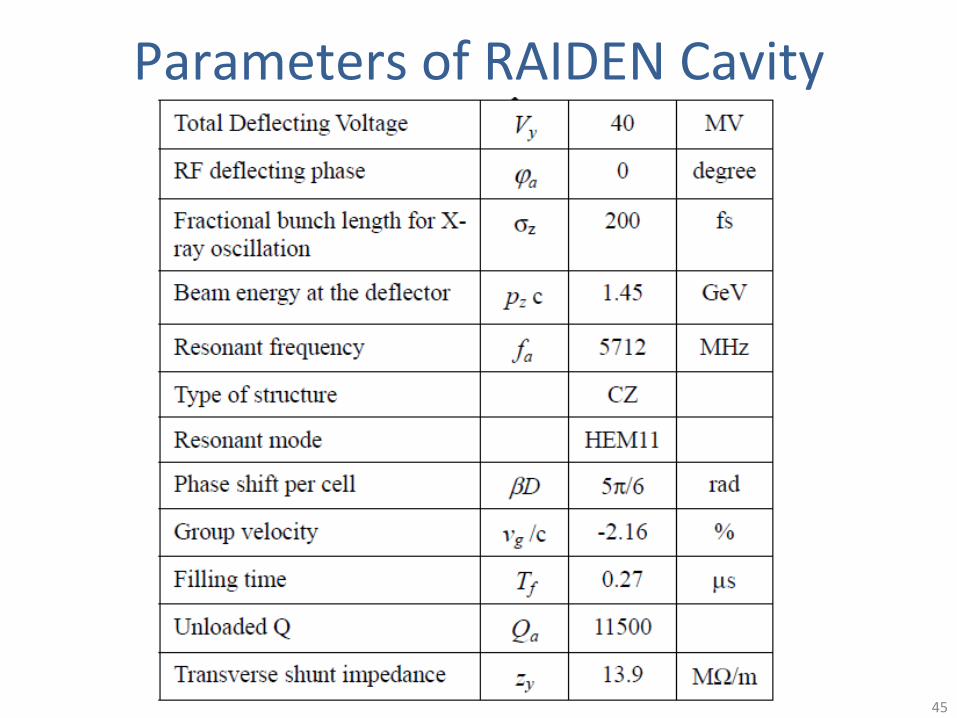
Parameters of RAIDEN Cavity
45
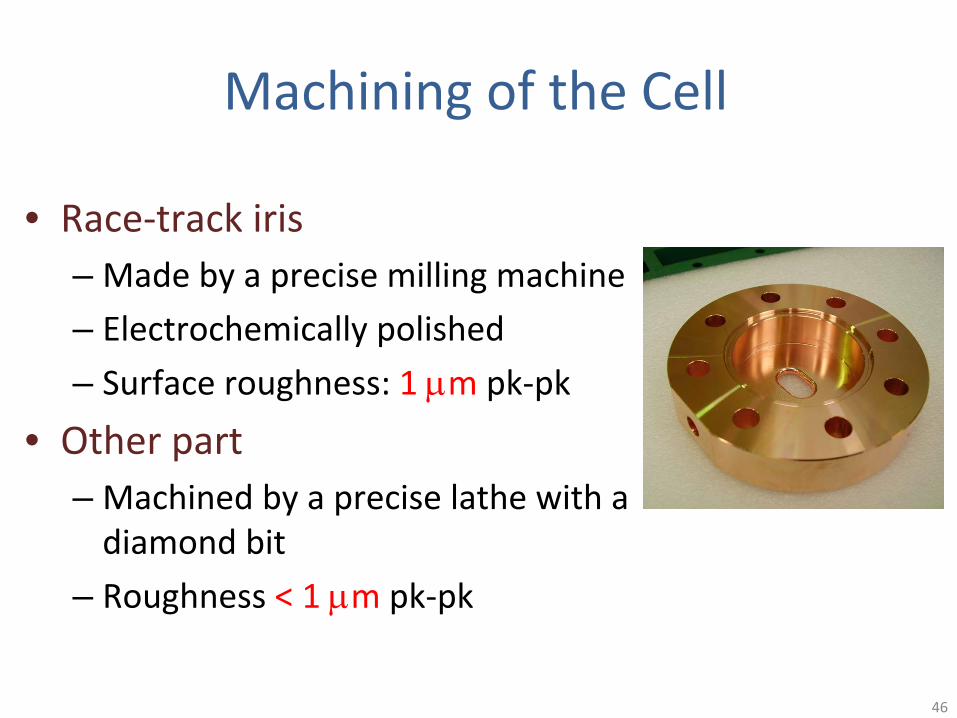
Machining of the Cell
• Race‐track iris– Made by a precise milling machine
– Electrochemically polished
– Surface roughness: 1 m pk‐pk
• Other part– Machined by a precise lathe with a
diamond bit
– Roughness < 1 m pk‐pk
46

Low‐level RF Measurements
5712 MHz
• Measured with a 7‐cell model.• Pass band
– Y‐mode is clearly separated from x‐mode.• Shunt impedance
– Bead perturbation measurement– Simulation:
13.9 M/m– Measurement:
13.7 M/m
X‐mode
Y‐mode
5/6
47
SimulationX‐mode
Y‐mode
MeasurementHEM11

Coherent Radiation

Coherent Radiation• Coherent Transition Radiation (CTR)
– Detect RF wave from a phosphor screen.– Before BC1.– Tested at SCSS test accelerator.
• Coherent Synchrotron Radiation (CSR)– Non‐destructive– Detect THz radiation by a pyro‐electric detector.– The relationship between the radiation intensity
and the bunch length is measured with a transverse cavity.
– In preparation of an experimental setup at SCSS test accelerator
49
50
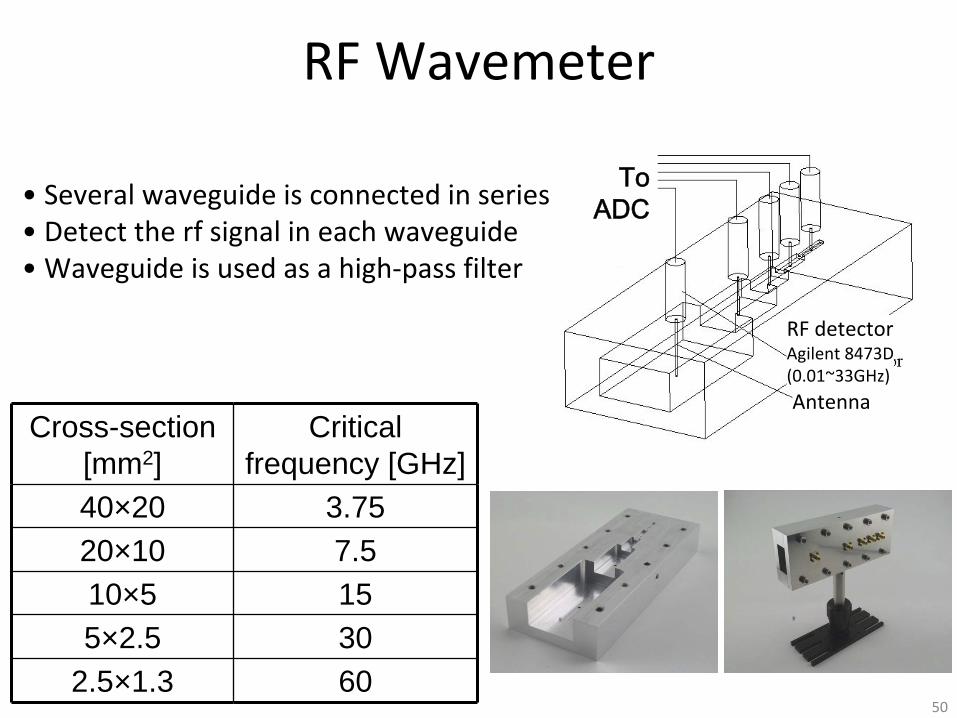
RF Wavemeter
Cross-section [mm2]
Critical frequency [GHz]
40×20 3.7520×10 7.510×5 155×2.5 30
2.5×1.3 60
To ADC
RF detectorAgilent 8473D(0.01~33GHz)
Antenna
• Several waveguide is connected in series• Detect the rf signal in each waveguide• Waveguide is used as a high‐pass filter

51
CTR ResultsBunching phase Debunching
CTR after 476MHz cavity.
Horizontal axis shows the RF phase
of 476 MHz cavity.
Consistent with peak current
simulation
Charge
Peak current
[a.u.](simulation)
51
Screen
Spectrometer
Beam
Mesh
Setup

52
1
100
10000
1e+06
1e+08
1e+10
1e+12
1e+14
0.0001 0.001 0.01 0.1 1R
F P
ower
[a.u
.]
Wavelength [m]
sigma = 160pssigma = 80pssigma = 40pssigma = 20pssigma = 10pssigma >> 1ns
CTR Intensity
)(pN
)(zS
)](1[)()( fNNpP
2
2exp)()(
dzzjzSf
CTR Intensity
:Radiation from single electron
: number of electrons
CTR intensity in case of a
Gaussian‐bunch beam
: electron distribution function
2)(1~)()(0~)(
NPfNPf
Coherent radiation (large intensity)Longitudinal profile can be estimated from this spectrum.

53

Requirements and Solutions for the Beam Diagnostic System
• High‐resolution beam position monitor (BPM)– To maintain the overlap between an electron beam and X‐rays in the
undulator section with 4 m precision
– Position resolution < 0.5 m RF cavity BPM
• High‐resolution transverse beam profile monitor– Beam radius: 40 m (RMS)– For emittance and Twiss parameter measurement etc.– Spatial resolution < 10 m OTR monitor and fluorescent screen monitor with a custom imaging system
• Noise‐free high‐speed current transformer (CT)– Need to reduce noise coming from the power supply of a klystron.– Rise time < 1 ns Differential CT
• Temporal bunch structure measurement system– Bunch Length: 30 fs
(FWHM)– Temporal resolution < 10 fs C‐band transverse RF deflecting cavity
54

RF Cavity BPM

RF Cavity BPM
• Details will be reported by MOPD07 in the today’s poster session.
• Resonant Frequency: 4760 MHz
• Required position resolution: < 0.5 m56

RF‐BPM Resolution
57
Sigma:0.23 m
• Position resolution: 0.2 m– Measured with three adjacent BPMs.
– Compare the 2nd
BPM data with the interpolation from 1st
and 3rd
BPMs.

Quantity of Beam Monitors
• RF cavity BPM (RF‐BPM):
56
• Beam profile monitor (PRM): 43
• Current transformer (CT):
30
• Transverse RF deflector:
158

Detection Principle of RF‐BPM• TM110 dipole resonant mode of a pillbox cavity
– E‐field is linear around the axis• Output voltage
• Need to discriminate in‐phase component from quadrature.
59
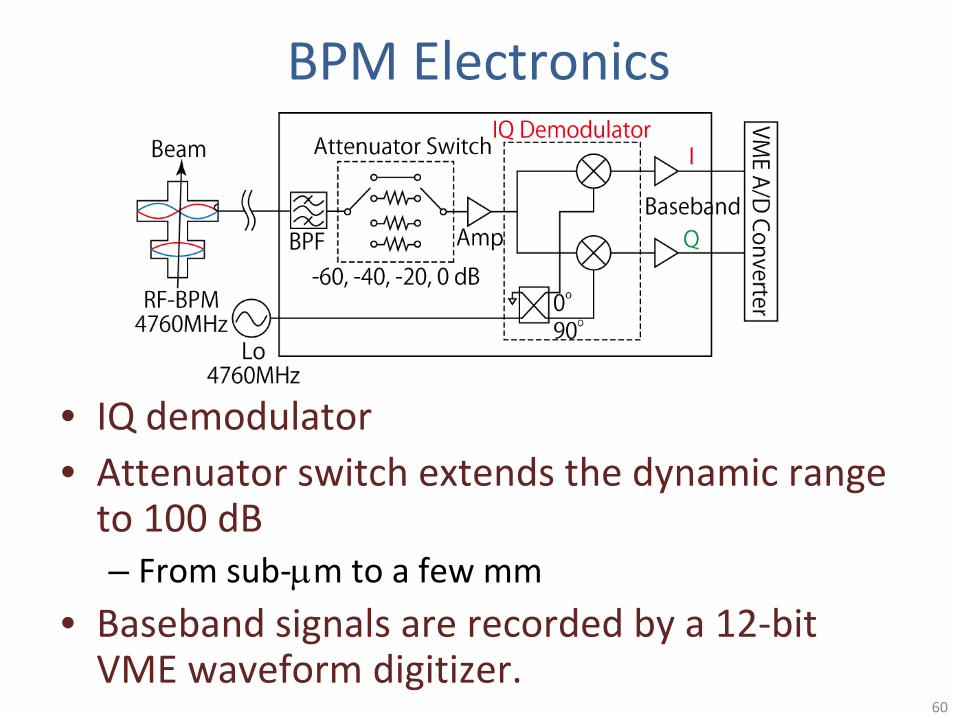
BPM Electronics
• IQ demodulator• Attenuator switch extends the dynamic range
to 100 dB– From sub‐m to a few mm
• Baseband signals are recorded by a 12‐bit VME waveform digitizer.
60

Position Sensitivity• Measurement
– Motorized stage of the BPM was moved– Beam was fixed
• Position sensitivity: 0.1 m– More than 20 ADC counts / m– ADC noise < 2 counts (RMS)
61
More than
20 ADC counts / m
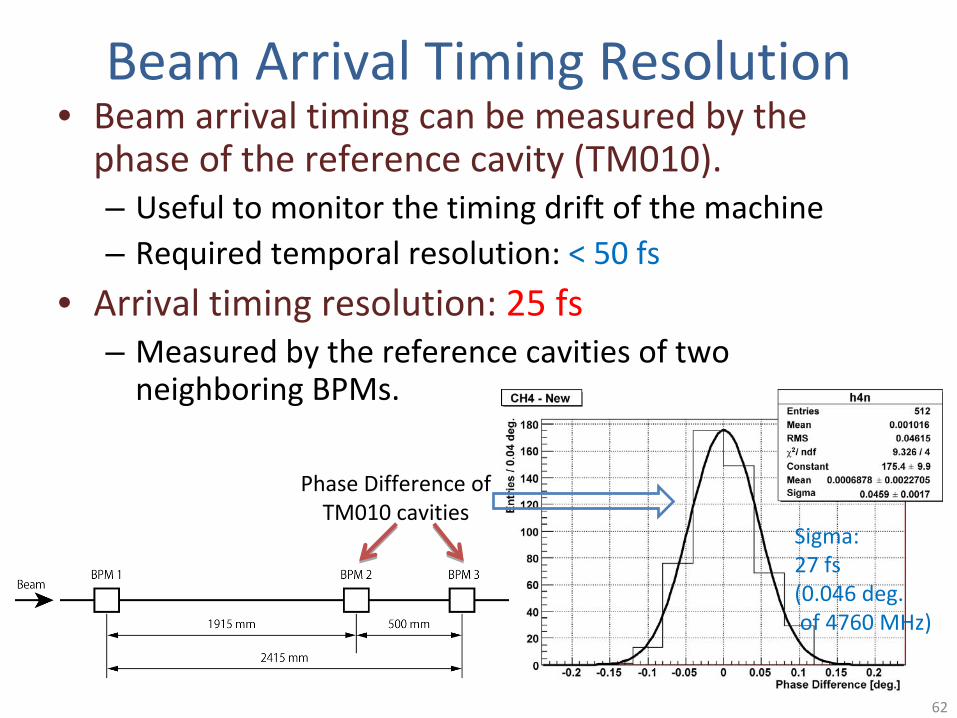
Phase Difference of
TM010 cavities
Beam Arrival Timing Resolution• Beam arrival timing can be measured by the
phase of the reference cavity (TM010).– Useful to monitor the timing drift of the machine– Required temporal resolution: < 50 fs
• Arrival timing resolution: 25 fs– Measured by the reference cavities of two
neighboring BPMs.
62
Sigma:27 fs(0.046 deg.
of 4760 MHz)

Current Transformer

Differential Current Transformer
• 2 positive ports and 2 negative ports• Common‐mode noise can be subtracted
Beam
Positive portNegative port
Ceramic insulatorMagnetic core(>10 at 1 GHz)
Pickup coil (1 turn)
22
Positive port
Negative port
64

CT Results
• Rise time: 0.2 ns
• Pulse height is proportional to the beam charge
Output Pulse Comparison with an existing CT
65
Remainder
Positive Port
Negative Port

Common‐mode Noise Reduction
• Common‐mode noise was reduced to 1/10.
1mV/div, 10s/div
Bottom port (negative)
Remainder
Beam signalCommon‐mode Noise from klystrons
66
![j k V ª h ; i z f r H k k [ k k s t i j h { k k (NTSE) , o ...1]_3.pdfj k " V ª h ; i z f r H k k [ k k s t i j h { k k (NTSE), o a u s ’ k u y e h U l & d e & e s f j V L d k](https://img.dokumen.tips/doc/110x75/5cf73e0d88c993c22f8c49c9/j-k-v-a-h-i-z-f-r-h-k-k-k-k-s-t-i-j-h-k-k-ntse-o-13pdfj-k-v.jpg)


![O H h t Y Ë - ] k O - /$1 $1$)](https://img.dokumen.tips/doc/110x75/61b3dcea60a4341c097aa8d1/o-h-h-t-y-k-o-1-1.jpg)
