Embed Size (px)
Citation preview

Concrete Check dam
Earthen Check Dam
Nalla BundCement Plug
DESIGN AND ESTIMATES OF
CHECK DAMTYPES OF CHECK DAMS
EARTHEN CHECKDAMS:(EMBANKMENTS)� MADE OF EARTH & CLAY
� SUITABLE FOR SHALLOW STREAMS WITH MINIMAL FLOW & LOW GREDIENT
� UNABLE TO WITHSTAND OVERFLOW CONDITION
STONE /R.C.C. CHECK DAMS� LARGER STREAM FLOW
� ALLOWING OVER FLOW
"Check-dams" are small barriers built across the
direction of water flow on shallow rivers and
streams for the purpose of water harvesting.
FACTORS TO BE CONSIDERED IN SITE
SELECTION
� Stream size and estimated streamflow
� Maximum flood levels during the monsoon
� Presence of rocks or other natural barriers which can be incorporated into the design
� Presence of suitable bed material to promote infiltration
� Distance of fields to stream to prevent flooding
� Local need and demand for irrigation water
� Surplusing arrangement should be made
� 10 year rainfall recurrence interval is to be estimated for the design of check dams
Guidelines for selection of sites
for percolation tanks
� Site should be upper reaches of streams preferably through wasteland
� Saucer shaped
� There should be existing wells 2 wells per sq.km
� Area should be there for irrigation and a soil cover of 25 cm
� Aquifer should be weathered and fractured
Design criteria
� Dependability of rainfall
� < 300 mm 40%
� 380- 760 50 %
� 760 And above 65 %
� Absence of gauged values, adopt strange tables
� Only 20 % available yield should be considered for design

Hydro geological studies
– Detailed mapping delineating different
aquifers and rock types
– Inventory of wells
– Estimate aquifer parameters
– Estimate ground water recharge
� Advantages� Check dams not only prevent gully erosion from occurring
before vegetation is established, but also cause a high proportion of the sediment load in runoff to settle out.
� In some cases, if carefully located and designed, these check dams can remain as permanent installations with very minor repairs.
�Disadvantages/Problems� Because of their temporary nature, many of these measures
have to be repaired regularly. � Temporary check dams are only suitable for a limited
drainage area and benefits are limited.� Removal may be a significant cost depending on the type of
check dam installed.
Stability of analysis of weirsConditions for stability of
weirs� There must be no tension
in the masonry or in the contact plane between the weir and the foundation
� There must be no overturning
� There must be no tendency to slide on the joint with foundation or any horizontal plane above the base
� The maximum toe and heel pressures on foundations should not exceed the prescribed safe limits.
Safety of dam
at FSL-Sliding
Safety of
dam at
FSL-
Crushing
Safe Safe
Safety of
damat
AHFL-
Crushing
Safety of
damat
AHFL-
Sliding
Check
AHFL RL
Safe Safe AHFL RL
is OK
Safety of dam at
AHFL-over turning
Stable
MAINTENANCE
� Check dams should be checked for sediment accumulation after each significant rainfall.
� Sediment should be removed when it reaches one half of the original height or before.
� Regular inspections should be made to insure that the center of the dam is lower than the edges.
� Erosion caused by high flows around the edges of the dam should be corrected immediately.

Design and construction of check dams
Abutment
Body
wall
Side Wall
Toe
Apron
Approach
Key
wall
Salient points for design and
construction of check dams
• Need and site location
• Design
– Map of the area
– Estimation of catchment area
– Rainfall analysis
– Plan and cross section
– Yield at the site
– High flood Estimation
• Estimates
– Detailed quantities
– Men and material
• Construction
• Project proposal
• economics
1 Take a graph paper
2. Trace the water shed on the grapg
paper
3. If the scale of the map is 1:50000
ie 1cm = 50000 cm
= 500 m
ie sq.cm = 500*500=250000 sq.m
=25 ha
1.Measure full squares
2. Measure ½ squares
3. Measure ¼ squares
4. Total all squares and estimate the
area of watershed
• RF-ST R.FALL(mm) AREA POLY PRODUCT
• R1 130 0.05 6.5
• R2 100 9.05 905
• R3 160 0.3 48
• R4 150 0.15 22.5
• R5 190 11.2 2128
• R6 70 0.15 10.5
• R7 90 3.9 351
• AVERAGE RAINFALL (mm)
127.14
• WEIGHTED AVEG.RAINFALL (mm)
139.98

Rainfall analysis of Bhavnagar
-800.00
-600.00
-400.00
-200.00
0.00
200.00
400.00
600.00
800.00
1000.00
1200.00
1969
1970
1971
1972
1973
1974
1975
1976
1977
1978
1979
1980
1981
1982
1983
1984
1985
1986
1987
1988
1989
1990
1991
1992
1993
1994
1995
1996
1997
1998
year
Rainfa
ll (mm
)
Rainfall
average
Excess / less
Cummulative mass curve
Year 1969 1970 1971 1972 1973 1974 1975 1976 1977 1978
Rainfall 215.90 722.38 671.58 119.89 512.06 510.03 202.18 511.05 533.40 215.39
Year 1979 1980 1981 1982 1983 1984 1985 1986 1987 1988
Rainfall 795.78 534.42 911.86 565.91 1061.97 604.52 194.31 214.88 139.95 240.03
Year 1989 1990 1991 1992 1993 1994 1995 1996 1997 1998
Rainfall 679.20 533.40 264.16 560.07 325.12 675.64 351.03 303.02 668.78 545.85
S.NO YEAR Rainfall
(mm)
1 1988 1016.00
2 1994 1015.00
3 1979 983.00
4 1975 801.00
5 1997 765.00 50%
6 1996 755.00
7 1976 724.00
8 1977 715.00
9 1992 681.00
10 1980 615.00
ESTIMATION OF RAINFALL BY USING STRANGE TABLES
STRANGE TABLE
CATCHMENT(GOOD/AVERAGE/BAD) good
RAINFALL(MM) 377.95
RUNOFF(%) 9.4
RAINFALL
(mm) GOOD AVERAGE BAD
300 6.2 4.6 3.1
325 7.2 5.4 3.6
350 8.3 6.2 4.1
375 9.4 7 4.7
400 10.5 7.8 5.2
425 11.6 8.7 5.8
450 12.8 9.6 6.4
475 13.9 10.4 6.9 good 9.4
500 15 11.25 7.5 average 7
525 16.1 12 8 bad 4.7
Yield of the catchment� Yield of the catchment (cum)=
� Area of the catchment (Sq.M)* Runoff (in fraction) * Dependable Rainfall (m)
Capacity Table
Sr.NO RL Length
across
WW
(m)
Leng
th
acro
ss
Rive
r (m)
Differenc
e in RL
Capacity
(cum)
Cumulative
Capacity
(cum)
Remarks
1.00 98.52 0.00 0.00 0.00 0. 0. River bed
2.00 99.0 25.00 150. 0.48 1800. 1800.
3.00 99.5 55.00 330. 0.50 9075. 10875.
4.00 100.0 90.00 460. 0.50 20700. 31575. Top of spill way
=9.55*0.128*0.454
=0.55 mcm
5.74% of total flow will be held

Cross section
95
96
97
98
99
100
101
102
0 10 20 30 40 50 60 70 80 90 100 110 115 125 135
Chainage (m)
RL(m
)
Av.GL(m)
HFL (m)
FSL (m)
AHFL (m)
RL of top of foundatiion (m)
Discharge Discharge (cum) Cummulative disc (cum)
QFSL 124.84 124.84
QHFL 224.92 349.76
QAHFL 83.90 433.66
Cross sectional ares from Ground level to FSL
Sr.No Chainage (m) Av.GL(m) FSL (m) Depth
Height
(m)
Mean
depth /
Height(m
)
Distance between
two chainages
(Length) (m)(P)
Area ( sq.m)
-A
WP (m)
1 0 101.5 100.00 0.00 0.00 0.00 0.00 0.00
2 10 100.03 100.00 0.00 0.00 0.00 0.00 0.00
3 20 98.86 100.00 1.14 0.57 10.00 5.70 10.02
4 30 98.68 100.00 1.32 1.23 10.00 12.30 10.08
5 40 98.69 100.00 1.31 1.32 10.00 13.15 10.09
6 50 98.89 100.00 1.11 1.21 10.00 12.10 10.07
7 60 98.94 100.00 1.06 1.09 10.00 10.85 10.06
8 70 98.81 100.00 1.19 1.13 10.00 11.25 10.06
9 80 98.52 100.00 1.48 1.34 10.00 13.35 10.09
10 90 98.79 100.00 1.21 1.35 10.00 13.45 10.09
11 100 99.01 100.00 0.99 1.10 10.00 11.00 10.06
12 110 99.85 100.00 0.15 0.57 10.00 5.70 10.02
13 115 100.42 100.00 0.00 0.08 0.00 0.00 0.08
14 125 100.45 100.00 0.00 0.00 0.00 0.00 0.00
15 135 100.85 100.00 0.00 0.00 0.00 0.00 0.00
average GL 98.77 100.00 108.85 100.70
Min 98.52 101.50 Q=A*V
(cumec)
124.84 R=A/P 1.08
Approach Velocities at different levels� Approach velocities at FSL,HFL and AHFL are
required.� The velocity is calculated as under:
� V= 1/N* R ^(2/3)*S^(1/2)
� Where Velocity (m/sec)
� N= Roughness coefficient (0.25 to 0.3)
� R= Hydraulic Mean depth ( A/P)� Where A= Area of Cross Section (sq.m)
� P= Wetted perimeter)
� S= River bed slope in fraction
Approach discharges at different levels
Q= A* V
Flood Discharge Estimation� Dicken’s formula
� Q=C*M^3/4
� C= 11.4 for North India
� C= 13.9 to 19.5 for Central India
� C= 22.5 to 25 for Western India
� Government of Gujarat Qspf= 0.8*C*A^b
� C=29.0402� b=0.9232
� Ryve’s formula
Q = CM ^(2/3)
� Where C = varies from 6.8 to 15 kms
� C = 6.75 if area is less than 24 kms from coast
� C = 8.45 if area is 24 - 16 kms
� C = 10.1 for hills
� Q = Discharge in cumecs
� M = Area in Sq. kms
� Ali Nawaj Jung Bahadur’s formula
� (0.993 - 1/14 Log A)
� Q = CA
� Value of C taken from 48 to 60
� This is applicable mainly in Deccan plains
� A = Area of catchment in sq. km

Englis gave the following formulae
derived from data collected from 37
catchments in Bombay Presidency
For Ghat areas
R = 0.85 P - 30.5
Where R is run off in cms
P = Precipitation cm
For non Ghat areas
R = {P - 17.8} x P/254
Khoslas’ formula
R = P - (T - 32)/3.74
Where T = mean temp F
R & P are in cms.
Ingle’s formula
Q=123*A/SQRT(A+10.4)
A= Area(sq.km)
Barlow’ and Lacey have also given empirical formula as under
R = KP
Where R = Run off
P = Precipitation
K = Run off coefficient for different class of catchments like,
A = Flat cultivated soil
B = Flat partly cultivated
C = Average
D = Hills & plains with cultivation
E = Very hilly areasBarlow has added another coefficient based on light rain, average
rainfall with intermittent rains and continuous down pour etc.
Lacey has given a formula as
R = P
------------------
1 + (304.8 F/PS)
Where S = Catchment factor
F = reservoir duration factor which is based on different classes
as defined by Barlow’s equation.
BARLOW'S TABLE
CLASS
DESCRIPTION OF
CATCHMENT
RUNOFF
PERCENTAGE
A
Flat , cultivated and black
cotton soils 10
B flat partly cultivated stiff soils 15
C Average catchment 20
D
Hills and plains with little
cultivation 35
E
Very hilly and steep with little
or no cultivation 45
NATURE OF
SEASON A B C D E
Light rain, no heavy
down pour 0.7 0.8 0.8 0.8 0.8
Average or no
continuous rain 1 1 1 1 1
continuous
downpour 1.5 1.5 1.6 1.7 1.8
Rational Method:
In this method the basic equation which correlates runoff
and rainfall is as followsQ = C * I * A
Where Q = Runoff (Cubic meters per hour)
C = Runoff Coefficient
I = Intensity of rainfall in meters per hour
A = Area of the drainage basin (Sq. Meters)
Intensity of Rainfall(m/hr)(I)
=P/Tr ((Tr+1)/Tc+1)
P Precipitation meters
Tr Storm period hrs
Tc Time of Concentration hrs
if Tc is not known, then
I = P/Tr
Time of Concentration(Tc) is the time in hours taken by rain water that falls at the
farthest point to reach the outlet of a catchment

The value of runoff coefficient C depends on the characteristics
of the drainage basin such as soil type, vegetation, geological
features etc. For different types of drainage basins the values of
C are given below in table
Table Value of C for different types of drainage basins
Types of drainage basin Value of C
Rocky and impermeable 0.8-1.0
Slightly permeable, bare 0.6-0.8
Cultivated or covered with
vegetation
0.4-0.6
Cultivated absorbent soil 0.3-0.4
Sandy soil 0.2-0.3
Heavy forest 0.1- 0.2
Unit Hydrograph
0.00
1.00
2.00
3.00
4.00
5.00
1 2 3 4 5 6 7 8 9 10 11 12 13 14 15 16 17 18 19 20 21 22 23
No of hours
Discharge (cumec)
(unit hydrograph method)• Date hour Disch base rdinate ordinate
• cumec flow dir -rf unit hyd
• 12 aug 6 6 6 0 0
• 12 16 5 11 0.46
• 18 60 3.5 56.5 2.39
• 24 100 2.5 97.5 4.12
• 13 aug 06 68 3 65 2.75
• 12 35 4 31 1.31
• 18 11 4.5 6.5 0.27
• 24 7 5.5 1.5 0.06
• 14 aug 06 6 6 0 0
Unit hydrograph method
� A unit hydrograph is hydrograph representing 1 cm of run off from a rainfall of some unit duration and specific aerial distribution. A unit hydrograph is derived from an observed hydrograph. Data regarding duration of rainfall, amount of rainfall and the resulting run off data as observed by gauging from the observed hydrograph is used for the construction of unit hydrograph. The basic assumptions in constructing unit hydrograph are� All the combined characteristics of the basin are reflected in the
hydrograph.
� Identical rainfall with the same characteristics produce identical hydrograph
� The vertical ordinates of the hydrograph are proportional to thevolume of run off on the same catchment.
� Rainfall as a hypothetical storm covering the whole catchment over duration of time equal to time of concentration I.e.. Travel time of water from the last point of water shed to the gauging point.
Construction of Unit hydrograph
Follow the steps for constructing a unit hydrograph as given
below
1. From the past records select some unit period of intense
rainfall duration corresponding to an isolated storm uniformly
distributed over the area.
2. From past records plot the storm hydrograph for some
days before and after the period of rainfall of that unit
duration.
3. Separate the ground water base flow.
4. Subtracting the ordinates of base flow from the total
ordinates find the ordinate of direct runoff.

5. Calculate the volume of direct run off using the
following formula
Direct run off = 0.36 E (O) * t
--------------
A
Where E(O) = Sum of discharge ordinate (direct run off)
t = Time interval between successive ordinate in hours
A = Area of drainage in sq.km.
The input data required for estimating unit hydrograph and the
actual results are given in Annexure V.
The Unit hydrograph can be used to construct flood
hydrograph resulting from rainfall of the same unit duration
for which the unit hydrograph has been calculated. The results
of unit hydrograph are given in Annexure V.
ESTIMATION OF FLOOD DISCHARGE BY UNIT HYDROGRAPH
CATCHMENT TIME INTER RAINFALL
DATE HOUR TOTAL Q BASE FLOW ORDINATE ORDINATE AREA(SQ.KM) VAL(HRS) (CM)
OF DIRECT OF UNIT 25 2 9.00
RUNOFF HYDRO Estimtion of Total discharge based on Unit Hydrograph.
GRRAPH DATE HOUR BASEFLOW DIR.RUNOFF TOT.DISCH
(Cumec) (Cumec) (Cumec) (Cm) (Cumec) (Cumec) (Cumec)
12 AUG 6 6.00 6.00 0.00 0.00 AUG 24 6 4 0.00 4
8 8.00 6.00 2.00 0.08 8 3.5 0.00 3.50
10 10.00 5.50 4.50 0.19 10 3 0.00 3.00
12 16.00 5.00 11.00 0.46 12 2.5 0.00 2.50
14 28.00 4.50 23.50 0.99 14 2 0.00 2.00
16 42.00 4.00 38.00 1.61 16 1.5 0.00 1.50
18 60.00 3.50 56.50 2.39 18 1.8 0.00 1.80
20 80.00 3.00 77.00 3.25 20 2.1 0.00 2.10
22 110.00 2.50 107.50 4.54 22 2.4 0.00 2.40
13 AUG 24 100.00 2.50 97.50 4.12 24 2.7 0.00 2.70
2 90.00 2.50 87.50 3.70 2 3 0.00 3.00
4 80.00 3.00 77.00 3.25 4 3.3 0.00 3.30
6 68.00 3.00 65.00 2.75 6 3.6 0.00 3.60
8 56.00 3.50 52.50 2.22 8 3.8 0.00 3.80
10 45.00 3.50 41.50 1.75 10 4 0.00 4.00
12 35.00 4.00 31.00 1.31 12 4 0.00 4.00
14 26.00 4.00 22.00 0.93 14 4 0.00 4.00
16 18.00 4.50 13.50 0.57 16 4 0.00 4.00
18 11.00 4.50 6.50 0.27 18 4 0.00 4.00
20 9.00 5.50 3.50 0.15 20 4 0.00 4.00
22 8.00 5.50 2.50 0.11 22 4 0.00 4.00
14 AUG 24 7.00 5.50 1.50 0.06 24 4 0.00 4.00
2 6.00 6.00 0.00 0.00 2 4 0.00 4.00
TOTAL 308 919.00 97.50 821.50
DIRECT
RUNOFF= 23.6592
Maximum flood with different formula
MFD (Area velocity
method)cum/sec (Q=A* V)HFL
349.76
MFD at the site (Dicken)cum/sec 135.81
Ingle's formula 262.99
MFD (Rainfall intensity method
(C*I*A))- rational method cum / sec
124.35
MFD at the site (GOG)-Standard
Project flood method) cum/sec
233.21
Average MFLD 221.22
Length of Check Dam
L=(1.5*Q)/(C*H*SQRT(2*9.81*H))
Design Flood(cum) 163.24
Flood lift (H)-(FSL to HFL) 1.00
Calculated Length of Weir(m) 88.45
Length of check dam actually
proposed due to site
conditions
100.00

Crest width and base width of CD
height of weir above GL(H) from foundation to FSL 2.70
Height above crest (Free board / (h= 0.00
Crest widh(m
=0.55*(SQRT(H))
H=Ht of weir above GL up to FSL
including Free board if any
0.90
Actual provided 0.75
Base width
calculated
=H*S
S= Slope of body wall to the height
of the dam
2.16
Actually provided 2.75
Score depth
Height of check dam from River
bottom to HFL(m)
2.48
Design Discharge(cum) 163.24
q= discharge per m lenth of spill
way
1.63
Fround No(F)=V/sqrt(g*d1) 4.14
Scoure Depth(SC)=0.473*(Q/F)^1/3 1.61
Max SC 2.41
RL of bottom SC from AHFL 98.82
Foundation RL= AHFL-1.5SD 97.30
MAX RL of SC as per site conditions 98.82
Height of Check dam from foundation
to FSL (Z)
2.70
height of check dam fromFSL to HFL 1.00
Height of Check dam from GL
toHFL(H)
3.70
height of check dam from HFL to
AFHL
0.23
height of check dam from FSL to
AFHL(H)
1.23
Apron length (y) 4/3*sqrt(Z)*H 2.69
As the ground conditions are good ,
appron width can be kept at
5.00
Toe Height above GL =Top of toe RL/
approach bottom- River bottom RL at the
site(m)
0.13
d1=q/v1 0.25
Hydraulic jump(d2)=-
(d1/2)+(d1^2/4+2*va^2*d1)/
g))^0.5
1.35
Length of appron
(calculated)
5.50
Top of appron RL= 98.35
Thickness of appron (t )=
(d2-d1)/2*(W1/(W1-W))
0.39
Proposed (t)as it is hard
rock
0.60
Bottom RL of Appron 97.75
Top width (
Thickness)
of end sill
0.54 Height
of end
sill
0.27
Provide 0.45 provid
e
0.45
Apron calculationsEffective head(h)= AHFL-Appron RL+d1
effective velocity (m/sec) v1=0.9*sqrt(2*g*h)
Assumed d1= 0.22
h= 2.66
v1= 6.50
Estimation of AHFL Level
Discharge passing Between HFL and AHFL
AA= Area between AHFL nd HFL,
AB= Area between HFL FSL
CA,CB= Consts,
H= Flood lift, h= Velocity Head
QA= AA*CA*(2/3)*sqrt(2*g)*((H+ha)^3/2-
(ha)^3/2)/H
61.22
QB= AB*CB)*sqrt(2*g)*sqrt((H+ha)) 380.26
Discharge passing Between FSL and HFL
QA+QB= 441.48
Designed discharge 163.24
AHFL RL AHFL RL is OK
Check for crushing.
Eccentriciy(e) e= z-b/2 -0.70
Pmax (kg/m^2) W/b(1+6*e/b)*1/10 -0.20
Pmin ( kg/m^2) W/b(1-6*e/b)*1/10 0.63
Safe
The crushing strength is far less than 30
kg/cm^2 as such it is in order
Check for over turningH= Height of the dam from
foundation
Net moment considering 100
% uplift pressure
1.77
B= Dam width Net weight considering
100% uplift(w)
4.64
D2= thickness of foundation
concrete
Resultant (z) sigma M/sigma W= 0.38
Stable
C.Sp.gravity of concrete The resultant momentum passes through between 1/3 to 2/3 rd base , the
structre is safe
T= Width of the dam Net moment considering50%
% uplift pressure
D1= thickness of concrete on
top of dam
Net moment considering
50% uplift pressure
5.74
M=Sp.gravity of dam material Net weight considering 50%
uplift(w)
8.31
W= sp.gravity of water Resultant (z) sigma M/sigma W= 0.69
Stable
The resultant momentum passes through between 1/3 to 2/3 rd base , the structure is safe
Check for slidingCoeffient of friction sigma H/net weight 0.30 Safe
Less than 2/3rs (0.67 )as such it is safe against sliding.Force details vertical horizont
al
lever moment
W0 ht of water above dam (h*T*1)W 1.11 0.45 T/2 0.50
W1 concrete on the dam (T(D1)*1*C 0.20 0.45 T/2 0.09
W2 Dam weight on the rect.side(
H*T*1*M
5.21 0.45 T/2 2.35
W3 Dam weight on the angle.side( 0.5
(B-T)H*1*M
3.62 0.60 T+(B-T)/3 2.18
W4 Foundation concrete(B*d2*1*C) 1.45 1.08 B/2 1.57
W5 weight of water on the dam( 0.5 (B-
T)H*1*W
1.51 0.60 T+(B-T)/3 0.91
P1 2.17 1.20 H/2 2.60
11.99 2.17 9.70
VI Uplift (100%) 7.34 1.08 B/2 7.93
VI uplit(50%) 3.67 1.08 B/2 3.97
V2 Uplift (100%) 1.33 0.72 B/3 0.96
V2 uplit(50%) 0.66 0.72 B/3 0.48
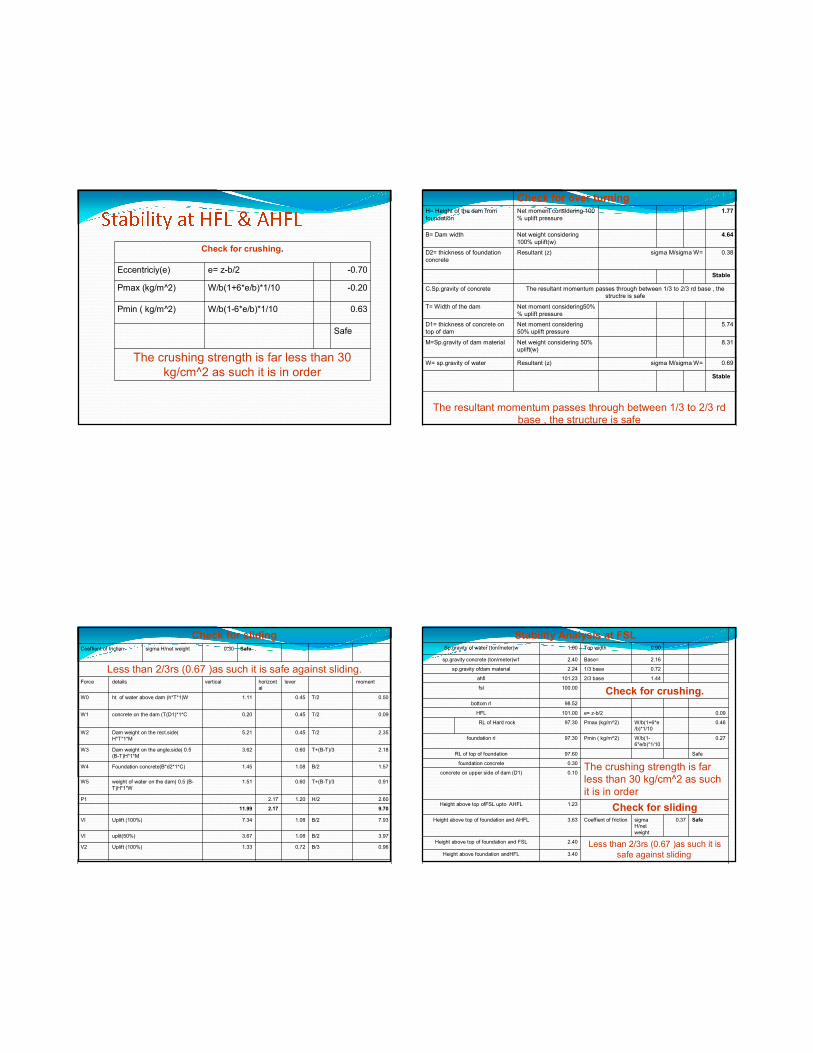
Stability Analysis at FSLSp.gravity of water (ton/meter)w 1.00 Top width 0.90
sp.gravity concrete (ton/meter)w1 2.40 Base= 2.16
sp.gravity ofdam material 2.24 1/3 base 0.72
ahfl 101.23 2/3 base 1.44
fsl 100.00Check for crushing.
bottom rl 98.52
HFL 101.00 e= z-b/2 0.09
RL of Hard rock 97.30 Pmax (kg/m^2) W/b(1+6*e
/b)*1/10
0.46
foundation rl 97.30 Pmin ( kg/m^2) W/b(1-
6*e/b)*1/10
0.27
RL of top of foundation 97.60 Safe
foundation concrete 0.30The crushing strength is far
less than 30 kg/cm^2 as such
it is in order
concrete on upper side of dam (D1) 0.10
Height above top ofFSL upto AHFL 1.23Check for sliding
Height above top of foundation and AHFL 3.63 Coeffient of friction sigma
H/net
weight
0.37 Safe
Height above top of foundation and FSL 2.40 Less than 2/3rs (0.67 )as such it is
safe against sliding.Height above foundation andHFL 3.40

For
ce
details vertical horizontal lever moment
W1 concrete on the dam (T(D1)*1*C 0.20 0.45 T/2 0.09
W2 Dam weight on the rect.side( H*T*1*M 5.21 0.45 T/2 2.35
W3 Dam weight on the angle.side( 0.5 (B-
T)H*1*M
3.62 1.32 T+(B-
T)/3
4.78
W4 Foundation concrete(B*d2*1*C) 1.45 1.08 B/2 1.57
P1 2.88 0.80 H/3 2.30
10.48 2.88 11.10
VI Uplift (100%) 2.59 0.72 B/3 1.87
VI uplit(50%) 1.30 0.72 B/3 0.93
Check for over turningH= Height of the dam from foundation Net moment considering 100 % uplift pressure 9.23
B= Dam width Net weight considering 100% uplift(w) 7.89
D2= thickness of foundation concrete Resultant (z) sigma M/sigma W= 1.17
Stable
C.Sp.gravity of concrete The resultant momentum passes through between 1/3 to 2/3 rd base , the structre
is safe
T= Width of the dam Net moment considering50% % uplift pressure
D1= thickness of concrete on top of
dam
Net moment considering 50% uplift pressure 10.17
M=Sp.gravity of dam material Net weight considering 50% uplift(w) 9.18
W= sp.gravity of water Resultant (z) sigma M/sigma W= 1.11
The resultant momentum passes through between 1/3 to 2/3 rd base , the structre is
safe
Summary of estimates
Qty Unit Item Rate per Amount (
Rs)
Item1:Excavation in all sorts of soils
614.32 cum soil 29.00 cum 17815.26
429.16 cum soft rock 70.00 cum 30041.17
143.05 cum hard rock 125.00 cum 17881.65
Item 2: PCC
93.38 cum PCC 1:3:6 1208.00 cum 112798.88
99.32 cum PCC 1:5 870.00 cum 86406.51
501.54cum
PCC 1:2:4 1509.00cum 756823.33
Item 3:Drilling of bores 50mm dia 1 m length
303.00 no No of holes 60.00 no 18180.00
Item 4: Providing and fixisng in position mild steel
7.36 qtls Providing and
fixisng in position
mild steel
2070.00 qtls 15241.20
Item 5: Back filling
172.50 cum Back filling 15.00 cum 2587.50
Total 1057775.50
3 % for contingencies and work
charge estt. & tools
31733.26
Grand total 1089508.76
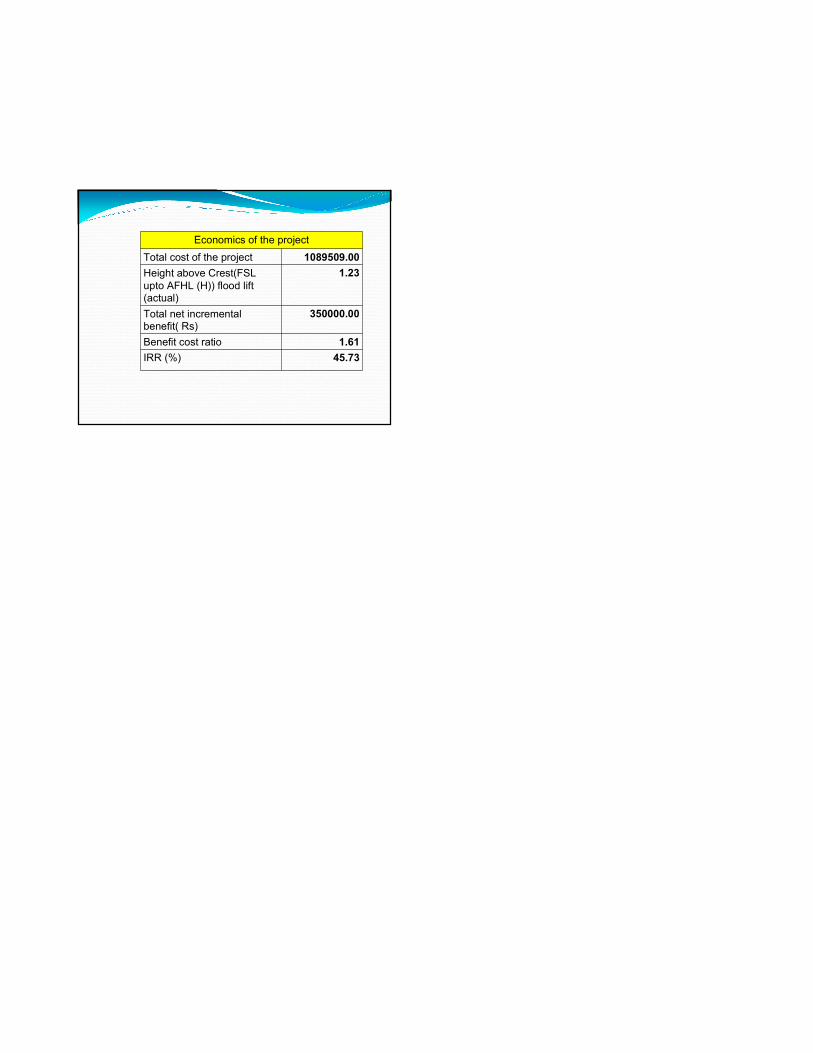
Economics of the project
Total cost of the project 1089509.00
Height above Crest(FSL
upto AFHL (H)) flood lift (actual)
1.23
Total net incremental benefit( Rs)
350000.00
Benefit cost ratio 1.61
IRR (%) 45.73