Embed Size (px)
Citation preview

Guide to Using Smart Network Analyzer Page 1 of 21
Guide to Using Smart Network Analyzer
Tips for Entering Survey Data Online and Network Mapping
February 2011
Prepared by
Amy Tucker, Department of Geography, Memorial University

Guide to Using Smart Network Analyzer Page 2 of 21
Introduction
The following guide to entering surveys online and using social network
analyzer software was constructed over the course of the Network Weaving for Regional Development on the Tip of the Northern Peninsula project. This
document serves as a guide for community residents, community/regional organizations, and government representatives who are using smart network
analyzer to examine social networks. The guide consists of twelve steps and concludes with a few helpful hints.
For further information on the Network Weaving project visit
http://networkweavinggnp.wordpress.com.
Step 1: Create list of survey respondents
Create a list of people you would like to survey (our final list had 265
people)
Every respondent will see the names of everyone else when they take the survey
Make the list in excel with 3 columns:
o Name (first then last)
o Organization
o Region
Make sure that the regions are in the order you want them to appear
in the survey
They automatically appear in alphabetical order in the software, but if
you want them to appear differently you have to put A,B,C etc. ahead of them
For example, we wanted regional to be first so we called it A. Regional,
then we wanted external to be second so we called it B. External, and so on
Make sure there are no commas and save it as a CSV file
Guide to Using Smart Network Analyzer Page 3 of 21
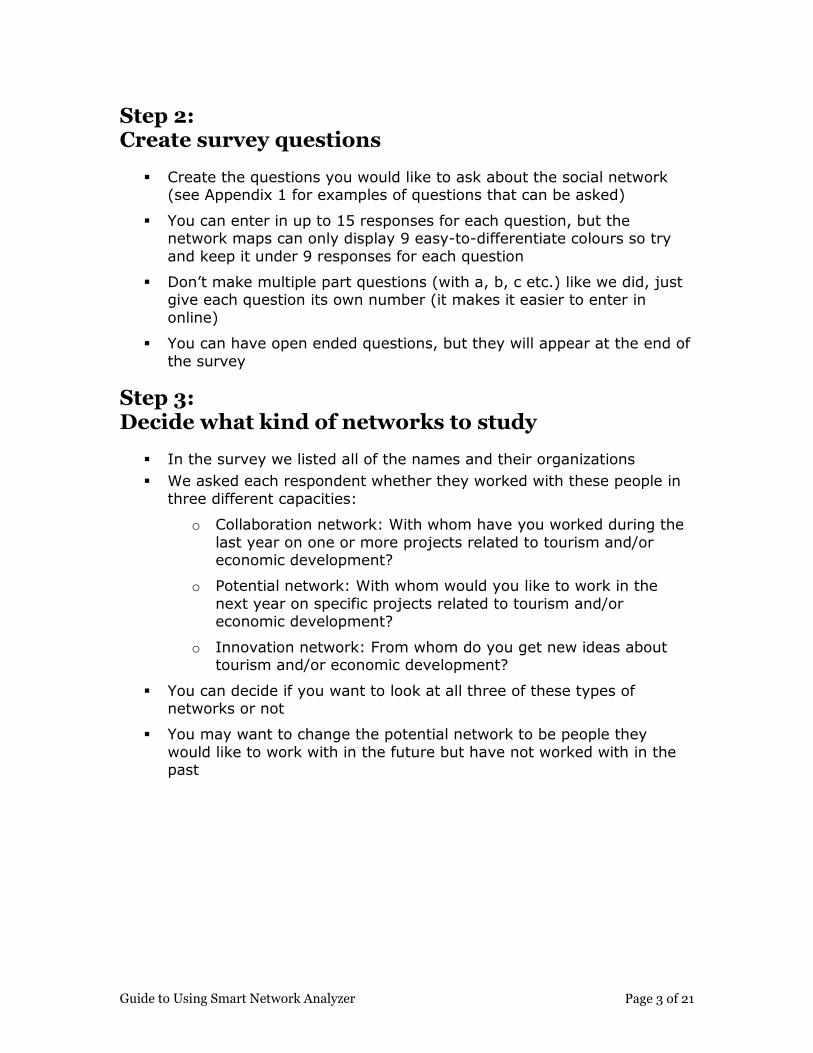
Step 2: Create survey questions
Create the questions you would like to ask about the social network (see Appendix 1 for examples of questions that can be asked)
You can enter in up to 15 responses for each question, but the network maps can only display 9 easy-to-differentiate colours so try
and keep it under 9 responses for each question
Don’t make multiple part questions (with a, b, c etc.) like we did, just give each question its own number (it makes it easier to enter in
online)
You can have open ended questions, but they will appear at the end of
the survey
Step 3: Decide what kind of networks to study
In the survey we listed all of the names and their organizations
We asked each respondent whether they worked with these people in
three different capacities:
o Collaboration network: With whom have you worked during the
last year on one or more projects related to tourism and/or economic development?
o Potential network: With whom would you like to work in the
next year on specific projects related to tourism and/or economic development?
o Innovation network: From whom do you get new ideas about tourism and/or economic development?
You can decide if you want to look at all three of these types of networks or not
You may want to change the potential network to be people they
would like to work with in the future but have not worked with in the past
Guide to Using Smart Network Analyzer Page 4 of 21
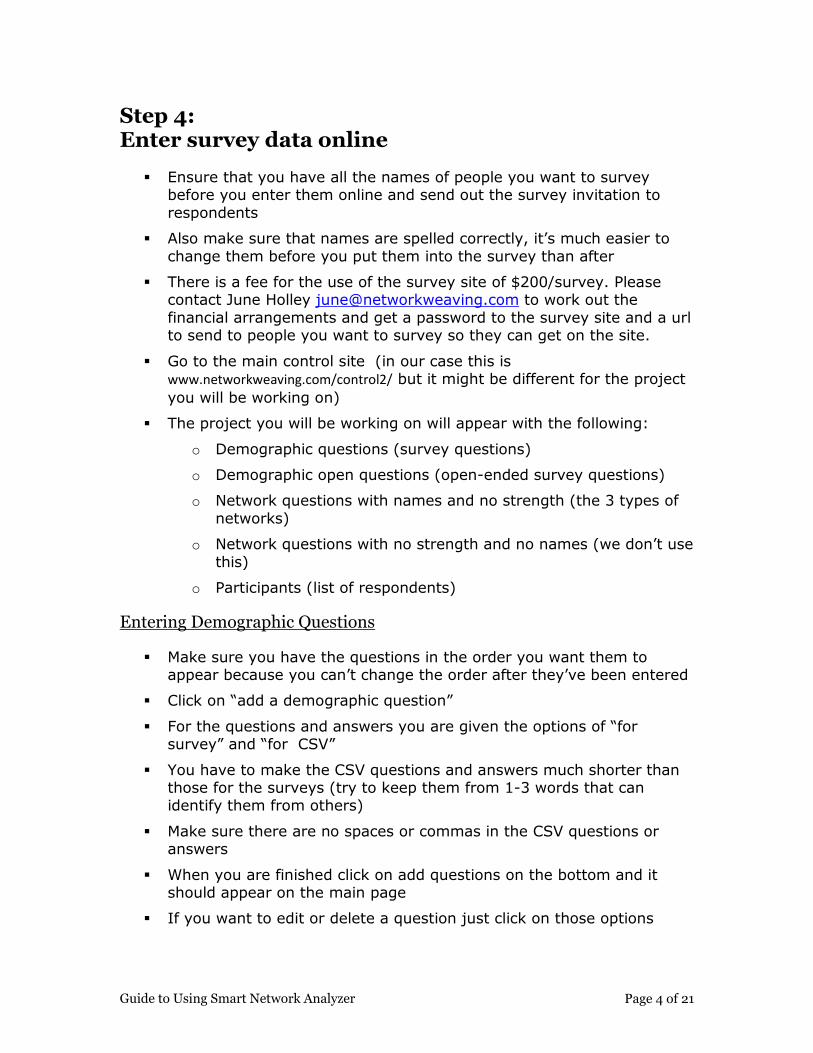
Step 4: Enter survey data online
Ensure that you have all the names of people you want to survey before you enter them online and send out the survey invitation to
respondents
Also make sure that names are spelled correctly, it’s much easier to
change them before you put them into the survey than after
There is a fee for the use of the survey site of $200/survey. Please contact June Holley [email protected] to work out the
financial arrangements and get a password to the survey site and a url to send to people you want to survey so they can get on the site.
Go to the main control site (in our case this is www.networkweaving.com/control2/ but it might be different for the project
you will be working on)
The project you will be working on will appear with the following:
o Demographic questions (survey questions)
o Demographic open questions (open-ended survey questions)
o Network questions with names and no strength (the 3 types of
networks)
o Network questions with no strength and no names (we don’t use
this)
o Participants (list of respondents)
Entering Demographic Questions
Make sure you have the questions in the order you want them to appear because you can’t change the order after they’ve been entered
Click on “add a demographic question”
For the questions and answers you are given the options of “for survey” and “for CSV”
You have to make the CSV questions and answers much shorter than those for the surveys (try to keep them from 1-3 words that can identify them from others)
Make sure there are no spaces or commas in the CSV questions or answers
When you are finished click on add questions on the bottom and it should appear on the main page
If you want to edit or delete a question just click on those options

Guide to Using Smart Network Analyzer Page 5 of 21
To make an “other” option where respondents can enter their own answer, you need to write in BLANK for the survey answer and BLANK
for the CSV answer
If you want to make a word in one of the survey questions bold you
write in <b> before the word and </b> after the word
Entering demographic open questions
Click on "add a open demographic question”
You are limited to 255 words for the question
If there is only one answer and the person isn’t going to be listing things, then you might want to say something like “In the first box,
please indicate…”
This is because they are given 15 spaces to answer the question and if
there is only one answer they should put it in the first space
For example, we asked “Please specify your hometown in the first box” but for the next question we asked “Please list each of the
organizations you are involved in”
Entering network questions
Click on “add a network question”
This is the three questions for the three types of networks (collaboration, potential and innovation networks)
Put in the question for the survey as well as a shorter version for the
CSV
Do not click on “do not add participant names to this question”
Entering survey respondents
Click on “add participants”
Go to the bottom where it has the option to browse and upload
participants
Browse to the CSV file you created with the names of the survey respondents, double click and upload
The names should appear on the survey
Even if you are not going to be filling out the survey, you will have to
enter your own name and information in with the survey respondents to be able to see the survey later

Guide to Using Smart Network Analyzer Page 6 of 21
Step 5: Edit the project information
When people go to do the survey they will see it in a different website, for us this was at http://www.networkweaving.com/projects2/start.cfm?id=79 for
local participants and http://www.networkweaving.com/projects2/start.cfm?id=83
for external participants but you will get a new address for your survey.
You need to enter the information about the project and survey into the correct website for the correct survey
In the control website, on the top click on “edit project”
This is where you can edit the project name, type (ours was without strength), the end date of the survey, the intro text (which we used to
describe the survey and provide ethical information), the end text (which we used to thank respondents for participating) and the
redirect URL (which we didn’t use)
Don’t change the settings in the next part “for surveys using network strength qualifiers”
Click on “update project”
When you go to the website that the respondents will be using you
should see these changes
If you want to check on how the questions look to respondents, go to the website that they will be using to enter their survey responses and
enter your name and email address
Step 6: Administer the survey
Contact the people listed on the survey through phone and/or email
and ask them to participate in the survey
Provide them with the link for the survey so they can complete it online themselves
Alternately, someone working with the project can administer the survey in person and then enter the information online
If this is done, the worker entering the information must sign into the survey as if they were the person who completed the survey (they must have their email address)
Guide to Using Smart Network Analyzer Page 7 of 21
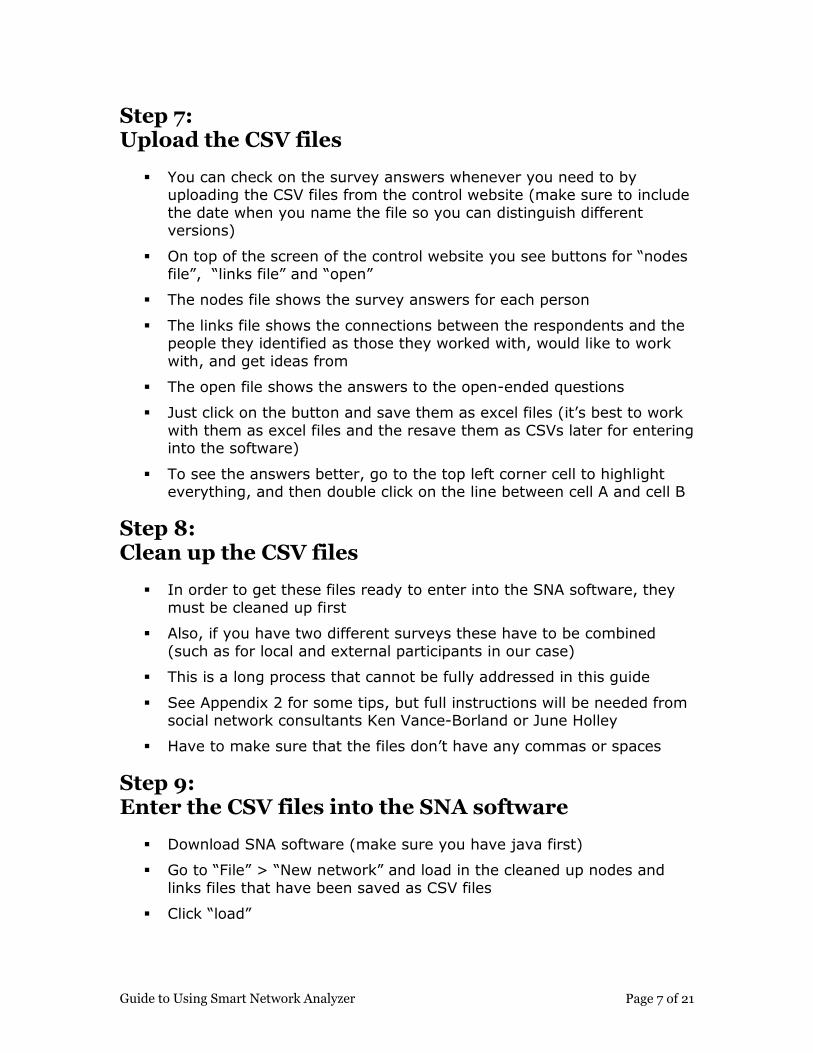
Step 7: Upload the CSV files
You can check on the survey answers whenever you need to by uploading the CSV files from the control website (make sure to include
the date when you name the file so you can distinguish different versions)
On top of the screen of the control website you see buttons for “nodes file”, “links file” and “open”
The nodes file shows the survey answers for each person
The links file shows the connections between the respondents and the people they identified as those they worked with, would like to work
with, and get ideas from
The open file shows the answers to the open-ended questions
Just click on the button and save them as excel files (it’s best to work
with them as excel files and the resave them as CSVs later for entering into the software)
To see the answers better, go to the top left corner cell to highlight everything, and then double click on the line between cell A and cell B
Step 8: Clean up the CSV files
In order to get these files ready to enter into the SNA software, they
must be cleaned up first
Also, if you have two different surveys these have to be combined
(such as for local and external participants in our case)
This is a long process that cannot be fully addressed in this guide
See Appendix 2 for some tips, but full instructions will be needed from social network consultants Ken Vance-Borland or June Holley
Have to make sure that the files don’t have any commas or spaces
Step 9: Enter the CSV files into the SNA software
Download SNA software (make sure you have java first)
Go to “File” > “New network” and load in the cleaned up nodes and
links files that have been saved as CSV files
Click “load”

Guide to Using Smart Network Analyzer Page 8 of 21
When it says “network loaded successfully” in the box then you click on “finish”
Step 10: Create maps
What you see is every name that was entered in to be a respondent, whether they completed the survey or not
You also see how these people are connected (whether they worked on past projects, would like to work on projects in the future, or get ideas from people) which is shown as lines on the map
It takes a few minutes for it to organize itself because there are so many names and connections
When you click on a node it shows all the information for that person
Select visible objects: Nodes
The options on the left allow you to do different things with the data
The drawing tab allows you to create maps while the metrics tab allows you to analyze what is in the maps
Under “select visible objects” you can see “nodes”, when you click on
the circle next to it you can then see all of the survey questions
Then if you click on the circle next to those you can see all of the
answers to those questions
For example, if you click on nodes, then sector affiliation you will then see all of the sectors that people could have said they were involved
with
If you uncheck all of them and leave only one, fisheries for example,
and then click apply you will see only the people involved with the fisheries sector
You should also click on “auto layout” and “fit to screen” after
changing anything so that you can see the proper configuration of the network
You can combine different questions and answers to get an almost infinite number of possible maps
Select visible objects: Links
Click on the circle next to “Links”
If you click on the circle next to “Network” you can see future projects, ideas, and past projects, which are our three networks

Guide to Using Smart Network Analyzer Page 9 of 21
If you uncheck the ideas and past projects, you will only see who has worked together on projects in the past (collaboration network)
If you uncheck the future projects and past projects, you will only see which people said they get ideas from others and the people they get
ideas from (innovation network)
If you uncheck ideas and past projects, you will see which people said they would like to work with people in the future and who they would
like to work with (potential network)
Set look and feel: Nodes
You can decide what you want to label the nodes with (the person’s
name, age, sector affiliation, etc.)
Click on the circle next to “Name”, and in the dropdown menu next to
“Source” you choose what you want to label the nodes with
You can also decide how you want the nodes to be coloured (by region, sector, etc.)
Click on the circle next to “Fill color”, and in the dropdown menu next to “Source” you choose how you want the nodes coloured
I haven’t used border colour, shape, or anything under links but I’m sure it’s straightforward
Step 11: Save maps
Make sure you’ve clicked on “Auto layout” and “Fit to screen”
Sometimes after you click on “Fit to screen” a node or a label can still be left out, so make sure everything is inside the frame because it
saves the way you see it
You can zoom in and out to make sure everything is in
You also want to make sure that any node labels aren’t overlapping,
you can just click on the nodes and move them slightly if you have to
Click on “File” > “Save image as”, and then browse to where you want
to save it
Make sure you label it well because you might be making a lot of maps
Then click on save
If you want it to be better quality (which might happen with a bigger map if you want to present it) as you’re saving it you should click on
custom size and change the width to 2500 and then click on the height so it automatically adjusts

Guide to Using Smart Network Analyzer Page 10 of 21
You might want to put the map into a PowerPoint for easy future reference and if you want to present it
I open the saved image in Microsoft office picture manager, then I like to crop it because there if often a lot of white space that takes up too
much space in a PowerPoint slide
Click on “edit pictures” then “crop” in the right menu
Then resave the image and copy in into a PowerPoint slide
There is no legend provided through the SNA software, so you have to make the legend yourself
Remember that when you click on a node it shows all of the information for that person
You have to look at how you defined the node colour (for example by
region) and then click on a node of each of the different colours that appears in the map and see what region each colour represents
Then fill in the legend template accordingly
Step 12: Complete metrics
You can run metrics on any of the maps you create by clicking on the metrics tab
Click on the metric you want to use and click on run
Shows the people with the highest to lowest scores plus the mean,
median and mode
There are numerous metrics but I’ve only used a few
To make the metrics for “worked with”, “innovation”, “future” or “total” you have to make the map using only the network(s) you want under “select visible objects” >“links”
Put the top 10 people into the network metrics template (Appendix 3)
Can do this for the network as a whole or just for specific questions of
interest
Awareness
o Worked with: Worked with many people who also worked with many others
o Innovation: Look to many well-connected innovators; innovation seeker
o Future: They are eager to work w well connected others
o Total: Likely to be aware of what is happening in the network: check in with
Connector
Guide to Using Smart Network Analyzer Page 11 of 21
o Worked with: Their collaboration links across orgs o Innovation: Their innovation links the network
o Future: Their collaboration could link across orgs in future o Total: If they work with those they choose, will connect network
Influence o Worked with: Many people say they worked with them;
collabortion hubs
o Innovation: People look to them for innovation o Future: Many people say they want to work with them
o Total: People want to work with them Integration
o Worked with: Well positioned for collaboration
o Innovation: In the middle of innovation o Future: Well-positioned for future collaboration
o Well-positioned for future leadership
Helpful tips
If someone entered the survey information online themselves and you want to know their email address, right click on their name in the control website and click “copy shortcut” and when you paste it you
get their address
You can also get email addresses from the CSV files for the open-
ended demographic questions
Don’t reopen anyone’s surveys unless you know what email address was used to enter their answers in or you won’t be able to close the
survey again
If you are organizing people into regions and then also asking them
what region they live in, be cognizant of the fact that these may not match up (especially if you have overall “regional” people)
As you’re creating your final CSV files, enter in an extra column next
to people’s names for a number so that you can display the nodes with numbers if it isn’t appropriate to show names
If you’re running the awareness metric and are looking for the mean, do not include people who did not take the survey in this calculation
You are not able to edit the introductions for sections 1 and 2 in the
survey, they were generated by the people who made the software

Guide to Using Smart Network Analyzer Page 12 of 21
Appendix 1: Survey
Tip of the Northern Peninsula Tourism and Natural Resources Survey
SECTION ONE – REGIONAL DEVELOPMENT AND DEMOGRAPHICS Name: _______________________________ Hometown: ___________________________________ Please list each of the organizations you are involved in or affiliated with and your position:
Organization Position
Please check ONE answer to each of the following questions unless otherwise stated. 1. In which sub-region is your community located? Goose Cove East – North Boat Harbour Main Brook – Englee Eddies Cove – Anchor Point St. Barbe – River of Ponds I live in Newfoundland & Labrador but not in this region I live in Canada but outside Newfoundland & Labrador I live outside of Canada
2. Which of the following sectors are you most affiliated with? Fisheries (including fish processing) Forestry Tourism Other ______________________________________ 3. How familiar are you with using social networking tools (i.e. Facebook, Twitter, Blogs, etc.)? I do not know what you mean I regularly use these tools for work and/or volunteer purposes I sometimes use these tools for work and/or volunteer purposes I am familiar with these tools but rarely use them for work and/or volunteer purposes I am familiar with these tools but never use them for work and/or volunteer purposes 4. How much do you personally initiate collaboration initiatives? I feel I always initiate network building and collaboration I sometimes initiate network building and collaboration I seldom initiate network building and collaboration I never initiate network building and collaboration Do not know
Guide to Using Smart Network Analyzer Page 13 of 21
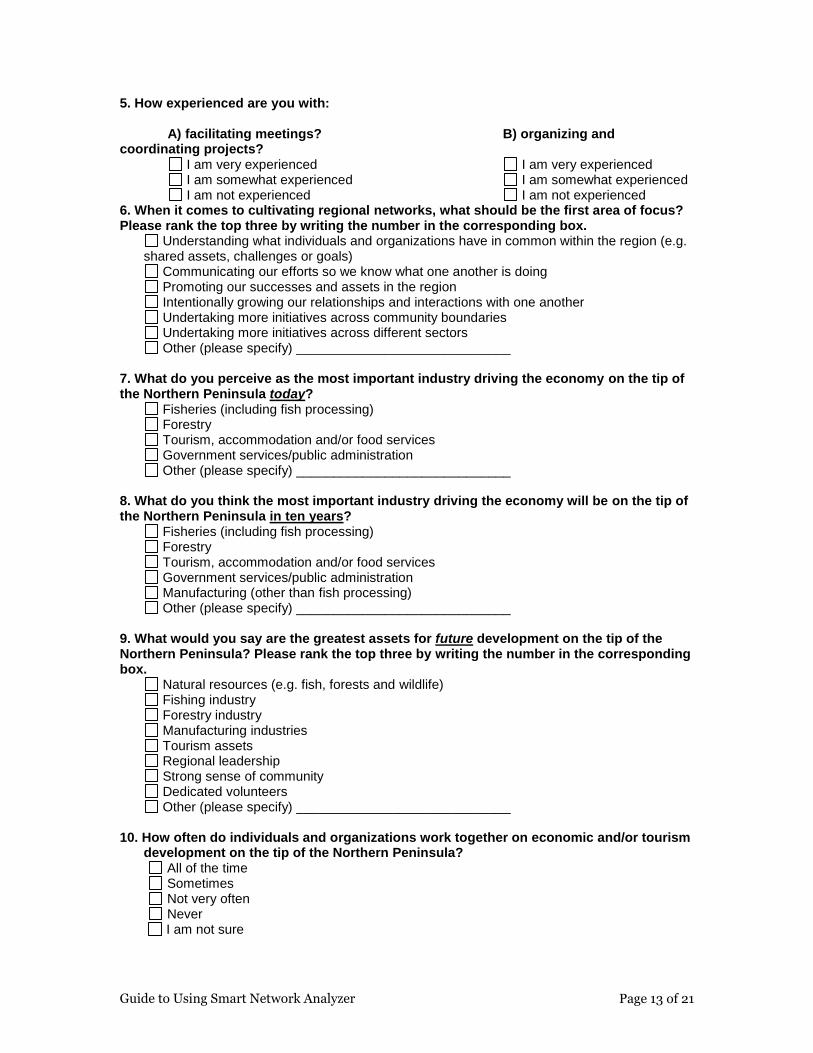
5. How experienced are you with: A) facilitating meetings? B) organizing and coordinating projects? I am very experienced I am very experienced I am somewhat experienced I am somewhat experienced I am not experienced I am not experienced 6. When it comes to cultivating regional networks, what should be the first area of focus? Please rank the top three by writing the number in the corresponding box.
Understanding what individuals and organizations have in common within the region (e.g. shared assets, challenges or goals)
Communicating our efforts so we know what one another is doing Promoting our successes and assets in the region Intentionally growing our relationships and interactions with one another Undertaking more initiatives across community boundaries Undertaking more initiatives across different sectors Other (please specify) _____________________________
7. What do you perceive as the most important industry driving the economy on the tip of the Northern Peninsula today?
Fisheries (including fish processing) Forestry Tourism, accommodation and/or food services Government services/public administration Other (please specify) _____________________________
8. What do you think the most important industry driving the economy will be on the tip of the Northern Peninsula in ten years?
Fisheries (including fish processing) Forestry Tourism, accommodation and/or food services Government services/public administration Manufacturing (other than fish processing) Other (please specify) _____________________________
9. What would you say are the greatest assets for future development on the tip of the Northern Peninsula? Please rank the top three by writing the number in the corresponding box.
Natural resources (e.g. fish, forests and wildlife) Fishing industry Forestry industry Manufacturing industries Tourism assets Regional leadership Strong sense of community Dedicated volunteers Other (please specify) _____________________________
10. How often do individuals and organizations work together on economic and/or tourism
development on the tip of the Northern Peninsula? All of the time Sometimes Not very often Never
I am not sure

Guide to Using Smart Network Analyzer Page 14 of 21
11. Which best describes your past involvement with: A) economic development planning and initiatives?
Very involved Somewhat involved Only very occasionally involved Not involved
B) education and/or research initiatives?
Very involved Somewhat involved Only very occasionally involved Not involved
C) tourism planning and initiatives?
Very involved Somewhat involved Only very occasionally involved Not involved
D) natural resources management and/or conservation initiatives?
Very involved Somewhat involved Only very occasionally involved Not involved
12. How aware are you of research projects or initiatives on the tip of the Northern Peninsula?
I am not aware of any research project or initiatives I have heard a little about such initiatives I am very aware of research initiatives I am directly involved as a leader in such efforts I am not sure
13. How aware are you of efforts:
A) to improve the economy on the tip of the Northern Peninsula?
I am not aware of any efforts I have heard a little about such efforts I am very aware of economic development efforts I am directly involved as a leader in such efforts I am not sure
B) to improve the tourism sector on the tip of the Northern Peninsula?
I am not aware of any efforts I have heard a little about such efforts I am very aware of these efforts I am directly involved as a leader in such efforts I am not sure
Guide to Using Smart Network Analyzer Page 15 of 21
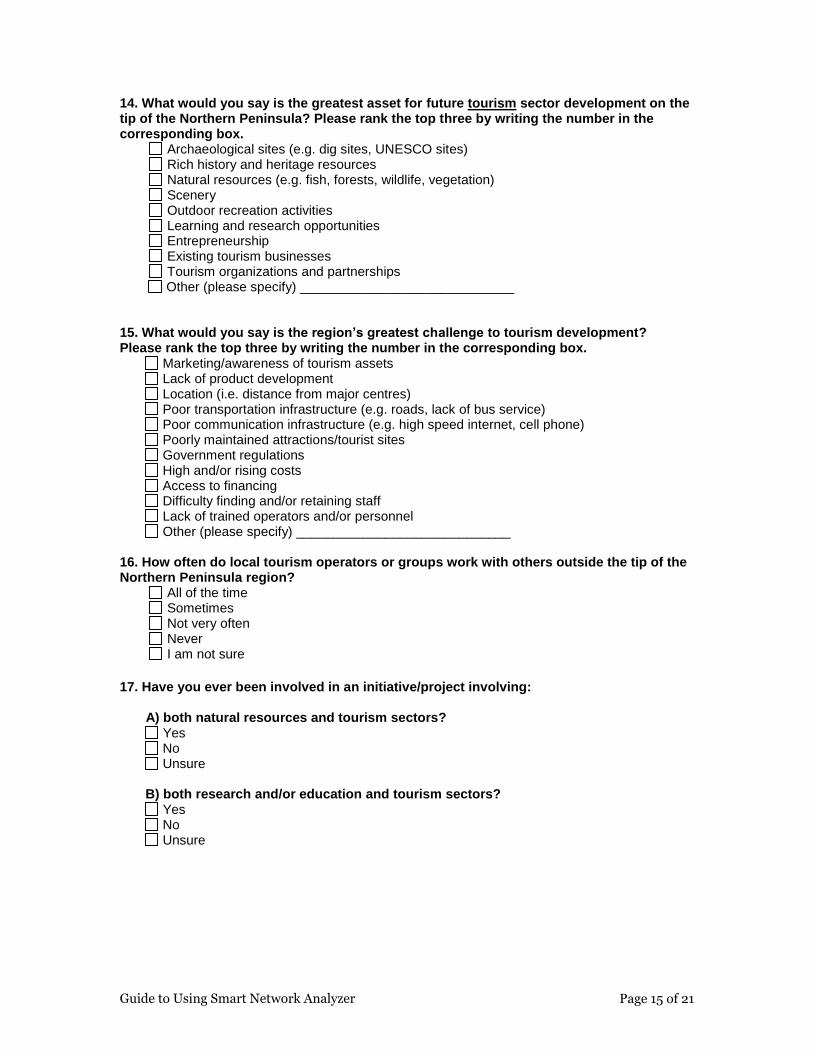
14. What would you say is the greatest asset for future tourism sector development on the tip of the Northern Peninsula? Please rank the top three by writing the number in the corresponding box.
Archaeological sites (e.g. dig sites, UNESCO sites) Rich history and heritage resources Natural resources (e.g. fish, forests, wildlife, vegetation) Scenery Outdoor recreation activities Learning and research opportunities Entrepreneurship Existing tourism businesses Tourism organizations and partnerships
Other (please specify) _____________________________ 15. What would you say is the region’s greatest challenge to tourism development? Please rank the top three by writing the number in the corresponding box.
Marketing/awareness of tourism assets Lack of product development Location (i.e. distance from major centres) Poor transportation infrastructure (e.g. roads, lack of bus service) Poor communication infrastructure (e.g. high speed internet, cell phone) Poorly maintained attractions/tourist sites Government regulations High and/or rising costs Access to financing Difficulty finding and/or retaining staff Lack of trained operators and/or personnel Other (please specify) _____________________________
16. How often do local tourism operators or groups work with others outside the tip of the Northern Peninsula region?
All of the time Sometimes Not very often Never I am not sure
17. Have you ever been involved in an initiative/project involving: A) both natural resources and tourism sectors?
Yes No Unsure
B) both research and/or education and tourism sectors?
Yes No Unsure
Guide to Using Smart Network Analyzer Page 16 of 21
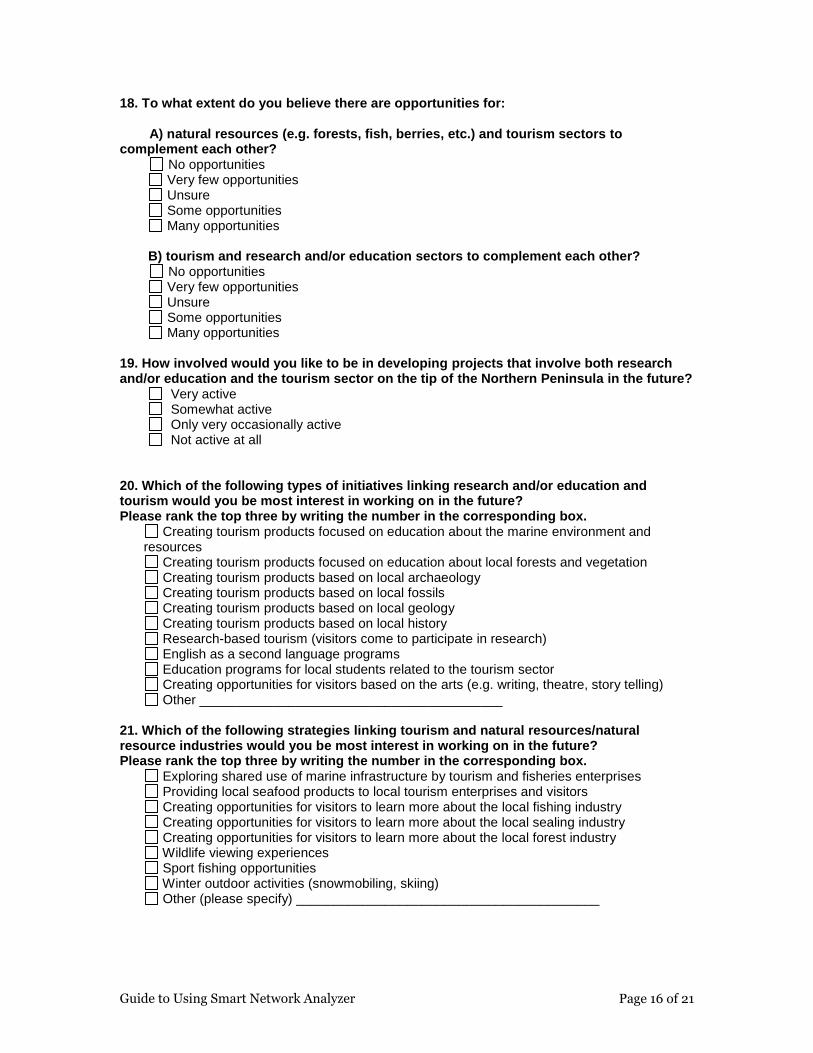
18. To what extent do you believe there are opportunities for: A) natural resources (e.g. forests, fish, berries, etc.) and tourism sectors to complement each other? No opportunities
Very few opportunities Unsure Some opportunities Many opportunities
B) tourism and research and/or education sectors to complement each other?
No opportunities Very few opportunities Unsure Some opportunities Many opportunities
19. How involved would you like to be in developing projects that involve both research and/or education and the tourism sector on the tip of the Northern Peninsula in the future?
Very active Somewhat active Only very occasionally active Not active at all
20. Which of the following types of initiatives linking research and/or education and tourism would you be most interest in working on in the future? Please rank the top three by writing the number in the corresponding box.
Creating tourism products focused on education about the marine environment and resources
Creating tourism products focused on education about local forests and vegetation Creating tourism products based on local archaeology Creating tourism products based on local fossils Creating tourism products based on local geology Creating tourism products based on local history Research-based tourism (visitors come to participate in research) English as a second language programs Education programs for local students related to the tourism sector Creating opportunities for visitors based on the arts (e.g. writing, theatre, story telling) Other _________________________________________
21. Which of the following strategies linking tourism and natural resources/natural resource industries would you be most interest in working on in the future? Please rank the top three by writing the number in the corresponding box.
Exploring shared use of marine infrastructure by tourism and fisheries enterprises Providing local seafood products to local tourism enterprises and visitors Creating opportunities for visitors to learn more about the local fishing industry Creating opportunities for visitors to learn more about the local sealing industry Creating opportunities for visitors to learn more about the local forest industry Wildlife viewing experiences Sport fishing opportunities Winter outdoor activities (snowmobiling, skiing) Other (please specify) _________________________________________

Guide to Using Smart Network Analyzer Page 17 of 21
22. What activities would you be most interested in doing as an individual to support tourism development in the region? Please rank the top three by writing the number in the corresponding box.
Providing guided tours of my facility or a topic or area I am knowledgeable about Providing artistic entertainment for visitors Providing food for visitors (cooking or selling or volunteering food products) Advertising local tourism products in my business/organization’s office Connecting tourism operators in my region with contacts I have outside of the region Connecting tourism operators in my region with contacts I have within the region Joining with a group of others to help develop tourism opportunities Teaching people skills or knowledge that may be useful in the tourism industry Helping to create marketing materials or signage Helping to keep my community clean and attractive for visitors
Other (please specify) _________________________________________ 23. In your experience, how important is collaboration among individuals and community organizations to success in economic development and/or resource
conservation/management in your region? Very Important Somewhat important Not very important Not important at all I am not sure 24. What is your gender? Female Male 25. Which of the following ranges includes your age? 18 or under 35-49 19-24 50-64 25-34 65 or older
SECTION TWO – NETWORK QUESTIONS Read the question and then identify the individuals in the list that follows who fit that question. If the question DOES NOT include names of appropriate individuals, simply add these names in the blanks provided, including their organizational affiliation if known. We especially encourage you to list names of people outside your organization or community in this space.
Individual
Organizational Affiliation(s)
With whom have you worked during the last year on one or more projects related to tourism and/or economic development? PLEASE CHECK ALL THAT APPLY
With whom would you like to work in the next year on specific projects related to tourism and/or economic development? PLEASE CHECK ALL THAT APPLY
From whom do you get new ideas about tourism and/or economic development? PLEASE CHECK ALL THAT APPLY

Guide to Using Smart Network Analyzer Page 18 of 21
Appendix 2: Tips for cleaning up CSV files
Training call with Ken Vance-Borland taught me how to:
Clean up CSV files
Combine the local and external surveys
Steps
First had to upload nodes and links files from the network weaver website
Saved all documents as excel (as they are CSV files when they come off the website)
Named them accordingly (nodes_local_excel, nodes_external_excel
etc.)
Local Nodes File:
o The last few names were those who were entered by people and who did not take the survey (all answers were x’s except for name and organization)
o Because they did not take the survey, their organization and title information was not correct
o Column “C” (Organization) had to be entered as column “B” (Title) for these people and column “C” had to be filled in with x’s
o We also removed answers under column “A” (names) that weren’t names
o We changed the title of column “B” (Title) to be Organization
o We changed the title of column “C” (Organization) to be Region
o We sorted column “A” (names) from A to Z (making sure to click
on the box “my data has headers”)
o We searched for duplicate names within the local nodes file
(caused by someone entering in the name in the blank space not realizing they were listed already)
o If we found a duplicate name we would determine which one
was correct (the one that was entered into the survey) and deleted the other one
o If the name had been spelled incorrectly, we went to the local links excel file and changed it to the correct spelling
External Nodes File:
Guide to Using Smart Network Analyzer Page 19 of 21
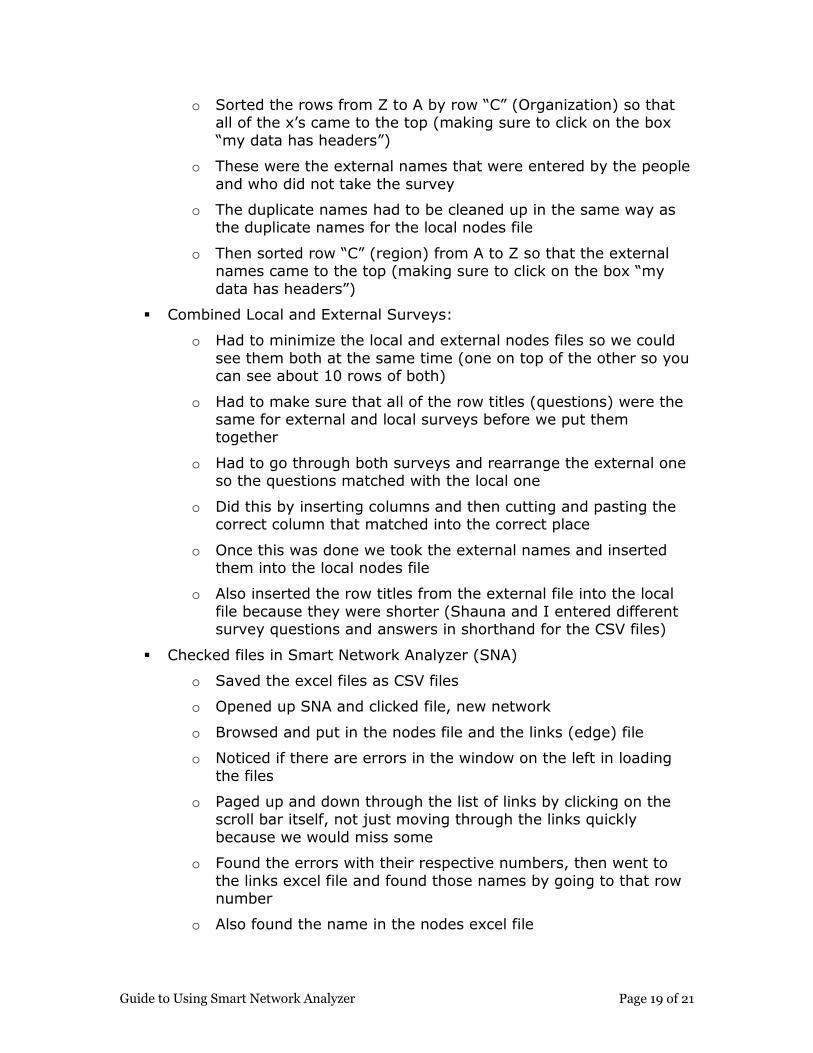
o Sorted the rows from Z to A by row “C” (Organization) so that all of the x’s came to the top (making sure to click on the box
“my data has headers”)
o These were the external names that were entered by the people
and who did not take the survey
o The duplicate names had to be cleaned up in the same way as the duplicate names for the local nodes file
o Then sorted row “C” (region) from A to Z so that the external names came to the top (making sure to click on the box “my
data has headers”)
Combined Local and External Surveys:
o Had to minimize the local and external nodes files so we could
see them both at the same time (one on top of the other so you can see about 10 rows of both)
o Had to make sure that all of the row titles (questions) were the same for external and local surveys before we put them together
o Had to go through both surveys and rearrange the external one so the questions matched with the local one
o Did this by inserting columns and then cutting and pasting the correct column that matched into the correct place
o Once this was done we took the external names and inserted them into the local nodes file
o Also inserted the row titles from the external file into the local
file because they were shorter (Shauna and I entered different survey questions and answers in shorthand for the CSV files)
Checked files in Smart Network Analyzer (SNA)
o Saved the excel files as CSV files
o Opened up SNA and clicked file, new network
o Browsed and put in the nodes file and the links (edge) file
o Noticed if there are errors in the window on the left in loading
the files
o Paged up and down through the list of links by clicking on the scroll bar itself, not just moving through the links quickly
because we would miss some
o Found the errors with their respective numbers, then went to
the links excel file and found those names by going to that row number
o Also found the name in the nodes excel file

Guide to Using Smart Network Analyzer Page 20 of 21
o If the they weren’t spelled the same then we changed one so they were the same
o If we couldn’t find the name in the links file we went to the nodes excel file and found it
o We copied and pasted the name into the links excel file and filled in the information with x’s (double click right corner to make the whole row x’s)
Made sure answers were the same
o Because we combined surveys that were entered by two
different people the shorthand versions of the questions and answers for the CSV files were different
o For the links file just had to make sure that “past projects”,
“future projects” and “ideas” were the same
o Found what Shauna had entered in and replaced it with what I
had entered in (using “find” and “replace” in excel)
o For the nodes file, searched for each answer that Shauna had entered and replaced it with what I had entered

Guide to Using Smart Network Analyzer Page 21 of 21
Appendix 3: Metrics Template