Embed Size (px)
Citation preview

Financial Literacy for Community Groups
Guide for Community Board Members.
Proudly supported by:


1
Contents.So you’re a Board member. 3
Broadly speaking . . . 4
A Note on Terms. 5
Financial Reports – what’s what? 6
1. Statement of Financial Position (Balance Sheet) 62. Statement of Financial Performance (Income and Expenditure Statement) 103. Cash Flow Statement 14
Cash Accounting or Accrual Accounting? The Board decides. 16
Cash Accounting 16Accrual Accounting 16Cash or Accrual – the choice 17
Why is it all necessary? Practical applications in planning. 18
Strategic Plan 18Business Plan 19Marketing Plan 20Fundraising Plan 21
Why is it all necessary? Practical applications in budgeting. 22
Annual Budget 22Project Budget 24Treasurer’s Report 26
Monitoring your progress using financial reporting. 26
Treasurer’s Report 26Outcome Reports 28
Troubleshooting. What to look for. 29
Financial Ratios: what are they? 291. Balance Sheet Ratios 29 Income to Expenditure 29 Assets to Liabilities 29 Debt to Equity 302. Asset Management Ratios: Efficiency 30 Beneficiaries Surplus to Income 30 Net Surplus Margin 30 Funding Streams 303. Asset Management Ratios: Productivity 31 Income per unit of output 31 Overhead per unit of output 32 Income to Assets 32 Employee Costs 324. Asset Management Ratios: Working Capital Cycle ratios 33 Financial Ratios: Analysis and Questions to ask 33 Financial Ratios: Policy Decisions 35
Last Word: What the Board has to do. 36
Glossary. 37

2
This Guide is the second in a series designed to help build the financial capacity of Australia’s 700,000 community groups and not-for-profit organisations.
More than 65% of Australians belong to at least one community group – these organisations are absolutely vital for the development of a thriving and vibrant Australia.
Together with its companion volumes, the Guide for Community Treasurers and the Guide to Investing Money for Community Organisations, this Guide is part of ongoing work by Westpac to make sure this important sector has ready access to the information it needs to operate effectively in our complex and changing financial environment.
Westpac Social Sector Banking.Westpac has been working with community organisations of all sizes for years — and whether it be local sports clubs, schools or national aged care facilities, we’ve learned that the demands and opportunities of the not-for-profit sector are both unique and diverse.
So we offer more than just banking. We are committed to:
• understanding your unique day-to-day financial workings and requirements • designing and innovating our products and services to align with your needs • providing specialist bankers, who are dedicated to servicing the not-for-profit sector • connecting you with the education, training, resources and other areas beyond just banking that will help strengthen your
organisation and achieve your long-term vision.
We want to provide you with the most beneficial banking partnership for your organisation.
For more information visit www.westpac.com.au/socialsectorbanking
The Guide for Community series.
3
What makes people become Board members of community organisations? Some have a personal experience with the cause, others have a particular area of expertise which they believe they can employ to achieve a better tomorrow.
So you’re a Board member.Whatever the reason, being a Board member is about more than just overseeing the day-to-day work of the organisation with which you’re involved – it’s about understanding how the organisation works, and making sure every dollar coming in is working it’s hardest to help you realise your organisation’s mission.
Although all Board members bring something special to the table, not all have in-depth accounting skills or experience being a Treasurer. The task therefore often falls to each individual to bring their understanding of finance up to scratch. That way, you will be better able to understand how your organisation operates, and make decisions which will help to enhance the work your group does every day in local communities.
This Guide recognises the important role Board members play in the lives of community groups and the influence they can have in ensuring the organisation survives and thrives. It is designed to help Board members of community organisations of all shapes and sizes to take on their role with greater knowledge and confidence – fully understanding the financial reports presented to them by their Treasurer.
“As Board members we often get presented with financial updates, year-end summaries and statements of financial position. Each is explained using financial jargon, and looking at a page of numbers with little capacity to understand the meaning behind the figures can result in the making of poor decisions.
By learning about how to read and understand the facts and figures presented in these reports, Board members will be equipped with more comprehensive knowledge on which they can base major decisions.”
Cameron Bisley, Board member, South Burnett Events Corporation Inc.
4
Among the things that you’re going to be called on to contribute to are your organisation’s arrangements for fundraising, marketing, and evaluation – all of which, of course, have financial implications.
Broadly speaking . . .Ultimately as a Board member you’re responsible for the decision-making in an organisation. You are legally accountable for the resources and activities of an organisation, and communicating its vision to the community. Any policy that you devise will define the guidelines under which the organisation will operate.
At the root of all of this is ‘finances’. How much comes in, how much goes out, where it goes and what is achieved by its expenditure. These fundamental things can make or break an organisation, yet often the way they are communicated can, for many Board members, be over complicated and easily misinterpreted.
This manual is intended to walk you through what you need to know about the financial side of being a Board member and to show you how to use the knowledge at hand to ensure the organisation is staying true to its objectives.
So, what exactly do you need to know?You don’t need to be an accountant to understand the finer points of an organisation’s accounting. Your job is not to produce these reports but to examine and assess this material once it is provided to you. You have to understand how it’s been put together, you have to know what the jargon means, and you have to know the implications of what’s in front of you.
With a small amount of knowledge of the basic elements of accounting, you will be armed with enough information to help you feel confident to weed your way through the financial documents which form part of your responsibilities.
Hence, this Guide.
Remember, as a member of the organisation, there may be times when you are the most ‘financially literate’ person at a meeting, so having some knowledge of the applicable accounting procedures and terminology will come in very handy.
Publications such as this one on financial management for not-for-profit Boards do sometimes tend to give the impression that financial management is what being a Board member is all about. It isn’t, of course. You’re volunteering your time to this cause because there are outcomes you wish to achieve and changes you want to see. It’s your work on these positive elements that is going to give you inner satisfaction, and it’s your work on achieving the mission that makes you a worthwhile asset to the organisation.

5
A Note on Terms.The not-for-profit sector operates in all Australian states and has to cope with several different legal formats. So, there are a number of terms used for things that essentially mean much the same thing. To make life easier, in this Guide we’ve used one set of names.
When we say ‘Board’ we mean ‘Board’ or‘Council’ or‘Committee of Management’
When we say ‘Board member’ we mean ‘Board member’ or‘Committee member’ or ‘Trustee’ or‘Director’
When we say ‘not-for-profit sector’
or ‘social sector’
we mean ‘not-for-profit sector’ or‘non-profit sector’ or‘community sector’ or‘third sector’ or‘voluntary sector’
When we say ‘not-for-profit organisation’ we mean ‘Incorporated Association’ or‘Company Limited by Guarantee’ or‘Cooperative’
When we say ‘Chief Executive Officer (CEO)’
we mean ‘CEO’ or‘Director’ or‘Manager’ or‘Executive Officer’
When we say ‘clients’ we mean ‘clients’ or‘customers’ or‘users’ or‘consumers’ or‘members’
We’ve tried to explain each term throughout. However there’s also a handy glossary at the end of this Guide if you need more technical explanations.
6
Financial Reports – what’s what?The easiest way to bring you up to speed with the accounting practices you will need for your not-for-profit organisation, is to introduce you to the financial reports you are likely to receive throughout the year. Rather than throw you in at the deep end to watch figures swim around a page, we’ve provided a simple list of the reports to look out for.
Later in the Guide, we’ll discuss why these reports are important and how they can be used to help you make decisions.
All your opinions on your organisation’s finances should be based on three core reports that between them contain most of the actual information you need to keep track of your money. They are:
1. Statement of Financial Position (Balance Sheet)
2. Statement of Financial Performance (Income and Expenditure Statements)
3. Cash Flow Statements.
Defining Financial Reports Financial reports come in many formats – any time you tell anyone how things are going money-wise that’s a Financial Report. Reports can be made to the public, to members, to governments, or to grantmakers, and all of these things may require different formats, with different points highlighted.
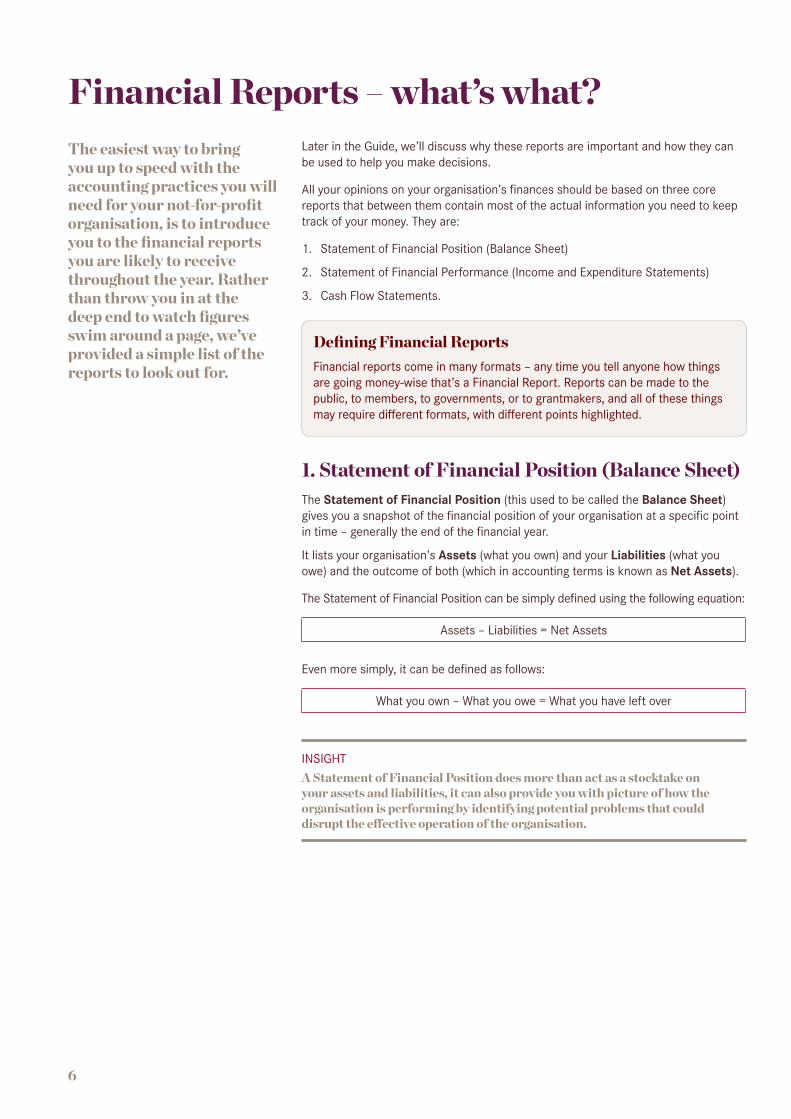
1. Statement of Financial Position (Balance Sheet)The Statement of Financial Position (this used to be called the Balance Sheet) gives you a snapshot of the financial position of your organisation at a specific point in time – generally the end of the financial year.
It lists your organisation’s Assets (what you own) and your Liabilities (what you owe) and the outcome of both (which in accounting terms is known as Net Assets).
The Statement of Financial Position can be simply defined using the following equation:
Assets – Liabilities = Net Assets
Even more simply, it can be defined as follows:
What you own – What you owe = What you have left over
INSIGHTA Statement of Financial Position does more than act as a stocktake on your assets and liabilities, it can also provide you with picture of how the organisation is performing by identifying potential problems that could disrupt the effective operation of the organisation.
7
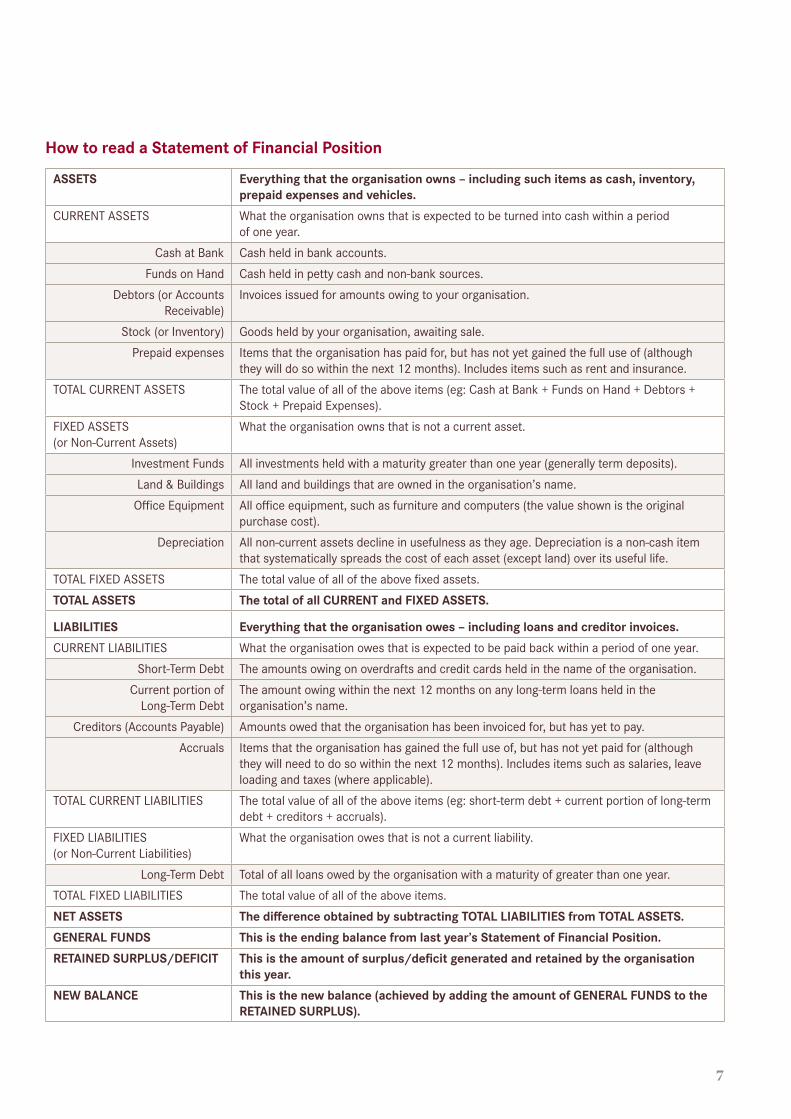
How to read a Statement of Financial Position
ASSETS Everything that the organisation owns – including such items as cash, inventory, prepaid expenses and vehicles.
CURRENT ASSETS What the organisation owns that is expected to be turned into cash within a period of one year.
Cash at Bank Cash held in bank accounts.
Funds on Hand Cash held in petty cash and non-bank sources.
Debtors (or Accounts Receivable)
Invoices issued for amounts owing to your organisation.
Stock (or Inventory) Goods held by your organisation, awaiting sale.
Prepaid expenses Items that the organisation has paid for, but has not yet gained the full use of (although they will do so within the next 12 months). Includes items such as rent and insurance.
TOTAL CURRENT ASSETS The total value of all of the above items (eg: Cash at Bank + Funds on Hand + Debtors + Stock + Prepaid Expenses).
FIXED ASSETS (or Non-Current Assets)
What the organisation owns that is not a current asset.
Investment Funds All investments held with a maturity greater than one year (generally term deposits).
Land & Buildings All land and buildings that are owned in the organisation’s name.
Office Equipment All office equipment, such as furniture and computers (the value shown is the original purchase cost).
Depreciation All non-current assets decline in usefulness as they age. Depreciation is a non-cash item that systematically spreads the cost of each asset (except land) over its useful life.
TOTAL FIXED ASSETS The total value of all of the above fixed assets.
TOTAL ASSETS The total of all CURRENT and FIXED ASSETS.
LIABILITIES Everything that the organisation owes – including loans and creditor invoices.CURRENT LIABILITIES What the organisation owes that is expected to be paid back within a period of one year.
Short-Term Debt The amounts owing on overdrafts and credit cards held in the name of the organisation.
Current portion of Long-Term Debt
The amount owing within the next 12 months on any long-term loans held in the organisation’s name.
Creditors (Accounts Payable) Amounts owed that the organisation has been invoiced for, but has yet to pay.
Accruals Items that the organisation has gained the full use of, but has not yet paid for (although they will need to do so within the next 12 months). Includes items such as salaries, leave loading and taxes (where applicable).
TOTAL CURRENT LIABILITIES The total value of all of the above items (eg: short-term debt + current portion of long-term debt + creditors + accruals).
FIXED LIABILITIES (or Non-Current Liabilities)
What the organisation owes that is not a current liability.
Long-Term Debt Total of all loans owed by the organisation with a maturity of greater than one year.
TOTAL FIXED LIABILITIES The total value of all of the above items.
NET ASSETS The difference obtained by subtracting TOTAL LIABILITIES from TOTAL ASSETS.GENERAL FUNDS This is the ending balance from last year’s Statement of Financial Position.RETAINED SURPLUS/DEFICIT This is the amount of surplus/deficit generated and retained by the organisation
this year.NEW BALANCE This is the new balance (achieved by adding the amount of GENERAL FUNDS to the
RETAINED SURPLUS).

8
Example Below is the Statement of Financial Position for a mid-sized not-for-profit – let’s call it the Walsh Street Centre. The organisation has built up a fund over the years to buy a property to work in. This year it has taken most of the money out of the bank, borrowed another $220,000, and made the purchase. Here’s what the Balance Sheet would tell us.
The Walsh Street Centre Statement of Financial PositionThis Year Last Year
ASSETSCurrent AssetsCash at bank 37,081 25,672 Debtors 8,279 9,655 Funds on hand 7,262 6,041
Total Current Assets 52,622 41,368Fixed AssetsInvestment funds (Term deposits) 75,000 365,000 Land & Buildings 510,000 0 Office equipment (at cost) 32,095 27,637 Less provision for depreciation 21,991 17,688 Equipment – Written-down value 10,104 10,104 9,949 9,949
Total Fixed Assets 595,104 374,949 TOTAL ASSETS 647,726 416,317LIABILITIESCurrent LiabilitiesCreditors 18,253 24,931
Total Current Liabilities 18,253 24,931Long-Term LiabilitiesProvision for Long Service Leave 61,041 54,363Long-Term Debt 220,000 0
Total Long-Term Liabilities 281,041 54,363TOTAL LIABILITIES 299,294 79,294NET ASSETS 348,432 337,023 GENERAL FUNDSBalance 1st July 337,023 327,200 Surplus for year 11,409 9,823 Balance 30th June 348,432 337,023
Total Assets – Total Liabilities = Balance
Note: Balance is also known as Net Assets or Equity.
INSIGHTMost financial records for not-for-profit organisations are now done on spreadsheets, which is an immense saving of time and effort. Available software ranges from the free, like OpenOffice, to the standard, like Microsoft Excel, to the professional, like MYOB (which has special modules for not-for-profits).
Ask your Treasurer to issue the accounts to the Board both in hard copy and as a spreadsheet, so that the Board members can, if they want to, check out the calculations that underlie the figures.
TipFinancial Reports – what’s what?(continued)
9
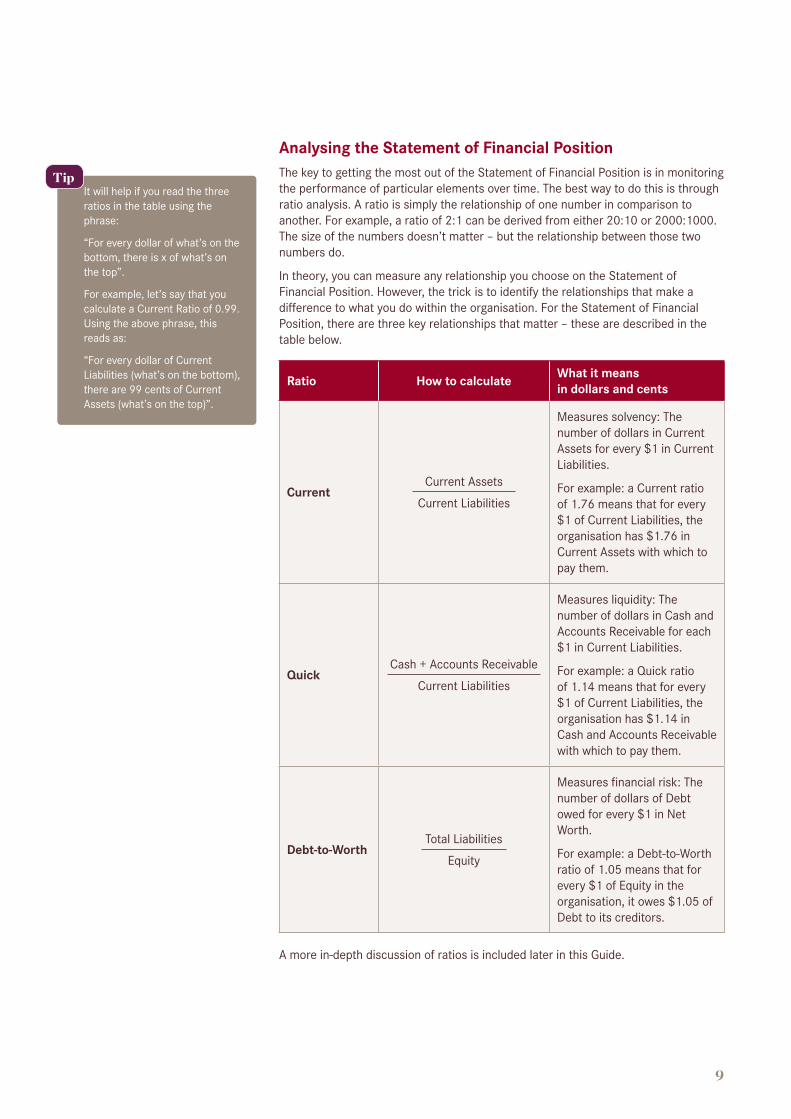
Analysing the Statement of Financial Position The key to getting the most out of the Statement of Financial Position is in monitoring the performance of particular elements over time. The best way to do this is through ratio analysis. A ratio is simply the relationship of one number in comparison to another. For example, a ratio of 2:1 can be derived from either 20:10 or 2000:1000. The size of the numbers doesn’t matter – but the relationship between those two numbers do.
In theory, you can measure any relationship you choose on the Statement of Financial Position. However, the trick is to identify the relationships that make a difference to what you do within the organisation. For the Statement of Financial Position, there are three key relationships that matter – these are described in the table below.
Ratio How to calculate What it means in dollars and cents
CurrentCurrent Assets
Current Liabilities
Measures solvency: The number of dollars in Current Assets for every $1 in Current Liabilities.
For example: a Current ratio of 1.76 means that for every $1 of Current Liabilities, the organisation has $1.76 in Current Assets with which to pay them.
QuickCash + Accounts Receivable
Current Liabilities
Measures liquidity: The number of dollars in Cash and Accounts Receivable for each $1 in Current Liabilities.
For example: a Quick ratio of 1.14 means that for every $1 of Current Liabilities, the organisation has $1.14 in Cash and Accounts Receivable with which to pay them.
Debt-to-WorthTotal Liabilities
Equity
Measures financial risk: The number of dollars of Debt owed for every $1 in Net Worth.
For example: a Debt-to-Worth ratio of 1.05 means that for every $1 of Equity in the organisation, it owes $1.05 of Debt to its creditors.
A more in-depth discussion of ratios is included later in this Guide.
It will help if you read the three ratios in the table using the phrase:
“For every dollar of what’s on the bottom, there is x of what’s on the top”.
For example, let’s say that you calculate a Current Ratio of 0.99. Using the above phrase, this reads as:
“For every dollar of Current Liabilities (what’s on the bottom), there are 99 cents of Current Assets (what’s on the top)”.
Tip
10
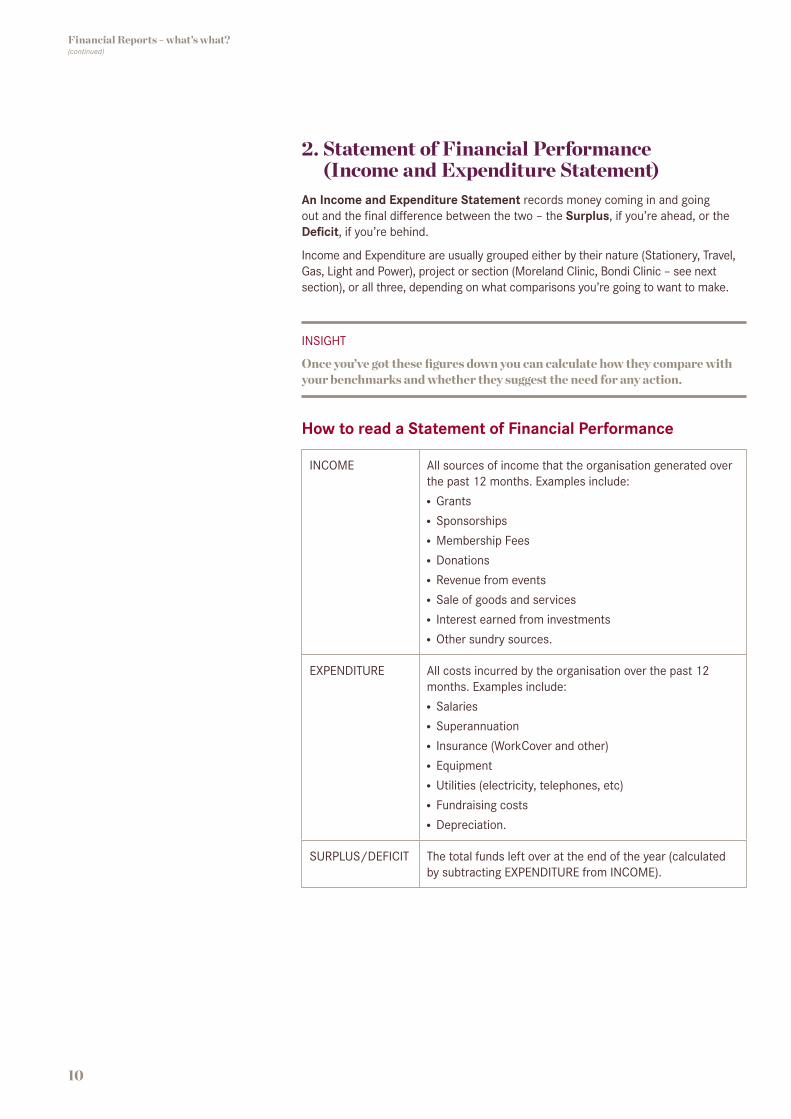
2. Statement of Financial Performance (Income and Expenditure Statement)
An Income and Expenditure Statement records money coming in and going out and the final difference between the two – the Surplus, if you’re ahead, or the Deficit, if you’re behind.
Income and Expenditure are usually grouped either by their nature (Stationery, Travel, Gas, Light and Power), project or section (Moreland Clinic, Bondi Clinic – see next section), or all three, depending on what comparisons you’re going to want to make.
INSIGHT
Once you’ve got these figures down you can calculate how they compare with your benchmarks and whether they suggest the need for any action.
How to read a Statement of Financial Performance
INCOME All sources of income that the organisation generated over the past 12 months. Examples include:
●● Grants●● Sponsorships●● Membership Fees●● Donations●● Revenue from events●● Sale of goods and services●● Interest earned from investments●● Other sundry sources.
EXPENDITURE All costs incurred by the organisation over the past 12 months. Examples include:
●● Salaries●● Superannuation●● Insurance (WorkCover and other)●● Equipment●● Utilities (electricity, telephones, etc)●● Fundraising costs●● Depreciation.
SURPLUS/DEFICIT The total funds left over at the end of the year (calculated by subtracting EXPENDITURE from INCOME).
Financial Reports – what’s what?(continued)
11
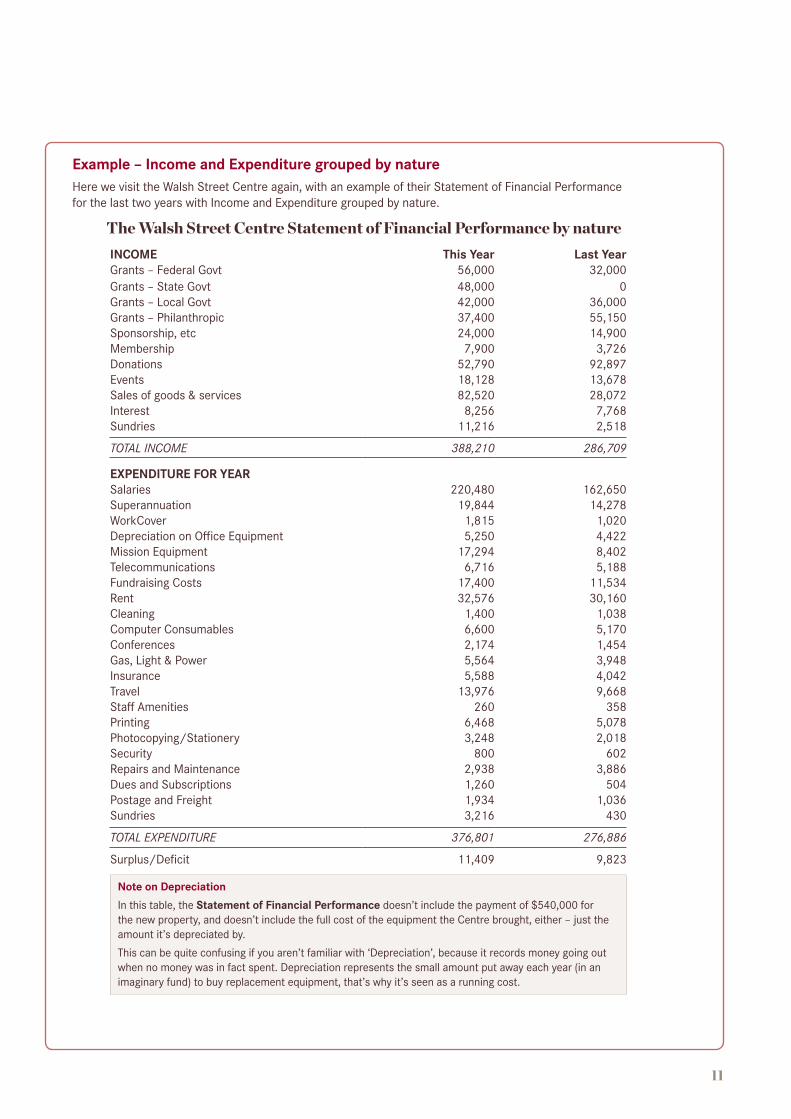
Example – Income and Expenditure grouped by natureHere we visit the Walsh Street Centre again, with an example of their Statement of Financial Performance for the last two years with Income and Expenditure grouped by nature.
The Walsh Street Centre Statement of Financial Performance by natureINCOME This Year Last YearGrants – Federal Govt 56,000 32,000Grants – State Govt 48,000 0Grants – Local Govt 42,000 36,000Grants – Philanthropic 37,400 55,150Sponsorship, etc 24,000 14,900Membership 7,900 3,726Donations 52,790 92,897Events 18,128 13,678Sales of goods & services 82,520 28,072Interest 8,256 7,768Sundries 11,216 2,518
TOTAL INCOME 388,210 286,709
EXPENDITURE FOR YEARSalaries 220,480 162,650Superannuation 19,844 14,278WorkCover 1,815 1,020Depreciation on Office Equipment 5,250 4,422Mission Equipment 17,294 8,402Telecommunications 6,716 5,188Fundraising Costs 17,400 11,534Rent 32,576 30,160Cleaning 1,400 1,038Computer Consumables 6,600 5,170Conferences 2,174 1,454Gas, Light & Power 5,564 3,948Insurance 5,588 4,042Travel 13,976 9,668Staff Amenities 260 358Printing 6,468 5,078Photocopying/Stationery 3,248 2,018Security 800 602Repairs and Maintenance 2,938 3,886Dues and Subscriptions 1,260 504Postage and Freight 1,934 1,036Sundries 3,216 430
TOTAL EXPENDITURE 376,801 276,886
Surplus/Deficit 11,409 9,823
Note on Depreciation In this table, the Statement of Financial Performance doesn’t include the payment of $540,000 for the new property, and doesn’t include the full cost of the equipment the Centre brought, either – just the amount it’s depreciated by. This can be quite confusing if you aren’t familiar with ‘Depreciation’, because it records money going out when no money was in fact spent. Depreciation represents the small amount put away each year (in an imaginary fund) to buy replacement equipment, that’s why it’s seen as a running cost.
12
Financial Reports – what’s what?(continued)
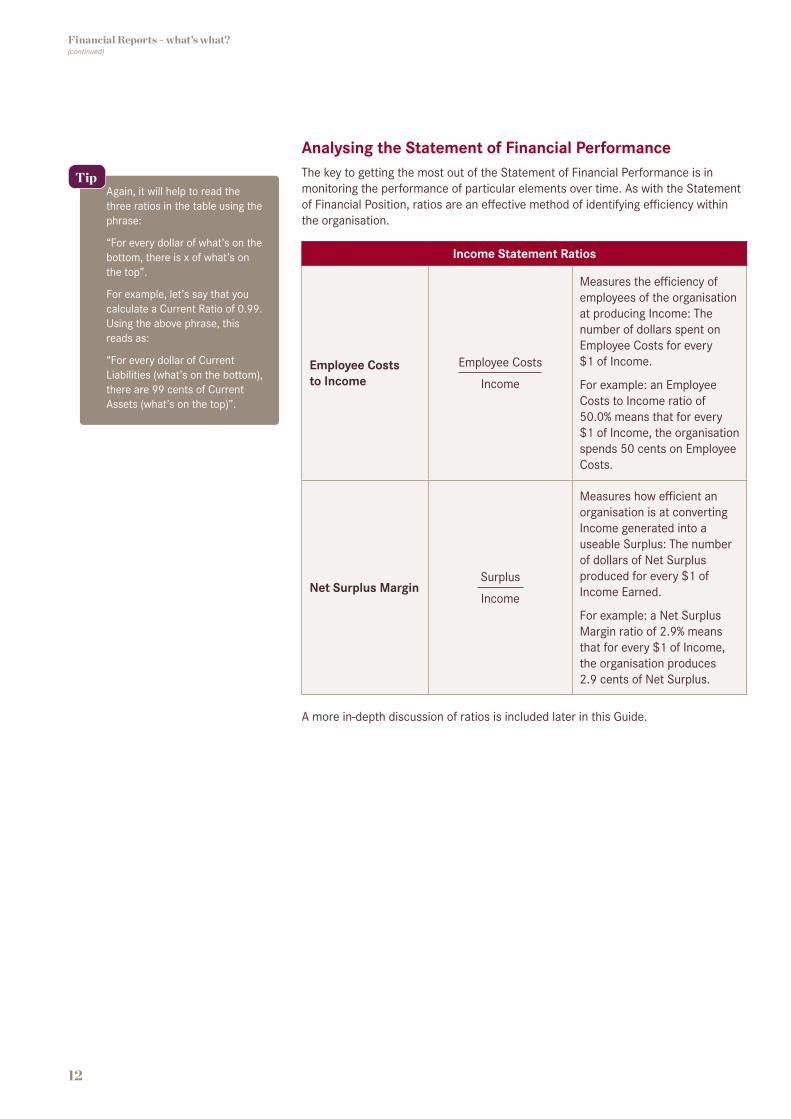
Analysing the Statement of Financial Performance The key to getting the most out of the Statement of Financial Performance is in monitoring the performance of particular elements over time. As with the Statement of Financial Position, ratios are an effective method of identifying efficiency within the organisation.
Income Statement Ratios
Employee Costs to Income
Employee Costs
Income
Measures the efficiency of employees of the organisation at producing Income: The number of dollars spent on Employee Costs for every $1 of Income.
For example: an Employee Costs to Income ratio of 50.0% means that for every $1 of Income, the organisation spends 50 cents on Employee Costs.
Net Surplus MarginSurplus
Income
Measures how efficient an organisation is at converting Income generated into a useable Surplus: The number of dollars of Net Surplus produced for every $1 of Income Earned.
For example: a Net Surplus Margin ratio of 2.9% means that for every $1 of Income, the organisation produces 2.9 cents of Net Surplus.
A more in-depth discussion of ratios is included later in this Guide.
Again, it will help to read the three ratios in the table using the phrase:
“For every dollar of what’s on the bottom, there is x of what’s on the top”.
For example, let’s say that you calculate a Current Ratio of 0.99. Using the above phrase, this reads as:
“For every dollar of Current Liabilities (what’s on the bottom), there are 99 cents of Current Assets (what’s on the top)”.
Tip

13
Example – Income and Expenditure grouped by projectBelow we show the Walsh Street Centre again, but the Statement of Performance this time has the Income and Expenditure broken down by project.
Walsh Street Centre Statement of Performance by project
Project 1 Project 2Walsh St
Centre TotalIncomeGrants – Fed Govt $52,000 $4,000 56,000Grants – State Govt $48,000 48,000Grants – Local Govt $19,000 $21,000 $2,000 42,000Grants – Philanthropic $12,000 $7,400 $18,000 37,400Sponsorship, etc $6,000 $18,000 24,000Memberships $7,900 7,900Donations $12,000 $40,790 52,790Events $4,072 $14,056 18,128Sales of goods & services $49,544 $26,680 $6,296 82,520Bank Interest $8,256 8,256Sundries $3,678 $3,551 $3,987 11,216
Total Income $154,222 $110,703 $123,285 388,210
ExpenditureSalaries $121,000 $54,480 $45,000 220,480Superannuation $10,891 $4,903 $4,050 19,844WorkCover $996 $448 $371 1,815Depreciation on Office Equipment
$900
$650
$3,700
5,250
Mission Equipment $4,105 $5,189 $8,000 17,294Telecommunications $1,820 $696 $4,200 6,716Fundraising Costs $4,166 $13,234 17,400Rent $11,000 $21,576 32,576Cleaning $350 $1,050 1,400Computer Consumables $1,890 $2,100 $2,610 6,600Conferences $200 $180 $1,794 2,174Gas, Light and Power $1,252 $800 $3,512 5,564Insurance $1,800 $900 $2,888 5,588Travel and Transportation $3,880 $2,507 $7,589 13,976Staff Amenities $21 $183 $56 260Printing $860 $880 $4,728 6,468Photocopying/Stationery $289 $238 $2,721 3,248Security $236 $65 $499 800Repairs and Maintenance $1,211 $58 $1,669 2,938Dues and Subscriptions $124 $238 $898 1,260Postage and Freight $460 $50 $1,424 1,934Sundries $878 $550 $1,788 3,216
Total Expenditure $168,329 $75,115 $133,357 376,801
Total Surplus/Deficit ($14,107) $35,588 ($10,072) 11,409
It’s easy for a project to make an accounting profit if it doesn’t have to pay for all the back office overheads, so include their fair share of the central administrative costs in the project costs – either pro rata or, if you can manage it, by actual costs.
Tip
INSIGHTShowing the projects separately this way enables you as a Board member to see that while you’re in overall surplus one of your projects is losing money. This doesn’t mean you should close it down – you’re a not-for-profit, and cross-subsidy is quite within your possible goals – but it’s something you should be aware of.

14
3. Cash Flow StatementWhile Balance Sheets and Income and Expenditure Statements are compulsory features of all financial reports, not all organisations add the extra flourish of providing a Cash Flow Statement.
Cash Flow Statements report on the cash payments out and cash receipts in, over the same period as the other statements. Traditionally the statement is divided into money in and out in three categories – Operating, Investing and Financing.
The Cash Flow Statement shows the opening balance in cash and cash equivalents for the reporting period, the net cash provided by or used in each one of the categories (operating, investing, and financing activities), the net increase or decrease in cash and cash equivalents for the period, and the ending balance.
INSIGHTWe split it up this way because when you’re analysing such a statement it’s important to consider each of the various sections which contribute to the overall change in cash position. In many cases, an organisation may have negative overall cash flow in a given year, but if it’s generating positive cash flow from its operations then the negative overall cash flow may be a result of heavy investment expenditures, which is not necessarily a bad thing.
Financial Reports – what’s what?(continued)
15
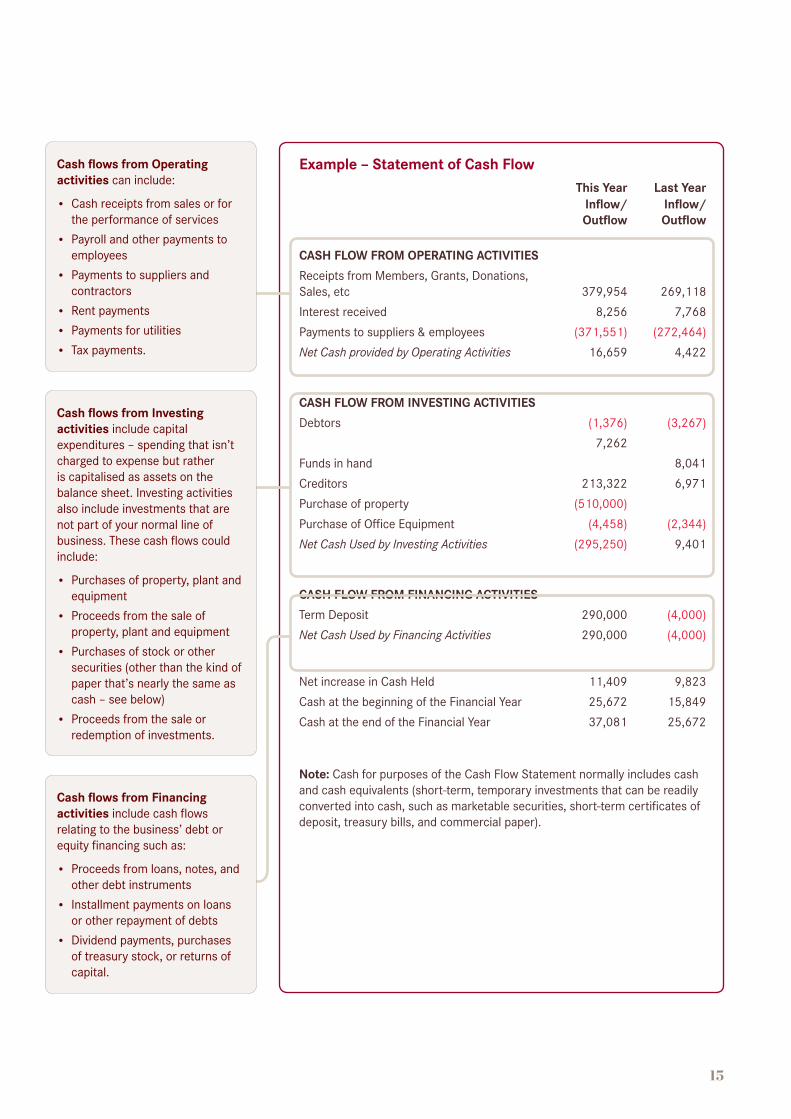
Example – Statement of Cash FlowThis Year Last Year
Inflow/ Outflow
Inflow/ Outflow
CASH FLOW FROM OPERATING ACTIVITIESReceipts from Members, Grants, Donations, Sales, etc 379,954 269,118 Interest received 8,256 7,768 Payments to suppliers & employees (371,551) (272,464)Net Cash provided by Operating Activities 16,659 4,422
CASH FLOW FROM INVESTING ACTIVITIESDebtors (1,376) (3,267)
7,262 Funds in hand 8,041Creditors 213,322 6,971Purchase of property (510,000)Purchase of Office Equipment (4,458) (2,344)Net Cash Used by Investing Activities (295,250) 9,401
CASH FLOW FROM FINANCING ACTIVITIES Term Deposit 290,000 (4,000)Net Cash Used by Financing Activities 290,000 (4,000)
Net increase in Cash Held 11,409 9,823 Cash at the beginning of the Financial Year 25,672 15,849 Cash at the end of the Financial Year 37,081 25,672
Note: Cash for purposes of the Cash Flow Statement normally includes cash and cash equivalents (short-term, temporary investments that can be readily converted into cash, such as marketable securities, short-term certificates of deposit, treasury bills, and commercial paper).
Cash flows from Operating activities can include:
• Cash receipts from sales or for the performance of services
• Payroll and other payments to employees
• Payments to suppliers and contractors
• Rent payments• Payments for utilities• Tax payments.
Cash flows from Investing activities include capital expenditures – spending that isn’t charged to expense but rather is capitalised as assets on the balance sheet. Investing activities also include investments that are not part of your normal line of business. These cash flows could include:
• Purchases of property, plant and equipment
• Proceeds from the sale of property, plant and equipment
• Purchases of stock or other securities (other than the kind of paper that’s nearly the same as cash – see below)
• Proceeds from the sale or redemption of investments.
Cash flows from Financing activities include cash flows relating to the business’ debt or equity financing such as:
• Proceeds from loans, notes, and other debt instruments
• Installment payments on loans or other repayment of debts
• Dividend payments, purchases of treasury stock, or returns of capital.
16
Now you are familiar with some of the documents you will be regularly faced with as a Board member, it doesn’t seem so bad does it?Don’t exhale just yet though. There’s still a very important concept that you need to understand before you are on your way to being a fully financially equipped Board guru.
There are two different kinds of accounting for income and expenditure – Cash Accounting and Accrual Accounting – and it is up to the Board to decide which one it wants to use.
So, it’s important to understand the pros and cons of each kind, and what each kind can and can not do.
Cash Accounting Cash Accounting recognises income when it is actually received and expenses when the bill is paid. The strength of this method is in always knowing your cash position, however it does not tell you how profitable you are.
This is the simplest format of accounting, and most small organisations use it. It works on the basis of tracking the actual dollars in and dollars out as if they were actual crumpled notes.
The choice would be simple if your organisation received all its income from no-strings donations (or, as accountants refer to them, ‘non-reciprocal transfers’). However, if your group gets any significant proportion of its income as payment for services – if you get grants for particular projects, or if you contract with the government to deliver client services – then simple cash accounting may not be the right choice.
Accrual Accounting Accrual Accounting matches the income earned against the expenses incurred to earn the income. Income is recorded as it is earned (i.e. when the invoice is issued rather than when the money is actually credited into your bank account) and expenses as they are incurred giving you an accurate picture of profitability.
Although small organisations can get by with Cash Accounting, most large organisations that deliver services in return for payment (by clients, governments, or grantmakers) use Accrual Accounting. It’s more complicated, and requires more financial expertise, and it may require more resources for your finance section.
Although small organisations can get by with Cash Accounting, most large organisations that deliver services in return for payment (by clients, governments, or grantmakers) use Accrual Accounting. It’s more complicated, and requires more financial expertise, and it may require more resources for your finance section.
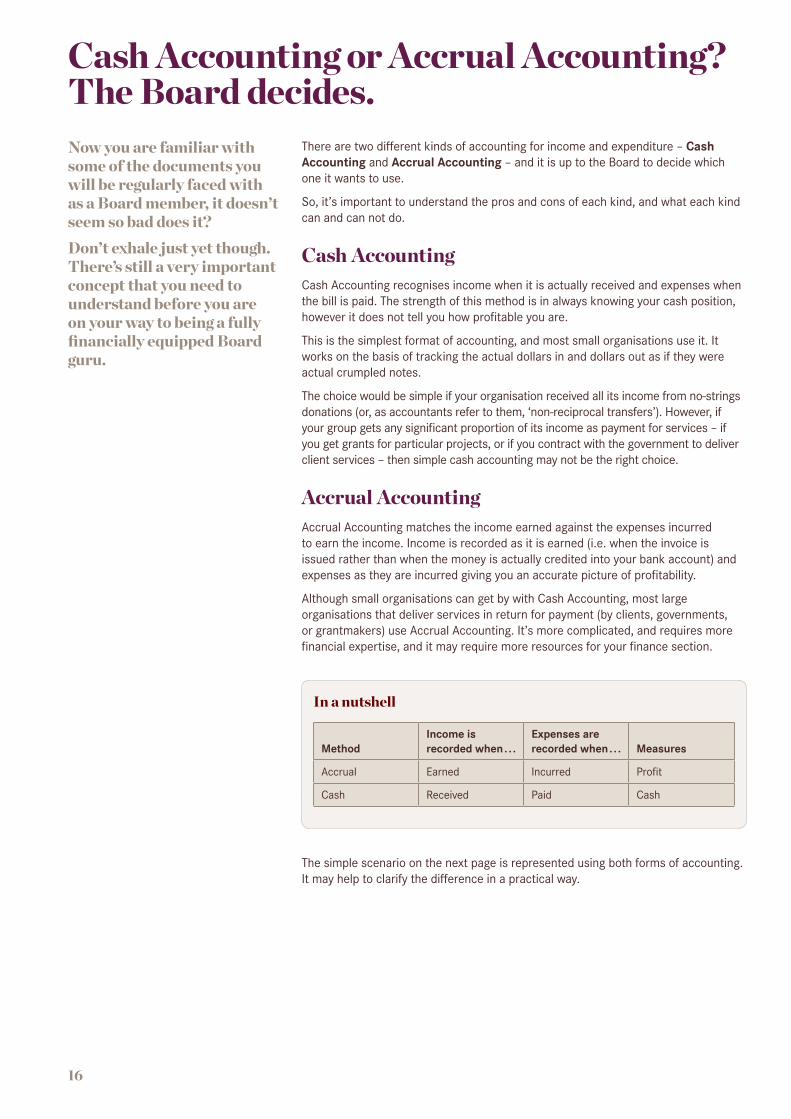
In a nutshell
Method Income is recorded when . . .
Expenses are recorded when . . . Measures
Accrual Earned Incurred Profit
Cash Received Paid Cash
The simple scenario on the next page is represented using both forms of accounting. It may help to clarify the difference in a practical way.
Cash Accounting or Accrual Accounting? The Board decides.
17
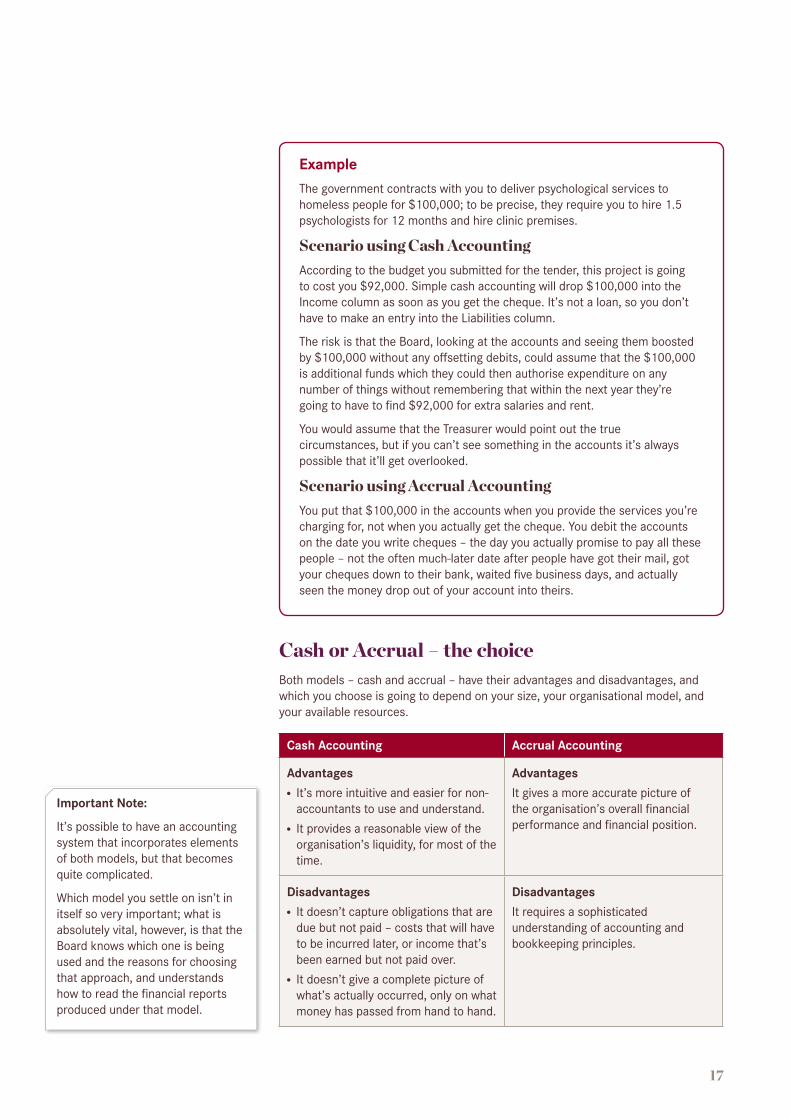
ExampleThe government contracts with you to deliver psychological services to homeless people for $100,000; to be precise, they require you to hire 1.5 psychologists for 12 months and hire clinic premises.
Scenario using Cash AccountingAccording to the budget you submitted for the tender, this project is going to cost you $92,000. Simple cash accounting will drop $100,000 into the Income column as soon as you get the cheque. It’s not a loan, so you don’t have to make an entry into the Liabilities column.
The risk is that the Board, looking at the accounts and seeing them boosted by $100,000 without any offsetting debits, could assume that the $100,000 is additional funds which they could then authorise expenditure on any number of things without remembering that within the next year they’re going to have to find $92,000 for extra salaries and rent.
You would assume that the Treasurer would point out the true circumstances, but if you can’t see something in the accounts it’s always possible that it’ll get overlooked.
Scenario using Accrual AccountingYou put that $100,000 in the accounts when you provide the services you’re charging for, not when you actually get the cheque. You debit the accounts on the date you write cheques – the day you actually promise to pay all these people – not the often much-later date after people have got their mail, got your cheques down to their bank, waited five business days, and actually seen the money drop out of your account into theirs.
Cash or Accrual – the choiceBoth models – cash and accrual – have their advantages and disadvantages, and which you choose is going to depend on your size, your organisational model, and your available resources.
Cash Accounting Accrual Accounting
Advantages ●● It’s more intuitive and easier for non-accountants to use and understand.
●● It provides a reasonable view of the organisation’s liquidity, for most of the time.
Advantages It gives a more accurate picture of the organisation’s overall financial performance and financial position.
Disadvantages ●● It doesn’t capture obligations that are due but not paid – costs that will have to be incurred later, or income that’s been earned but not paid over.
●● It doesn’t give a complete picture of what’s actually occurred, only on what money has passed from hand to hand.
Disadvantages It requires a sophisticated understanding of accounting and bookkeeping principles.
Important Note:
It’s possible to have an accounting system that incorporates elements of both models, but that becomes quite complicated.
Which model you settle on isn’t in itself so very important; what is absolutely vital, however, is that the Board knows which one is being used and the reasons for choosing that approach, and understands how to read the financial reports produced under that model.

18
One of the main duties of the Board is planning. Without planning you have no idea of where the organisation should go, where it is going and what it’s going to do when it gets there (or doesn’t get there). The financial reports we have shown you so far form the basis of all the important decisions that are made for the future of an organisation.
They more or less provide documented evidence showing whether or not your organisation’s efforts are leading you towards the important goals you have planned to achieve – offering a solid grounding from which plans can be adjusted, directions altered, and new goals formulated. In short they are vital for ensuring the optimum use of the resources you have available to you.
Your organisation should ideally draw up (and review regularly) a Strategic Plan, a Business Plan, a Marketing Plan and a Fundraising Plan and then agree on the ways you plan to measure and evaluate progress.
The next few pages of this Guide will show you why planning is so important for your organisation. In understanding this, you will also gain an insight into the practical application of the financial reports to which you have just been introduced.
Strategic PlanThe strategic plan is the foundation of everything you do.
The strategic planning process is for working out where you want to go – the goals you can reasonably expect to reach, the objectives that will allow you to know when you have met those goals, and the broad strategies that will allow you to achieve those objectives.
It enables organisations to think through and document what they are doing, for whom they are doing it, and why. In mature organisations, the process encourages examination of established directions and strategies to ensure contemporary relevance and results.
During the process, difficult questions are encouraged and discussed:
●● What is our mission?●● Do we need to change our mission to adjust to changing circumstances?●● Has our target community shifted its focus or needs?●● Should we abandon much-loved programs that have outlived their usefulness and concentrate our resources elsewhere?
●● Is there enough capacity and commitment within our present staff and management team to achieve our goals?
A successful strategic planning process will involve not only the Board, but all of the organisation’s stakeholders – paid and volunteer staff, clients, funders, and the community. It should focus on an organisation’s vision and priorities in response to a changing environment and to ensure that members of the organisation are working toward the same goals.
Environmental ScanAs part of the process, the Board will need to conduct an environmental scan, reviewing the organisation’s relationship to the broader political, social and economic environments. A new competitor, a change of government policy, or a shift in demographics may all impact on the organisation.
The Board then looks at the way the organisation is placed to meet the challenges described in the environmental scan and decides what it needs to do to respond to the major issues and opportunities it faces.
Why is it all necessary? Practical applications in planning.
19
Mission StatementFirst, the organisation must identify or review the reasons it exists. This is documented in the organisation’s Mission Statement, which contains the basic guiding principles that provide direction and inspiration to the Board and its staff.
The Mission Statement is a succinct description of the organisation’s basic purpose, along with the activities or business it undertakes to achieve its purpose, and the basic values that the organisation holds in common and endeavours to put into practice.
SMARTER Goal SettingThe Board must then choose specific priorities – setting goals (or ‘objectives’ or ‘outcome statements’) based on the Mission Statement in the light of the environmental scan.
Goals or objectives should be designed and worded as much as possible to be specific and measurable, acceptable to those working to achieve the goals, realistic, timely, extending the capabilities and rewarding for those working to achieve the goals (an acronym for these criteria is ‘SMARTER’).
INSIGHTFinancial Reports such as a budget and the Statement of Performance by project are very helpful to determine which projects are underperforming and which are not. This would assist in making decisions about which projects should continue and which should perhaps not. Of course, because of the not-for-profit foundations of your organisation, not all underperforming projects should be ended, however these reports will draw your attention to any problems which are on the horizon, and help you determine strategies to work through them.
Business PlanA business plan, on the other hand, is about business and, of course, money. It is fundamentally a scale model of your organisation.
Your business plan should include the following elements.
Mission statement/goals/objectives – All the elements that aren’t about money are carried over from your strategic plan.
The situation report – It’s here that you feed in the results of your surveys, your SWOT (strengths, weaknesses, opportunities, threats) analysis, your judgements of the trends, your evaluation of the competition, and your seat-of-the-pants analysis – the best information you have. Facts are better than estimates, and estimates are better than guesses, but even guesses are better than not putting anything down. Guesses provide a starting-point for later refinement, a marker for what elements the budget is particularly sensitive to, and a reminder that decisions have to be taken no matter what.
Plans – Each plan attempts to express in concrete financial terms:
●● the outcomes that have to be achieved over the next year/three years/five years●● the steps that will be needed to get there●● the schedule for these to be done●● the people who will need to do them, and●● what they will cost.
20
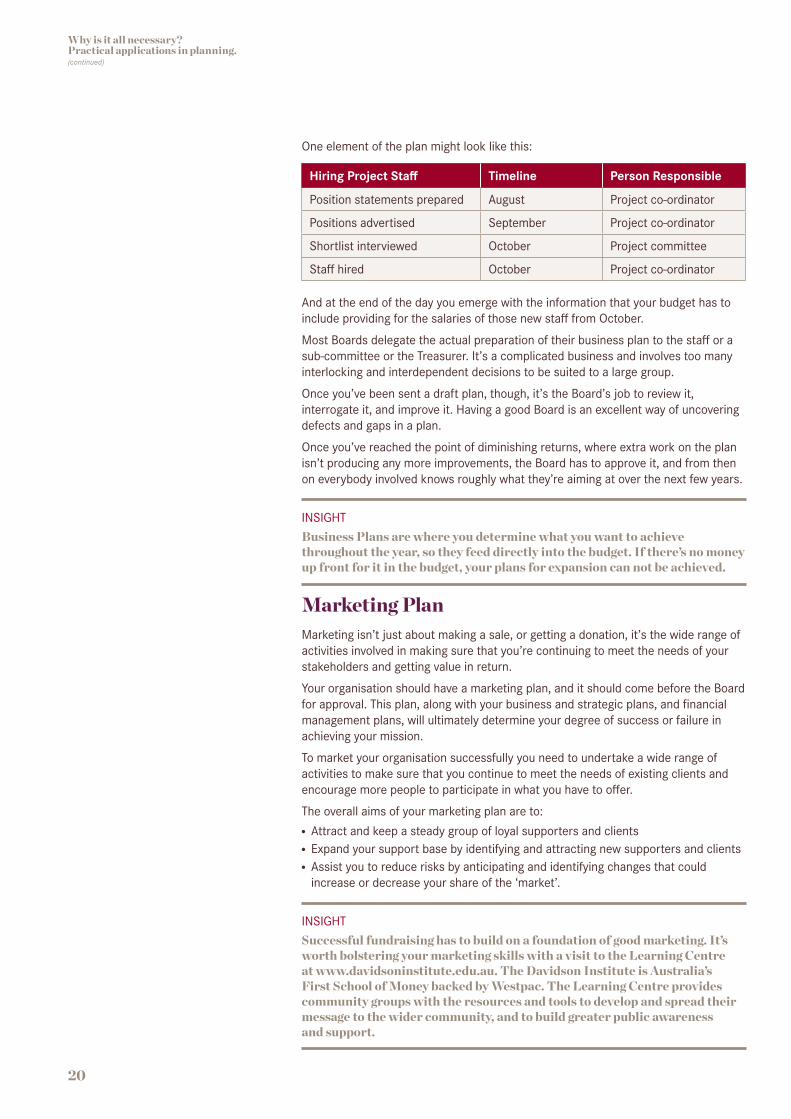
One element of the plan might look like this:
Hiring Project Staff Timeline Person Responsible
Position statements prepared August Project co-ordinator
Positions advertised September Project co-ordinator
Shortlist interviewed October Project committee
Staff hired October Project co-ordinator
And at the end of the day you emerge with the information that your budget has to include providing for the salaries of those new staff from October.
Most Boards delegate the actual preparation of their business plan to the staff or a sub-committee or the Treasurer. It’s a complicated business and involves too many interlocking and interdependent decisions to be suited to a large group.
Once you’ve been sent a draft plan, though, it’s the Board’s job to review it, interrogate it, and improve it. Having a good Board is an excellent way of uncovering defects and gaps in a plan.
Once you’ve reached the point of diminishing returns, where extra work on the plan isn’t producing any more improvements, the Board has to approve it, and from then on everybody involved knows roughly what they’re aiming at over the next few years.
INSIGHTBusiness Plans are where you determine what you want to achieve throughout the year, so they feed directly into the budget. If there’s no money up front for it in the budget, your plans for expansion can not be achieved.
Marketing PlanMarketing isn’t just about making a sale, or getting a donation, it’s the wide range of activities involved in making sure that you’re continuing to meet the needs of your stakeholders and getting value in return.
Your organisation should have a marketing plan, and it should come before the Board for approval. This plan, along with your business and strategic plans, and financial management plans, will ultimately determine your degree of success or failure in achieving your mission.
To market your organisation successfully you need to undertake a wide range of activities to make sure that you continue to meet the needs of existing clients and encourage more people to participate in what you have to offer.
The overall aims of your marketing plan are to: ●● Attract and keep a steady group of loyal supporters and clients ●● Expand your support base by identifying and attracting new supporters and clients ●● Assist you to reduce risks by anticipating and identifying changes that could increase or decrease your share of the ‘market’.
INSIGHTSuccessful fundraising has to build on a foundation of good marketing. It’s worth bolstering your marketing skills with a visit to the Learning Centre at www.davidsoninstitute.edu.au. The Davidson Institute is Australia’s First School of Money backed by Westpac. The Learning Centre provides community groups with the resources and tools to develop and spread their message to the wider community, and to build greater public awareness and support.
Why is it all necessary? Practical applications in planning.(continued)

21
Fundraising PlanFundraising is a vital source of income for a not-for-profit organisation and it’s the Board’s business to keep the fundraisers under pressure. It’s also the Board’s business not to be unrealistically optimistic.
It’s the Board’s business, too, to make sure that the organisation’s fundraising model is sustainable over the long term. This involves longer-term planning and diversification of your fundraising efforts.
You need your group’s money to be coming from as many sources as you can manage, raised by as many people as you can coordinate.
A good fundraising plan rests on six pillars. These are: Donations, Grants, Community-Business Partnerships, Membership/Alumni/Friends, Special Events and Earned Income.
Someone has to prepare a fundraising plan that sets out how you’re going to approach all these opportunities, and the Board has to be sure that’s happening.
The Board and the staff need to form a partnership to develop and implement a fundraising plan to secure the required funds. A good fundraising plan is explicit about Board and staff responsibilities.
INSIGHTMany groups get into trouble because they have only two or three sources of funding, or because they have only two or three people really involved in raising money. If any one of the sources or any of the people goes away, the organisation starts to slide into trouble.
What you can do as a Board member Some Boards regard it as part of the Board member’s duties to make significant donations themselves, just to set a good example, but that’s something your Board will have to decide for itself. Things Board members can do include:
• Identifying potential philanthropic grants or corporate sponsors
• Providing input into fundraising plans
• Joining the fundraising committee
• Cultivating new donation prospects
• Accompanying staff on key visits to funders
• Helping with expressions of thanks when appropriate
• Organising a fundraising event• Making a personal contribution• Laying the groundwork
with heads of government, philanthropic foundations, and corporations for further support from these sectors.
22
Budgeting is what makes things happen. If there’s no money set aside up front for a project or a new staff member, then starting the project or employing the staff member is never going to get off the ground. Careful planning and meticulous reporting can make all the difference when it comes to knowing what money is needed where and when.
There are two main budget formats, each as important as the other. They are: an Annual Budget, which covers the expected comings and goings for every cent available to an organisation, and a Project Budget, which maps out how allocated funds will be spent within an individual project. We talk further about both types here.
Annual BudgetAn Annual Budget speculates on what income you will have coming in over the next year, and includes cost estimates and a Statement of Income and Expenditure that covers the next year (or even the next two, three, or five years).
Unfortunately this involves quite a lot of guesswork, but it also allows you to put boundaries around what you are willing to spend on different areas of the business – in turn eliminating the guesswork from decision-making.
Most organisations draw up their budgets by beginning with last year’s budget and incorporating:
●● the changes that flow out of your business plan (like extra staff or more advertising)●● likely changes in the environment (cost inflation, pressure on sponsorships)●● policy changes (raising or lowering your charges, offering new services).
More rigorous Boards begin from scratch and argue through every entry. The benefit of starting early is that the Board may find there are opportunities to make operational changes. For example, a Board may decide not to include an entry for Gas, Light and Power just because it was in last year’s budget but might investigate the possibility of self-service through installing solar panels.
Each year the Board has to approve the budget for the coming year. This is another of the Board’s most fundamental duties and can fuel some healthy discussion.
The most important thing to remember when you’re looking at the numbers in a budget is that it’s not about the numbers in the end. Part of the business of being a Board member is to be able to look through the veil of numbers and see the mission proceeding underneath. Is your organisation developing in the way you want it to?
Why is it all necessary? Practical applications in budgeting.
DON’T SWEAT THE SMALL STUFFIt is easy to be drawn to figures of the size you’re used to in your daily life – under $10,000, or perhaps under $1000. This can lead to obsessing over cleaning costs or maintenance expenses where the amounts to be gained are little more than rounding errors in the big picture. Bunch them together into Miscellaneous Expenses until you’ve settled on the important areas.
Tip
23
A good budget . . .• is brought to the Board in good time
The budget for the next year should be put in front of the Board with plenty of time to ask questions, request changes, and weigh up alternatives. Realistically, that means that it should be brought up no later than the second-last meeting in any financial year.
• is clear about its assumptionsA figure in a list – “Salaries, $154,000”, say – is opaque and unresponsive. If it’s to contribute to the discussion it needs an accompanying note to say:
Based on – current staff continuing – 3.2% salary adjustment– extra staff member @ Senior Clinician II level from September.
• provides alternativesWhere there are choices to be made, the Treasurer may need to add a note (or even extra columns) to set out what the budget would look like if, say, you hired a Clinician instead of a Senior Clinician, or waited until January to make the appointment. Decisions need to be flagged.
• doesn’t include any nasty surprisesWhen you’re taking on a recurrent obligation, such as an extra staff member, look ahead. Budgeting requires forethought. Many Boards, however, take things a year at a time, looking no further than the next June 30th. A Treasurer has to fight this tendency, spelling the consequences of every decision out for the next several years so that the Board can see what’s going to happen after the grant runs out and the extra staff member is still on the payroll, this time for the full year. Do your forward budgeting two or three years at a time.
• is comfortable with uncertaintyOnce you set a budget, anything could still happen – it may rain on the day of the fête, government funding guidelines may change, a sudden recession may make people unwilling to pay – it’s theoretically possible that you may have no income at all next year. If you spend only what you’re sure of, you’ll do nothing at all. But that outcome’s not likely, and what you’re being asked for is your best estimate.
• doesn’t lead to complacencySetting your grant target for this year equal to 10% less than last year may be conservative, but it doesn’t mean that all the work isn’t still there to be done – just as setting it at 10% more is going to mean harder work, so you need to ensure there is resource to cope with this.
• doesn’t pretend more accuracy than it can deliverDon’t be afraid to round up or down. If you average the last three years’ postage costs, say, and come up with a figure of $1,202.27, don’t just put that figure in – you can’t reasonably expect to get it right to the cent, or the dollar, or anything more than the nearest hundred. Don’t give the wrong message. Say $1,200.
• is passed in good timeStrictly speaking, if you haven’t adopted the budget by June 30th you don’t have authority to spend anything on July 1, or thereafter. Not many Australian groups are that punctilious, but operating on spec is nonetheless a very bad plan indeed.
Once the budget’s approved, the staff or the Board are authorised to spend up to that limit, subject to any changes made from time to time as each month’s figures are reviewed by the Board.
24
Project BudgetOn top of having a budget for your overall operations, you will also need budgets that can answer questions about different sections of your organisation.
If you’re carrying on several different programs or projects you’ll want to know whether each of them is making money or losing money. There’s nothing wrong with losing money on any part of your mission – that’s what being a not-for-profit means – but there’s a lot wrong with not knowing that that’s what you’re doing.
It’s also the case that you may have to do project budgeting, particularly if you’re asking someone else to pay for it. If you’re drawing up a grant application or a tender you’ll need to be able to pull out its costs and set them up separately.
CostsMany organisations run into trouble because they count only direct costs – which are the resources that are actually expended on the project services. What other expenses is your organisation going to have to meet to support this project? Your administrator is going to have to organise payments of money, the project people will be taking up space and using equipment, and your CEO will be spending time handling the project.
If you’ve got spare capacity in all these areas, you may not have any extra expenses; if, on the other hand, you have to add extra, or if you have to cut back on other current activities, then do count them in.
IncomeEstimating income may be simple – the money from a project grant, for example, may be set. If you are estimating something more variable, like sales or fees, that will require more thought.
Don’t forget to calculate the GST implications of all your income transactions.
Profit marginIt’s important to see whether you are going to make a profit on the project, break even, or have to throw in some of your own money. Do you come out ahead once indirect costs are added in?
INSIGHTSome organisations make the mistake of jumping at anything that promises income, without checking that there is a margin to meet on-costs and indirect costs. This can lead to a financial squeeze further down the track.
Why is it all necessary? Practical applications in budgeting.(continued)
25
Tendering for a projectTendering involves not only calculating how much the project will cost but also how much your competitors are going to quote. Your tender should be either slightly less than you think your competitors will bid or slightly more than the project will cost, whichever is the higher.
Monitoring project costsIt’s important to monitor project costs against the timeline, so that you don’t end up having spent all the money before having completed the project. Again, project management software can help you straighten these things out, but it isn’t always necessary.
Note about Direct CostsHere is a list of the direct costs which will be associated with your project.
1. Personnel/Staff Wages and salaries, benefits and payroll taxes.
2. Supplies/permits/insurancesConsumable supplies used for the project, any special permits or licenses, any special insurance coverage that may be needed to cover precious goods or venues being used in ways that their regular insurance does not cover.
3. TravelAll travel, meal costs and venue hire related to the project should be included.
4. Publications (print and online)Printing, publishing or copying brochures, invitations, reports, books, reprints, website.
5. ContingencyYou may be wise to include an item for Contingency. This is usually calculated at 5% of total budget to cover things that occur unexpectedly, for example unavoidable change of venue or replacement of cancelled speakers or poor materials. Mind you, funders can be wary of a miscellaneous column in the budget. This sometimes signals that the applicants haven’t thoroughly thought through their actual budget requirements.
Do not follow your competitors down into making a loss. Let them volunteer to lose money.
Tip

26
There’s no point making plans to do things if you don’t pause from time to time to see whether they’re actually happening.
Having decided on what’s to be done, the Board then has to keep an eye on the situation down the track. The Board doesn’t have to note every transaction itself – it just has to make sure that somebody (generally the Treasurer, but sometimes the CEO or staff) reports to the Board in as much detail as is needed.
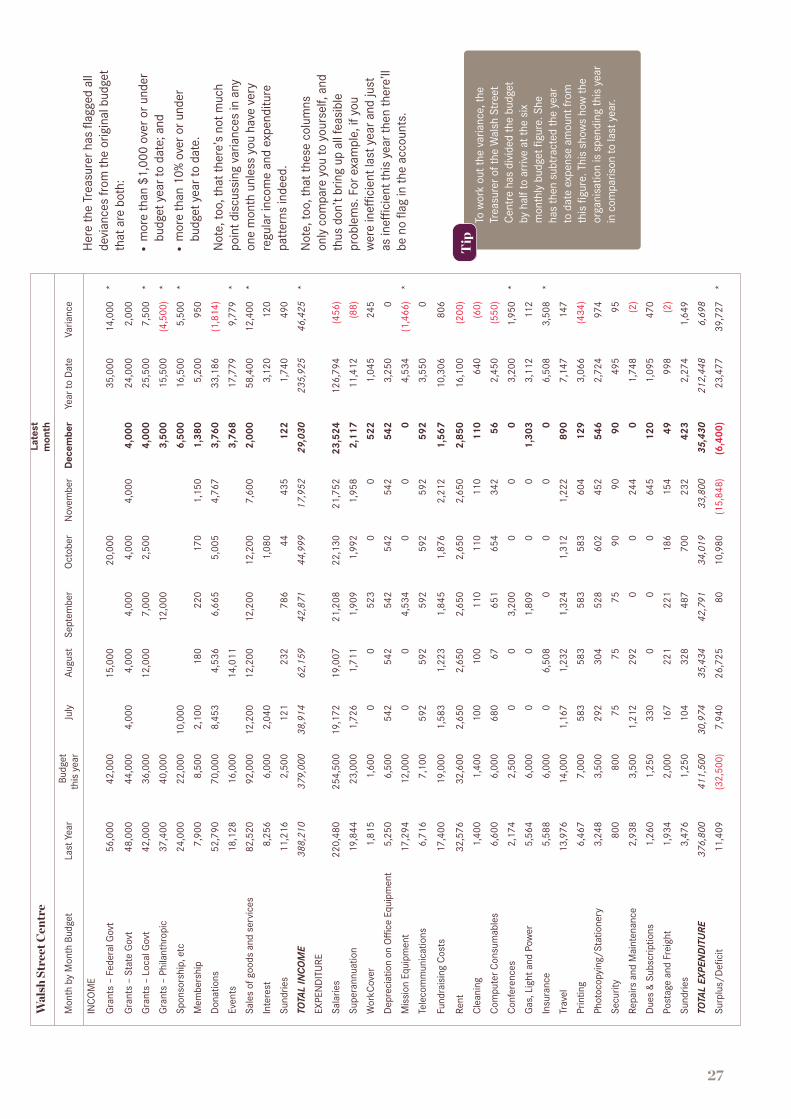
Treasurer’s ReportThe Treasurer’s Report draws on the Income and Expenditure Statement to tell the Board how the organisation is travelling at a particular point in time. We go back to the Walsh Street Clinic with the example on the next page.
The basic information comes in the ‘Year to Date’ column; this is how much we’ve spent (or taken in) since the end of the last financial year. The Year to Date figure is compared to additional benchmarks such as Budget (this is the figure we’d expected to see at this stage) and Previous Year (this is what we’d spent by this time last year).
In general, any major difference between budget and actual figures is a marker for concern, and the Treasurer’s report to the Board is the place to check these out. For this reason, you may want to double up on the variance figures, giving them as both numbers and percentages (see note below).
Monitoring your progress using financial reporting.
Note:
The argument against giving the percentages is that some Board members tend to obsess over large percentages, and will spend hours discussing why Security has risen 20% since last month, from $75 to $90, while overlooking a 6% rise in Salaries from $350,000 to $371,000 – giving more time to $20 than $20,000. You’ll need a filter that flags differences when they’re over a certain percentage and a certain amount.
27
Wal
sh S
tree
t Cen
tre
Late
st
mon
th
Mon
th b
y M
onth
Bud
get
Last
Yea
rBu
dget
th
is y
ear
July
Augu
stSe
ptem
ber
Oct
ober
Nov
embe
rDe
cem
ber
Year
to D
ate
Varia
nce
INCO
ME
Gran
ts –
Fed
eral
Gov
t56
,000
42,0
0015
,000
20,0
0035
,000
14,0
00
*
Gran
ts –
Sta
te G
ovt
48,0
0044
,000
4,00
04,
000
4,00
04,
000
4,00
04,
000
24,0
002,
000
Gran
ts –
Loc
al G
ovt
42,0
0036
,000
12,0
007,
000
2,50
04,
000
25,5
007,
500
*
Gran
ts –
Phi
lant
hrop
ic37
,400
40,0
0012
,000
3,50
015
,500
(4,5
00)
*
Spon
sors
hip,
etc
24,0
0022
,000
10,0
006,
500
16,5
005,
500
*
Mem
bers
hip
7,90
08,
500
2,10
018
022
017
01,
150
1,38
05,
200
950
Dona
tions
52,7
9070
,000
8,45
34,
536
6,66
55,
005
4,76
73,
760
33,1
86(1
,814
)
Even
ts18
,128
16,0
0014
,011
3,76
817
,779
9,77
9 *
Sale
s of
goo
ds a
nd s
ervi
ces
82,5
2092
,000
12,2
0012
,200
12,2
0012
,200
7,60
02,
000
58,4
0012
,400
*
Inte
rest
8,25
66,
000
2,04
01,
080
3,12
012
0
Sund
ries
11,2
162,
500
121
232
786
4443
512
21,
740
490
TOTA
L IN
COM
E38
8,21
037
9,00
038
,914
62,1
5942
,871
44,9
9917
,952
29,0
3023
5,92
546
,425
*
EXPE
NDI
TURE
Sala
ries
220,
480
254,
500
19,1
7219
,007
21,2
0822
,130
21,7
5223
,524
126,
794
(456
)
Supe
rann
uatio
n19
,844
23,0
001,
726
1,71
11,
909
1,99
21,
958
2,11
711
,412
(88)
Wor
kCov
er1,
815
1,60
00
052
30
052
21,
045
245
Depr
ecia
tion
on O
ffice
Equ
ipm
ent
5,25
06,
500
542
542
542
542
542
542
3,25
00
Mis
sion
Equ
ipm
ent
17,2
9412
,000
00
4,53
40
00
4,53
4(1
,466
)*
Tele
com
mun
icat
ions
6,71
67,
100
592
592
592
592
592
592
3,55
00
Fund
rais
ing
Cost
s17
,400
19,0
001,
583
1,22
31,
845
1,87
62,
212
1,56
710
,306
806
Rent
32,5
7632
,600
2,65
02,
650
2,65
02,
650
2,65
02,
850
16,1
00(2
00)
Clea
ning
1,40
01,
400
100
100
110
110
110
110
640
(60)
Com
pute
r Con
sum
able
s6,
600
6,00
068
067
651
654
342
562,
450
(550
)
Conf
eren
ces
2,17
42,
500
00
3,20
00
00
3,20
01,
950
*
Gas,
Lig
ht a
nd P
ower
5,56
46,
000
00
1,80
90
01,
303
3,11
211
2
Insu
ranc
e5,
588
6,00
00
6,50
80
00
06,
508
3,50
8 *
Trav
el13
,976
14,0
001,
167
1,23
21,
324
1,31
21,
222
890
7,14
714
7
Prin
ting
6,46
77,
000
583
583
583
583
604
129
3,06
6(4
34)
Phot
ocop
ying
/Sta
tione
ry3,
248
3,50
029
230
452
860
245
254
62,
724
974
Secu
rity
800
800
7575
7590
9090
495
95
Repa
irs a
nd M
aint
enan
ce2,
938
3,50
01,
212
292
00
244
01,
748
(2)
Dues
& S
ubsc
riptio
ns1,
260
1,25
033
00
00
645
120
1,09
547
0
Post
age
and
Frei
ght
1,93
42,
000
167
221
221
186
154
4999
8(2
)
Sund
ries
3,47
61,
250
104
328
487
700
232
423
2,27
41,
649
TOTA
L EX
PEN
DITU
RE37
6,80
041
1,50
030
,974
35,4
3442
,791
34,0
1933
,800
35,4
3021
2,44
86,
698
Surp
lus/
Defic
it11
,409
(3
2,50
0)7,
940
26,7
25
80
10,9
80
(15,
848)
(6,4
00)
23,4
77
39,7
27
*
Her
e th
e Tr
easu
rer h
as fl
agge
d al
l de
vian
ces
from
the
orig
inal
bud
get
that
are
bot
h:
●●
mor
e th
an $
1,00
0 ov
er o
r und
er
budg
et y
ear t
o da
te; a
nd●
●m
ore
than
10%
ove
r or u
nder
bu
dget
yea
r to
date
.
Not
e, to
o, th
at th
ere’
s no
t muc
h po
int d
iscu
ssin
g va
rianc
es in
any
on
e m
onth
unl
ess
you
have
ver
y re
gula
r inc
ome
and
expe
nditu
re
patte
rns
inde
ed.
Not
e, to
o, th
at th
ese
colu
mns
on
ly c
ompa
re y
ou to
you
rsel
f, an
d th
us d
on’t
brin
g up
all
feas
ible
pr
oble
ms.
For
exa
mpl
e, if
you
w
ere
ineffi
cien
t las
t yea
r and
just
as
ineffi
cien
t thi
s ye
ar th
en th
ere’
ll be
no
flag
in th
e ac
coun
ts.
To w
ork
out t
he v
aria
nce,
the
Trea
sure
r of t
he W
alsh
Str
eet
Cent
re h
as d
ivid
ed th
e bu
dget
by
hal
f to
arriv
e at
the
six
mon
thly
bud
get fi
gure
. She
ha
s th
en s
ubtr
acte
d th
e ye
ar
to d
ate
expe
nse
amou
nt fr
om
this
figu
re. T
his
show
s ho
w th
e or
gani
satio
n is
spe
ndin
g th
is y
ear
in c
ompa
rison
to la
st y
ear.
Tip
28
Outcome ReportsAlmost all meeting agendas have a Treasurer’s Report in them somewhere to make sure that the Board is kept up to date with the financials. However, not all meeting agendas have a slot for someone to report on how well the organisation is fulfilling its mission.
By definition, with a not-for-profit organisation, the money isn’t the most important thing about what you’re doing. So making sure that there’s a report every meeting on the deliverables in your strategic plan is just as important.
Ask yourself: How well are we doing what we’re in existence to do?
In order to answer this question, you’ll need to work out the measures that best encapsulate your goals, and you’ll then have to cut them back to the measurements that are most feasible, affordable, and informative.
Unfortunately, while accounting measures are pretty well standardised, outcome measures are different for every group. There are no simple templates that you can download.
You can interpret your work in many ways, at different levels. You can count your outcomes – so many pamphlets distributed, say, or so many meals served, or so many teaching hours. Ultimately, though, that isn’t what you’re interested in, and doesn’t tell you exactly what you need to know. You want to know what your work has achieved – how many people have changed their behaviour because of your pamphlets, or how many people are no longer hungry, or how many people now have new skills, and what, in all these cases, this means for their lives.
Getting that kind of information together is much more informative, and also in general much more expensive in money and resources. You’ll have to make some kind of compromise between what you want to know and what you have to spend.
Here, again, you may be directed by your stakeholders, who also want to know what you’re doing and how well you’re doing it. Funders, too, have to balance the convenience of hard data against the insights to be gained from qualitative research findings.
Monitoring your progress using financial reporting.(continued)
29
You want as much warning as possible that trouble is coming; more than that, you’d like some indication of what kind of trouble it is and what you should do about it. For this purpose, a Balance Sheet or a Financial Statement are too blunt and cover too much ground. To get a more precise diagnosis we turn to specific probes. There are some measures that can help show when your financial affairs are out of balance. One such tool is ratio analysis.
Financial Ratios: what are they?As explained briefly earlier in this Guide, a ratio is the proportion of one important number to another important number. You look at the ratios as well as the raw figures because this enables you to find out how things are shifting within the total picture. Your income may have gone up since last year, and the cost of fundraising may also have gone up; in that case, you’ll need to look at the exact ratio of the two figures in each year, and between years, to see whether you’re going uphill or downhill.
When you’ve been presented with these ratios by your Treasurer, you first look to see if they’re in the danger zone already. If that doesn’t stand out, you then look for the way the ratio is changing over time. Compared with last quarter, or last year, are they getting better or worse? And once you’ve established whether or not there’s cause for concern, does the nature of the problem tell you anything about the course of action you need to take to turn the trend around?
Not all of these are necessarily going to be relevant for your organisation, and there may be other ratios that are more important. If you’re dealing with contracted fundraisers, for example, the ratio between how much of the funds raised goes to you and how much goes to them is crucial – in some states, it’s even regulated. We’re not attempting here to cover all bases, just the ones that fit the most groups.
1. Balance Sheet RatiosOne set of ratios looks at your bottom line and asks how close you are to going out backwards.
Income to Expenditure
Let’s not forget the most obvious ratio of all: a positive balance. You’re not trying to run a surplus for its own sake, but you need to keep going, and over and above that you need extra to enable you to expand and build.
A negative balance isn’t ever absolutely desirable, but it can be the right thing to do regardless. You may want to draw on your reserves to bridge a lean year, or to spend up big to take advantage of a rare opportunity, or to anticipate income that you expect to arrive shortly. It’s never something to take lightly, though, and it should always serve as an extra goal to raise the intensity of your fundraising.
For example, let’s look at the Walsh Street Centre again. The Centre’s income was $388,210 this fiscal year, and their expenditure was $376,800. Therefore the ratio is calculated using the following formula:
388,210 / 376,800 = 1.03 : 1
The ratio of 1.03 (final amount) is positive (i.e. more than one) indicating that the organisation is performing well in this measure. If the Centre was to have a score equaling less than one, this ratio would be a cause for concern. It’s great to have your Treasurer work out the surplus or deficit for the organisation as a whole and of all its component parts. This will give you an idea of how you’re doing as an organisation and which projects are chewing up the majority of your funds.
Assets to Liabilities
You’re not necessarily trying to maximise your equity. You’re a not-for-profit, and the only thing you have to maximise is your mission. However, it’s easier to carry out your mission if you have a little security, and from that point of view it helps to have a cushion.
If, at the bottom of the page, your equity turns out to be negative and your liabilities significantly outweigh your assets, there are obviously questions about your financial viability. This isn’t always trading while insolvent – you may know there’s money
Troubleshooting. What to look for.
30
coming in before your debts have to be paid – but you’re walking on eggshells. And if your Current Assets to Current Liabilities ratio (‘Working Capital Ratio’) is low or negative then you’re really up against it.
If you’re not yet in the danger zone, but if your ratio is heading down when you compare it year-to-year, you’ve still got cause for concern, and need to have a discussion about what’s changed since the last time you checked and what you need to do about it.
Debt to Equity
This ratio measures how much you’ve leveraged your assets. For-profit companies like to leverage their assets by borrowing more against them, thus having a larger pool of money to make money from. This is a handy financial tool in good times and a massive source of risk in bad times. (Leverage works both ways – it increases your profits when you’re making profits, and increases your losses when you’re not.)
2. Asset Management Ratios: EfficiencyAnother set of ratios looks at how you’re employing your money and resources in relation to your goals.
Beneficiaries Surplus to Income
Not all the money you raise can go directly to the people you exist to serve, and there’s nothing wrong with that. You can’t do that work without first setting up the system and the facilities to house them. You have to pay rent and hire staff (and auditors) and pay for pencils and paper and paperclips and all the myriad expenses that gradually add up to real money. Of course, you want to spend as little as possible on all these things, but that’s not nothing.
So what’s the ideal ratio of overheads to actual product? What proportion of the money should be spent up the pointy end, and what should go on administration and fundraising and marketing and PR? There’s no absolute right figure, as of course it varies from organisation to organisation, and situation to situation, but it is important to know where you stand, and, again, how you’re trending.
Net Surplus Margin
The Net Surplus is total income less total expenditure, and it’s the money you have to carry over to the next year (or the deficit that you’ll need to fill from the reserves).
If you were a for-profit, that would be the profit you made and you’d have the choice of reinvesting it or taking it out of the business. Being a not-for-profit you don’t have the second option, so it’s money you have to spend on adding to your services or building up your reserves in case of a bad year.
Funding Streams
If you’re dependent on one income stream, then you can be in trouble if it falls off or cuts out. It’s best to have a balanced fundraising plan that brings in income from donations, public appeals, business partnerships, government and philanthropic grants, your membership, and special events.
Work out what proportion of your income comes from each source, work out how much of your income is under your own control, and keep an eye on your vulnerability to sudden changes of mind.
Troubleshooting What to look for.(continued)
31
3. Asset Management Ratios: ProductivityRatio analysis doesn’t just help you with keeping an eye on your money, it can also be used to show you how efficient you are at performing your mission. While you may not necessarily publish these measures in your Annual Report, it’s important to know for your own management purposes just how you’re tracking.
Income per unit of output
If you know you’re working for a good cause, it’s all too easy to think that’s the end of the story. You actually also need to ask “Given the amount we’re spending on this, could that money be better used for other things?” and “Given there’s unmet need out there, could we be doing more with the same resources?”
To answer those questions you need to look at what it costs you to turn out your product – whatever that is (something you will have already considered in the last section under Outcome Reports).
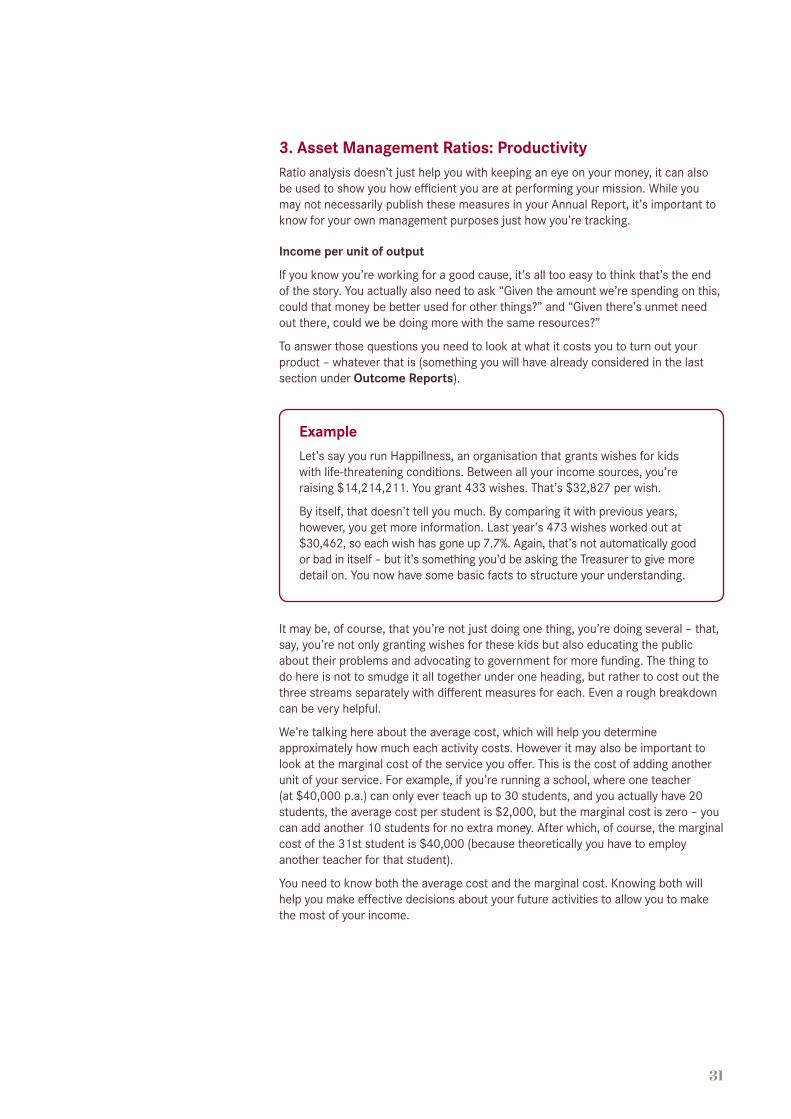
ExampleLet’s say you run Happillness, an organisation that grants wishes for kids with life-threatening conditions. Between all your income sources, you’re raising $14,214,211. You grant 433 wishes. That’s $32,827 per wish.
By itself, that doesn’t tell you much. By comparing it with previous years, however, you get more information. Last year’s 473 wishes worked out at $30,462, so each wish has gone up 7.7%. Again, that’s not automatically good or bad in itself – but it’s something you’d be asking the Treasurer to give more detail on. You now have some basic facts to structure your understanding.
It may be, of course, that you’re not just doing one thing, you’re doing several – that, say, you’re not only granting wishes for these kids but also educating the public about their problems and advocating to government for more funding. The thing to do here is not to smudge it all together under one heading, but rather to cost out the three streams separately with different measures for each. Even a rough breakdown can be very helpful.
We’re talking here about the average cost, which will help you determine approximately how much each activity costs. However it may also be important to look at the marginal cost of the service you offer. This is the cost of adding another unit of your service. For example, if you’re running a school, where one teacher (at $40,000 p.a.) can only ever teach up to 30 students, and you actually have 20 students, the average cost per student is $2,000, but the marginal cost is zero – you can add another 10 students for no extra money. After which, of course, the marginal cost of the 31st student is $40,000 (because theoretically you have to employ another teacher for that student).
You need to know both the average cost and the marginal cost. Knowing both will help you make effective decisions about your future activities to allow you to make the most of your income.

32
Overhead per unit of output
As you’re a not-for-profit, people are also interested in how efficiently you’re employing the funds – what proportion of the money you raise goes to the people you’re trying to help.
ExampleUsing the Happillness example again, let’s say that of that $14,214,211 some $5,716,721 is spent on wishes. The overhead load – the amount that has to be spent to make it all come together – divided by the number of gifts comes out at $19,624, almost exactly the same as last year’s figure.
Note, too, that the cost of raising funds is both significant to you and of interest to the public (and the government); that $14,214,211 cost $5,138,525 to bring in, a ratio of 36% or a return of only $2.76 for every fundraising dollar.
What, then, is the right ratio? As so often, there’s no one right answer. Some causes are harder to sell than others, some environments are worse for fundraising than others, some organisations have to make themselves expensively known for years before the donations start creeping up. Large charitable organisations try to keep their ratios to 10%, or at the most 20%, because they know that the public tend to become mutinous if they think their money is going astray.
Again, in our tables earlier in this Guide we can see that the Walsh Street Centre spends $17,400 on fundraising expenses to bring in $52,790 in donations, a ratio of 33% – disturbingly high, especially when compared to the 12% ratio involved in raising more money the year before. There may well be perfectly good explanations for the deterioration in efficiency, but one would want to know what they were, and one would want to find a way around them for the new financial year.
Income to Assets
Bringing in numbers from two of the tables, how does your annual income compare to your total assets? This is essentially a measure of how well you manage what you have.
ExampleThe Walsh Street Centre, for example, is running a $380,000 business on an asset base of $350,000, a perfectly acceptable ratio of near to unity. If, however, it had net assets of $3,500,000 and was still only spending the same amount, there would be a good argument that the resources could produce more results if invested in another way (if not in another organisation altogether).
Employee Costs
It’s also worth looking at your staffing costs and how they relate to the total picture. How much of your budget goes on staff (Employee Costs to Income)? What does the average (full-time-equivalent, or EFT) staff member cost you (Employee Costs per Employee)? Are you suffering from Seniority Creep, where your average employee is getting older and your salary budget fatter? There’s no one right answer, but you need to keep an eye on it.
Troubleshooting What to look for.(continued)

33
4. Asset Management Ratios: Working Capital Cycle ratiosThere are also other metrics that can help in managing your organisation. Accounts Receivable Turnover (Invoiced Income/Average Accounts Receivable) measures how tight or loose you are in your credit policy with people who owe you money. Accounts Receivable Turn Days (365/Accounts Receivable Turnover) measures how long it takes people to pay their bills to you. Accounts Payable Turnover (Total expenses – Employment Expenses/Average Accounts Payable) measures how fast or slow you are in paying your bills, and Accounts Payable Turn Days (365/Accounts Payable Turnover) measures how long it takes you to pay your bills to other people.
You need to track these things because lending money to people does have risks, and if you’re offering credit that’s basically lending people money. If they’re taking longer to pay their bills then you could have cash flow problems. Again, if you’re taking longer to pay your own bills then that could be a symptom of a number of problems.
While all these ratios are potentially significant and important, you as a Board member only need to be aware of them and delegate the responsibility to somebody else in your organisation, usually the Treasurer or another member of staff. As a Board, you only need to be satisfied that somebody is keeping track (and you may have to make arrangements to check on this periodically).
Financial Ratios: Analysis and Questions to askOnce you’ve worked out a ratio you then have to ask yourself what it signifies. There’s no automatic tick or cross, and every community group has to work out its needs for itself. Even deficits aren’t always bad, and even large asset bases aren’t always good. Finance is only an aid in achieving your mission, and everything has to be measured against whether it advances or retards the mission.
A ratio doesn’t stand alone, of course. You have to compare it to previous years and, if possible, other organisations working in the same field. Map the trend. The trend line is probably more significant than any one measurement.
The table on the next page sketches the broadest of outlines of the questions you should ask yourself depending on how the trends look. It might also prompt a list of questions you could ask your Treasurer.
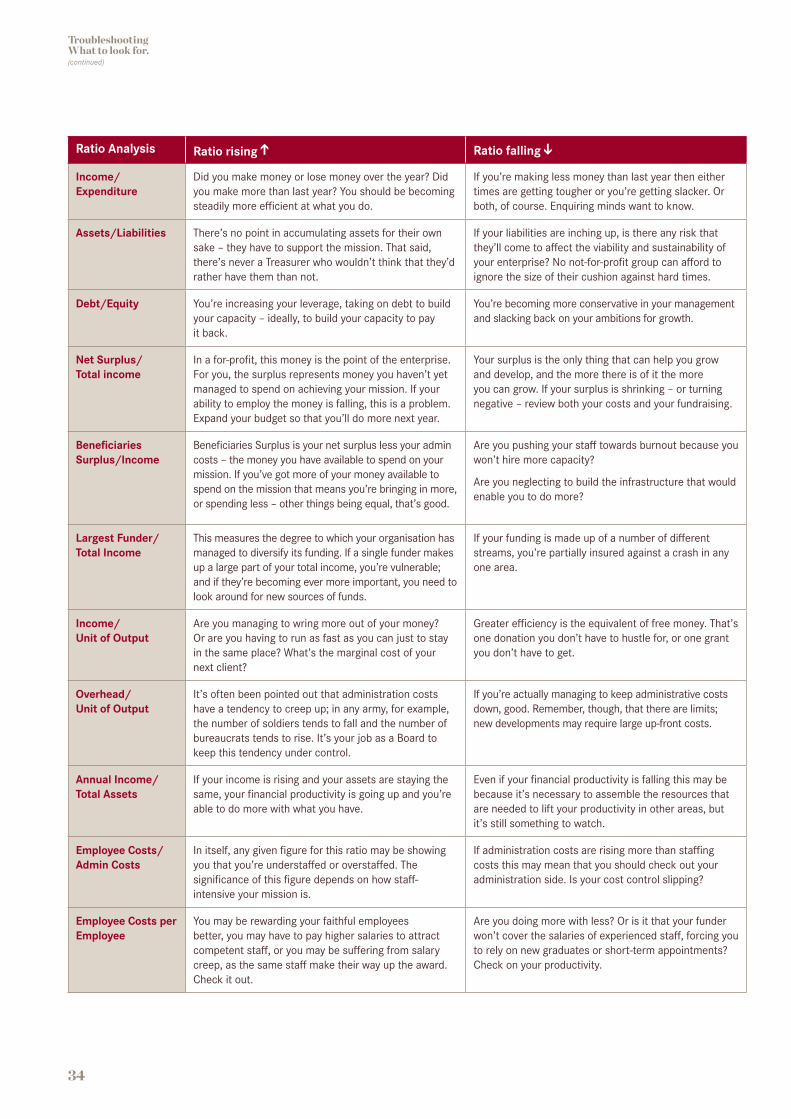
34
Ratio Analysis Ratio rising Ratio falling
Income/Expenditure
Did you make money or lose money over the year? Did you make more than last year? You should be becoming steadily more efficient at what you do.
If you’re making less money than last year then either times are getting tougher or you’re getting slacker. Or both, of course. Enquiring minds want to know.
Assets/Liabilities There’s no point in accumulating assets for their own sake – they have to support the mission. That said, there’s never a Treasurer who wouldn’t think that they’d rather have them than not.
If your liabilities are inching up, is there any risk that they’ll come to affect the viability and sustainability of your enterprise? No not-for-profit group can afford to ignore the size of their cushion against hard times.
Debt/Equity You’re increasing your leverage, taking on debt to build your capacity – ideally, to build your capacity to pay it back.
You’re becoming more conservative in your management and slacking back on your ambitions for growth.
Net Surplus/ Total income
In a for-profit, this money is the point of the enterprise. For you, the surplus represents money you haven’t yet managed to spend on achieving your mission. If your ability to employ the money is falling, this is a problem. Expand your budget so that you’ll do more next year.
Your surplus is the only thing that can help you grow and develop, and the more there is of it the more you can grow. If your surplus is shrinking – or turning negative – review both your costs and your fundraising.
Beneficiaries Surplus/Income
Beneficiaries Surplus is your net surplus less your admin costs – the money you have available to spend on your mission. If you’ve got more of your money available to spend on the mission that means you’re bringing in more, or spending less – other things being equal, that’s good.
Are you pushing your staff towards burnout because you won’t hire more capacity?
Are you neglecting to build the infrastructure that would enable you to do more?
Largest Funder/Total Income
This measures the degree to which your organisation has managed to diversify its funding. If a single funder makes up a large part of your total income, you’re vulnerable; and if they’re becoming ever more important, you need to look around for new sources of funds.
If your funding is made up of a number of different streams, you’re partially insured against a crash in any one area.
Income/ Unit of Output
Are you managing to wring more out of your money? Or are you having to run as fast as you can just to stay in the same place? What’s the marginal cost of your next client?
Greater efficiency is the equivalent of free money. That’s one donation you don’t have to hustle for, or one grant you don’t have to get.
Overhead/ Unit of Output
It’s often been pointed out that administration costs have a tendency to creep up; in any army, for example, the number of soldiers tends to fall and the number of bureaucrats tends to rise. It’s your job as a Board to keep this tendency under control.
If you’re actually managing to keep administrative costs down, good. Remember, though, that there are limits; new developments may require large up-front costs.
Annual Income/Total Assets
If your income is rising and your assets are staying the same, your financial productivity is going up and you’re able to do more with what you have.
Even if your financial productivity is falling this may be because it’s necessary to assemble the resources that are needed to lift your productivity in other areas, but it’s still something to watch.
Employee Costs/Admin Costs
In itself, any given figure for this ratio may be showing you that you’re understaffed or overstaffed. The significance of this figure depends on how staff-intensive your mission is.
If administration costs are rising more than staffing costs this may mean that you should check out your administration side. Is your cost control slipping?
Employee Costs per Employee
You may be rewarding your faithful employees better, you may have to pay higher salaries to attract competent staff, or you may be suffering from salary creep, as the same staff make their way up the award. Check it out.
Are you doing more with less? Or is it that your funder won’t cover the salaries of experienced staff, forcing you to rely on new graduates or short-term appointments? Check on your productivity.
Troubleshooting What to look for.(continued)
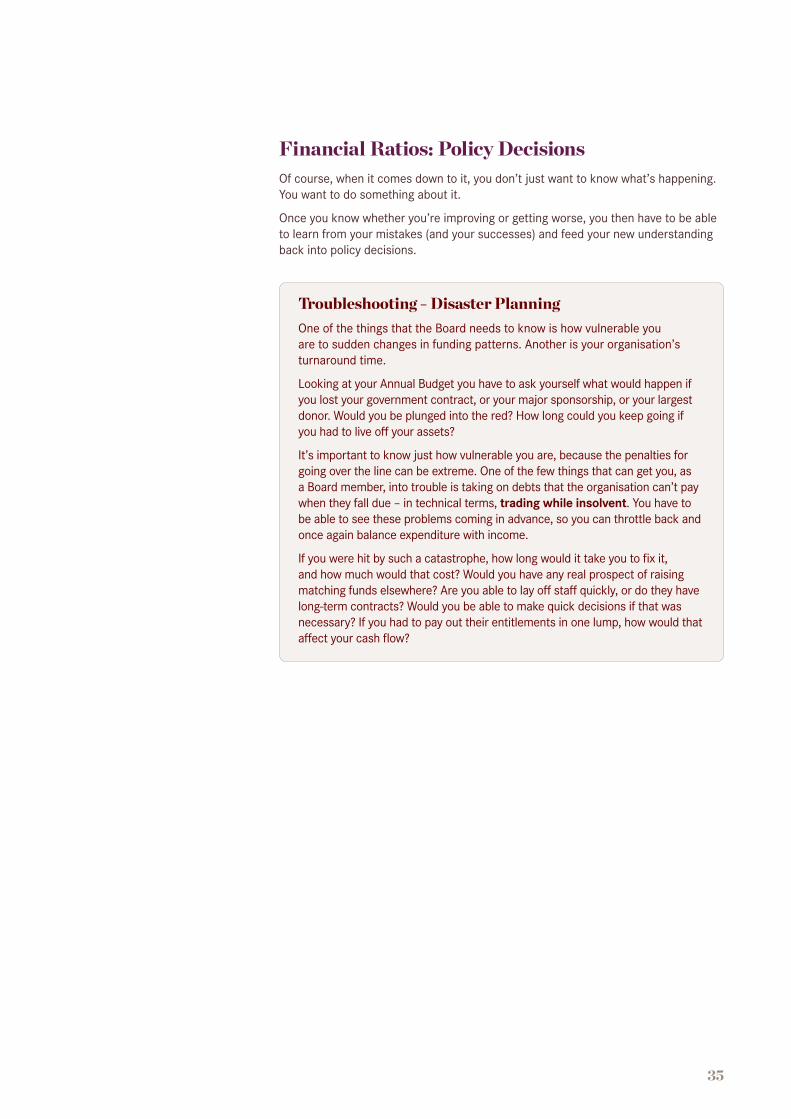
35
Financial Ratios: Policy DecisionsOf course, when it comes down to it, you don’t just want to know what’s happening. You want to do something about it.
Once you know whether you’re improving or getting worse, you then have to be able to learn from your mistakes (and your successes) and feed your new understanding back into policy decisions.
Troubleshooting – Disaster PlanningOne of the things that the Board needs to know is how vulnerable you are to sudden changes in funding patterns. Another is your organisation’s turnaround time.
Looking at your Annual Budget you have to ask yourself what would happen if you lost your government contract, or your major sponsorship, or your largest donor. Would you be plunged into the red? How long could you keep going if you had to live off your assets?
It’s important to know just how vulnerable you are, because the penalties for going over the line can be extreme. One of the few things that can get you, as a Board member, into trouble is taking on debts that the organisation can’t pay when they fall due – in technical terms, trading while insolvent. You have to be able to see these problems coming in advance, so you can throttle back and once again balance expenditure with income.
If you were hit by such a catastrophe, how long would it take you to fix it, and how much would that cost? Would you have any real prospect of raising matching funds elsewhere? Are you able to lay off staff quickly, or do they have long-term contracts? Would you be able to make quick decisions if that was necessary? If you had to pay out their entitlements in one lump, how would that affect your cash flow?
36
The Board has to ●● set the direction of the organisation, through the strategic plan;
●● agree with the ways and means, through the business plan;
●● sign off on the specifics, through the annual budget;
and then through the year ●● ask for explanations of any significant variance from the budget;
●● ask for explanations of any significant variance from projected outcomes;
●● follow up any issues where the explanation doesn’t seem satisfactory; and
●● require remedial measures to be taken where the budget’s going astray.
A Board that’s on top of the finances has the ability to move the organisation towards its mission. Get that started – now.
Last Word: What the Board has to do.

37
Accounts Receivable Money owed by customers (individuals or corporations) to another entity in exchange for goods or services that have been delivered or used, but not yet paid for. Receivables usually come in the form of operating lines of credit and are usually due within a relatively short time period, ranging from a few days to a year.
Accrual Accounting An accounting method that measures the performance and position of a company by recognising economic events regardless of when cash transactions occur; the opposite of Cash Accounting.
Assets Anything that has commercial usefulness or value if sold. An asset may be physical property or items, or enforceable claims against others. Assets include real estate, equipment, cash, investments in stocks and bonds, and any other resource that can be converted into cash.
Balance Sheet see Statement of Financial Position.
Cash Accounting A method of accounting in which income and expense items are recorded and recognised when cash is received or disbursed; the opposite of Accrual Accounting.
Cash Flow Analysis Counts the actual movement of cash. Used to measure cash inflow minus cash outflow. Does not include depreciation, depletion, amortisation, and charges to reserves.
Cash Flow Statement An accounting presentation showing how much of the cash generated by the organisation remains after both expenses (including interest) and principal repayment on financing are paid.
Cash Flow from Financing Activities
This section of the Cash Flow Statement measures the flow of cash between an organisation and its creditors.
Cash Flow from Investing Activities
An item on the Cash Flow Statement that reports the aggregate change in an organisation’s cash position resulting from any gains (or losses) from investments in the financial markets and changes resulting from amounts spent on investments in capital assets such as plant and equipment.
Cash Flow from Operating Activities
The cash that an organisation generates through the running of the organisation.
Commercial Paper Negotiable instruments used in commerce: promissory notes and written agreements setting forth the terms and conditions under which funds are borrowed by a corporation and promising to repay the debt. Commercial Paper is issued by large corporations of good credit standing to borrow unsecured funds for a short time, usually 90 days, but no more than nine months. Commercial Paper is bought, sold, and traded by individual and corporate investors.
Current Assets These include all shifting and changeable assets except material and supplies:
●● cash on hand and deposit ●● loans and bills receivable ●● accounts receivable ●● due from other companies and individuals●● advances to other companies ●● sundry assets.
Deficit The amount by which something (money, for instance) falls short of the required or expected amount. The amount by which liabilities exceed assets. The amount by which expenditures and obligations exceed the amount budgeted for them.
Depreciation The decline in the dollar value of an asset over time and through use.
Glossary.
38
Income and Expenditure Statements
Also known as an Income Statement, a Profit & Loss, or a Statement of Financial Performance, it is a statement that reports revenues, gains and expenses, and the resulting profit or loss of an entity.
Liabilities Debts owed by the organisation such as bank loans or accounts payable.
Liquid Assets Funds that are in the form of cash or can quickly be converted to cash. These include
●● cash ●● demand deposits●● time and savings deposits●● investments capable of being quickly converted into cash without significant loss, either through their sale or through the scheduled return of principal at the end of a short time remaining to maturity.
Net Assets Total Assets less Total Liabilities.
Outcome Reports Reports on your organisation’s success in achieving the goals listed in its strategic plan.
Statement of Financial Activities
Income and Expenditure Statements.
Statement of Financial Position
A financial statement that outlines the sources and uses of funds and explains any changes.
Surplus Amount set aside after paying expenses and after necessary deductions, as for interest, dividends, rentals, taxes, etc.
Trading while Insolvent
An entity that is unable to pay all its debts when they fall due, including paying interest. Directors of entities that are insolvent, or at risk of insolvency, have a duty to prevent trading. Entity’s that either trade, or incur new debt, while insolvent face serious penalties under Australian law.
Treasurer’s Report Financial report to the Board: delivered monthly, quarterly, or at every meeting.
Glossary.(continued)

39
Notes.

40
Notes.


This information has been prepared without taking into account your objectives, financial situation or needs. Because of this you should, before acting on this information, consider its appropriateness, having regard to your objectives, financial situation and needs. Fees and charges apply. Terms and conditions available on request. These may be varied, or new terms and conditions introduced in the future. Westpac Banking Corporation ABN 33 007 457 141 AFSL and Australian credit licence 233714 is the issuer of the products in this brochure. The information in this Guide is current as at 1 September 2017 and is subject to change.
© 2017 Westpac Banking Corporation ABN 33 007 457 141 AFSL and Australian credit licence 233714. WBW583 (08/17)