Embed Size (px)
Citation preview
GTA East – Regional Infrastructure Plan 09 January 2017
GTA East REGIONAL INFRASTRUCTURE PLAN
January 9th
, 2017

GTA East – Regional Infrastructure Plan 09 January 2017
2
[This page is intentionally left blank]

GTA East – Regional Infrastructure Plan 09 January 2017
3
Prepared by:
Hydro One Networks Inc. (Lead Transmitter)
With support from:
Company
Hydro One Networks Inc. (Distribution)
Independent Electricity System Operator
Oshawa PUC Networks Inc.
Veridian Connections Inc.
Whitby Hydro Electric Corporation

GTA East – Regional Infrastructure Plan 09 January 2017
4
DISCLAIMER
This Regional Infrastructure Plan (“RIP”) report was prepared for the purpose of developing an electricity
infrastructure plan to address all near and mid-term needs identified in previous planning phases and also
any additional needs identified based on new and/or updated information provided by the RIP Working
Group.
The preferred solution(s) that have been identified in this report may be reevaluated based on the findings
of further analysis. The load forecast and results reported in this RIP report are based on the information
provided and assumptions made by the participants of the RIP Working Group.
Working Group participants, their respective affiliated organizations, and Hydro One Networks Inc.
(collectively, “the Authors”) make no representations or warranties (express, implied, statutory or
otherwise) as to the RIP report or its contents, including, without limitation, the accuracy or completeness
of the information therein and shall not, under any circumstances whatsoever, be liable to each other, or to
any third party for whom the RIP report was prepared (“the Intended Third Parties”), or to any other third
party reading or receiving the RIP report (“the Other Third Parties”), for any direct, indirect or
consequential loss or damages or for any punitive, incidental or special damages or any loss of profit, loss
of contract, loss of opportunity or loss of goodwill resulting from or in any way related to the reliance on,
acceptance or use of the RIP report or its contents by any person or entity, including, but not limited to,
the aforementioned persons and entities.

GTA East – Regional Infrastructure Plan 09 January 2017
5
[This page is intentionally left blank]

GTA East – Regional Infrastructure Plan 09 January 2017
6
EXECUTIVE SUMMARY
THIS REGIONAL INFRASTRUCTURE PLAN (“RIP”) WAS PREPARED BY HYDRO
ONE NETWORKS INC. (“HYDRO ONE”) AND THE WORKING GROUP IN
ACCORDANCE WITH THE ONTARIO TRANSMISSION SYSTEM CODE
REQUIREMENTS. IT IDENTIFIES INVESTMENTS IN TRANSMISSION
FACILITIES, DISTRIBUTION FACILITIES, OR BOTH, THAT SHOULD BE
DEVELOPED AND IMPLEMENTED TO MEET THE ELECTRICITY
INFRASTRUCTURE NEEDS OF THE GTA EAST REGION.
The participants of the RIP Working Group included members from the following organizations:
Hydro One Networks Inc. (Distribution)
Independent Electricity System Operator
Oshawa PUC Networks Inc.
Veridian Connections Inc.
Whitby Hydro Electric Corporation
Hydro One Networks Inc. (Transmission)
This RIP is the final phase of the OEB’s mandated regional planning process for the GTA East Region
which consists of the Pickering-Ajax-Whitby Sub-Region and the Oshawa-Clarington Sub-Region. It
follows the completion of the GTA East Region’s Needs Assessment (“NA”) in August 2014, the
Oshawa-Clarington Sub-Region’s Local Plan (“LP”) in May 2015, and the Pickering-Ajax-Whitby Sub-
Region’s Integrated Regional Resource Plan (“IRRP”) in June 2016.
This RIP provides a consolidated summary of needs and recommended plans for the entire GTA East
Region that includes the Pickering-Ajax-Whitby Sub-Region and Oshawa-Clarington Sub-Region. The
major transmission and distribution infrastructure investments planned for the GTA East Region over the
near and mid-term, as identified in the regional planning process are given below.
No. Project I/S Date Cost
1 Enfield TS; new 230/44kV station 2019 $34M1
2 Seaton MTS; new 230/27.6/27.6kV station 2019 $43M-$48M2
As per the Regional Planning process, the Regional Plan will be reviewed and/or updated at least once
every five years. Should there be a need that emerges due to a change in load forecast or any other reason,
the next regional planning cycle will be started earlier to address the need.
1 Considers 6x44kV feeder breaker positions initially without capacitor banks
2 Class Environmental Assessment (EA) not complete at time of RIP. Range of costs includes all sites under
consideration – includes transmission line rebuild costs and all station equipment less capacitor banks for
12x27.6kV feeders and a spare transformer.

GTA East – Regional Infrastructure Plan 09 January 2017
7
TABLE OF CONTENTS
Disclaimer ..................................................................................................................................................... 4
Executive Summary ...................................................................................................................................... 6
Table of Contents .......................................................................................................................................... 7
List of Figures ............................................................................................................................................... 8
List of Tables ................................................................................................................................................ 8
1. Introduction .......................................................................................................................................... 10
1.1 Scope and Objectives .................................................................................................................. 11
1.2 Structure...................................................................................................................................... 11
2. Regional Planning Process ................................................................................................................... 12
2.1 Overview .................................................................................................................................... 12
2.2 Regional Planning Process ......................................................................................................... 12
2.3 RIP Methodology ....................................................................................................................... 15
3. Regional Characteristics ....................................................................................................................... 16
3.1 Pickering-Ajax-Whitby Sub-Region .......................................................................................... 16
3.2 Oshawa-Clarington Sub-Region ................................................................................................. 16
4. Transmission Facilities Completed or Currently Underway Over Last Ten Years .............................. 19
5. Forecast And Study Assumptions ........................................................................................................ 20
5.1 Load Forecast ............................................................................................................................. 20
5.2 Other Study Assumptions ........................................................................................................... 21
6. Adequacy of Facilities and Regional Needs ......................................................................................... 22
6.1 500kV and 230kV Transmission Facilities ................................................................................. 23
6.2 Pickering-Ajax-Whitby Sub-Region’s Step-Down Transformer Station Facilities .................... 23
6.3 Oshawa-Clarington Sub-Region’s Step-Down Transformer Station Facilities .......................... 24
7. Regional Plans ...................................................................................................................................... 25
7.1 Increase Transformation Capacity in Pickering-Ajax-Whitby Sub-Region ............................... 25
7.2 Increase Transformation capacity in Oshawa-Clarington Sub-Region ...................................... 27
7.3 GTA East Load Restoration Assessment .................................................................................... 28
7.4 Short Circuit Constraint at Cherrywood TS T7/T8 .................................................................... 29
7.5 Long Term Regional Plan ........................................................................................................... 30
8. Conclusion and Next Steps ................................................................................................................... 31
9. References ............................................................................................................................................ 33
Appendices .................................................................................................................................................. 34
Appendix A: Stations in the GTA East Region .................................................................................... 34
Appendix B: Transmission Lines in the GTA East Region .................................................................. 35
Appendix C: Non-Coincident Load Forecast 2016-2025 ..................................................................... 36
Appendix D: Coincident Load Forecast 2016-2025 ............................................................................. 38
Appendix E: List of Acronyms............................................................................................................. 39
Appendix F: GTA East Load Restoration Report ................................................................................ 40

GTA East – Regional Infrastructure Plan 09 January 2017
8
List of Figures
Figure 1-1 GTA East Region ...................................................................................................................... 10
Figure 2-1 Regional Planning Process Flowchart ....................................................................................... 14
Figure 2-2 RIP Methodology ...................................................................................................................... 15
Figure 3-1 GTA East Region – Supply Areas ............................................................................................. 17
Figure 3-2 GTA East Region Single Line Diagram .................................................................................... 18
Figure 5-1 GTA East Region Coincident Net Load Forecast ..................................................................... 20
Figure 7-1 Seaton MTS: Proposed Construction Sites ............................................................................... 26
Figure 7-2 Enfield TS: Proposed Construction Site .................................................................................... 28
List of Tables
Table 6-1 Near and Mid-Term Needs in the GTA East Region ................................................................. 22
Table 6-2 Step-Down Transformer Stations in Pickering-Ajax-Whitby Sub-Region ................................ 23
Table 6-3 Transformation Capacities in the Pickering-Ajax-Whitby Sub-Region ..................................... 23
Table 6-4 Step-Down Transformer Stations in Oshawa-Clarington Sub-Region ....................................... 24
Table 6-5 Transformation Capacities in the Oshawa-Clarington Sub-Region ........................................... 24
Table 8-1: Regional Plans – Needs Identified in the Regional Planning Process ....................................... 31
Table 8-2: Regional Plans – Projects, Lead Responsibility, and Planned In-Service Dates ....................... 31

GTA East – Regional Infrastructure Plan 09 January 2017
9
[This page is intentionally left blank]

GTA East – Regional Infrastructure Plan 09 January 2017
10
1. INTRODUCTION
THIS REPORT PRESENTS THE REGIONAL INFRASTRUCTURE PLAN
(“RIP”) TO ADDRESS THE ELECTRICITY NEEDS OF THE GTA EAST
REGION.
The report was prepared by Hydro One Networks Inc. (“Hydro One”) and documents the results of the
study with input and consultation with Hydro One Distribution, Oshawa PUC Networks Inc. (“OPUCN”),
Veridian Connections Inc. (“Veridian”), Whitby Hydro Electric Corporation (“Whitby Hydro”) and the
Independent Electricity System Operator (“IESO”) in accordance with the Regional Planning process
established by the Ontario Energy Board (“OEB”) in 2013.
The GTA East Region comprises the municipalities of Pickering, Ajax, Whitby, Oshawa, and Clarington.
Electrical supply to the Region is provided through 500/230kV autotransformers at Cherrywood
Transformer Station (“TS”) and five3 230kV transmission lines that supply the four local area step-down
transformer stations. The boundaries of the Region are shown in Figure 1-1 below.
Figure 1-1 GTA East Region
3 Including 230kV circuit C28C (T28C with Clarington TS) which extends 2km north from Cherrywood TS to
Duffin Jct. and then extends 26km east to be terminated at Clarington TS in 2018

GTA East – Regional Infrastructure Plan 09 January 2017
11
1.1 Scope and Objectives
This RIP report examines the needs in the GTA East Region. Its objectives are to:
Identify new supply needs that may have emerged since previous planning phases (e.g., Needs
Assessment, Scoping Assessment, Local Plan, and/or Integrated Regional Resource Plan);
Assess and develop a wires plans to address these needs;
Provide the status of wires planning currently underway or completed for specific needs;
Identify investments in transmission and distribution facilities or both that should be developed
and implemented on a coordinated basis to meet the electricity infrastructure needs within the
region.
The RIP reviews factors such as the load forecast, transmission and distribution system capability along
with any updates with respect to local plans, conservation and demand management (“CDM”), renewable
and non-renewable generation development, and other electricity system and local drivers that may
impact the need and alternatives under consideration.
The scope of this RIP is as follows:
A consolidated report of the needs and relevant plans to address near and mid-term needs (2016-
2025) identified in previous planning phases (Needs Assessment, Scoping Assessment, Local
Plan or Integrated Regional Resource Plan);
Identification of any new needs over the 2016-2025 period and a wires plan to address them;
Consideration of long-term needs identified in the Pickering-Ajax-Whitby Sub-Region IRRP
As per the Regional Planning process, the Regional Plan for the region will be reviewed and/or updated at
least every five years. Should there be a need that emerges due to a change in load forecast or any other
reason, the next regional planning cycle will be started earlier to address the need.
1.2 Structure
The rest of the report is organized as follows:
Section 2 provides an overview of the regional planning process
Section 3 describes the regional characteristics
Section 4 describes the transmission work completed over the last ten years
Section 5 describes the load forecast and study assumptions used in this assessment
Section 6 describes the results of the adequacy assessment of the transmission facilities and
identifies the regional needs
Section 7 describes the needs and provides the alternatives and preferred solutions
Section 8 provides the conclusion and next steps

GTA East – Regional Infrastructure Plan 09 January 2017
12
2. REGIONAL PLANNING PROCESS
2.1 Overview
Planning for the electricity system in Ontario is done at essentially three levels: bulk system planning,
regional system planning, and distribution system planning. These levels differ in the facilities that are
considered and the scope of impact on the electricity system. Planning at the bulk system level typically
looks at issues that impact the system on a provincial level, while planning at the regional and distribution
levels looks at issues on a more regional or localized level.
Regional planning looks at supply and reliability issues at a regional or local area level. Therefore,
it largely considers the 115kV and 230kV portions of the power system that supply various parts of
the province.
2.2 Regional Planning Process
A structured regional planning process was established by the Ontario Energy Board (“OEB”) in 2013
through amendments to the Transmission System Code (“TSC”) and Distribution System Code (“DSC”).
The process consists of four phases: the Needs Assessment4 (“NA”), the Scoping Assessment (“SA”), the
Integrated Regional Resource Plan (“IRRP”), and the Regional Infrastructure Plan (“RIP”).
The regional planning process begins with the NA phase, which is led by the transmitter to determine if
there are regional needs. The NA phase identifies the needs and the Working Group determines whether
further regional coordination is necessary to address them. If no further regional coordination is required,
and needs are local in nature, an assessment is undertaken for any necessary investments directly by the
LDCs (or customer) and the transmitter through a Local Plan (“LP”). These needs are local in nature and
can be best addressed by a straight forward wires solution. The Working Group recommends a LP
undertaking when needs are a) local in nature b) limited investments of wires (transmission or
distribution) solutions c) does not require upstream transmission investments d) does not require plan
level stakeholder engagement and e) other approvals such as Leave to Construct (S92) application or
Environmental Approval.
In situations where identified needs require coordination at the regional or sub-regional levels, the IESO
initiates the SA phase. During this phase, the IESO, in collaboration with the transmitter and impacted
LDCs, reviews the information collected as part of the NA phase, along with additional information on
potential non-wires alternatives, and makes a decision on the most appropriate regional planning
approach. If there are needs that do not required regional coordination, Working Group can recommend
them to be undertaken as part of the LP approach discussed above. Else, the approach is either a RIP,
which is led by the transmitter, or an IRRP, which is led by the IESO. If more than one sub-region was
identified in the NA phase, it is possible that a different approach could be taken for different sub-regions.
4 Also referred to as Needs Screening.

GTA East – Regional Infrastructure Plan 09 January 2017
13
The IRRP phase will generally assess infrastructure (wires) versus resource (CDM and Distributed
Generation) options at a higher or more macro level, but sufficient to permit a comparison of options. If
the IRRP phase identifies that infrastructure options may be most appropriate to meet a need, the RIP
phase will conduct detailed planning to identify and assess the specific wires alternatives and recommend
a preferred wires solution. Similarly, resource options that the IRRP identifies as best suited to meet a
need are then further planned in greater detail by the IESO. The IRRP phase also includes IESO led
stakeholder engagement with municipalities and establishes a Local Advisory Committee (“LAC”) in the
region or sub-region.
The RIP phase is the final stage of the regional planning process and involves: confirmation of previously
identified needs; identification of any new needs that may have emerged since the start of the planning
cycle; and development of a wires plan to address the needs where a wires solution would be the best
overall approach. This phase is led and coordinated by the transmitter and the deliverable of this stage is a
comprehensive report of a wires plan for the region. Once completed, this report can be referenced in rate
filing submissions or as part of LDC rate applications with a planning status letter provided by the
transmitter. Reflecting the timelines provisions of the RIP, plan level stakeholder engagement is not
undertaken at this stage. However, stakeholder engagement at a project specific level will be conducted as
part of the project approval requirement.
To efficiently manage the regional planning process, Hydro One has been undertaking wires planning
activities in collaboration with the IESO and LDCs for the region as part of and/or in parallel with:
Planning activities that were already underway in the region prior to the new regional planning
process taking effect;
The NA, SA, and LP phases of regional planning;
Participating in and conducting wires planning as part of the IRRP for the region or sub-region.
Figure 2-1 illustrates the various phases of the regional planning process (NA, SA, IRRP, and RIP) and
their respective phase trigger, lead, and outcome.

GTA East – Regional Infrastructure Plan 09 January 2017
14
Figure 2-1 Regional Planning Process Flowchart

GTA East – Regional Infrastructure Plan 09 January 2017
15
2.3 RIP Methodology
The RIP phase consists of a four step process (see Figure 2-2) as follows:
1. Data Gathering: The first step of the process is the review of planning assessment data collected in the
previous stages of the regional planning process. Hydro One collects the following information and
reviews it with the Working Group to reconfirm or update the information as required.
Net peak demand forecast at the transformer station level. This includes the effect of any
distributed generation (“DG”) or CDM programs;
Existing area network and capabilities including any bulk system power flow assumptions;
Other data and assumptions as applicable such as asset conditions, load transfer capabilities, and
previously committed transmission and distribution system plans.
2. Technical Assessment: The second step is a technical assessment to review the adequacy of the
regional system including any previously identified needs. Additional near and mid-term needs may
be identified at this stage.
3. Alternative Development: The third step is the development of wires options to address the needs and
to come up with a preferred alternative based on an assessment of technical considerations,
feasibility, environmental impact, and costs.
4. Implementation Plan: The fourth and last step is the development of the implementation plan for the
preferred alternative.
Figure 2-2 RIP Methodology
GTA East – Regional Infrastructure Plan 09 January 2017
16
3. REGIONAL CHARACTERISTICS
THE GTA EAST REGION IS COMPRISED OF THE PICKERING-AJAX-
WHITBY SUB-REGION AND THE OSHAWA-CLARINGTON SUB-REGION.
ELECTRICAL SUPPLY TO THE REGION IS PROVIDED FROM FOUR 230KV
STEP-DOWN TRANSFORMER STATIONS. THE 2015 SUMMER PEAK AREA
LOAD OF THE REGION WAS APPROXIMATELY 938.5 MW INCLUDING
DIRECT TRANSMISSION-CONNECTED CUSTOMERS.
Bulk electrical supply to the GTA East Region is currently provided through Cherrywood TS, a major
500/230kV autotransformer station in the City of Pickering, and five 230kV circuits emanating east from
Cherrywood TS that supply four local area step-down transformer stations and four other direct
transmission connected load customers. Major generation in the area includes the Pickering Nuclear
Generating Station (“NGS”) which consists of six generating units with a combined output of
approximately 3000 MW and is connected to the 230kV system at Cherrywood TS.
The August 2014 GTA East Region NA report, prepared by Hydro One, considered the GTA East Region
as a whole. Subsequently, the GTA East Region was divided into two sub-regions, Pickering-Ajax-
Whitby Sub-Region and Oshawa-Clarington Sub-Region. The IRRP report focused on the needs in the
Pickering-Ajax-Whitby Sub-Region. The May 2015 Oshawa-Clarington Sub-Region LP report focused
solely on the Oshawa-Clarington Sub-Region. A map of the GTA East Region is shown in Figure 3-1 and
a single line diagram of the transmission system is shown in Figure 3-2.
3.1 Pickering-Ajax-Whitby Sub-Region
The Pickering-Ajax-Whitby Sub-Region comprises primarily the City of Pickering, Town of Ajax, part of
the Town of Whitby, and part of the Townships of Uxbridge and Scugog. It is supplied by Cherrywood
TS, a 500/230kV autotransformer station, two 230kV transformer stations, namely Cherrywood TS
DESN and Whitby TS (2 DESNs), that step down the voltage to 44kV and 27.6kV. The LDCs supplied in
the Sub-Region are Hydro One Distribution, Veridian, and Whitby Hydro.
3.2 Oshawa-Clarington Sub-Region
The Oshawa-Clarington Sub-Region comprises primarily the City of Oshawa, part of the Municipality of
Clarington, part of Whitby, and part of the Township of Scugog. It is supplied by Cherrywood TS, a
500/230kV autotransformer station, two 230kV transformer stations, namely Wilson TS (2 DESNs) and
Thornton TS, that step down the voltage to 44kV, and four other direct transmission connected load
customers. Local generation in the area consists of the 60 MW Whitby Customer Generating Station
(“CGS”), a gas-fired cogeneration facility that connects to 230kV circuit H26C. Thornton TS also
supplies some load within the Pickering-Ajax-Whitby Sub-Region. The LDCs supplied in the Sub-Region
are Whitby Hydro, Hydro One Distribution, and OPUCN.

GTA East – Regional Infrastructure Plan 09 January 2017
17
A new 500/230kV autotransformer station in the GTA East Region within the township of Clarington
(called Clarington TS) is also being developed and is expected to be in-service in 2018. The new
Clarington TS will provide additional load meeting capability in the Region and will eliminate the
overloading of Cherrywood autotransformers that may result after the retirement of the Pickering NGS.
The new autotransformer station will consist of two 750MVA, 500/230kV autotransformers and a 230kV
switchyard. The autotransformers will be supplied from two 500kV circuits that pass next to the proposed
site. The 230kV circuits supplying the east GTA will be terminated at Clarington TS. Clarington TS will
become the principal supply source for the GTA East Region load.
A single line diagram of the GTA East Region transmission system including the connection of
Clarington TS is shown in Figure 3-2.
Figure 3-1 GTA East Region – Supply Areas

GTA East – Regional Infrastructure Plan 09 January 2017
18
GTA EAST: PICKERING-AJAX-WHITBY SUB-REGION GTA EAST: OSHAWA-CLARINGTON SUB-REGION
CHERRYWOOD TS
T26C (H26C)T24C (H24C)
T29C (M29C)
T23C (B23C)
T28C (C28C)
T24C (H24C)
T29C (M29C)
T23C (B23C)
T26C (H26C)
PET
ERB
OR
OU
GH
TO
KIN
GST
ON
R
EGIO
N
WHITBY TS
CTS A
CGS D
CTS B
CTS C
COLUMBUS JCT
T1/T2
WILSON TS
Existing 230kV
Legend
T3/T4
To Pickering NGS (8 Circuits)
CLARINGTON TS
MET
RO
TO
RO
NTO
REG
ION
T3/T4 T1/T2
THORNTON TS
T24
C (
H2
4C
)
T3/T4
T28C (C28C)
SEATON MTS
C10A
ENFIELD TS
T7/T8
T1/T2
Proposed 230kV
DUFFIN JCT
T26
C (
H2
6C
)
Figure 3-2 GTA East Region Single Line Diagram
Note: Current circuit designations (before Clarington TS is in-service) are provided in brackets

GTA East – Regional Infrastructure Plan 09 January 2017
19
4. TRANSMISSION FACILITIES COMPLETED OR
CURRENTLY UNDERWAY OVER LAST TEN
YEARS
OVER THE LAST 10 YEARS A NUMBER OF TRANSMISSION PROJECTS
HAVE BEEN COMPLETED, OR ARE UNDERWAY, AIMED AT IMPROVING
THE SUPPLY TO THE GTA EAST REGION.
A brief listing of the developed projects along with their in-service dates over the last 10 years is given
below:
Whitby TS T1/T2 (2009) – built new step-down transformer station supplied from 230kV circuits
H24C and H26C in municipality of Whitby to increase transformation capacity for Whitby Hydro and
Veridian requirements.
Installed LV neutral grounding reactors at Wilson TS T1/T2 DESN1 (2015) – to reduce line-to-
ground short circuit fault levels to facilitate DG connections.
Thornton TS T3/T4 transformer replacements and install LV neutral grounding reactors (2016) – to
replace end-of-life transformers and reduce line-to-ground short circuit fault levels to facilitate DG
connections.
The following development projects are currently underway:
Clarington TS (2018) – a 500/230kV autotransformer station at the Oshawa Area Jct. to increase
transmission supply capacity to the GTA East Region, eliminate the overloading of Cherrywood TS
autotransformers that may result after the retirement of Pickering NGS, and improve supply reliability
to the Region. The thermal limits of the 230kV circuits supplying the Region will be upgraded
and will be terminated at Clarington TS.
Seaton MTS (2019) – a 230/27.6/27.6kV municipal transformer station to increase supply capacity in
the Pickering-Ajax-Whitby Sub-Region and provide relief to Whitby TS 27.6kV following the
development of new community of Seaton. The station will be serviced by two parallel 230kV
circuits, C10A and C28C, emanating from Cherrywood TS. C10A will be extended eastward from
Duffin Jct. to the site of the station.
Enfield TS (2019) – a 230/44kV DESN to increase supply capacity in the Oshawa-Clarington Sub-
Region and provide relief to Wilson TS. This station will be located at the Oshawa Area Jct. and will
be directly connected to Clarington TS 230kV bus.

GTA East – Regional Infrastructure Plan 09 January 2017
20
5. FORECAST AND STUDY ASSUMPTIONS
5.1 Load Forecast
The load in the GTA East Region is expected to increase at an annual rate of approximately 2% between
2016 and 2025. The growth rate varies across the Region but an overall coincident growth in the Region
is illustrated in Figure 5-1. The gross and net non-coincident and coincident load forecast, adjusted for
extreme weather, CDM, and DG, for each station in the region are provided in Appendix C and D.
Figure 5-1 GTA East Region Coincident Net Load Forecast
Prior to the RIP’s kick-off, the Working Group were asked to confirm load forecast for all stations in the
Region provided for previous assessments. The RIP’s load forecast for Pickering-Ajax-Whitby Sub-
Region did not have a significant revision compared to the IRRP’s load forecast. However, the revised
forecasted non-coincident stations’ peaks for Wilson TS and Thornton TS in the Oshawa-Clarington Sub-
Region had a significant increase; therefore, the needs identified in previous assessments were
reconfirmed.

GTA East – Regional Infrastructure Plan 09 January 2017
21
5.2 Other Study Assumptions
Further assumptions are as follows:
The study period for the RIP assessment is 2016 – 2025.
Pickering NGS is assumed to be out-of-service by 2024.
Summer is the critical period with respect to line and transformer loadings. The assessment is
therefore based on extreme summer peak loads.
Station capacity adequacy is assessed by comparing the peak load with the station’s normal
planning supply capacity assuming a 90% lagging power factor for stations having no low-
voltage capacitor banks and 95% lagging power factor for stations having low-voltage capacitor
banks. Normal planning supply capacity for transformer stations in this region is determined by
the summer 10-Day Limited Time Rating (“LTR”).

GTA East – Regional Infrastructure Plan 09 January 2017
22
6. ADEQUACY OF FACILITIES AND REGIONAL
NEEDS
THIS SECTION REVIEWS THE ADEQUACY OF THE EXISTING
TRANSMISSION AND STEP DOWN TRANSFORMATION STATION
FACILITIES SUPPLYING THE GTA EAST REGION AND LISTS THE
FACILITIES REQUIRING REINFORCEMENT OVER THE NEAR AND MID-
TERM PERIOD.
Within the current regional planning cycle, three regional assessments have been conducted for the GTA
East Region. The findings of these studies are input to the RIP:
1. IESO’s Pickering-Ajax-Whitby Sub-Region Integrated Regional Resource Plan – June 30, 2016[1]
2. Hydro One’s Oshawa-Clarington Sub-Region Local Planning Report – May 15, 2015[2]
3. Hydro One’s GTA East Region Needs Assessment Report – August 11, 2014[3]
The IRRP, NA, and LP studies identified a number of regional needs based on the forecast load demand
over the near to mid-term. A detailed description and status of plans to meet these needs is given in
Section 7.
Based on the regional growth rate referred to in Section 5, this RIP reviewed the loading on transmission
lines and stations in the GTA East Region assuming Clarington TS will be in-service by 2018, Seaton
MTS and Enfield TS by 2019, and Pickering NGS out-of-service between 2018 and 2024.
Sections 6.1 – 6.3 present the results of this review and Table 6-1 lists the Region’s near to mid-term
needs identified in both the IRRP and RIP phases.
Table 6-1 Near and Mid-Term Needs in the GTA East Region
Type Section Needs Timing
Step-down Transformation
Capacity
7.1
Additional transformation capacity for
Whitby TS T1/T2 27.6kV in Pickering-
Ajax-Whitby Sub-Region
2019
7.2
Additional transformation capacity for
Wilson TS T1/T2 & T3/T4 in Oshawa-
Clarington Sub-Region
Immediately
Load Restoration 7.3 Load Restoration for loss of B23C/M29C
or H24C/H26C
No action required at
this time
Short Circuit Constraint 7.4 Short Circuit Constraint at Cherrywood TS
T7/T8 Pending outcome
GTA East – Regional Infrastructure Plan 09 January 2017
23
6.1 500kV and 230kV Transmission Facilities
The GTA East Region is comprised of five 230kV circuits, B23C/M29C, H24C/H26C, and C28C,
supplying both the Pickering-Ajax-Whitby Sub-Region and the Oshawa-Clarington Sub-Region. Refer to
Figure 3-2 for existing and proposed facilities to be operational in the Region in near future.
Bulk system planning is conducted by the IESO and is informed by government policy such as the long
term energy plan (“LTEP”). The next LTEP is expected to be issued in 2017. Any outcomes from this
level of planning that impact regional planning are expected to be integrated into the respective regions as
necessary.
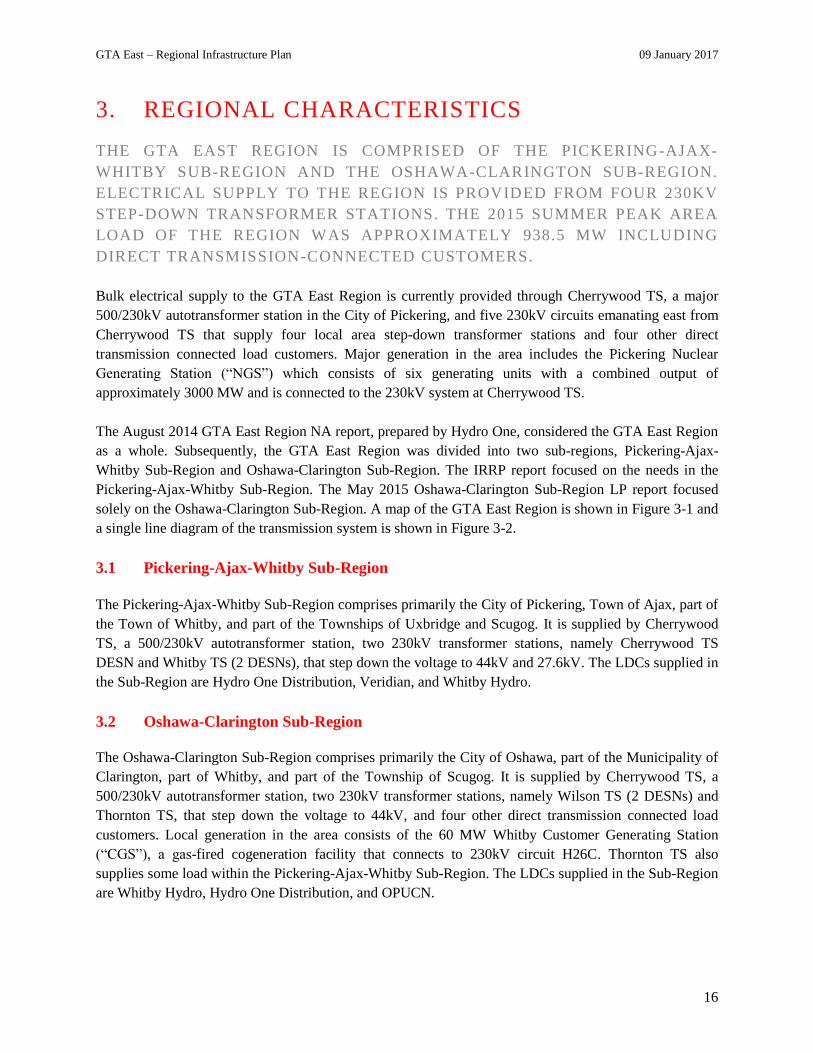
6.2 Pickering-Ajax-Whitby Sub-Region’s Step-Down Transformer Station Facilities
There are two step-down transformer stations in the Pickering-Ajax-Whitby Sub-Region as follows:
Table 6-2 Step-Down Transformer Stations in Pickering-Ajax-Whitby Sub-Region
Station DESN Voltage Transformation
Cherrywood TS T7/T8 230/44kV
Whitby TS T1/T2 230/44/27.6kV
T3/T4 230/44kV
Based on the LTR of these load stations, additional 27.6kV capacity is required at Whitby TS T1/T2 in
2019 which will be addressed by the proposed Seaton MTS (see details in Section 7.1). Cherrywood TS
T7/T8 may be slightly overloaded initially, however, due to CDM and commissioning of Seaton MTS,
the capacity need is expected to be eliminated by 2019. Forecast loads at Whitby TS T1/T2 44kV
windings, and Whitby TS T3/T4 44kV windings are adequate over the study period.
The stations’ actual non-coincident peaks, the associated station capacity, and need dates are summarized
in Table 6-3.
Table 6-3 Transformation Capacities in the Pickering-Ajax-Whitby Sub-Region
Station LTR (MW) 2015 Summer Peak (MW) Relief Required By
Cherrywood TS T7/T8 44kV 175 156 -
Whitby TS T1/T2 27.6kV 90 41 2019
Whitby TS T1/T2 44kV 90 56 -
Whitby TS T3/T4 44kV 187 161 -

GTA East – Regional Infrastructure Plan 09 January 2017
24
6.3 Oshawa-Clarington Sub-Region’s Step-Down Transformer Station Facilities
There are two step-down transformer stations and four direct-connected customers in the Oshawa-
Clarington Sub-Region as follows:
Table 6-4 Step-Down Transformer Stations in Oshawa-Clarington Sub-Region
Station DESN Voltage Transformation
Wilson TS T1/T2 230/44kV
T3/T4 230/44kV
Thornton TS T3/T4 230/44kV
Industrial Customer TS x4 - -
Based on the LTR of these load stations, additional 44kV capacity is immediately required to provide
relief to Wilson TS. Under certain conditions, overloading at Wilson TS T3/T4 was significant enough to
plan for emergency rotating load shedding, if and when required. Plan to address this need is discussed
further in Section 7.2. Thornton TS is adequate to meet the net demand over the study period.
The stations’ actual non-coincident peaks, the associated station capacity, and need dates are summarized
in Table 6-5.
Table 6-5 Transformation Capacities in the Oshawa-Clarington Sub-Region
Station LTR (MW) 2015 Summer Peak (MW) Relief Required By
Wilson TS T1/T2 44kV 161 167 Immediately
Wilson TS T3/T4 44kV 133 146 Immediately
Thornton TS T3/T4 44kV 159 126 -
The non-coincident and coincident load forecast for all stations in the Region is given in Appendix C and
Appendix D, respectively.

GTA East – Regional Infrastructure Plan 09 January 2017
25
7. REGIONAL PLANS
This section discusses the needs, wires alternatives and the current preferred wires solution for addressing
the electrical supply needs in the GTA East Region. These needs are listed in Table 6-1 and include needs
previously identified in the IRRP for the Pickering-Ajax-Whitby Sub-Region and the NA and LP for the
Oshawa-Clarington Sub-Region. Needs for which work is already underway are also included.
The near-term needs include needs that arise over the first five years of the study period (2016 to 2020)
and the mid-term needs cover the second half of the study period (2021-2025).
7.1 Increase Transformation Capacity in Pickering-Ajax-Whitby Sub-Region
Description
The Pickering-Ajax-Whitby Sub-Region is supplied by Cherrywood TS at 44kV level and Whitby TS at
27.6kV and 44kV levels. Over the next 10 years, the load in this Sub-Region is forecasted to increase at
approximately 2.1% annually.
Based on the DG and CDM forecasts in the Sub-Region, adequate 44kV transformation capacity is
available at Cherrywood TS T7/T8 and Whitby TS to maintain reliable supply to meet the demand over
the study period.
With the proceeding of a new residential and mixed use commercial area in the Sub-Region, called
Seaton, significant increase in load demand is expected at 27.6kV level resulting in a shortage
transformation capacity by 2019. The gross demand in the new development of Seaton is expected to be
88MW at the end of the study period (2025) and will continue to grow over long term period. The growth
resulting from Seaton will have a significant impact on the 27.6kV transformation capacity in the Sub-
Region.
Recommended Plan and Current Status
During the regional planning process, the Working Group considered multiple alternatives to address the
transformation capacity in the Sub-Region. Preference was given to already existing facilities to ensure
system’s maximum capacity had been considered in line with the future demand. Other alternatives
included CDM, local generation, and transmission & distribution facilities.
After considering estimated DG and CDM targets over the study period, the stations’ capacities in the
Sub-Region can be relieved to a certain extent. However, existing facilities alone will not be adequate to
meet the future demand resulting from the new Seaton community load planned to be supplied at 27.6kV
level.
As a result, an investment in wires infrastructure development in the Sub-Region is mandatory to connect
and supply the development of Seaton via transmission/distribution facilities. Following the completion
of the IRRP, the Working Group recommended Seaton MTS as the best solution to meet the

GTA East – Regional Infrastructure Plan 09 January 2017
26
transformation capacity need in the Sub-Region. Veridian Connections Inc. and Hydro One Networks Inc.
have jointly submitted an EA application for the proposed station site and related 230kV transmission line
work. Consistent with the regional planning studies, Veridian Connections Inc. is developing a plan for a
new transformation station called Seaton MTS in northern Pickering. As confirmed by Veridian, the in-
service timeline of this transformation station has been deferred to 2019 due to revised 2018 load forecast.
Class Environmental Assessment (EA) is in progress for the three potential construction sites for Seaton
MTS illustrated in Figure 7-1.
Figure 7-1 Seaton MTS: Proposed Construction Sites
The project will have the following connection arrangement:
From Duffin Jct, extend the circuit C10A east to proposed location under EA process
Connect 2x75/125MVA, 230/27.6/27.6kV transformers to 230kV circuits; C10A and T28C5
Supply 12x27.6kV feeders with a normally open tie-breaker configuration
The total cost of this project is estimated to be $43M – $48M. This estimate includes the cost of
transmission as well as distribution investments which include the station’s construction, its connection
5 T28C circuit nomenclature to replace C28C following Clarington TS (2018)

GTA East – Regional Infrastructure Plan 09 January 2017
27
arrangements as defined above, feeder egress to the distribution risers outside of the station, and a spare
transformer.
7.2 Increase Transformation capacity in Oshawa-Clarington Sub-Region
Description
The load forecast reflects an annual growth of 1.85% in Oshawa and Clarington area throughout the study
period. Based on the 2015 historical demand and station’s net demand forecast, Wilson TS T1/T2 and
T3/T4 have already exceeded their respective normal supply capacities and will continue to do so over the
study period. Overloading at Wilson TS T3/T4 has been significant enough that plans were put in place
for emergency rotating load shedding, if and when required. Thornton TS may briefly exceed its
transformation capacity in 2018 and 2019 but is adequate over the study period as well as long term
period due to CDM contributions and distribution load transfer capability.
Therefore, based on the current load forecasts, additional transformation capacity relief is required for
Wilson TS to accommodate the load growth and improve reliability in this sub-region.
Recommended Plan and Current Status
To accommodate the load growth of Hydro One Distribution’s and OPUCN’s feeders at Wilson TS, a
new transformer station, Enfield TS, is recommended to relief the transformation capacity. The proposed
transformer options to be evaluated for the DESN are as follows:
1. 2x75/125MVA, 230/44kV transformers with 6x44kV feeder breaker positions, with space for
future 2x44kV feeder positions and capacitor banks (Preliminary Cost Estimate: $23 million)
2. 2x75/125MVA, 230/44kV transformers with 8x44kV feeder breaker positions (Preliminary Cost
Estimate: $27 million)
The Working Group recommends option 1 to address the transformation capacity need in the Sub-Region.
Six feeders will be adequate to supply demand over the study period. Also, option 2 is not considered the
best economic solution since option 1 will reserve extra space for 2x44kV feeder positions and capacitor
banks for future, when required.
The new DESN, 2x75/125MVA 230/44kV transformers with 6x44kV feeder breaker positions with
2x44kV spare feeder positions, is proposed to be located at the Oshawa Area Junction in the municipality
of Clarington. This junction is on the ROW of the Bowmanville and Cherrywood transmission line
corridor illustrated in Figure 7-2. The property is already owned by HONI and it is also the site of the new
500/230kV autotransformer Clarington TS supplied by circuits B540C and B543C. The proposed in-
service date for the new DESN has a preliminary cost estimate of $34M including feeders egress to the
distribution risers outside the station and will be aligned with Clarington TS which is scheduled for 2018.

GTA East – Regional Infrastructure Plan 09 January 2017
28
Figure 7-2 Enfield TS: Proposed Construction Site
Advantages in proceeding with this particular location are as follows:
The land proposed has already been purchased as part of the property where Clarington TS will
be situated resulting in one less station footprint in the Sub-Region.
Class EA approval has been already obtained for the construction of new TS on Hydro One land
at the Clarington TS site.
The site is also near new development areas which results in minimizing the length of supply
feeders from the station.
7.3 GTA East Load Restoration Assessment
Description
GTA East load restoration need was identified in the NA and IRRP reports as the Working Group
recommended that further assessment was required to address the supply shortfall during peak load
periods. Previous assessments indicated that for the loss of two transmission elements (B23C/M29C or
H24C/H26C), the load interrupted with current circuit configuration during peak periods may exceed load
restoration criteria and requires further assessment.

GTA East – Regional Infrastructure Plan 09 January 2017
29
Recommended Plan and Current Status
In collaboration with the Working Group, a detailed report6 was completed to make a recommendation for
the load restoration need identified in the Region. The Working Group’s assessments in the report,
attached in the Appendix F, concluded the following:
The historical performance of the circuits over the last 15 years has been excellent with little or
no impact on supply reliability and security.
Working Group is recommending that further investment in motorized disconnect switch (MDS)
at this time is not a feasible solution to the load restoration need because the risk and/or
probability of loss of load is small based on past performances. Therefore, no further action is
required at this time.
7.4 Short Circuit Constraint at Cherrywood TS T7/T8
Description
Currently, new DG is restricted from connecting to Cherrywood TS T7/T8 due to short circuit capacity
constraints. Veridian Connections Inc., supplied by this station, has indicated that they have several
customers that have expressed interest in connecting DG (over 5MW) to Cherrywood TS T7/T8 but are
prevented due to the existing restriction. There is an existing 30MW landfill gas generation connection at
Cherrywood TS T7/T8 contributing to the short circuit capacity restriction. This generating unit has been
shut down and/or has not generated electricity now for more than one year.
Recommended Plan and Current Status
The short circuit capacity is currently held by an earlier landfill generation connection. Although the
facility has not been generating and partially dismantled, there is an uncertainty about availability of the
short circuit capacity. Hydro One and the IESO will continue to assess this issue to have this capacity
reservation released.
6 GTA East: Load Restoration, Transmission Planning Report, circulated within the Working Group on August 31,
2016

GTA East – Regional Infrastructure Plan 09 January 2017
30
7.5 Long Term Regional Plan
As discussed in Section 5, the electricity demand in GTA East Region is forecasted to grow at 2%
annually over the next 10 years. Similar trend is also expected in the long term period where the load is
expected to increase by approximately 1.3% annually from year 2026 to 2036. Long term forecast
provides a high level insight of how the region may be developing in the future so that near and mid-term
plans and ongoing projects in the region are best aligned with potential long term needs and solutions.
No long term needs for the Pickering-Ajax-Whitby Sub-Region were identified in the IRRP. Seaton MTS
is expected to supply the Sub-Region’s demand adequately over the next two decades. As indicated in the
IRRP, official plans by the municipalities expect the lakeshore area in the southern part of Pickering-
Ajax-Whitby Sub-Region to grow due to development of high rise residential and commercial buildings.
With Pickering NGS expected to retire by 2024, the 230kV transmission lines can be utilized along with a
new step-down transformer station to address capacity needs in the southern part of the Sub-Region.
The current forecast did not consider future Pickering Airport which may have an impact on
transformation capacity in the long term. Such potential needs will be monitored and system supply
capability will be reviewed in the next planning cycle based on the official plans released by the
municipalities.
The demand in Oshawa-Clarington Sub-Region is expected to grow over the long term period. The new
Enfield TS will mainly provide relief to Wilson TS by supplying the excess load through distribution load
transfer capability. As the demand grows in the northern Oshawa area in the long term, additional
transformation capacity may have to be planned for in future. Further review and assessment will
commence in next Regional Planning cycle to identify and develop alternatives to address new needs.

GTA East – Regional Infrastructure Plan 09 January 2017
31
8. CONCLUSION AND NEXT STEPS
THIS RIP REPORT CONCLUDES THE REGIONAL PLANNING PROCESS FOR
THE GTA EAST REGION. THIS REPORT MEETS THE INTENT OF THE
PROCESS DESCRIBED IN SECTION 2 WHICH IS ENDORSED BY THE OEB
AND MANDATED IN THE TSC AND DSC.
This RIP report addresses regional needs identified in the earlier phases of the Regional Planning process
and any new needs identified during the RIP phase. These needs are summarized in Table 8-1.
Table 8-1: Regional Plans – Needs Identified in the Regional Planning Process
Need ID Needs Timing
I Additional transformation capacity for Whitby TS T1/T2
27.6kV in Pickering-Ajax-Whitby Sub-Region 2019
II Additional transformation capacity for Wilson TS T1/T2 &
T3/T4 in Oshawa-Clarington Sub-Region Immediately
III Load Restoration for loss of B23C/M29C or H24C/H26C No action required at this
time
IV Short Circuit Constraint at Cherrywood TS T7/T8 Pending outcome
V Additional transformation capacity for Oshawa-Clarington
Sub-Region Long term
Projects, lead responsibility, and timeframes for implementing the wires solutions for the above needs are
summarized in Table 8-2 below.
Table 8-2: Regional Plans – Projects, Lead Responsibility, and Planned In-Service Dates
# Project Lead Responsibility I/S Date Estimated Cost Mitigated Need ID
1
Seaton MTS
and associated
line work
Veridian and Hydro One 2019 $43M-$48M I
2 Enfield TS OPUCN and Hydro One 2019 $34M II
GTA East load restoration need, Need ID III, has been reviewed in this Regional Planning cycle and
“status quo/do nothing” course of action has been recommended (see Appendix F). Further developments
in the Region will be monitored and the need will be reviewed again as part of the next planning cycle.
Hydro One is working with the IESO to explore the best course of action to relieve the short circuit
constraint at Cherrywood TS, Need ID IV.
Additional transformation capacity for Oshawa-Clarington Sub-Region, Need ID V, will be reviewed as
part of the next Regional Planning cycle.

GTA East – Regional Infrastructure Plan 09 January 2017
32
In accordance with the Regional Planning process, the Regional Planning cycle will be triggered at least
once within five years. Should there be a need that emerges due to a change in load forecast or any other
reason, the next regional planning cycle will be started earlier to address the need.

GTA East – Regional Infrastructure Plan 09 January 2017
33
9. REFERENCES
[1]. Independent Electricity System Operator, “Pickering-Ajax-Whitby Sub-Region Integrated
Regional Resource Plan”. June 30, 2016.
http://www.ieso.ca/Documents/Regional-Planning/GTA_East/2016-Pickering-Ajax-Whitby-
IRRP-Report.pdf
[2]. Hydro One, “Local Planning Report – Wilson TS and Thornton TS Station Capacity Mitigation”.
May 15, 2015.
http://www.hydroone.com/RegionalPlanning/GTA_East/Documents/Local%20Planning%20Repo
rt%20-%20WilsonThornton%20-%2015_May_2015%20-%20Final.pdf
[3]. Hydro One, “Needs Screening Report, GTA East Region. August 11, 2014.
http://www.hydroone.com/RegionalPlanning/GTA_East/Documents/Needs%20Assessment%20R
eport%20-%20GTA%20East%20Region.pdf
[4]. “Planning Process Working Group (PPWG) Report to the Board The Process for Regional
Infrastructure Planning in Ontario”. May 17, 2013.
http://www.ontarioenergyboard.ca/OEB/_Documents/EB-2011-
0043/PPWG_Regional_Planning_Report_to_the_Board_App.pdf
[5]. Independent Electricity System Operator, “Ontario Resource and Transmission Assessment
Criteria (ORTAC) – Issue 5.0”
http://www.ieso.ca/documents/marketAdmin/IMO_REQ_0041_TransmissionAssessmentCriteria.

GTA East – Regional Infrastructure Plan 09 January 2017
34
APPENDICES
Appendix A: Stations in the GTA East Region
Station (DESN) Voltage Level Supply Circuits
Cherrywood TS T7/T8 230/44kV Cherrywood TS, Bus DK
Whitby TS T1/T2 27.6
Whitby TS T1/T2 44
230/27.6kV
230/44kV H24C/H26C
Whitby TS T3/T4 230/44kV B23C/M29C
Wilson TS T1/T2 230/44kV B23C/M29C
Wilson TS T3/T4 230/44kV B23C/M29C
Thornton TS T3/T4 230/44kV H24C/H26C

GTA East – Regional Infrastructure Plan 09 January 2017
35
Appendix B: Transmission Lines in the GTA East Region
Location Circuit Designation Voltage Level
Cherrywood TS to Whitby TS T3/T4, Wilson TS, and
Clarington TS B23C/M29C 230kV
Cherrywood TS to Whitby TS T1/T2, Thornton TS, and
Clarington TS H24C/H26C 230kV
Cherrywood TS to Clarington TS C28C 230kV

GTA East – Regional Infrastructure Plan 09 January 2017
36
Appendix C: Non-Coincident Load Forecast 2016-2025
Transformer
Station
Name
LDC/Customer DESN
ID Bus ID
10-DAY SLTR (MW)
Customer Data Historical Data (MW) Near Term Forecast (MW) Medium Term Forecast (MW)
2013 2014 2015 2016 2017 2018 2019 2020 2021 2022 2023 2024 2025
Cherrywood TS Veridian T7/T8 BY (44kV) 175
Gross Peak Load
180 180 180 180 180 180 180 180 176 176
CDM
2 3 5 7 8 10 11 12 13 15
Net Load Forecast 163 143 156 178 177 175 173 172 170 169 168 163 161
Whitby TS
Veridian
T1/T2
BY (27.6kV) 90 Gross Peak Load
61 76 80 90 90 90 90 90 90 90
Whitby Hydro EZ (44kV) 90 Gross Peak Load
54 55 56 57 57 58 59 60 61 62
DG
0.2 0.2 0.2 0.2 0.2 0.2 0.2 0.2 0.2 0.2
CDM
2 3 4 6 7 8 9 10 12 13
Net Load Forecast 77 88 97 113 128 132 141 141 140 140 140 139 139
Whitby TS
Veridian
T3/T4 JQ (44kV) 187
Gross Peak Load
70 70 74 74 74 74 74 74 74 74
Whitby Hydro Gross Peak Load
108 110 111 113 115 116 118 120 122 124
DG
18 18 18 18 18 18 18 18 18 18
CDM
2 3 5 6 8 9 11 13 15 17
Net Load Forecast 175 161 162 159 160 163 164 163 164 164 164 163 163
Seaton MTS Veridian T1/T2 (27.6kV) 153
Gross Peak Load
5 16 27 40 60 75 88
CDM
1 1 2 3 4 6
Net Load Forecast 0 0 0 0 0 0 5 15 26 38 57 71 82
Wilson TS
OPUC
T1/T2 BY (44kV) 161
Gross Peak Load
156 161 167 148 145 142 140 140 140 140
Hydro One Gross Peak Load
30 31 35 35 41 41 41 41 41 41
CDM
1.1% 1.8% 2.9% 3.9% 4.7% 5.3% 5.9% 6.3% 6.80% 7.20%
Net Load Forecast 157 174 167 184 189 197 176 177 173 170 170 169 168
Wilson TS
OPUC
T3/T4 JQ (44kV) 134
Gross Peak Load
25 26 27 25 25 25 25 25 25 25
Hydro One Gross Peak Load
150 151 152 152 153 154 155 156 157 158
CDM
1.1% 1.8% 2.9% 3.9% 4.7% 5.3% 5.9% 6.3% 6.80% 7.20%
Net Load Forecast 166 133 146 173 174 174 171 170 170 170 170 170 170

GTA East – Regional Infrastructure Plan 09 January 2017
37
Transformer
Station
Name
LDC/Customer DESN
ID Bus ID
10-DAY SLTR (MW)
Customer Data Historical Data (MW) Near Term Forecast (MW) Medium Term Forecast (MW)
2013 2014 2015 2016 2017 2018 2019 2020 2021 2022 2023 2024 2025
Thornton TS
Whitby Hydro
T3/T4 BY (44kV) 160
Gross Peak Load
52 58 63 79 80.0 81 82 82 83 84
OPUC Gross Peak Load
100 101 103 95 88 86 84 80 80 80
CDM
1.1% 1.8% 2.9% 3.9% 4.7% 5.3% 5.9% 6.3% 6.8% 7.2%
Net Load Forecast 157 103 126 151 156 162 168 160 158 156 152 152 152
Enfield TS
OPUC
T1/T2 (44kV) 153
Gross Peak Load
0.0 0.0 0.0 38 57 71 84 98 108 118
Hydro One Gross Peak Load
0.0 0.0 0.0 26 33 34 35 36 37 38
CDM
3.9% 4.7% 5.3% 5.9% 6.3% 6.8% 7.2%
Net Load Forecast
0 0 0 62 86 100 113 126 135 145
CTS A
Gross Peak Load
20.0 20.0 20.2 20.6 21.0 21.2 21.4 21.6 21.7 21.9
Net Load Forecast
19.5 19.8 19.7 19.8 19.9 19.9 20.0 20.1 20.2 20.2 20.3
CTS B
Gross Peak Load
97.0 97.5 98.0 99.8 101.6 102.2 103.0 103.4 103.9 104.4
Net Load Forecast
96.3 96.0 96.1 96.2 96.3 96.3 96.4 96.5 96.6 96.6 96.7
CTS C
Gross Peak Load
47.5 52.8 53.3 54.5 55.7 56.3 57.0 57.5 58.0 58.5
Net Load Forecast
52 47.0 52.0 52.3 52.6 52.8 53.1 53.4 53.7 53.9 54.2
CGS D
Gross Peak Load
0.7 0.7 0.8 0.8 0.8 0.8 0.8 0.8 0.8 0.9
Net Load Forecast
0.7 0.7 0.7 0.7 0.7 0.8 0.8 0.8 0.8 0.8 0.8

GTA East – Regional Infrastructure Plan 09 January 2017
38
Appendix D: Coincident Load Forecast 2016-2025
Stations DESN ID Historical (MW) Near Term Forecast (MW) Medium Term Forecast (MW)
2015 2016 2017 2018 2019 2020 2021 2022 2023 2024 2025
Cherrywood TS T7/T8 156 173 172 170 168 167 165 164 163 158 156
Whitby TS (27.6kV)* T1/T2 33 59 74 78 87 87 87 87 87 87 87
Whitby TS (44kV)* T1/T2 39 52 53 54 55 56 56 57 58 59 60
Whitby TS T3/T4 145 154 155 158 159 158 159 159 159 158 158
Seaton MTS T1/T2 0 0 0 0 5 15 25 37 55 69 80
Wilson TS T1/T2 128 179 184 192 172 173 169 166 166 165 164
Wilson TS T3/T4 144 168 169 169 166 165 165 165 165 165 165
Thornton TS T3/T4 125 146 151 157 163 155 153 151 147 147 147
Enfield TS T1/T2 0 0 0 0 60 83 97 110 122 131 141
CTS A 19.5 19 19 19 19 19 19 19 20 20 20
CTS B 96.3 93 93 93 93 93 93 94 94 94 94
CTS C 52 46 50 51 51 51 51 52 52 52 53
CGS D 0.7 0.7 0.7 0.7 0.7 0.8 0.8 0.8 0.8 0.8 0.8
*DG/CDM contribution excluded from 2016-2036 coincident forecast
GTA East Coincident Load 938.5 1091 1122 1141 1199 1223 1242 1262 1289 1306 1324
Region’s Annual Growth Rate
2%

GTA East – Regional Infrastructure Plan 09 January 2017
Page | 39
Appendix E: List of Acronyms
Acronym Description
A Ampere
BES Bulk Electric System
BPS Bulk Power System
CDM Conservation and Demand Management
CIA Customer Impact Assessment
CGS Customer Generating Station
CTS Customer Transformer Station
DESN Dual Element Spot Network
DG Distributed Generation
DSC Distribution System Code
GS Generating Station
GTA Greater Toronto Area
HV High Voltage
IESO Independent Electricity System Operator
IRRP Integrated Regional Resource Plan
kV Kilovolt
LDC Local Distribution Company
LP Local Plan
LTE Long Term Emergency
LTR Limited Time Rating
LV Low Voltage
MTS Municipal Transformer Station
MW Megawatt
MVA Mega Volt-Ampere
MVAR Mega Volt-Ampere Reactive
NA Needs Assessment
NERC North American Electric Reliability Corporation
NGS Nuclear Generating Station
NPCC Northeast Power Coordinating Council Inc.
NUG Non-Utility Generator
OEB Ontario Energy Board
OPA Ontario Power Authority
ORTAC Ontario Resource and Transmission Assessment Criteria
PF Power Factor
PPWG Planning Process Working Group
RIP Regional Infrastructure Plan
ROW Right-of-Way
SA Scoping Assessment
SIA System Impact Assessment
SPS Special Protection Scheme
SS Switching Station
TS Transformer Station
TSC Transmission System Code
UFLS Under Frequency Load Shedding
ULTC Under Load Tap Changer
UVLS Under Voltage Load Rejection Scheme

GTA East – Regional Infrastructure Plan 09 January 2017
Page | 40
Appendix F: GTA East Load Restoration Report

Transmission Planning Report – Load Restoration for GTA East Region August 31, 2016
Page | 1
Hydro One Networks Inc.
483 Bay Street Toronto, Ontario
M5G 2P5
Prepared by: Hydro One Networks Inc.
TRANSMISSION PLANNING REPORT
GTA East: Load Restoration
Revision: Final
Date: August 31, 2016

Transmission Planning Report – Load Restoration for GTA East Region August 31, 2016
Page | 2
[This page is intentionally left blank]

Transmission Planning Report – Load Restoration for GTA East Region August 31, 2016
Page | 3
Executive Summary
REGION GTA East (the “Region”)
LEAD Hydro One Networks Inc. (“Hydro One”)
START DATE June 17, 2016 END DATE August 31, 2016
1. INTRODUCTION
The purpose of this Transmission Planning (TP) report is to undertake a comprehensive assessment
of the load restoration need identified in the Needs Assessment (NA) and Integrated Regional
Resource Plan (IRRP) and develop a preferred recommendation. The recommendations of this TP
report will become part of the Regional Infrastructure Plan (RIP) and is intended to facilitate the
regional planning process as set out by Ontario Energy Board’s (OEB) in the Transmission System
Code (TSC) and the Planning Process Working Group (PPWG) report to the Board.
Based on Section 6 of the NA and IRRP report, the study team recommended that further assessment
was required to address the load restoration need during peak load in the GTA East region. The NA
and IRRP report indicated that for the loss of two transmission elements (B23C/M29C or
H24C/H26C), the load interrupted with current circuit configuration may exceed load restoration
criteria and requires further assessment. The IESO led IRRP recommended this need be further
assessed in the RIP, to be completed in Q4 2016. This report provides a detailed assessment along
with options and the WG recommendation to be included in the RIP report.
2. REGIONAL NEED ADDRESSED IN THIS REPORT
The circuits M29C/B23C and H24C/H26C are on the same tower line in the GTA East Region
230kV corridor. The loss of either pair of circuits during peak load may result in load
shortfall/outage exceeding the limits of 150MW and 250MW to be restored within 4 hours and 30
minutes, respectively.
3. OPTIONS CONSIDERED
Hydro One Transmission along with the WG members have considered the following options to
addressing the load restoration need:
Option 1 – a) Status quo/Current state
b) Commissioning of Clarington TS by 2018
Option 2 – Install 8 Motorized Disconnect Switches (MDS) on circuits B23C, M29C, H24C,
and H26C
See Sections 4 & 5 for detailed assessment.

Transmission Planning Report – Load Restoration for GTA East Region August 31, 2016
Page | 4
4. PREFERRED SOLUTION
At this time, B23C, M29C, H24C, and H26C are approximately 120km-300km long and the
historical performance since 2000 has been excellent with no relevant outages. With the new
Clarington TS in 2018, the line exposure in the region will reduce to only 46km including tap
sections. The assessment concluded that
a) The annual carrying cost of the switches is not justified compared to the annual outage cost,
and
b) The installation of Motorized Disconnect Switches will not result in significant enhancement
to the reliability of the system after the Clarington TS is in service in 2018.
Option 1 is the preferred solution recommended by the WG at this time. Further details of the
assessment and justification are provided in Sections 4 & 5.
5. NEXT STEPS
There are no further actions required at this time.

Transmission Planning Report – Load Restoration for GTA East Region August 31, 2016
Page | 5
TABLE OF CONTENTS Executive Summary ........................................................................................................................ 3 1 Region Description and Connection Configuration ................................................................ 6 2 Identified Need ........................................................................................................................ 7
2.1 Load Restoration Criteria ................................................................................................. 7
2.2 Shortfall Need .................................................................................................................. 7 2.3 Options considered ........................................................................................................... 9
3 Evaluation Method & Assumptions ...................................................................................... 10 4 Impact of Common Mode Outages ....................................................................................... 12
4.1 Line Outage Data ........................................................................................................... 12
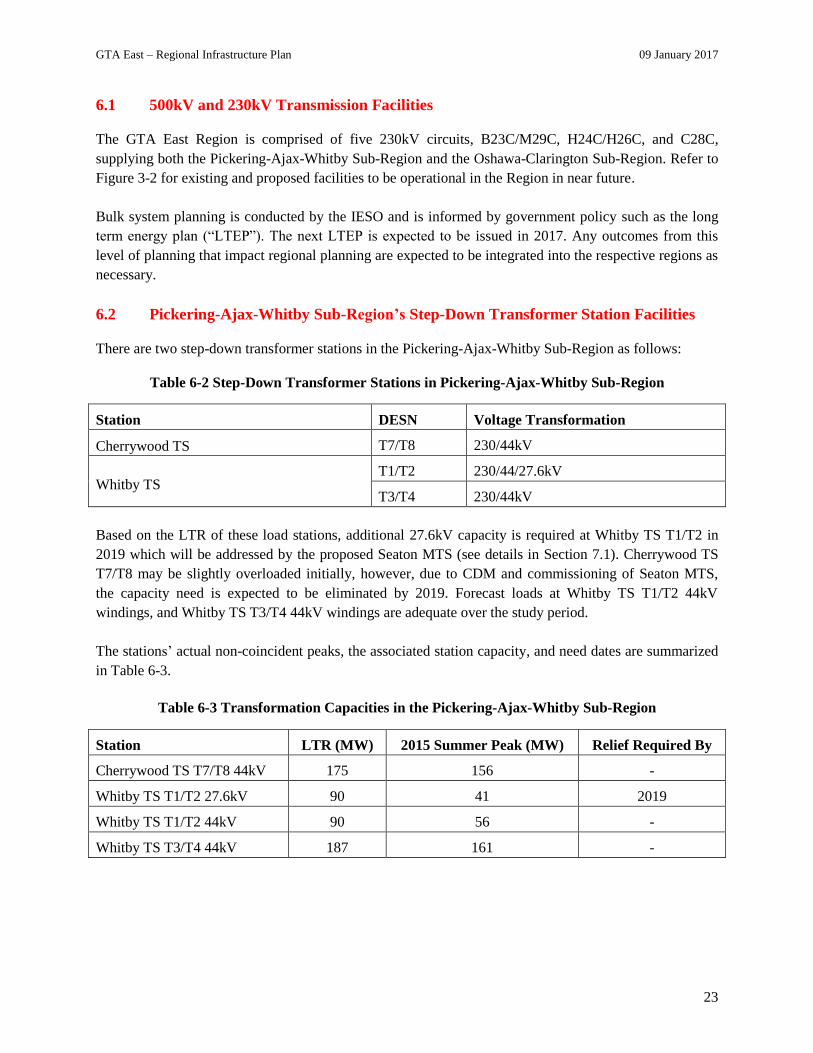
4.2 Reliability Results .......................................................................................................... 12 4.3 Cost Results .................................................................................................................... 13
5 Impact of Overlap Outages .................................................................................................... 15
5.1 Line Outage Data ........................................................................................................... 15 5.2 Reliability Results .......................................................................................................... 15 5.3 Cost Results .................................................................................................................... 16
6 Conclusion ............................................................................................................................. 17
6.1 Common Mode Outages................................................................................................. 17 6.2 Overlap Outages ............................................................................................................. 17
6.3 Summary ........................................................................................................................ 17 7 Next Steps .............................................................................................................................. 18 8 References ............................................................................................................................. 18
LIST OF FIGURES GTA East Region - Single Line Diagram ..................................................................... 6 Figure 1
Load Restoration Criteria ............................................................................................. 7 Figure 2
MDS: Conceptual Configuration .................................................................................. 9 Figure 3
LIST OF TABLES Load Restoration/Shortfall in 2015 .............................................................................. 8 Table 1
Load Restoration/Shortfall in 2025 .............................................................................. 8 Table 2
Data Used in Reliability Studies ................................................................................. 11 Table 3
Common Mode Outage Events (from 1990 to 2015) ................................................. 12 Table 4
Reliability Indices, Common Mode Line Outages ..................................................... 13 Table 5
Cost Results, Common Mode Line Outages (B23C/M29C) ...................................... 13 Table 6
Cost Results, Common Mode Line Outages (H24C/H26C)....................................... 13 Table 7
Reliability Indices, Overlap Line Outages ................................................................. 15 Table 8
Cost Results, Overlap Line Outages (H24C/H26C) ................................................... 16 Table 9
Summary of Results.................................................................................................... 17 Table 10

Transmission Planning Report – Load Restoration for GTA East Region August 31, 2016
Page | 6
1 Region Description and Connection Configuration
The GTA East Region comprises the municipalities of Pickering, Ajax, Whitby, Oshawa and
parts of Clarington, and other parts of the Durham Region.
Four 230kV circuits (B23C, M29C, H24C, and H26C) emanating east from Cherrywood TS
provide local supply to the Region. Whitby TS DESN2, Thornton TS, and other CTS in the
Region are supplied by H24C/H26C while Whitby TS DESN1 and Wilson TS are supplied by
B23C/M29C.
A new 500/230kV autotransformer station in the GTA East Region within the municipality of
Clarington (called Clarington TS) is expected to be in service by 2018. The assessments in this
report evaluate the reliability impact of Clarington TS in the region as well as the installation of
Motorized Disconnect Switches (MDS). The new Clarington TS will provide additional load
meeting capability in the Region and will eliminate any overloading of Cherrywood
autotransformers that may result after the retirement of the Pickering Nuclear Generating Station
(NGS). The new autotransformer station will consist of two 750MVA, 500/230kV
autotransformers and a 230kV switchyard. The 230kV circuits supplying the east GTA will be
terminated at Clarington TS. Clarington TS will become the principle supply source for the GTA
East Region load. The facilities in the GTA East Region, including the connection to Clarington
TS, are depicted in the single line diagram shown in Figure 11.
GTA EAST: PICKERING-AJAX-WHITBY SUB-REGION GTA EAST: OSHAWA-CLARINGTON SUB-REGION
CHERRYWOOD TS
T26C (H26C)T24C (H24C)
T29C (M29C)
T23C (B23C)
T28C (C28C)
T24C (H24C)
T29C (M29C)
T23C (B23C)
T26C (H26C)
PET
ERB
OR
OU
GH
TO
KIN
GST
ON
R
EGIO
N
WHITBY TS
CTS A
CGS D
CTS B
CTS C
COLUMBUS JCT
T1/T2
WILSON TS
Existing 230kV
Legend
T3/T4
To Pickering NGS (8 Circuits)
CLARINGTON TS
MET
RO
TO
RO
NTO
REG
ION
T3/T4 T1/T2
THORNTON TS
T24
C (
H2
4C
)
T3/T4
T28C (C28C)
SEATON MTS
C10A
ENFIELD TS
T7/T8
T1/T2
Proposed 230kV
DUFFIN JCT
T26
C (
H2
6C
)
GTA East Region - Single Line DiagramFigure 1
1 Circuits’ nomenclature is shown following the commissioning of Clarington TS (2018) with current convention in
parentheses

Transmission Planning Report – Load Restoration for GTA East Region August 31, 2016
Page | 7
2 Identified Need
2.1 Load Restoration Criteria
In case of contingencies on the transmission system, the Ontario Resource Transmission
Assessment Criteria (ORTAC) provides the load restoration times relative to the amount of load
affected. Planned system configuration must not exceed 600MW of load curtailment/rejection.
In all other cases, the following restoration times are provided for load to be restored for the
outages caused by design contingencies.
a. All loads must be restored within approximately 8 hours.
b. Load interrupted in excess of 150MW must be restored within approximately 4 hours.
c. Load interrupted in excess of 250MW must be restored within approximately 30
minutes.
In addition, ORTAC also provides a provision for exemption from the above restoration criteria
on a case-by-case basis.
Figure 2 illustrates the load restoration timelines as discussed above.
2.2 Shortfall Need
In 2015, H24C/H26C and M29C/B23C supplied a coincident peak demand of approximately
366MW and 417MW, respectively.
It is expected and assumed that all loads can be restored within 8 hours. However, consistent
with the NA and IRRP reports, during peak load periods all loads cannot be restored in the
region subsequent of a double circuit contingency between Cherrywood TS and Clarington TS
within 30 minutes to 4 hours.
Further findings from the Local Distribution Companies (LDC) in the Region and as reported in
Figure 2 Load Restoration Criteria

Transmission Planning Report – Load Restoration for GTA East Region August 31, 2016
Page | 8
the IRRP2, up to 57MW and 142MW can be restored for customers supplied by H24C/H26C
through distribution transfers within 30 minutes and 4 hours, respectively. This leaves the
maximum shortfall of 59MW after 30 minutes, and 74MW after 4 hours to be restored from
these circuits.
Similarly, for the M29C/B23C, up to 105MW can be restored through distribution transfers
within 30 minutes and 257MW within 4 hours for customers supplied by these circuits under the
current supply arrangement. This leaves the maximum shortfall of 62MW after 30 minutes, and
10MW after 4 hours to be restored from these circuits.
Table 1 summarizes the 2015 peak demands for each pair of circuit and differentiates between
restorable load and the shortage load for 30-minutes and 4-hour periods as discussed above.
Load Restoration/Shortfall in 2015 Table 1 2015 Coincident Peak
Load Pocket Actual
Demand 30-Min
Restoration 30-Min Restoration
Shortfall 4-Hour
Restoration 4-Hour Restoration
Shortfall
H24C/H26C: Whitby TS DESN 1, Thornton TS, and Transmission Connected Customers
366 57 59 142 74
M29C/B23C: Whitby TS DESN2, Wilson TS 417 105 62 257 10
By the end of 2025, the load that cannot be restored increases due to load growth in the region
illustrated in Table 2.
Load Restoration/Shortfall in 20253 Table 2
2025 Coincident Peak (Net Forecast)
Load Pocket Forecast Demand
30-Min Restoration
30-Min Restoration Shortfall
4-Hour Restoration
4-Hour Restoration Shortfall
H24C/H26C: Whitby TS DESN 1, Thornton TS, and Transmission Connected Customers
445 57 138 142 153
M29C/B23C: Whitby TS DESN2, Wilson TS 425 105 70 257 18
2 Published in June, 2016
3 Load forecast is subject to change

Transmission Planning Report – Load Restoration for GTA East Region August 31, 2016
Page | 9
2.3 Options considered
An option to build a new 26km of line would have resulted in a cost of more than $75M,
obtaining new right-of-way and was not further considered. Following options were further
assessed:
Option 1a is status quo and option 1b includes Clarington TS to be in-service by 2018.
Accordingly, following two options are further evaluated against each other:
Option 1 – a) Status quo/current state
b) Commissioning of Clarington TS by 2018
Option 2 – Install 8 Motorized Disconnect Switches (MDS) on circuits B23C, M29C, H24C,
and H26C
A conceptual configuration of the switches (marked by the red X) is shown for Option 2 in
Figure 3.
Similar cases can be shown to isolate faults on other sections of the corridor to restore the loads.
It must be noted that although the corridor is protected using 8 MDSs as shown above, the tap
offs will still remain unprotected. Further, a common mode fault (refer to section 4) at the tap off
line sections will cause an outage regardless of installed switches. With the use of 8 MDS, the
optimal locations of the switches are the junction points and 2 switches per circuit as shown in
Figure 3.
Figure 3 MDS: Conceptual Configuration

Transmission Planning Report – Load Restoration for GTA East Region August 31, 2016
Page | 10
3 Evaluation Method & Assumptions
The options identified in the previous section were evaluated from the reliability and cost points
of view. The reliability indices for overlap outages were evaluated with the help of the AREP
Program (Area Reliability Evaluation Program). The reliability for each option is expressed in
terms of the frequency and duration of supply interruptions to customers.
Two cost components, one representing the capital cost and one representing the outage cost
were evaluated for each option. The two annual costs are given as follows:
Annual cost of carrying charge = C*R,
Where: C – Capital cost of the switches
R – Annual discount rate
The annual outage cost (or risk cost) = F*P*I,
Where: F – Annual duration of load interruption in hours
P – Average kW interrupted including load factor
I – Customer interruption cost ($/KWh)
The following assumptions were made in the assessments:
1. All MDSs are assumed to be perfect (100% reliable).
2. Outages on line tap sections are excluded in common mode outages assessment in section
4.
3. All customer loads are restored within 8 hours for Option 1 and within 30 minutes for
Option 2.
4. In case of overlap outages, switching time to isolate the faulted component and restore
healthy ones to service is assumed to be one hour.
5. Faults do not occur on lines section where MDSs are located.

Transmission Planning Report – Load Restoration for GTA East Region August 31, 2016
Page | 11
The assessment data used in the benefit/cost analysis for all options is provided in Table 3.
Data Used in Reliability Studies Table 3
Assessment Data
No. of circuit pairs on same towers 27
Total circuit length 551.347km
Circuit years in service 26 years
Distance between Cherrywood TS and Clarington TS 26km
2015 Peak load supplied from B23C and M29C, P 417MW
2015 Peak load supplied from H24C and H26C, P 366MW
Load factor for all load stations 0.6
Customer interruption cost, I $10–$30/kWh4
Load restoration time without switches 8 hours
Load restoration time with switches 30 minutes
Cost of one switch (x4 per pair, C) $3 Million ($12 Million)
Annual discount rate, R 5%
4 Known as Value of Lost Load (VOLL), range is consistent with a Canadian Regulatory Application conducted in
2006 after considering customer composition and provincial GDP – IRRP (2016)

Transmission Planning Report – Load Restoration for GTA East Region August 31, 2016
Page | 12
4 Impact of Common Mode Outages
A common mode outage is defined as an event involving two or more outages with the same
initiating cause and where the outages are not consequences of each other and occur nearly
simultaneously.
4.1 Line Outage Data
The historical common mode outage data for all 230 kV circuits on same structures and east of
Cherrywood TS from 1990 to 2015 was used to compute the frequency and duration of common
mode line outages. A summary of the common mode line outage events, along with the duration,
over the period of 25 years is given in Table 4.
Common Mode Outage Events (from 1990 to 2015) Table 4
Event # Circuits Involved Year Outage Duration Outage Cause
1 X3H and X4H 1992 927.6h High winds toppled 16 towers
2 D5A and B5D 1998 0.15h or 9m Electrical storm
3 B23C and M29C 2008 2.02h Human error, relay settings
4 L21H and L22H 2011 0.08h or 5m Relay problems
Only 4 common mode outages have been recorded in eastern Ontario in the last 25 years, of
which, only one event is of relevance for this assessment. Hence, Event # 1, in Table 4 is the
only one used in calculating the frequency of common mode line outages. This event occurred in
November 1992 where adverse weather toppled multiple towers. The other outage events are not
relevant to common mode outages because either the outage duration is less than 30 minutes
(time assumed for switches to restore power supply to customers) or the outage was preventable
or both.
NOTE: Event #1 has never occurred on the GTA East 230kV corridor which is the scope of this
assessment but used as a proxy for assessment.
4.2 Reliability Results
The annual frequency of line common mode outages for 230 kV circuits east of Cherrywood TS
was calculated by dividing the number of common mode line outages in 25 years by the product
of the number of circuit in service years and the total circuit km over the 25 years period. The
annual frequency was found to be 0.00007 outages/km for all of eastern Ontario’s 230kV
transmission circuits. A low reliability index indicates the circuits in eastern Ontario have
performed exceptionally well.
The commissioning of Clarington TS, Option 1b, does not affect the reliability indices for the
common mode line outages because of the location of the station at the Oshawa Area Junction.
All four 230 kV circuits currently emanate east on single towers from Cherrywood TS to the
Oshawa Area junction point. From there on, B23C disperses south towards Belleville TS while
the remaining three circuits emanate east on individual towers towards eastern Ontario.
Therefore, a common mode line outage on these circuits cannot occur east of Oshawa Area
Transmission Planning Report – Load Restoration for GTA East Region August 31, 2016
Page | 13
Junction, future site for Clarington TS.
It is also emphasized that the MDS would have no impact on the frequency of supply
interruptions to customers. However, depending upon the location of a permanent fault, the
switches can reduce the duration of interruption to customers by isolating the faulted section of
the line and restoring the load from the alternative path.
The frequency and duration indices for all options are given in Table 5. The 8 hour restoration
time for Option 1a and 1b, without switches, is in accordance with the standard outlined in
ORTAC.
Reliability Indices, Common Mode Line Outages Table 5
Options
Annual Frequency of
Loss of Supply to any
Customer
Duration of loss of
Supply in Hours per
Occurrence
Annual Duration of
Supply Interruptions, F
Option 1a or 1b 0.00182 8 0.01456h or 52.4s
Option 2 0.00182 0.5 0.00091h or 3.3s
4.3 Cost Results
The capital cost and outage cost components were evaluated for all options using the formulae
stated earlier. Table 6 shows the results for Circuits B23C and M29C while Table 7 shows the
results for Circuits H24C and H26C.
Cost Results, Common Mode Line Outages (B23C/M29C) Table 6
Options Annual Cost of Carrying
Charge in $k
Annual Outage Cost in
$k
Total Annual Cost in
$k
Option 1a or 1b $0.00 $36.43-$109.29 $36.43-$109.29
Option 2 $600.00 $2.28-$6.84 $602.28-$606.84
Cost Results, Common Mode Line Outages (H24C/H26C) Table 7
Options Annual Cost of Carrying
Charge in $k
Annual Outage Cost
in $k
Total Annual Cost
in $k
Option 1a or 1b $0.00 $31.97-$95.92 $31.97-$95.92
Option 2 $600.00 $2.00-$6.00 $602.00-$606.00
The reliability and cost benefit assessment for the common mode line outages is based on the
past 25 years of historical performance of 230kV circuits in eastern Ontario. Based on these
findings, the annual reliability index for the GTA East region is only 0.00182 outages. As stated
earlier, the installation of switches will not have an impact on the frequency index of events.
Rather, as seen in Table 5, the duration of an event is the only dependent variable where the
annual duration of an outage is reduced from 52.4s to 3.3s with the installation of switches.
The cost analysis in each option is dependent on the reliability index and is calculated using the
assessment data provided in Table 3. Using the cost calculation formulas in Section 3, annual
carrying cost of the switches and annual outage costs are calculated for B23C/M29C and

Transmission Planning Report – Load Restoration for GTA East Region August 31, 2016
Page | 14
H24C/H26C. The annual carrying cost of the 4 switches per circuit pair is based on the minimum
operating period of 20 years while the annual outage costs are based on the duration of outages,
calculated from the reliability index, with and without the installation of switches.
The annual cost for just common mode line outages for each pair in the region is approximately
$32k-$109k while the annual carrying cost of switches, including cost of outages, for each pair is
nearly 5-19 times more, $602k-$607k. Also, the annual outage cost due to a common mode line
outage is calculated on a very small probability of an event occurring. The annual frequency of
loss of supply to any customer in the region is only 0.00182 outages, 1 in over 549 years, with or
without switches as MDS have no impact on the frequency of supply interruptions.
As shown, the annual reliability and cost benefits from the MDS are insignificant compared to
the annual carrying costs of the switches. The installation of switches improves the outage
duration, if occurred, from 52.4s to 3.3s for a certain annual investment of over $1.2M for both
pairs of circuits. The annual benefits will still be lower than the carrying costs even if higher
values are used for the frequency of common mode line outages. In addition, MDS are assumed
to be 100% reliable in this assessment while they introduce a weak link on the system. The
reliability and cost analysis show that the installation of MDS is not justifiable.

Transmission Planning Report – Load Restoration for GTA East Region August 31, 2016
Page | 15
5 Impact of Overlap Outages
An overlap outage is referred to an event where two or more components are out of service at the
same time. The outage initiating causes are different and outages can start at different time. The
overlap outage may occur as one of two types; Forced-Forced or Planned-Forced.
5.1 Line Outage Data
The historical outage data from 1990 to 2014 was used to compute the frequency and duration of
H24C/H26C line sections and line terminal indices due to forced and planned outages. A
reliability model was developed using Area Reliability Evaluation Program (AREP) for both
options. The reliability indices were then used to calculate the annual frequency and annual
duration of loss of supply to customers. It is expected that circuits B23C/M29C will have similar
reliability indices, if not better, due to comparable characteristics and load as circuits
H24C/H26C.
5.2 Reliability Results
Currently, the four circuits collectively supply eastern Ontario for 120–300km. In spite of this
long distance, the reliability and security of the transmission lines in this part of the province has
been exceptional based on the historical performances. Given that these 230kV circuits will now
be terminating at Clarington TS, the exposure will reduce to 26km, the region’s security and
reliability is expected to improve substantially. Table 8 illustrates the reliability indices for the
loss of supply to customers considering both types of overlap events: Forced-Forced and
Planned-Forced.
Reliability Indices, Overlap Line Outages Table 8
Options Annual Frequency of
Loss of Supply
Annual Duration of Supply
Interruptions
Option 1a 0.01 0.12h or 7.02m
Option 1b 0.0008 0.007h or 26.60s
Option 2, Whitby TS DESN 1 0.0001 0.0003h or 1.26s
Option 2, Thornton TS/CTSs 0.0004 0.002h or 8.47s
For each reliability index above, two sets of reliability indices were considered: one due to the
overlap of forced outages (Forced-Forced) only and one with the overlap of planned and forced
outages (Planned-Forced). In the course of the overlap outages’ assessment, it was observed that
the Planned-Forced type outages had the dominant impact on the final reliability indices when
compared to Forced-Forced type outages.
Further, two types of outages in each set, namely the permanent outages and the switching
outages, were computed. In the permanent outage, the supply to customers is restored after
repairing the failed components while in the switching outage; the supply to customers is
restored by switching off the failed components and restoring the healthy ones to service. The
switching time to isolate the faulted component and restore healthy ones to service is assumed to

Transmission Planning Report – Load Restoration for GTA East Region August 31, 2016
Page | 16
be one hour except in the case of Option 2 where MDSs are expected to operate within 30
minutes.
It is observed in Table 8 that with the commissioning of Clarington TS in 2018, the reliability
improves by over 92% while an additional investment in MDSs of over $24 million yields
another increment of only 7% to the system reliability. With Clarington TS in service, Option 1b,
the reliability indices improve significantly when compared to the reliability of the existing
supply system. Also, the annual duration of supply interruption is reduced to just 26.6 seconds
from 7 minutes with Clarington TS in the region.
5.3 Cost Results
The capital (carrying) cost and outage cost components were evaluated for the both options using
the formulae stated earlier and the results are shown in Table 9. These costs are mainly
dependent on the annual duration of supply interruption in Table 8. Since the annual duration of
supply interruption in the region is expected to be reduced to merely 26.6s with Clarington TS
soon to be in service, the annual expected outage cost has dropped by almost 94%.
Table 9 illustrates that the annual benefits from the MDS are insignificant compared to the
annual carrying costs of the switches. The performance of H24C/H26C is expected to be
exceptionally good following the commissioning of Clarington TS with an expected annual cost
of $15.37k-$46.12k, a very well improvement from the current system and at least 13 times more
economical than the annual cost with the switches. With the inclusion of Clarington TS by 2018,
the system is projected to be most cost-effective and reliable.
Cost Results, Overlap Line Outages (H24C/H26C) Table 9
Options Annual Cost of Carrying Charge
in $k
Annual Outage
Cost in $k
Total Annual Cost
in $k
Option 1a $0.00 $263.52-$790.56 $263.52-$790.56
Option 1b $0.00 $15.37-$46.12 $15.37-$46.12
Option 2 $600.00 $3.66-$10.97 $603.66-$610.97

Transmission Planning Report – Load Restoration for GTA East Region August 31, 2016
Page | 17
6 Conclusion
6.1 Common Mode Outages
The following concluding remarks can be made regarding the impact of the common mode
outages:
i) All options have the same frequency of supply interruptions to customers.
ii) Only one common mode outage, relative to this assessment, has occurred in the eastern
Ontario in the past 25 years. This event occurred in 1992 due to high winds toppling
multiple towers.
iii) The reliability and cost analysis show that it is not justifiable to invest $24M for marginal
improvement.
6.2 Overlap Outages
The following concluding remarks can be made regarding the impact of overlap outages:
i) A significant improvement in reliability is observed after the commissioning of
Clarington TS in 2018, Option 1b. However, the installation of MDS, Option 2, does not
result in a substantial improvement in the reliability indices for an additional cost of
approximately $24M.
ii) The result of reliability/cost analysis for circuits B23C/M29C is expected to be similar to
H24C/H26C due to similar regional characteristics and loading conditions, therefore,
same conclusion can be drawn for both pairs.
6.3 Summary
Based on historical data and a technical analysis on how outages impact the loads supplied by the
GTA East 230kV corridor currently, post-Clarington TS, and with MDS, Table 10 illustrates that
Clarington TS alone improves the reliability in the region by 77.8% while with additional
investment of $24M in MDS, further reliability improvement is insignificant (less than 4%).
Summary of Results Table 10
Options Total Annual Cost ($k) Annual Frequency of Interruption % Reliability
Improvement
Option 1a, Current System $632.16-$1,896.49 0.02364 -
Option 1b, post Clarington TS $101.28-$303.87 0.00524 77.8%
Option 2, MDS post Clarington TS $1,211.47-$1,234.37 0.00444 81.2%
In conclusion, the performance of all 4 circuits has been very good over the last 20 years. With
Clarington TS in service in 2018 the risk exposure on these circuits will be significantly less;
therefore, it is not justifiable to further invest $24M.
Finally, these costs will have to be recovered from the customers or rate payers consistent with
the TSC. Furthermore, MDS were considered to be ideal and 100% reliable in the course of this
assessment but in reality introduce a weak link in the system.

Transmission Planning Report – Load Restoration for GTA East Region August 31, 2016
Page | 18
WG is recommending that based on this assessment, Option 1b is considered to be the most
economical and reliable state of the system. No further action is required at this time.
7 Next Steps
Hydro One will continue with the Clarington TS and keep the LDCs informed of any delays with
the project. The finding of this study will be included in the GTA East RIP report expected to be
completed in Q4 2016.
8 References
[1] Line Switches Reliability Study by Gomaa HAMOUD, Hydro One – May, 2016
[2] Planning Process Working Group (PPWG) Report to the Board: The Process for Regional
Infrastructure Planning in Ontario – May, 2013
[3] IESO Ontario Resource and Transmission Assessment Criteria (ORTAC)
[4] GTA East Needs Assessment Report – April, 2013
[5] GTA East Integrated Regional Resource Plan (IRRP) Report – June, 2016


![GTA Region Investment Attraction - Toronto Global · PDF fileGTA Region Investment Attraction [operating as Toronto Global] Period from Year ended July 27, 2015 March 31, to March](https://img.dokumen.tips/doc/110x75/5aa0646e7f8b9a89178dfc0b/gta-region-investment-attraction-toronto-global-region-investment-attraction-operating.jpg)