Embed Size (px)
Citation preview

Lehigh UniversityLehigh Preserve
Theses and Dissertations
1982
Growth of esherichia coli by oxygen absorption ratecontrolled fed batch cultivationOthon StachtiarisLehigh University
Follow this and additional works at: https://preserve.lehigh.edu/etd
Part of the Chemical Engineering Commons
This Thesis is brought to you for free and open access by Lehigh Preserve. It has been accepted for inclusion in Theses and Dissertations by anauthorized administrator of Lehigh Preserve. For more information, please contact [email protected].
Recommended CitationStachtiaris, Othon, "Growth of esherichia coli by oxygen absorption rate controlled fed batch cultivation" (1982). Theses andDissertations. 5152.https://preserve.lehigh.edu/etd/5152
GROWTH OF ESHERICHIA COLI BY
OXYGEN ABSORPTION RATE CONTROLLED
FED BATCH CULTIVATION
by
Othon Stachtiaris
Chemical Engineering, Department
Lehigh University
May 1982
, /

CERTIFICATE OF APPROVAL
This research report is accepted and approved in partial fulfillment
of the requirements for the degree of Master of Science in Chemical
Engineering.
Engineering
-11-

To my family
-iii-

ACKNOWLEDGMENTS
I would like to thank Dr. Marvin Charles for his support, interest
and witty advice during the course of this work. Thanks also to
everyone in the department for they made my stay here a most enjoyable
and rewarding experience.
I am especially gratefull to my parents and uncle Achilles for
their encouragement, patience and financial support without which the
completion of this work would have been impossible.
-iv-

TABLE OF CONTENTS
Page
Title Page i
Certificate of Approval ii
Dedication iii
Acknowledgment iv
Table of Contents v
List of Figures vii
Abstract l
Section l Introduction 2
Section 2 Theory 8
Section 3 Experimental 16
3.1 Organism 16
3.2 Medium 16
3.3 Seed and Starter Cultures 17
3.3.1 Seed Preparation 17
3.3.2 Starter Cultures 17
3.4 Fermentation and Dissolved Oxygen Control 18
3. 4. 1 Bench Sea 1 e 18
3.4.2 Dissolved Oxygen Control 19
3.4.3 The Deep Jet Aeration Fermenter 21
3.4.3.1 Fermentation System 21
3.4.3.2 Operation 21
3.5 Analytical Methods 22
Section 4 Computer Simulation 24
-v-

Section 5 Results and Discussion
Section 6 Reconmendations
References
Appendix
~) j
. I -v,-
I I
..
Page
29
52
55
57

LIST OF FIGURES
Figure Page
1 The Deep Jet Aeration Fennenter 5
2 Cross Sectional Schematic and Main Dimensions 6 of the Vogelbush IZ Compound Pump
3 Dissolved Oxygen and pH Control 20
4 Turbidity Versus Cell Mass Concentration, 23 1.7% (v/v)Dilution of Samples, 540 nm
5 Responses of Pulse on-off, Pure on-off and Pro- 27 portional Control to Changes in the Controlled Variable
6 Cell Mass Concentration Versus Time for 30 Various Oxygen Transfer Coefficients; Computer Simulation, K = 0.004 g/1,
- -1 s µmax - 0.95 hr
7 Specific Growth Rate Versus Time for 31 Various Oxygen Transfer Coefficients; Computer Simulation, K = 0.004 g/1,
-1 s µmax= 0.95 hr
8 Glucose Concentration Versus Time for 32 Various Oxygen Transfer Coefficients; Computer Simulation, K = 0.004 g/1,
-1 s µmax= 0.95 hr
9 Specific Oxygen Demand and Specific Growth 33 Rate Versus Glucose Concentration. (Monod Kinetics, v0 = 0.875)
2
10 Dissolved Oxygen Trace 35
11 Cell Mass Concentration Versus Time; 38 Experimental Results
12 Glucose Consumption Versus Time; 39 Experimental Results
-vii-
Figure Page
13 Cell Mass Concentration Versus Time for 42 Different µmax and Ks; Simulation and
Bench Scale Experiment
14 Glucose Concentration Versus Time; 43
~· Simulation
15 Total Biomass Weight Versus Time; 45 Simulation and Bench Scale Experiment
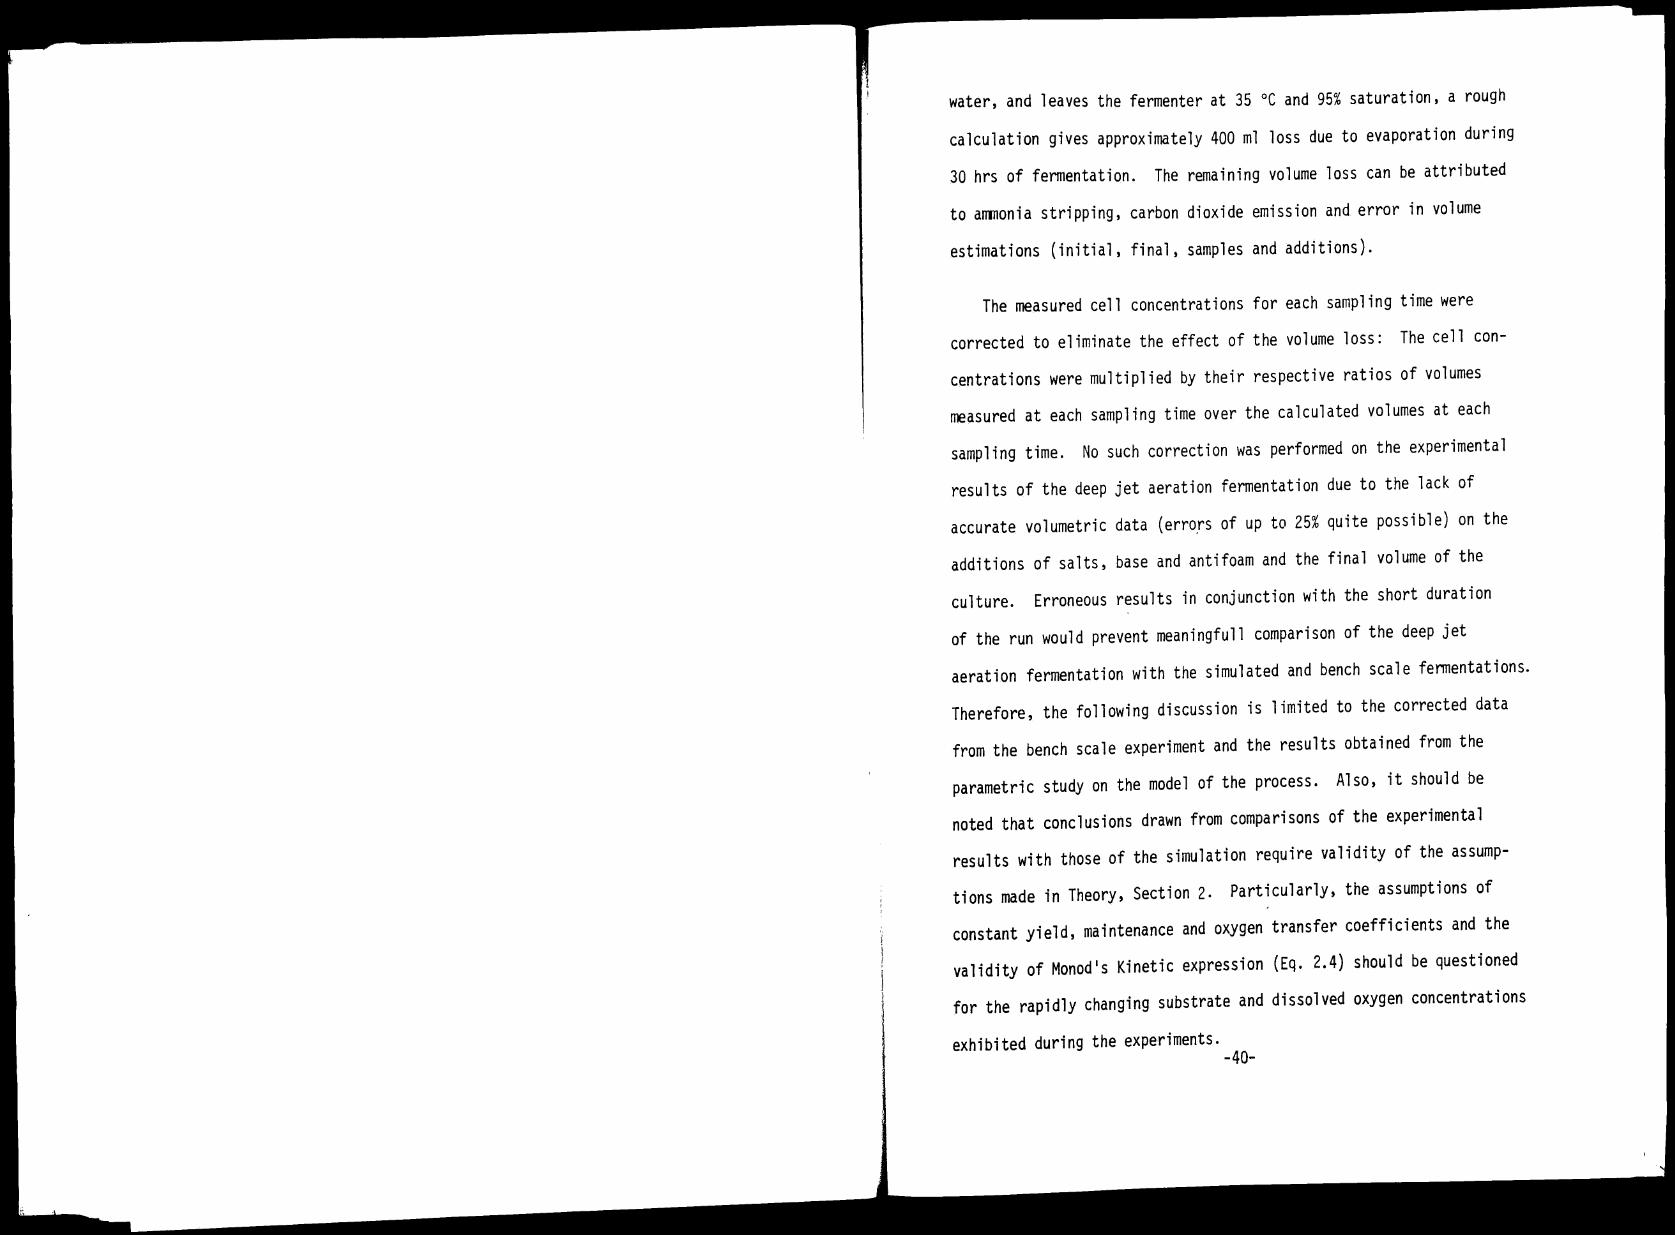
16 Total Culture Volume Versus Time; 46 Simulation and Bench Scale Experiment
17 Overall Glucose Yield Versus Cell 47 Mass Concentration; Simulation
(Ks= 0.004 g/1, µmax= 0.95 hr-1) and
Bench Scale Experiment
18 Repeated Fed Batch and 49
Repeated Batch Schedules
-viii-

ABSTRACT
The use of dissolved oxygen concentration measurements to regu
late the substrate feed to a fed batch fennentation for the production
of Esherichia coli has been studied and discussed.
Experiments were conducted in a conventional 7 liter bench scale
stirred tank and a 300 liter pilot scale deep jet aeration fennenters.
A simple on-off control system was used and the substrate was glucose.
The controller was functional and cell mass concentrations up to
40 g/1 were achieved. The experimental results were in good agreement
with the dynamic behavior predicted by a computer simulation of the
process.
-1-

1. INTRODUCTION
The growth of microorganisms to high concentrations with low
power requirements and efficient nutrient utilization has always been
a subject of tremendous interest in fermentation technology.
In a batch fermentation system, where a microorganism is grown
on a balanced medium which contains enough substrate for unrestricted
growth, the factor which limits the cell concentration to about 10 g
dry cells/1 1 is the oxygen supply rate to the culture. Furthermore,
Pirt2 and Nilson3 have found that the growth yield with respect to
the substrate is considerably lower in such batch cultures than in
cultures where the rate of growth is restricted by the concentration
of the carbon source, an effect that remains unexplained.4
Therefore,
growth of microbes to high concentrations with high substrate yield
coefficients depends on the ability of the fermentation system to
ensure oxygen availability and 'substrate restricted growth.
By keeping the oxygen demand of the culture below the maximum
oxygen transfer rate {MOTR) of the fermenter, Bauer5
was able to grow
E coli on sucrose to about 42 g dry cells/1. This was achieved by
regulating the substrate feed so as to limit the microbial growth
rate, thereby keeping the oxygen demand below the fermenter1
s MOTR.
The substrate feed flow rate was regulated according to the level of
the dissolved oxygen concentration in the culture. Such oxygen
absorption controlled fed batch fermentation has been used in
-2-

industry4'6 and was analyzed first by Hospodka7 who derived the funda
mental equations that describe the system.
Fed batch cultivation has a number of other advantages. It can
be used to overcome the inhibitory effects of precursors (e.g. phenyl
acetic acid) and other medium components. Furthermore, repeated fed
batch cultivation, where the continuous increase of the total culture
volume is interrupted by removing periodically a portion of the
culture can provide productivity greater than that achieved by simple
repeated batch fermentation and, in some cases, approaching that
attainable by continuous fermentation. The penicillin fermentation is
now run routinely as a repeated fed batch,as are baker's yeast fermen
tations and waste treatment processes. The theory of fed batch culti
vation has been the subject of several publications4
'8
, and computer
simulations have been developed.6
'8
In this work E coli was grown to high concentrations under
dissolved oxygen controlled fed batch cultivation. The substrate was
glucose. A simple control system was used to regulate the glucose
flow into the fermenter according to the dissolved oxygen concentra
tion level. The resulting low glucose concentration in the culture
ensured substrate limited growth and the oxygen demand was kept below
the MOTR by maintaining constant dissolved oxygen concentration.
Experiments were carried out in a conventional stirred tank
bench scale fermenter and in a 300 1 deep jet aeration fermenter
-3-

I
(recirculation fennenter). The Vogelbush IZ deep jet aeration fennen
ter that was used in the experiments is illustrated in Figure 1.
According to the concept of its operation, oxygen transfer and agita
tion are accomplished by using a high velocity recirculation loop.
The culture broth is recirculated by means of a specially designed
compound pump (Figure 2) consisting of an Archemedes screw booster
followed by a vented centrifugal section. The design and construc
tion of the impeller and volute chamber make the pump able to handle
liquid-gas mixtures with density as low as 0.6 g/ml. The recircula
ting broth aspires sterile air as it flows over a circular weir,
thereby creating a venturi effect. Air is aspired at rates higher
than 600 slpm, thus making the use of an air compressor necessary
only when the system is operated at pressures higher than atmos
pheric. The vertical return leg of the recirculation loop acts as a
wetted wall column and the high velocity liquid jet that is formed by
the returning broth provides intense plunging - jet mixing for improved
oxygen transfer with low power requirements. Heat transfer occurs as
the broth is pumped through the jacketed loop, independent of the
fennentation tank, thereby providing two distinct zones for mass and
heat transfer.
In addition to the excellent heat and mass transfer character
istics and its low power requirements, the deep jet aeration fermenter
is relatively simple to scale up and therefore, it should be considered
as an alternative to stirred tank fennenters for research and indus
trial use.
-4-

Heat Exchanger
pH Probe
Exhaust Gas
Motor Shaft
Figure 1:
Air Filter
Weir/Venturi
Air Inlet
Exhaust Gas
Fermentation Tank
JU --------~~~~~F~ed, acid,base ,etc.
Casing
The Deep Jet Aeration Fermenter
-5-
D.O. Probe

Orelle
IOMN-IZ
12MN•IZ
IIMN-IZ
20MN-IZ
24MN • IZ
30 MN -IZ
51oottucn1, .Ye, G,t1fr1r'I ,r.n1un
S1u1f1t:11l~.10I
~11()9 f1f'l9 Stalin()
,n<3uc1,
A
'-',:'MIi I~~ I
250 250 I JOO JOO
•OO •OO
~ ~
6()0 6()0
eoo 600 I
Figure 2:
•-- B --------- - C
__)
I ..
~--o----
A I B I C I 0 I e I , G d
230 I •JO I no I ).10 I )50 T 600 I )00 I oO
280 ~00 I 63~ f J~~ r ..00 I 700 I J'° i 70
JIO 700 1010 I •10 I ~30 I 850 I •llO I dO
•M 850 10~0 I l•O I 700 I 10~0 I 600 I 100
~ 1000 1100 I 710 I 610 i 1250 I 150 i 100
lllO 1000 1320 I 820 I 1050 I i~o I 600 ' 108
Cross Sectional Schematic and Main Dimensions of the Vogelbush IZ Compound .Pump
,-6-
d
I

The primary objectives of the experiments were to evaluate the
effectiveness of the oxygen control system and to investigate and
compare the overall performance of the process in the bench-scale
stirred tank and pilot-scale deep jet aeration fermenters.
A computer simulation of the process was developed using the
model which results from the equations that describe this fed batch
system. A parametric study was then performed on the simulation in
order to detennine the dynamic behavior of the process for different
values of quantities such as the oxygen transfer coefficient and the
Monad's kinetic parameters.
-7-

i \
2. THEORY
In a fed batch cultivation the total mass balance statement is:
Rate of mass accumulation
within the fermenter =
Rate of mass flow
into the fennenter
Assuming that all nutrients are added in one stream and neglecting
any mass losses due to arrmonia evaporation, carbon dioxide emission
and moisture in the exhaust air, the above statement becomes:
where
d(Vp) = F dt
V total volume of liquid in the fennenter 1
p liquid density g/1
t time hr
F total mass flow rate into the fennenter g/hr
(2 .1)
Expanding the differential and assuming constant density system, the
mass balance becomes:
dV _ F dt - p
Notice that F can be a function of time.
(2.2)
Under the same considerations, the mass balance based on the bio
mass concentration may be written as:
-8-
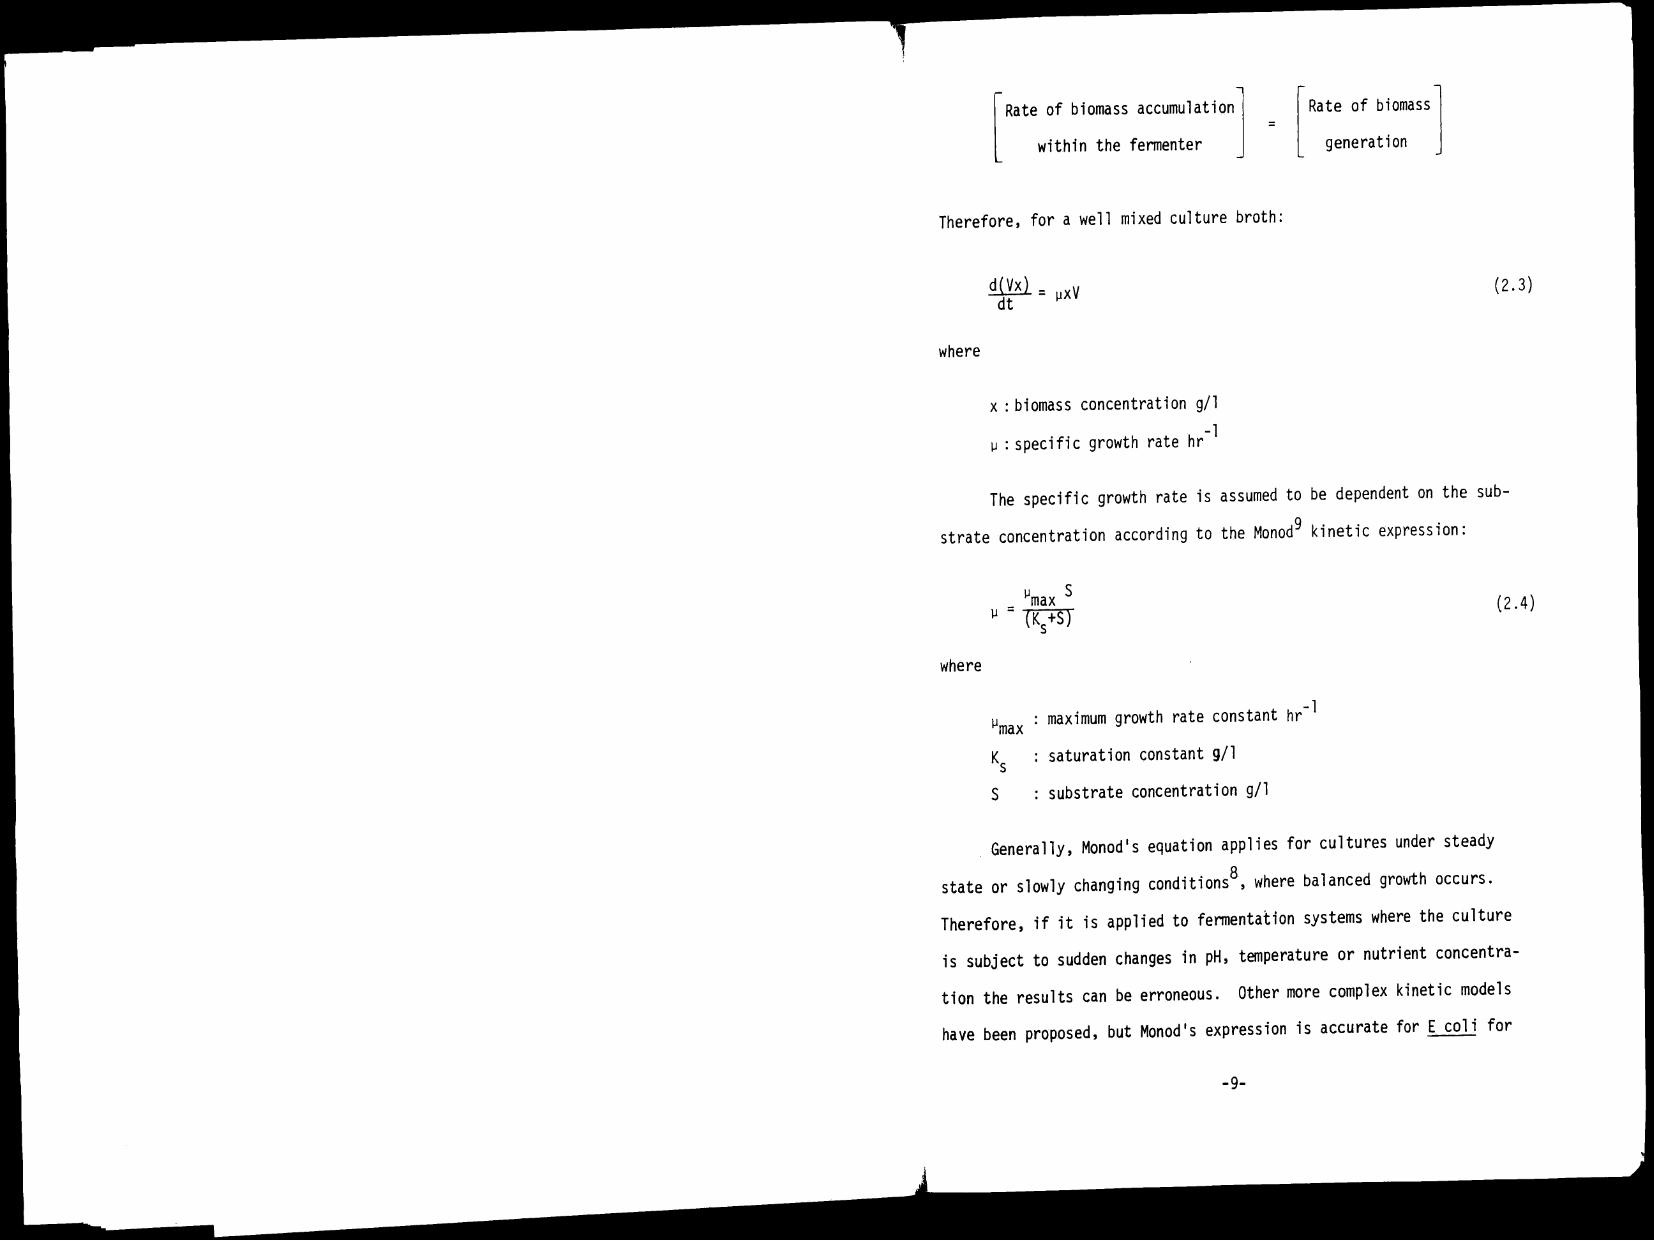
[
Rate of biomass accumulation]
within the fermenter
= [ Rate of b'.omass J generation
Therefore, for a well mixed culture broth:
where
d(Vx} = dt µXV
x : bi amass concentration g/1
µ: specific growth rate hr-l
(2.3)
The specific growth rate is assumed to be dependent on the sub
strate concentration according to the Monod9 kinetic expression:
µ = µmax S (2.4) (Ks+S)
where
µmax maximum growth rate constant hr- 1
Ks saturation constant g/1
s substrate concentration g/1
Generally, Monod 1 s equation applies for cultures under steady
state or slowly changing conditions8, where balanced growth occurs.
Therefore, if it is applied to fermentation systems where the culture
is subject to sudden changes in pH, temperature or nutrient concentra
tion the results can be erroneous. Other more complex kinetic models
have been proposed, but Monod 1s expression is accurate for E coli for
-9-
constant temperature and pH and midly varying dissolved oxygen and
substrate concentrations. It is used here for its simplicity.
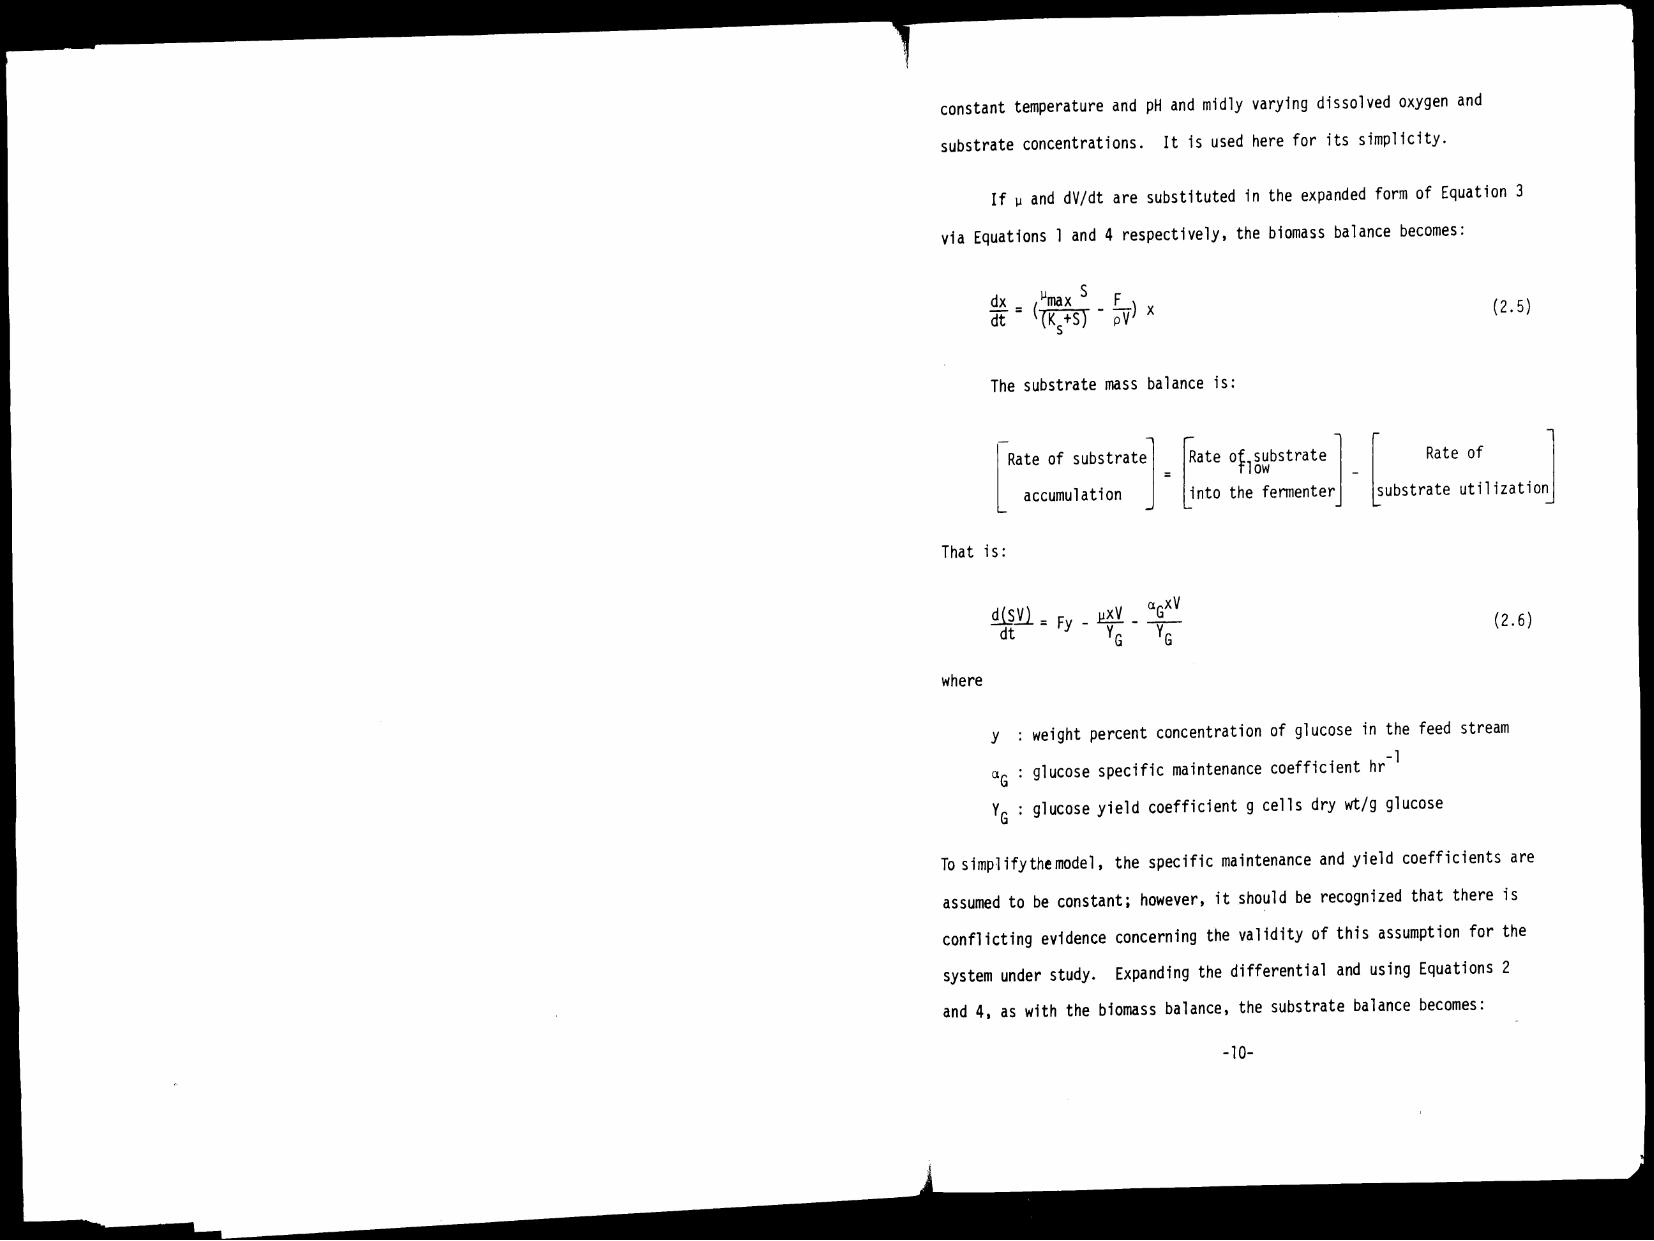
Ifµ and dV/dt are substituted in the expanded form of Equation 3
via Equations 1 and 4 respectively, the biomass balance becomes:
dx _ µmax 5 F dt - ( { K +S) - p V) x
s
The substrate mass balance is:
lRate of substratel =
accumulation j jRate of16~bstrate] _
linto the fermenter
(2.5)
j Rate of J ~ubstrate utilization
That is:
where
y
(2.6)
weight percent concentration of glucose in the feed stream
glucose specific maintenance coefficient hr-l
glucose yield coefficient g cells dry wt/g glucose
To simp1ifythemodel, the specific maintenance and yield coefficients are
assumed to be constant; however, it should be recognized that there is
conflicting evidence concerning the validity of this assumption for the
system under study. Expanding the differential and using Equations 2
and 4, as with the biomass balance, the substrate balance becomes:
-10-

dS - F( s) [llmax s X dt - V y - P - ( K +S) + aG] Y
s G
(2. 7)
Equations 2, 5 and 7 constitute a system of three equations in S,
x and V that model a simple fed batch fermentation process. In oxygen
controlled fed batch the substrate flow rate, Fy, is the variable that
is manipulated to control the dissolved oxygen concentration in the
broth. The flow rate, F, is not constant with time hence, two additional
equations in F and the dissolved oxygen concentration, C, are needed.
The first equation is supplied by an oxygen balance:
JRate of ox~gen] = jRate of ~xyge1 _
l accumulation Labsorpt1on J ,-Rate of oxygen uptakel
l by the organism J
The oxygen absorption term is usually expressed as:
where
* OTR = Kla (C - C)
OTR : oxygen transfer rate g/1-hr
Kla overall oxygen mass transfer coefficient hr-1
* C equilibrium dissolved oxygen concentration g/1
C bulk dissolved oxygen conce~tration g/1
(2. 8)
Since oxygen transfer occurs over an integral volume a mean driving
* force, (C - C)volumetric mean' should be used in Equ_ation 8. However,
in a well mixed reactor C can be assumed uniform throughout the volume.
-11-

Also, Tagucki and Humphrey10 have shown that c* changes only slightly
during the course of most fermentations. Therefore, a simple difference
is a reasonable approximation of the true driving force. Taking this
approach, the dissolved oxygen balance becomes:
where
a XV
~ = Kla(c* - C) V - QxV - -0-2-
Ya 2
Q specific oxygen uptake rate g0 /gcells-hr 2
: specific oxygen maintenance coefficient hr-l
oxygen yield coefficient g cells/g0 2
(2.9)
The specific oxygen uptake rate can be based on the specific growth rate
and therefore, on the substrate concentration via Monod 1s equation as
follows:
(2. 10)
After expanding the differential, substituting for dV/dt via Equation 2
and Q via Equation 10 and assuming constant coefficients, Equation 9
develops to:
dC * ) FC [µmax s ] X dt = Kl a ( C - C - Vp - ( K +S) + aO y
s 2 02 (2.11)
The second equation is the one that describes the action of the con
troller and has the fonn identified with the type of control used. On-off
-12-

pulse control (Section 3.4.2) was used in these experiments. The action
of pure on-off controller can be approximated best by the equation that
describes a hfgh gain proportional controller11 :
where
F = Fo + KC (C -C ) sp
Fo steady state value (= O for on-off control) g/hr
KC controller gain (high value for on-off control).
C dissolved oxygen concentration g/1
esp set point dissolved oxygen concentration g/1
(2.12)
An important part of every control system is the device (trans
mitter) that detects the value of the controlled parameter and translates
it to a signal to be received by the controller. For the oxygen control
outlined here, the transmitter used was a galvanic membrane covered
oxygen electrode. Its dynamic response to a change in dissolved oxygen
concentration can be represented by the first order lag model 12
where
CE : dissolved oxygen concentration as detected by the
electrode g/1
C true dissolved oxygen concentration g/1
TEF time constant referring to the diffusion film and
the electrode (only for nonviscous liquids) hr.
-13-
(2.13)

The effect of mixing lags is ignored here since perfect mixing was
assumed earlier to simplify the model.
Equations 2, 5, 7, 11, 12 and 13 provide the model of a fed batch
microbial growth under dissolved oxygen controlled substrate feeding.
Pirt4 has analyzed the dynamic behavior of a simple fed batch model
(Equations 2,5 and 7) and Dunn and Mor8 have compared it to the con
stant volume chemostat. They assumed constant feed flow and they showed
that 11 a dynamic steady state is achieved for sufficiently low flow rates
such that the specific growth rate is exactly maintained equal to the
dilution rate", or F/Vp = µ. Equation 5 then suggests that dx/dt = O.
In this respect fed batch behaves just like the chemostat. However,
since the volume increases steadily, the substrate concentration must
decrease to maintain equality between F/pV andµ (Eq. 5). This situa
tion is not a true steady state since only xis constant. The term
"quasi steady state" is used, after Pirt, to describe the phenomenon.
The model of the oxygen controlled fed batch should behave analogously
since the variable flow rate is the only difference. These aspects will
be discussed in some length later .
. At this point the assumptions embodied in the foregoing develop
ment should be su1T1T1arized:
a) No mass losses (flow into the fennenter only):
b) constant temperature, pH, density, yield and maintenance
coefficients;
c) single substrate limitation;
d) balanced growth;
-14-
e) Monad kinetics;
* f) (C - C) driving force for oxygen transfer;
g) constant oxygen transfer coefficient; and
h) perfect mixing.
-15-
! l l
l j
I
3. EXPERIMENTAL
3. l Organism
Escherichia coli strain W-3100 (ATCC E 19498) was used in all
experiments.
3.2 Medium
The medium used for the fennentations and the starter cultures
had the following composition (g/1), after Bauer13 :
K2HP04 3.0
KH/04 3.0
(NH4)2HP04 1.0
MgS04 . 7H20 2.0
anhydrous glucose grade III 5.0
yeast extract (BBL) 5.0
A solution of trace elements was -added to the medium to a concentration
of 3 ml of tr&ce elements solution per liter of medium. The trace ele
ments solution had the following composition13 (g/1):
FeC1 3 6H20 27.0
znc1·2 4H ·o 2 2.0
CoC1 2 . 6H20 2.0
NaMo04 . 2H20 2.0
CaC1 2 . 2H20 1. 0
H3Bo3 0.5
HCl (cone.) 100 ml
-16-

\
A solid persipitate, presumably a complex magnesium - potassium
phosphate, appeared after sterilization of the medium. Since its
presence caused no obvious adverse effects it was ignored. After
sterilization, the pH of the medium was 6.6. Shake flasks were
sterilized containing the complete medium; however, all fermenters were
sterilized without glucose to prevent its caramelization by the phosphate
reaction. Glucose was sterilized separately and then added to the medium
to the desired concentration before inoculation.
3.3 Seed and Starter Cultures
3.3. 1 Seed preparation.
The seed cultures were prepared as follows:
a) A stock culture was transferred to nutrient broth agar slants,
which were incubated at 35 °c for thirty two hours.
b) From the agar slants the cultures were transferred to 250 ml
shake flasks containing 50ml of sterile medium. The
cultures were grown at 35 °C and 250 rpm in a New Brunswick-G-26
incubator shaker for 16 hours.
c) The 50 ml cultures then were transferred to 2 liter shake
flasks with 450 ml of medium. As before, the cultures were
grown at 35 °C and 250 rpm for 16 hours, thus giving cultures
at their late logarithmic phases11
.
3.3.2 Starter Cultures
The 2 liter shake flasks containing 500 ml of culture were used
directly as starter cultures to inoculate the 7 l bench scale fermenters.
-17-
/
)

A 14 l New Brunswick Model 19 fennenter, with 10 l of medium was used
to inoculate the deep jet aeration fermenter. It was sterilized at 121 °C
for l hr, inoculated with 500 ml of seed culture and operated at 35 °C
and 400 rpm to give a starter culture containing about 6 g dry cells/1.
Before inoculation, a concentrated glucose solution was sterilized
separately and added to the fermenter to a concentration of about 20 g
glucose per liter of medium.
3.4 Fermentations and Dissolved Oxygen Control
3.4. 1 Bench Scale
The bench scale experiments were carried out in a 7.5 1 New
Brunswick MF-107 fermenter initially containing 3 l of medium. Agita
tion was provided by two pitched blade impellers operated at 600 rpm.
Air was sparged underneath the lower impeller at a rate of 6 1pm. The
pressure was atmospheric. Foam was controlled by automatic addition of
General Electric AF72 Silicon Antifoam (50% v/v). The temperature was
maintained at 35 °C, and the pH at 6.8. The pH control system operated
as follows: An Ingold steam sterilizable pH probe connected to a New
Brunswick pH-22 controller activated a Masterflex No 7014 peristaltic
pump, which in turn introduced small amounts of 18.7% (w/w) ammonia
solution into the fermenter whenever the pH dropped below the set point.
The a111T1onia was assumed to serve adequately as nitrogen source and
therefore, no other nitrogen was added except for the nitrogen initially
present in the medium. The anmonia consumption was determined by the
difference in the weight of the addition vessel. A solution of K2HP04,
KH2
Po4
and MgS04
. 7H2o was added periodically to the culture to
-18-

prevent interruption of the growth due to exhaustion of the initially
introduced potassium, phosphorous and magnesium. The amount of salts
added was detennined from cell concentration estimations and the
elemental composition of E coli 14 .
3.4.2 Dissolved Oxygen Control
The dissolved oxygen control system is illustrated in Figure 3.
A galvanic steam sterilizable dissolved oxygen probe15 (Abee series
A316) was connected to a New Brunswick 00-50 dissolved oxygen analyzer -
recorder. The O - 10 mV signal from the analyzer was transmitted to a
Speedomax H Leeds and Northrup controller which in turn was connected to
a timer. The timer (Ate Series 365 Computing Timer) was programmed to
generate a pulse output of adjustable duration each time it received
signal from the controller, i.e., each time the dissolved oxygen con
centration rose above the set point. The timer output activated an
adjustable flow rate Masterflex No 7016 peristaltic pump which pumped
58% (w/w) glucose solution into the fermenters. The set point dissolved
oxygen concentration was 40% of the saturation value.
The control system was activated the first time the dissolved
oxygen concentration dropped below the set point. Enough glucose was
supplied before inoculation to support growth up to this point only.
As with ammonia, the glucose consumption was recorded.
-19-

Ammonia Feed
pH Controller
D.0. Analyzer
pH . 0. Probe Probe
Fermenter
Controller
Timer
Figure 3: Dissolved Oxygen and pH Control
-20-
Glucose Feed

3.4.3 The Deep Jet Aeration Fermenter
3.4.3. l Fermentation System
The Vogelbush IZ deep jet aeration fermenter used for the
experiments was described in the Introduction (Section l .) A tempera
ture PIO controller, A pH proportional pulse controller, a PIO dissolved
oxygen controller, which adjusts the pump's speed and automatic foam con
tra l are built into the system. Furthermore, four 25 1 stream steril i z
ab le agitated tanks are connected to the fermenter and are used in con
junction with the controllers for acid, base, nutrient and antifoam
additions.
3.4.3.2 Operation
The deep jet aeration fermenter was operated with the oxygen
controller described in Section 3.4.2. The procedure was as with the
bench scale experiments (Section.3.4. 1). The operating conditions were
as follows:
Temperature PIO control, T = 35 °c
Pressure Approximately 1.2 atm
pH control Proportional pulse, pH= 6 .8,
12% w/w ammonia solution
Pump speed 900-920 rpm·; control on manual
Initial volume 200 l
Recirculation flow' rate Approximately 600 1pm
Air flow rate 650-700 slpm
-21-
,,/

Dissolved oxygen set point concentration
Glucose feed
Antifoam
40% saturation
58% (w/w)
10% (v/v) G.E. AF 72 silicon antifoam
Antnonia, salts and antifoam were added from the tanks mentioned
in Section 3.4.3. 1. Glucose was added from separate glass vessels:
a) To allow direct weighing and
b) because the dissolved oxygen control system could not
be interfaced easily with the deep jet's addition tanks.
3.5 Analytical Methods
Samples of the culture were taken every 1.5 hours. Glucose
concentration was detennined by means of a YSI Model 23A glucose
analyzer. Biomass concentration was detennined as follows:
a) Vacuum filter 3 ml of culture broth through 0.45 micron
pore diameter membranes;
b) wash the filtrate with 5 ml of deionized water;
c) dry cell-laden membranes at 105 °C overnight;
d) measure the weight of the dry cell-laden membranes
and calculate the dry cell weight by subtracting the
predetermined weight of the clean-dry membranes.
Figure 4 shows a cell mass con_centration versus turbidity
correlation which was derived experimentally and used only to estimate
the cell mass concentration during the fennentations. The turbidity of
the samples, diluted to 1.7% (v/v) with deionized water, was detennined
by means of a Baush and Lomb Spectronic 700 spectrophotometer at 540 nm.
-22-

40.0
,-i
'-.. tJ'I 35. 0
s:: 0 ·rl .µ (lj
~ 30.0 .µ s:: Q)
u s:: 0 u
Ul 2 5. 0
Ul (lj
~
,-i
,-i
Q) 20.0 u
15. 0
10.0
5. 0
0.0 0. 4 0. 8 1. 2 1. 6 2. 0 2 • 4
Turbidity
Figure 4: Turbidity Versus Cell Mass Concentration,
1.7% (v/v) Dilution of Samples, 540 nm.
-23-
/

4. COMPUTER SIMULATION
The process was simulated using the mathematical model defined by
Equations 2.2, 2.5, 2.7, 2. 11 and 2.12. The dynamic behavior of the
model was obtained by simultaneously solving the above equations via the
LSODE initial value ordinary differential equation solver routine16
,
written in FORTRAN for a digital computer. It should be noted that the
results of the simulation can only be a first approximation of the dy
namic behavior of the actual process, considering the assumptions and
simplifications embodied in the development of the model (Section 2).
For the simulation, the parameters of the model that characterize
E coli were chosen from the literature. Other process parameters were
chosen to fit experimental data.
The values of the glucose and oxygen yields and their respective
maintenance coefficients, as well as their dependence on environmental
conditions is a subject of considerable controversy. The values reported
by Mainzer and Hampfling17 in their study of the effects of temperature
on the oxygen yield and maintenance coefficients were used in this
simulation. At 35 °C the yield and maintenance coefficients for glucose
limited growth of E coli B were found to be approximately 14 g dry cells/
g atom O and 2 mg atom 0/g dry cells-hr respectively; the temperature
l dependence of the coefficients was, unexplainably, rather eratic. Sub-,! l ! ject to similar uncertainty are the values of 0.5 g dry cells/g glucose
and 0.028 hr-1 for glucose yield and maintenance coefficients respec
tively, that were used here as reported by Marr et .!1_18
for E co 1 i PS.
-24-
/

The equilibrium oxygen concentration at 35 °c was assumed to be
equal to 7.4 ppm, in agreement with values reportedlO,l 9,2o for
solutions similar to the medium used in the experiments. The set
point concentration was set to 40% of this value.
The generally accepted value for the saturation constant in the
Monad expression (Eq. 2.4) is 2.2 x ,o-5 M, or about 4.0 mg/1 for E coli
21 22 23 24 24 grown or glucose ' ' ' . Wang et~ report a growth rate of
0.82 hr-l for unrestricted growth of E coli on glucose and Shuler23
gives a µmax of 0.95 hr-l. To investigate the effects of the Monad's
constants on the dynamic behavior of the model, the computer program was
run for three different sets of Monad's constants all other parameters
being held constant. Similarly, the program was run for four different
oxygen transfer coefficients, all other parameters being constant.
Table l sul11llarizes the parametric study.
To simplify the prograrrming, _glucose, anmonia, antifoam and salt
additions were considered one feed stream containg 36% (w/w) glucose.
The above figure for the glucose concentration in the feed was calcu
lated from experimental data on additions by dividing the total weight of
the glucose added during the fermentation by the total weight of all
add it i ans.
The equation of a high gain proportional controller was used in the
simulation to approximate the type of "pulse" on-off controller used in
the experiments (Section 3.4.2). The responses of the manipulated
variable, F, to changes in the control variable, C, for proportional,
pure on-off and pulse on-off control are shown graphically in Figure 5. -25-
/

I
Table l: Parametric Study
Run# Ks (g/1) µmax(hr -1) Kla(hr-1)
l 0.004 0.95 300.0
2 0.004 0.95 500.0
3 0.005 0.75 500.0
4 0.006 0.55 500.0
5 0.004 0.95 700.0
6 0.004 0.95 900.0
-26-
I

0.0
u
QJ
r-i .n rd
-~ l-1 rd > C
'd sp
QJ
r-i r-i 0 H .µ I:: 0 u
Pulse On-Off
Proportional
Pure On-Off
~
Figure 5: Responses of Pulse on-off, Pure on-off and Pro port i ona l ,Control to Changes in the Controlled Variable.
-27-
I
Time
Time

l I
1 t i i I
The program was organized in such a manner as to ignore the action of
the controller when the dissolved oxygen concentration was lower than
the set point value. If no such action was taken, the program would
generate negative values since the steady state flow rate (Eq. 2.12)
was zero.
The equation that represents the measurement lag (Eq. 2. 13) was not
incorporated in the simulation. Similarly, the effects of the mixing
lag were ignored since the purpose of this modeling was to give an
insight into the performance of fed batch cultivation rather than to
investigate the function of different types of control. Proportional
control was used to facilitate the progranming. The computer simulation
of the action of an on-off controller is relatively simple. However,
the discontinuities (see Figure 5) in the time behavior of the manipu
lated variable, that are inherent in any type of on-off control, made
its use inefficient in terms of computer time, because a large number of
progressively smaller steps was required by the integrator to pass
through each discontinuity and carry out the simulation. The use of
proportional control eliminated such discontinuities and, as it turned
out, the dissolved oxygen concentration was maintained constant during
the simulation and the only difference between proportional and on-off
control (lags excluded from the simulation) was the small offset error
(app. O.li), which is a characteristic of proportional control 11
. The
savings in computer time though, were remarkable.
A complete run (No. 4 in Table l) of the computer program is given
in the Appendix. -28-
I

5. RESULTS AND DISCUSSION
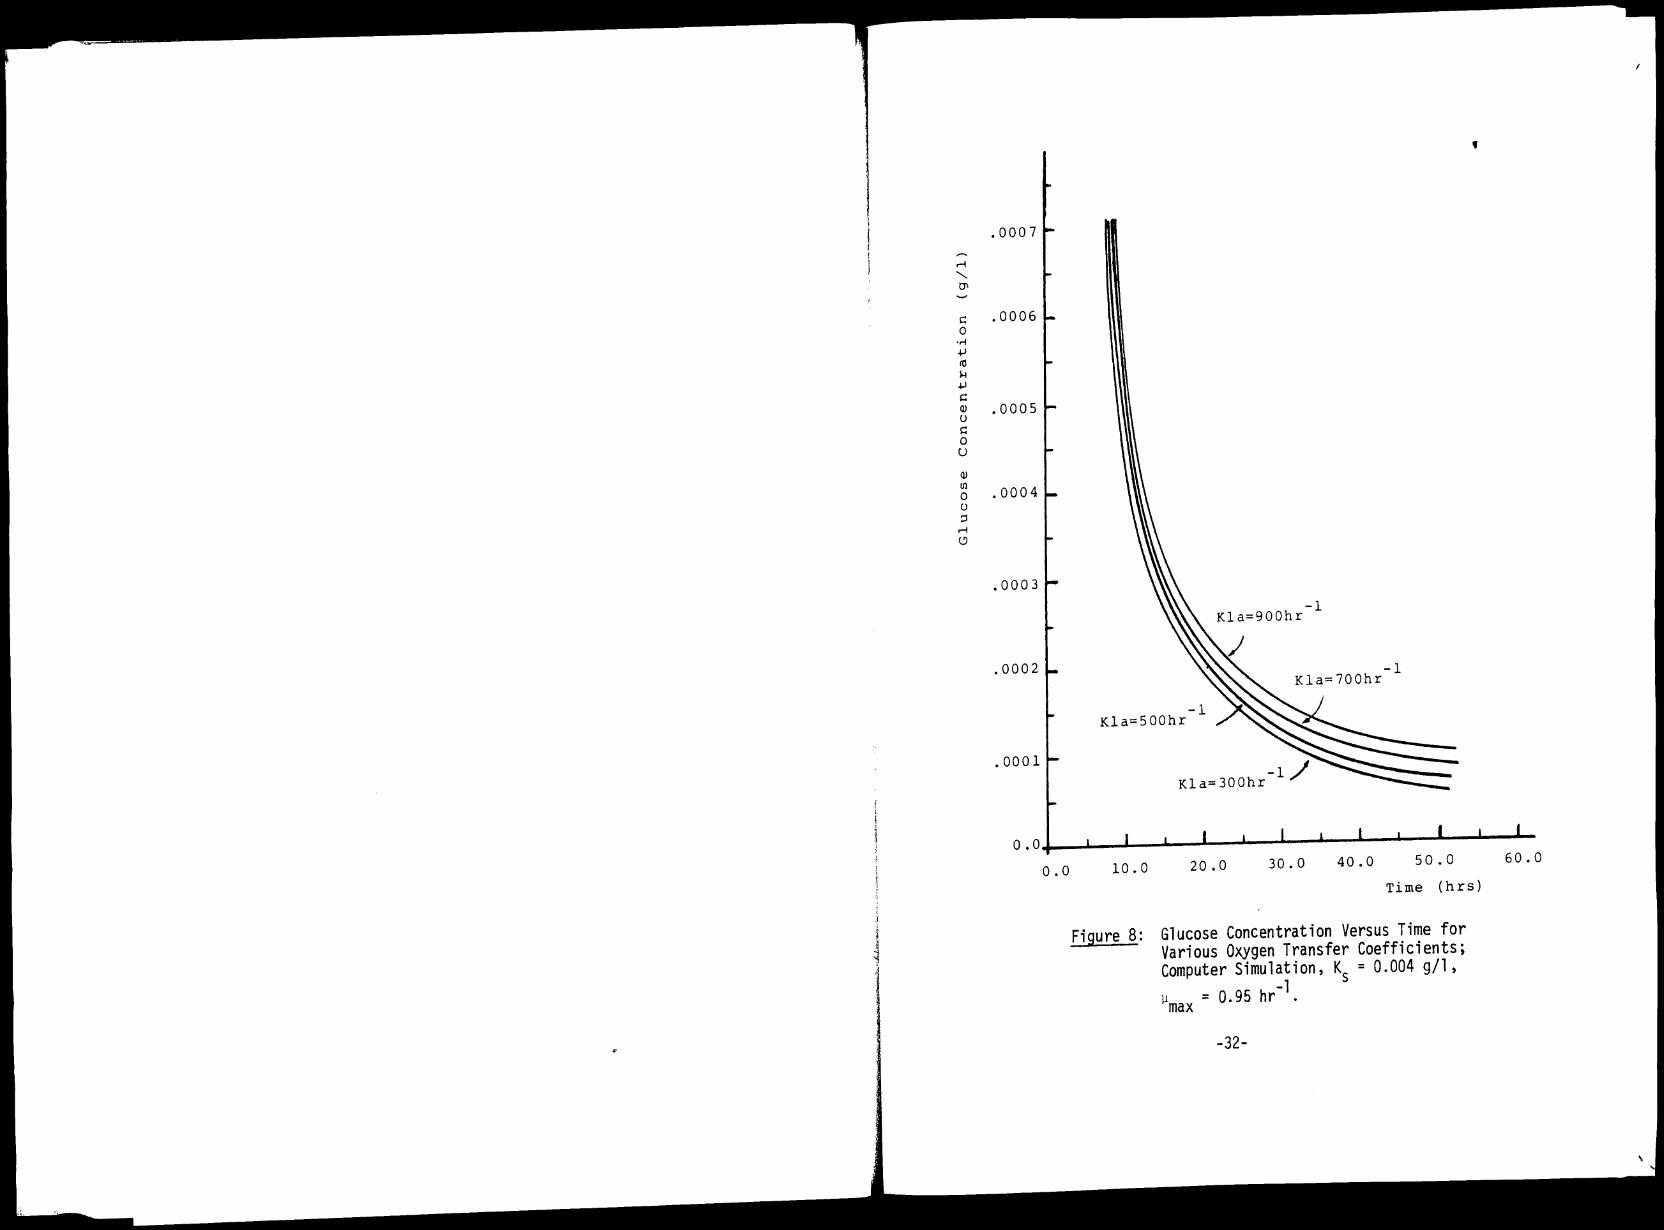
The growth curves generated by the computer simulation for different
oxygen transfer coefficients, runs 1, 2, 5 and 6 in Table 4. l are plotted
in Figure 6. As theory predicts, the biomass concentration reaches a
plateau and the specific growth rate decreases (Figure 7) as the quasi
steady state is approached (Eq. 2.5). Consequently the glucose concen
tration in the culture also decreases (Figure 8) due to the relationship
of the specific growth rate to the substrate concentration as expressed
by Monad's equation (Eq. 2.4). The above mentioned figures show that
high Kla values, i.e., high rates of oxygen transfer to the culture
result in high biomass concentrations and high specific growth rates at
the quasi steady state.
The simulation was not carried out to include the quasi steady state
because stability studies and hence, tuning of the control system were
not an objective of this work. A~ it will be discussed later, the
computer simulation can be implemented to facilitate verification of the
existence of the quasi steady state as predicted, and study of the per
formance of the process at the quasi steady state.
Equations 2.4 and 2. 10 state the dependence, according to Monad's
expression, of the specific growth rate and specific oxygen demand on the
substrate concentration. It is this dependence of the specific oxygen
demand on the substrate concentration that constitutes the basis of
dissolved oxygen control by manipulating the rate of glucose flow into
the culture. These relationships are the subject of Figure 9, which
-29-
I

r-i
" O'l
C 0
·r-l .I,.)
Ill ~ .I,.)
C Q)
u C 0 u U)
U)
Ill ~
r-i r-i Cl)
u
70.0 Kla==900hr -1
60.0
50.0
40.0
-1 30.0 Kla==300hr
20.0
10.0
0.0 ...... --...... __________ _._ __ _,_ __________ _.. __________ __. __ ...... ...._
o.o 10. 0 20.0 30.0 40.0 50.0 60.0
Time (hrs)
Figure 6: Cell Mass Concentration Versus Time for Various Oxygen Transfer Coefficients; Computer Simulafion, K = 0.004 g/1, µmax= 0.95 hr- .
5
-30-

.--I I H
..c:
(1) .µ Ill i:r::
..c: .µ ~ 0 H l'.)
u ·n ~
·n u (1)
P. U)
.14
.12
. 10
. 0 8
.06
.04
,02
-1 Kla=900hr
-1 ~ Kla=300hr /
O.u+--------------------------------------------------o.o 10.0
Figure 7:
20.0 30. 0 40.0 50.0
Time (hrs)
Specific Growth Rate Versus Time for Various Oxygen Transfer Coefficients; Computer Simulation, Ks= 0.004 g/1,
-1 µmax= 0.95 hr .
-31-
60.0
,..... r-4 '-. tJ'I
C: 0 -~ .µ ell H .µ C: a, u C: 0 u a, Ul 0 u ::l
r-4 c..,
.0007
.0006
.0005
.0004
.0003
,0002
.0001
Kla=900hr -1
-1 Kla=500hr
Kla=300hr
-1 Kla=700hr
-1/
'
o.o.._ __ _,_ __ _,_ __ _.. __ .,&.. __ _.,_ __ ..., __ ..... __ ...... ______ _. __ __. __ __. __
0.0 10.0
Figure 8:
20.0 30. 0 40.0 50.0
Time (hrs)
Glucose Concentration Versus Time for Various Oxygen Transfer Coefficients; Computer Simulation, K = 0.004 g/1,
-1 s µmax= 0.95 hr .
-32-
60.0

I \ 'j
l
r-i I
H ..c: --Q) .;J (1j
p::;
..c: .;J
~ 0 H (.'.)
u ·.-l 4-l ·.-l u Q)
0-! U)
1. 0
0.8
0.6
0.4
0. 2
o.o
1. 14
\ K =.004 g/1 s -1 0.91
µmax =.95 hr
\. Ks =.005 g/1
-1 µmax =.75 hr 0.69
\Ks=.006 g/1 -1
µmax =.55 hr 0.46
0. 2 3
&...--~----L-__ _,_ __ ......... __ ..... ____ .._ __ ...., ________ ~o.o
0.0 0.02 0.04 0.06 0.08
Glucose Concentration (g/1)
Figure 9: Specific Oxygen Demand and Specific Growth Rate Versus Glucose Concentration. (Monad Kinetics, Ya = 0.875)
2
-33-
H ..c: I Ul r-i r-i Q)
u tJ'I "-
N
0 tJ'I
'd s:: (1j
E: Q)
Cl
s:: Q)
tJ'I >, :< 0
u ·.-l 4-l ·.-l u Q)
0-! U)

{ \ l '
j l
shows that the specific oxygen demand is quite sensitive to very small
changes in the glucose concentration in an E coli culture, especially
for concentrations lower than 0.01 g/1. The high slope of the glucose
concentration versus specific growth rate (and oxygen demand) curves
and the rather low concentrations (less than 0.0003 g/1; see Figure 8)
at which control is feasible, are the result of the low values of the
saturation constant, K, that characterize the glucose - E coli s system. Gleiser and Bauer5 have shown for example, that E coli grown
on sucrose exhibits a K of 10 g/1 which makes the fermentation con-s
trollable over a wider range of higher substrate concentrations. How-
ever, for glucose, the low Ks value in conjunction with the measurement
and mixing time lags, makes the control of dissolved oxygen concentra
tion via the manipulation of the feed flow rate difficult and calls for
a sophisticated and accurate control system to be used if close control
is necessary. Indeed, the control system that was described in Section
3.4.2 proved to be inadequate for maintaining constant dissolved oxygen
concentration at 40% of the saturation value. Instead, it oscillated
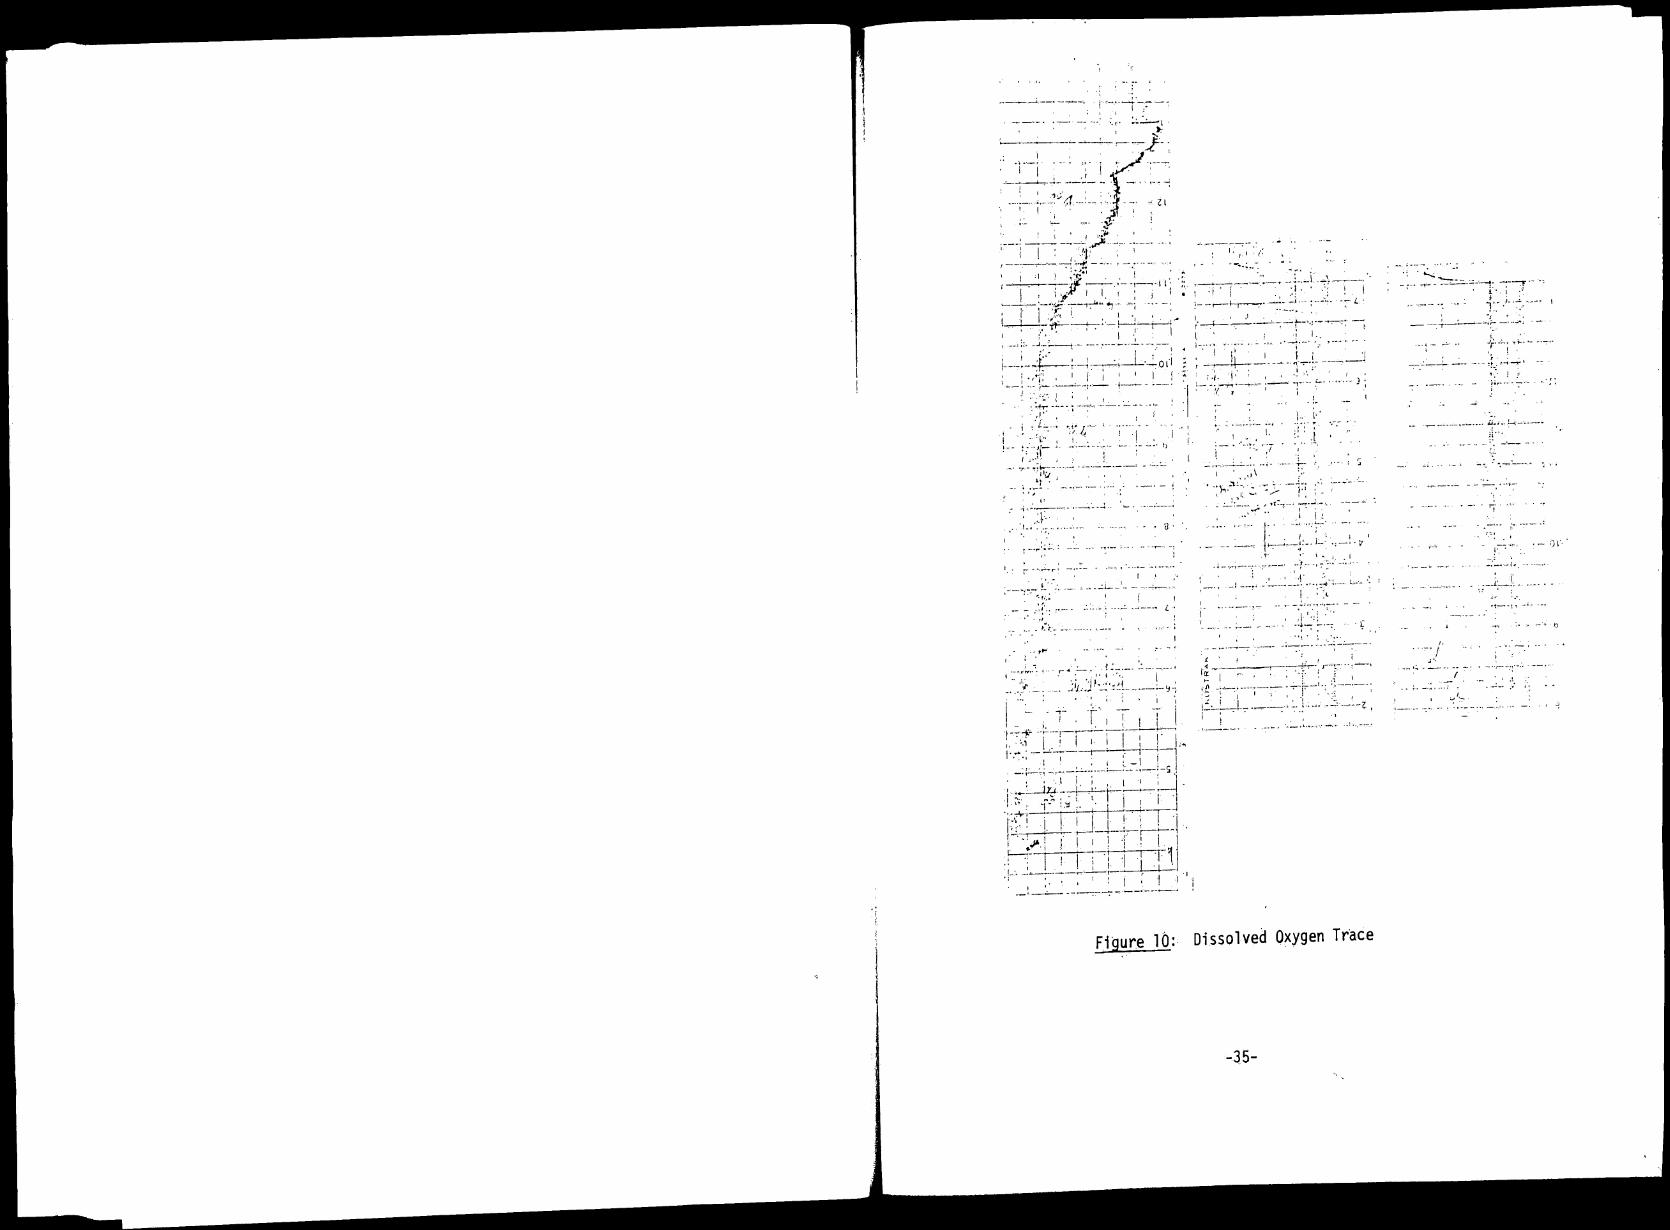
around the set point as it is illustrated in Figure 10 which depicts
the trace of the dissolved oxygen concentration for a typical experiment.
In the beginning of the fermentations, when the biomass concentra
tion was small and increasing slowly, there was little demand for oxygen
and the dissolved oxygen concentration was essentially equal to the
equilibrium (100%) value. As the culture entered the exponential growth
phase, the oxygen concentration decreased sharply and eventually reached
the set point at which time the control system was activated and
glucose feed started. Enough glucose (to about 20 g/1) was supplied.
-34-
··-- . --- ·---·. 1 ·--·· ;· •• . ' I •
1: ,_j ;:
. --... : .. ~ ·:. t~--~-~--~s-f- ~L',_i .. - 1
.~-·
• I : I . I . . · I . ' ::
;- -,---~7 . ~:-_::·:·: .. c·.'.. ·;- L ·
(~---------·-:-\·-:·-~· -~ I_ : •I I. t-···· --·--·-. - ·.,. ,--~--·. ~--~. ~-.
. \ l' I f '. •I
• I ,T.: I ,' . : f
~!t--1· .- ~---- - ·r~·(.- -----___ J i-1• I •
--1 :-_·;t~·~--- ;-- T ·- ~-. ····- 3;
. :. 1 .• ,.·
.. :~~ l_ •"-" .
.. , ,. . ' ., ... ·---- ··-------
J. !_::,·:-:.
--·-...:....--,
• u.
t •.• ,..·.-. ,·
.,-- ;_. ---~·· -1
r - , . ..-... r·
-- ... --- !_ ~ . • ... f.",;
,,, :·!·· ;•··-· .. ,
tr ..
........
I --~-~,..,-. ! ..
....
. ··- ·1 __ , __ - -,~.-
I
--·· -·. -··-- ···-·-·• L.
I ~- .·1'". f11, -u: 1'
.... •• • I I
., I
·1--:-+ .-,--,-.------------. ,_ ,., J . ; 1 , i I : ! · i _ 1· ... ·- -'------i-~-,- ...
. . ·: .. ~ ! , ' I ;_ -1 l -·,--. -.----- ·•··-· ·-· ., . ·-5 !
' • • ·._I i ; I 1 : j. II ...... '...--1Y_; --~-+--,1:--+-~ :___
. ~; : {-~ : ,':I :. '.. I _I I I .
·1t! ~- I ;.J_J __ C1-1~1 I ··,;,,. I I ! .. !I\ I ~I . I 1
·:. ·;- I ! I ! I ·1 1
.·1 ~I .. -· --~--~-i-~~-• I ' I I i ! -I -·-· -- .- . - _____ ....
Figure lb:
I.
·-· -·:· 'l I',
:t -- .. ---··- ·-·- -----,--
.. " \ ~· ·:r,-~:~- ·..:. ·-; ;- ,-i~j
:."l· .. ,. ,1: .... --, , __ _; ___ _ ~ ,· ,·
I ! !
!·.. . ·; .. -----~____. ___ ,: __ j.:_-
• ·I •:-··V
,. • .,·1.-···
T ·;
-l --..-.; _.• ! - ··I'··-·~-!, ... , !.--·-1--· · -'·,.
·----~-,.,
.f·:[ ·-· ' .. ·.
. . . . -·----- ... -.. -----· l
1•-------~--~ I
. ._. ";J-1-···:--1
•, ,1 I :t l :L_.' _' : :_ ( __ '. ·-\ __ . -z. I ' - . ,
! --- . ·--·l-~.--·· -· __ : ·-.---·
Dissolved Oxygen Trace
-35-
~ ; ... -~ ~-~ .. '-'·-r. ;·-er .. ·: 1:_· .'··~.---· I
' .. I ' I, --- .-r-------·~ -···--
t y . 1 ,~ .
' .. tt_:r-.~ 1
! r ii..----·
'
-- ---·--,-----· i.14 -•. _!-,-·.-~ ... : :.r
- ... -- ___ .,
------\•.
__1._r. -~--!· ...... ·-·
_·.;. !)
/. ~- I .. •.
--· 1 .. • --- - • -- - ... -· •·.-- -·,· -.. --- • --
I ' -- .. -'"•' .... . . --
~"~ -1----· ·--, -·. :.,

/ \
\( ' if
' 1 j I
before inoculation to support growth to this point. Once the control
was operative, the dissolved oxygen concentration oscillated around thet
set point with frequency and amplitude depending on the pulse length
and the speed of the glucose pump. These variables were being
adjusted continually during the course of the fennentations to
minimize the amplitude of the oscillations. Generally, relatively
high flow rates in short pulses gave the best results, since the
necessary amount of glucose was added quickly thereby reducing the
effect of the time lags. In the bench scale fennenter the dissolved
oxygen concentration was maintained between 20% and 50% of saturation
with approximately 4 Kg/hr flow of 58% (w/w) glucose solution in 0.5 sec
pulses. In the deep jet aeration fennenter the oscillations were
narrower (25%-43%) for flow rates of approximately 25 Kg/hr of 55%
(w/w) glucose solution flow in 4.5 sec pulses. The average period of
the oscillations was normally about 1 .5 minutes.
The oscillations of the dissolved oxygen concentration were the
result of the discontinuous addition of glucose caused by the action
of the on-off controller. Therefore, the glucose concentration in the
broth went through cycles similar to the cycles exhibited by the
dissolved oxygen concentration. Although these cycles of the dissolved
oxygen and glucose concentrations did not seem to inhibit the growth
of the organism, further studies should be done in order to accurately
assess their effects.
The experimental growth curves of E coli for the most successful
of several runs in the bench scale fermenter and the only run in the
··36-

deep jet aeration fermenter are shown in Figure 11. The arrows
indicate the times at which the controller was activated and glucose
feed started. Besides glucose, ammonia, antifoam and salts were
added to the cultures. Regulation of pH was strict; the pH control
was trouble free. Unfortunately the salt addition mechanism failed
to function properly during the deep jet aeration fermentation being
the cause of its short duration. Also, the salts, ammonia and anti
foam were added from the steel tanks described in Section 3.4.3.1 and
no system was installed to measure accurately the volumes of the
additions.
For the bench scale fennentation, 100 ml of 50% (v/v) antifoam,
10 ml containing*9 g Mgso4 . 7H2o, 12 g K2HP04 and 12 g KH2Po4,
250 ml of 18.7% (w/w) ammonia and 484 ml of 58% (w/w) glucose solution
were added to the culture. The final volume of the culture was calcu
lated by adding the volumes of the above additions to the initial
volume of tha.culture. The rate·of the volume increase was assumed
directly proportional to the known rate of glucose addition (Figure
12). In other words,a uniform feed stream of fixed glucose concen
tration was assumed as in the simulation. Comparison of the calcula
ted final volume with the measured value revealed a 650 ml discrepancy,
the volume of the samples being taken into account. Assuming that
the air is sparged at 7.5 1pm, enters at 25 °C and 65% saturated with
*A Mgso4
. 7H2o solution (9g in 20 ml of water) was separately from a
K2
HP04
and KH2
Po4{24 g total in 50 ml). If these salts were
sterilized together, a solid persipitate, complex potassiummagnesium salt, would form.
-37-

.-l
" tJ'I
~ 0
-~ .µ Ill 1--1 .µ ~ Q)
0 ~ 0 u
en en Ill ~
.-l
.-l Q)
u
40.0
35. 0
30. 0
2 5. O
20.0
15.0
10. 0
5. O
0-Bench Scale
•-Deep Jet Aeration
0.0..&,..--..L---'---LII&---'---...... __ -'-__ _,_ ___________________ .._ __
o.o 5. 0
Figure 11:
10.0 15 • 0 20.0 25.0
Time (hrs)
Cell Mass Concentration Versus Time; Experimental Results
-38-
30.0

a., ..-i. 40
C1l u U)
..c: u s:: a.,. 35 ~
. 30 O'I :,::
s:: 0
·r-l . 2 5 .µ Pl 6 ::, en s:: 0 u
.20 a., en 0 u ::, ..-i CJ . 15
.10
.05
0.0
c:: 0 -~ .µ C1l ~ a.,
..:i:
.µ <I) I'")
Pl a., a., Q
15.0
12 . 5
10. 0
7. 5
0- Bench Scale Fermenter
•- Deep Jet Aeration Fermenter
5. 0 10.0 15. 0 20.0
Ti me (hrs)
Figure 12: Glucose Consumption Versus Time; Experimental Results.
-39-
2 5. 0
water, and leaves the fermenter at 35 °c and 95% saturation, a rough
calculation gives approximately 400 ml loss due to evaporation during
30 hrs of fermentation. The remaining volume loss can be attributed
to a1TITionia stripping, carbon dioxide emission and error in volume
estimations (initial, final, samples and additions).
The measured cell concentrations for each sampling time were
corrected to eliminate the effect of the volume loss: The cell con
centrations were multiplied by their respective ratios of volumes
measured at each sampling time over the calculated volumes at each
sampling time. No such correction was performed on the experimental
results of the deep jet aeration fermentation due to the lack of
accurate volumetric data (errors of up to 25% quite possible) on the
additions of salts, base and antifoam and the final volume of the
culture. Erroneous results in conjunction with the short duration
of the run would prevent meaningfull comparison of the deep jet
aeration fermentation with the simulated and bench scale fermentations.
Therefore, the following discussion is limited to the corrected data
from the bench scale experiment and the results obtained from the
parametric study on the model of the process. Also, it should be
noted that conclusions drawn from comparisons of the experimental
results with those of the simulation require validity of the assump
tions made in Theory, Section 2. Particularly, the assumptions of
constant yield, maintenance and oxygen transfer coefficients and the
validity of Monad's Kinetic expression (Eq. 2.4) should be questioned
for the rapidly changing substrate and dissolved oxygen concentrations
exhibited during the experiments. -40-

The bench scale fermentation's cell concentration data points,
adjusted for the volume loss, and the computer generated growth
curves for different Monad constants and oxygen transfer coefficient
of 500 hr-l (Runs 2, 3, and 4 in Table 4.1) are shown in Figure 13.
The arrows again show the times at which the controller was activated.
The widely different maximum growth rate,µ , values do not influence max
the growth curve in any dramatic way. All curves tend to produce the
same quasi steady state where the specific growth rates are the same,
independent of µmax and saturation constants Ks' and equal to the
dilution rate of the culture (for the curves in Figure 13 the specific
growth rate is equal to 0.0171 hr-l at t = 51 hrs). Since the growth
rate is the same for all K - µ combinations, the substrate concen-s max tration in the broth (Figure 14) is higher for low µmax and high Ks
values; consider Figure 9. It is in the beginning of the fennentation,
when there is not severe oxygen demand and the growth is unrestricted
(high substrate concentrations,µ=µ x)' that the effect ofµ ax is . ~ m
pronounced. A low µmax value denotes slower unrestricted growth;
therefore the times at which the total oxygen demand reaches a value
high enough to cause the dissolved oxygen concentration to decrease
below the set point increase with lower µmax values. The experi
mental growth curve for unrestricted growth, i.e., up to the point
when the controller was activated gives a calculated specific growth
rate of approximately 0.3 hr-l and the· time at which the control was
operative is greater than that of the simulated curves (Figure 13) as
it could be predicted considering the previous discussion. Also,
once the control is operative, the experimental growth curve follows
-41-

45.0
40.0
~
' CJl 35. 0
t:: 0
•.-t .j..l (lj
~ 30. 0 .j..l
t:: I (1) C)
t:: 0 I u
en 25.0 I en (lj
:t I ~
~ I (1) 2 0 . 0 u I
15. 0
I I
10.0
5. 0
o.o 10.0
Figure 13:
I I
I I
I 1 I
I I
I -,,,,,,,. 5
,,_. ,,. /
/ /
/ /
~
/
/ /
I I
KEY
Curve# -1 -1 K (g/1) Kla(hr ) µ (hr ) s max
1 700 0.95
2 500 0.95
3 500 0. 7 5
4 500 0.55
5 300 0.95
0 - Expe rirnen tal Data Points
20.0 . 30. 0 40.0 50.0
Time (hrs)
Cell Mass Concentration Versus Time for Different µmax and Ks; Simulation and Bench Scale Experiment.
-42-
0.004 0.004 0.005 0.006 0.004
60.0

.0007
.0006 ,-j
' tJl .......
s:: 0 .0005 ·~ .µ l1l 14 .µ s:: (l)
0 .0004 s:: 0 u (l)
Ul 0 0 .0003 ;:I ,-j
l'J
.0002
.0001
0.0
o.o
-1 Kla=SOOhr
-1 µ =O.SShr
max K =0.006g/l
s
-1 Kla=900hr
-1 Kla=SOOhr
-1 µ =0.95hr
max K =0.004g/l
s
10.0 20.0
-1 µ =0.95hr
max K =0.004g/l
s
)
30.0 40.0 so.a
Time (hrs)
Figure 14: Glucose Concentration Versus Time; Simulation.
-43-
60.0

the simulated curves, suggesting that the oxygen transfer coefficient
is about 500 hr-l, which value is in agreement with literature values
for such stirred tank fermenters 24 .
The experimental glucose concentration in the broth did not
exhibit a diminishing trend as predicted by the simulation (Figure 14).
The measured concentrations were all approximately 0.2 g/1, obviously
in error considering Figure 9. This error is attributed to the
inability of the glucose analyzer to measure accurately very low con
centrations. Since there was not enough time between sampling, no
elaborate glucose analysis was perfonned.
The increases of the weights of the total biomasses in the cultures
for the simulated and bench scale fennentations are shown in Figure
15. Since there is an almost linear increase in biomass and assuming
constant yield and maintenance coefficients, the rate of glucose
consumption for cell synthesis is constant and the rate of glucose
consumption for cell maintenance increases with time. Therefore, the
rate of the total glucose consumption increases and the feed flow rate
into the culture increases too causing the total volume versus time
plots of Figure 16 to curve upwards. The effect of the glucose main
tenance requirement is depicted clearly in Figure 17 where the yield
coefficient based on glucose is shown to follow a decreasing pattern
as the cell concentration increases. The experimental overall yield
coefficient was calculated for the time intervals between inoculation
and each sampling. The large deviation of the experimental results
-44-

.µ .c: O"
600.0
·n 500. 0 (l)
~
Ul Ul C1l E: .o ·n '1l
400.0
300.0
200.0
100.0
Curve#
1 2 3 4 5
0-
KEY -1 (hr -l) K ( g/ l) Kla(hr ) µmax s
900 0.95 0.004
700 0.95 0.004
500 0.95 0.004
500 0. 5 5 0.006
300 0.95 0.004
Experimental Data Points 1
5
O.O-,i::;il6.....r---.-.-------...,-----~--~--~--~-'-~--'-~--'------'----
O.O 10.0
Figure 15:
20.0 30.0 40.0 50.0
Time (hrs)
Total Biomass Weight Versus Time; Simulation and Bench Scale Experiment.
-45-
60.0
(I)
s ;:l .-l 0 > .-l rtl .j.J
0 E-i
KEY
Curve# -1 -1 K ( g/1) Kla(hr ) µ ( hr )
max s 1 900 0.95 0.004
2 700 0. 9 5 0.004
3 500 0.95 0.004
9. 0 4 500 0.55 0.006
5 30 0 0.95 0.004
0- Experimental Data Points
2
5. 0
4. 0
3.0
o.~~------~• ___ ....... __ _._1 __ .... __ ~•-----"'--...A----------------....._ 0. 0 10.0 20.0 30.0 40.0 50.0
Time (hrs)
Figure 16: Total Culture Volume Versus Time; Simulation and Bench Scale Experiment.
-46-
60.0

I ' i . i
(I)
Ul 0 u ;:l rl {j
O'I
' Ul rl rl (I)
u O'I
'Cl rl (I)
-~ ~
(I)
Ul 0 u ;:l rl {j
rl rl co ~ (I) ::, 0
0.50
0.45
0.40
0. 3 5
0. 30
0. 25
0.20
o.J 0.0
0 0
Kla=900hr -1
Kla=300hr .-1 -1
Kla=500hr
o- Experimental Data Points
I t
10.0 2 0 . 0 30.0 40.0 50.0 60.0
·Biomass Concentration ( g/1)
Figure 17: Overall Glucose Yield Versus Cell Mass Concentration. Simulation (K =0.004g/l,
1 s µmax=0.95 hr- ) and Bench Scale Experiment.
-47-

from the yield coefficients of the simulation is attributed to
inaccuracies in the volume and glucose concentration measurements.
The error is amplified in the beginning of the fermentation because
of the small value of the glucose consumed in the denominator of the
yield ratio: 6 cell weight/6 glucose consumed.
Overall, 1350 g of glucose and 46 g of ammonia were consumed for
the production of 136 g of E coli placing the ammonia to glucose ratio
at O. 13 g NH3/g Glucose. This ratio, however, is not indicative of the
organism's nitrogen consumption because ammonia stripping affected
the rate of alllTlonia addition and the nitrogen dissolved in the culture
broth was not measured. It was not an objective of this work to
evaluate the rate of ammonia stripping. However, from the series of
experiments ran in the bench scale fermenter, it was concluded that
a1TJTionia consumption increased with increasing a1TJTionia flow rate,
ammonia concentration in the ammonia feed, and aeration and agitation
rates, as it could be predicted considering basic mass transfer
principles.
Figure 18 presents a rough productivity comparison between
repeated batch and repeated fed batch cultivations for E coli pro
duction. The unrestricted growth phase of the experiment, before the
controller was activated, (Figure 13) is used to approximate batch
cultivation and a turnaround time of 2 hours is assumed. Repeated
fed batch is considered to be at the quasi steady state because the
cell mass concentration versus time curve of Figure 13 does not
-48-

01
CJ}
40(50Xl03
) CJ}
rel :t
.-1
.-1 Q)
u .-1 rd .µ 0 t'"
30(50Xl03
)
o.o
Repeated Fed Batch: 3 6
3 (50 g cells/1) (15Xl0 1) == 2. 3Xl0 g cells
Repeated Simple Batch: · 3 6
6(8.5 g cells/1) (45Xl0 1) == 2.3Xl0 g cells
10.0 20.0 30.0 40.0 50.0
• I
I ~
Time (hrs)
60.0
Figure 18: Repeated Fed Batch and Repeated Batch Schedules.
-49-

change shape when a portion of the culture's total volume is removed.
Also it is assumed that the culture contains 50 g dry cells per l of
broth at the quasi steady state. The above cell concentration value
was obtained by extrapolating the Kla = 500 hr-1 curve in Figure 6.
Due to lack of quasi steady state data the culture volume is assumed
to increase linearly during the quasi steady state. The rate of
volume increase is assumed to be equal to the highest slope of the
volume versus time curves of Figure 16 for Kla = 500 hr-l which occurs
as the quasi steady state is approached (t = 52 hrs). Since Figure 16
shows that the culture volume increases exponentially the above
assumption will yield conservative productivity results for the
repeated fed batch process. The capacity of the hypothetical fennenter
to be used is taken to be 50,000 l, although this parameter does not
influence the results of the comparison and may determine only the
turnaround time of the repeated batch fermentation (i.e. the time
required to pump the culture out of the fennenter and refill it
with fresh medium), which is taken to be 2 hours. Furthermore, 10%
of the total volume, which contains 8.5 g cells/1, is assumed to serve
as inoculum and account for growth during filling of the fermenter for
·the repeated batch fermentation. The portion of the total volume that
is withdrawn when the maximum capacity is reached during the repeated
fed batch cultivation is assumed to be 30% of total volume. The
volume portion removed does not affect the productivity of the repeated
fed batch cultivation when linear volume increase is assumed at the
quasi steady state.
-50-

Under the above assumptions, the productivity of repeated fed
batch equals that of repeated batch, both giving about 42 Kg dry
cells of E coli per hour. However, this is an oversimplified compar
ison which tends to underestimate the productivity of repeated fed
batch by assuming linear volume increase at the quasi steady state;
quasi steady state data are essential for accurate assessment of the
fed batch cultivation 1s productivity. Also, since the growth rate
is at its lowest value at the quasi steady state (Figure 7), repeated
fed batch before the quasi steady state is reached, i.e., a combina
tion of repeated batch - fed batch, may yield the best productivity
results depending on the effect of the turnaround time.
In tenns of cost effectiveness, repeated fed batch appears to be
favorable over repeated batch if one assumes that the cost of pumping,
sterilizing agitating and product recovering is directly proportional
to the volume of the liquid that has to be processed. The cell
concentration of the fermentation product is 50 g/1 in the case of
repeated fed batch and 8.5 g/1 in repeated simple batch (Figure 18).
Therefore, the amount of liquid that has to be processed during
repeated simple batch cultivation is about 6 times greater than that
of repeated fed batch.
-51-

6. RECOMMENDATIONS
Although the basic aspects of dissolved oxygen controlled fed
batch cultivation have been examined and an experimental method has
been established, further work should be done in order to:
a) Improve the accuracy of the experimental results;
b) investigate the performance of the process at the
quasi steady state;
c) compare the perfonnance of the deep jet aeration fermenter
to that of the conventional stirred tank fermenters;
d) determine the validity of the assumptions embodied in
the development of the model of the process and implement
the computer simulation;
e) assess the effects of the oscillations of the dissolved
oxygen and glucose concentrations and determine whether
improved control is necessary.
The major source of error in the experimental results was the .
inaccuracy of the volume measurements. Therefore, a method for
measuring accurately the volume of the culture and of the volume of
the additions should be devised. Although the procedures described
in this report can be improved by recording carefully the weight of
all addition vessels at short and regular time intervals, the use of
an integrated feed which will contain all nutrients (glucose salts
and trace elements) for balanced additions should be considered.
Accurate volumetric data could be taken by recording the flow rate of
-52-

the feed. Anunonia or another nitrogen source could be included in
the integrated feed if the pH can be thus controlled.
Accurate measurement of the glucose concentration in the culture
broth is difficult due to the extremely low values encountered and
the high rate of glucose utilization. However, rapid sampling tech
niques and an analytical method more accurate than the glucose analyzer
(e.g. DNS) should be considered.
The organism's nitrogen consumption (nitrogen yield) should also
be evaluated, which requires accurate measurement of the amount of
ammonia added, evaluation of the aJTJTionia loss due to stripping and
measurement of the culture's nitrogen content.
The above suggestions could improve the accuracy and the effec
tiveness of the experiments which should be designed for long dura
tion to investigate the perfonnance of fed batch cultivation at the
quasi steady state. Quasi steady state data are needed in order to
determine the productivity of repeated fed batch cultivation. Also,
Figures 6 and 13 imply that the oxygen transfer coefficient is the
determinant parameter of the maximum biomass concentration attainable
at the quasi steady state. Therefore, cell concentration data at the
quasi steady state can provide an alternative way of evaluating the
oxygen transfer characteristics of the deep jet aeration fermenter
when compared to the simulation results and the bench scale stirred
tank fennenter.
-53-
The computer simulation can be extended to incorporate the
measurement and mixing time lags, which can be detennined experi
mentally. Also, better values for the model parameters that charac
terize the microorganism should be obtained experimentally. Then,
any control system can be evaluated and tuned for performance and
quasi steady state stability by means of the simulation before it is
purchased and used for real fermentations which are quite expensive
considering the vapacity of the Vogelbush deep jet aeration fennenter.
Furthennore, extensive parametric studies on any model parameter and
a search for an optimum productivity schedule can be perfonned by
the use of the computer.
Finally, the effect of the oscillations of the dissolved oxygen
and glucose concentrations, that result from the use of pulse on-off
control, should be assessed. If they are harmfull (no such indication
can be concluded from the experimental results) and must be eliminated,
a sophisticated control system should be used. Proportional - integral
- derivative control, where the derivative action can help to compen
sate for the effect of the time lags, is reconmended if the signal to
the controller is proved to be noise free 11 . Furthermore, galvanic
probes such as the one used here, with time constants of about 14
sec19 ,25 (Eq. 3. 13) are the slowest. Polarographic probes are con
siderably faster with time constants of about 7 sec19 . The advantages
resulting from the use of a polarographic probe, i.e., shorter measure
ment time lag, greater stability - less noise, decreased drift during
the fermentations and longer life, may well justify their high cost.
-54-
-...

REFERENCES
1. Bauer, S. and J. Shiloach, Biotechnol. and Bioeng. 16: 993-941 (1974). -
2. Pirt, S. J., J. Gen. Microbial., .1§_: 59-75 (1975).
3. Nilson, E. H., Doctoral Thesis, University of California, Davis, California (1960).
4. Pirt, S. J., J. Appl. Chem. Biotechnol., 24: 415-424 (1974).
5. Gleiser, I. E. and S. Bauer, Biotechnol. and Bioeng., 23: 1015-1021 (1981).
6. Shuichi, A., S. Nugui and Y. Nishizawa, Biotechnol. and Bioeng., 1.§.: 1011-1016 (1976).
7. Hospodka, J., Biotechnol. and Bioeng., §.: 117-134 (1966).
8. Dunn, I. J. and J. R. Mor, Biotechnol. and Bioeng., 17: 1805-1822 (1975). -
9. Monad, J., Ann. Inst. Pasteur, 79: 390 (1950).
10. Tagucki, H. and Humphrey, A. E., J. Ferment. Technol., 44: 881-889 (1966). ~
11. Luyben, W. L., Process Modeling, Simulation and Control for Chemical Engineers, pp. 318-320, McGraw-Hill Co., New York (1973).
12. Ruchi, G., Dunn, I. J. and Bourne, J. R. Biotechnol. and Bioeng., 23: 276-290 (1981).
13. Bauer, S. and White, M. D., Biotechnol. and Bioeng., 18: 839-846 (1976). ~
14. Schiloach, J. and Bauer, S., Biotechnol. and Bioeng., 17: 227-239 (1975). ~
15. Johnson, M. J., Borkowski, J. and Engblon, C., Biotechnol. and Bioeng., .§.: 457-468 (1964).
16. Hindmarsh, A. C., ACM-Signum News1etter, 15, No. 4, pp 10-11 (1980). ~
17. Mainzer, S. and Hampfling, J. Bacterial., 126: 251 (1976).
-55-

18. Marr,A. G., Nilson, E. H. and Clark, D. J., Ann. N.Y. Acad. Sci. 102 : 536 ( 1963) .
19. Yoshida, T., Yokouama, K., Chen, K. C., Sunoughi, T. and Toguchi, H., J. Ferment Technol., .§.i, No. 1, pp 76-83 (1977).
20. Linke, W. F., Solubilities of Inorganic and Metal Organic Compounds, 4th edit., p. 1228, American Chemical Society, Washington (1965).
21. Bailey, J. E. and Ollis, D. F., Biochemical Engineering Fundamentals, p. 346, McGraw-Hill Book Co., New York (1977).
22. Stanier, R. Y., Ingrahm, J. L. and Adelberg, E.A., The Microbial World, 4th edit., p. 287, Prentice-Hall, Inc., Englewood Cliffs, N.J. (1976).
23. Shuler, M. L., Leung, S. and Dick, C. C., A Mathematical Model for the Growth of a Single Bacterial Cell. Paper presented at an engineering foundation conference on biochemical engineering. Henniker, N.H., Aug. 20-25 (1978).
24. Wang, D. C., Cooney, C. L., Oemain, A. L., Dunhill, P., Humphrey, A. E. and Lilly, M. D., Fermentation and Enzyme Technology, pp. 74, 84,191, John Wiley and Sons, New York, N.Y. (1979)
-56-

APPENDIX
The following pages present a complete run (program - output) of
the computer program used for the simulation.
For this particular run (No 4 in Table 5. 1),
Ks = 0.006 g/1
µmax = O. 55 hr- l
Kla = 500 hr-l
-57-

)
04/ 73/73 OPT=O TDACE
PR C1 GR A M EC O L I <I ~JP UT , C UT P UT , T A PE 5 = I ~ P UT , T A F f 6 = CUT D UT)
r ••• C THIS PROGRAM WAS WRITTEN BY OTHON ~TA~HTIAQlS FOP THE ~IOTECHNOLOGY C RESEARCH C~N.TER AT L~HIGH UNIVERSITY. IT sr~utATES Tf-1£ F":D BATCt-1 C GROWTH rr f-COLI UMOFP SUPSTPAT'E LIHITl'ITI"N INOUCfD AY OXVGf.N APSf'RPTION CRATE CONTROLLED SURSTRATE FE~DING. r THE INTEPGPATOR USfO TO SOLVE THf SYSTf~ DF 0DfS THAT rESCRIBE T~E C SYSTEM IS THE •LIVER~ORE SOLVER FOR O~DINARY OIFF"ERENTIAL EQUATIONS•,
C AUGUST 13, 1g~1 VEPSION. c ••• C RFFERENCE •• C ALAN C. HINDMARSH, LSOOE AND LSOQI, TWO NfW INITIAL VALUE C ORDINARY DIFFERENTIAL ~OUATION SJLV~PS, C A CM.., S I G NU M NE W S LE TT E R , V O L • 1 5 , N J • 4 ( 1g P; 1 > , PD • t C -11 •
c ••• C AUTHOR ANO CONTACT· ••• C
AL AN C • HIN t-iA RS Ll,
MATHFMATICS ANO STATISTIC5 DIVISION, L-~1~ LAWPENCE LIVERMQQE ~ATirNAL LABORATO~Y LIVERMOPE-, CA 9~5SQ C
C C • • • C • • • C THE PAQAMETERS IN THE PROGP·A~ H·AVE TH:: FOLLOWH!G McA~!PIGS. C MOOEL PARAMETEPS,. C RI •• BROTH OENS11"Y, (GP/LT> C KLA •• OXYGEN TPANSFED COEFFICIENT. (1/H01 C CEQ •• EQUILIPRIUM OXYGEN CONCENTRATIO'l. (GP/LT> C CSP •• SET POINT OXYGEN CONCU!TRATION. {GD/Lr·, C KS •• SATURATION roNSTANT IN THE HONJO EXDRfSSION. (GQ/LT) C MMX •• "1AXIMUM GROWTH RATE" IN THE MO'lDJ EXPRESSION. < 1/HP) C YG,YO •• GLUCOS~ AND OXYGEN Y1ELOS. C MG,MO •• GLUCOSE AND OXYGFN MAINTENA~CE: C~EFFlCT~·NT~. (1/HO)
C YC •• GLUCOSE" CONCENTRATION IN THE FEED STREAM. ·cGR/L T) C FO,FF,E,KC,VX,CTP •• CONTPOL SCHEME PAQA~ETEP~. C All OTHEP PARAHEfERS APE USED PY LSOOE ~NTI PRTINT
C • • • C • • • c •.. COHMON/T/TIHE/Y/S,V,X,C/F/OSDT,OVDT,DXOT,DCOT
+/PARM/IP,~,N,NPAGE,NlINE,RF,PI,KL~,cE0,csP,CTR, + KS , ~M X , Y G ,. VO , Y C, MG , MC, _F O , FF, f, KC, I/ X
EXTERNAL FEX,OERV,PRINT DIMENSION ATOL(4l,RWORKf74l,IWORKt2~l REAL KS,MMX,KLA.,MG,MO,KC DI ~ENS ION Y(.4) IP=O M= 1 N=1 NPAGl:=1 NL INE= 0
C • • • C TO SET THf VALUES OF THE MOOE~ CONSTANTS
C • • • YG=Q.C:; MG= 0. 056 Y0=0.87S M0=0.032 KS=0.0060
-58-

73/73
M~X=0.55 KLA='5QO. CEO=O.G074 r,~p=J.JJ2gfi CT P= 0.001 '.5 YC=0.3£: F0=0.00 FF= 4 0 0 0. J KC= 8 '5 0 G. 0 PI=1050.0
C'P T-= 0 TPAC:
C • • • C TO INI~IALIZE TH~ nEPENOfN1 VAQIARLES
C • • • Y(1)=8.5 Y(2)=3.~5 Y(3)=0.3 Y(4)=CEQ
FTN 4.'3+'152
C • • • C' TO SET ALL PAP.AM!='TERS NEFf;EO FOR Pff INTEPGRAT0P.
C • • • I0PT'=1 00 10 L=5, 10 RWOPK(U=O.O HIOPK(U=O
10 CONTINUE IWC~Ktfi)=1000 NEQ=4 T= Q. 0 TO UT=O. 25· IT CL=2 RTOL=l.OE-3 ATOL( 1) =1 .• GE-6 AT OL ( 2") = 1. 0 E-3 ATOL(3)=1.0E-4 ATOL(4)=1.0E-7 I1' ASK=i ISTATE=1 LRW=74 LI W=24 t-ff =22
C TO S.ET THE PRINT.ING It\TEQ_VAL, TO :ALL THE IMTERGPATOR ANO TO C PRINT USEFULl STATISTICAL INFORMAfION.
C • • •
C • • • 00 40 !OUT=i,100
C • • • C LS r O E I S N OT P RO VI OED IN T H I S PR l'H O U T
c ••• CALL LSOOE(FEX,NEQ,Y,T,TOUT,I~OL,~TOL,ATOL,ITASK,I~TATf, + IOPT,RWO~K,LRW,I~ORK,LIH,JEX,MFl
NI=5 NO=f-
C • • • C NOTE THAT PRINT ANO OEPV NEED NOT 9E SOUBROUTTNES
C • • • CALL PPINT(NI,NO) IF<ISTATE,LT.OlGOT080
-59-
C4/

?AH ECOLI 73/7?. rP T= u ro ACr
40 rnuT=TOUT~t.855 WPIT~(NO,~O)IWORK(11l,IW0PK(12l~IW~QKft1)
FTN 4.~+5S2
60 FQDMAT~///,25X, + 12H.NO. STEPS= ,I4,11H ~O. F-S =,14,UH NO. J-S =,I4l
ST0P 80 WRITF(NQ,gQ)I~TATF go FOO~ATl///,22H EOROR HALT •• !STATE =,I31
srnP END
-60-

/
73 /7 7, OPT=O TPAC~ FTt: 4.Bt-552
surPOUTINf FEX(N~Q,T,Y,Y10T) 0 I t-' F NS I ON Y ( 4 J , Y or T ( 4 ) r, 0 MM ON/ T / T IM E / Y / S, V, X ,. C / F / DSC T , DVD .T, DY D T , ['CDT
t-/PAP~/IP,~,N,NPAGf,NLINE,PF,PI,KLA,CE~,CS 0 ,CTP, + K S , t-1 M X , Y G , Y O , Y r , MG , M O , F O , F F , E , KC , II X
PE AL KS,Mt-1X,KLA, HG ,~O,.KC
C • • • C TO I~TRFACf FEX WITH nEQV ANQ TO fALl nEPV
C • • • S= Y ( 1) V= Y ( 2) X= Y nl C=Y(.4) TI 1-AE=T CALL OERV vonT ( 1 t=OS()T YOOT(2J=OVQT YOOT(3)=0XOT YOOT (4) =OC[ll Rf TU~N
EN rJ
-61-
G4/

IMF OEPV 73/7 7 OPT=~ TPACF
SUPPOUTIN~ or:Pv COMHON/T/TIMC/Y/S,V,X,C/F/OSOT,OVQT,OXOT,rroT
+ /P AR t-4 / IP , M , N, NP A GE , t.J L I NE , PF, RI , KL A , CE n. , C ~P , r T P ,
+KS,~MX,~G,YO,YC,MG,MO,FO,FF,E,KC,VX
DfAL KS,MMX,KLA,MG,MO,KC
C • • • C TO PPEVEMT SUP,STRATE INTDQCUCTION 9EFCOF THE f"1ISSOLVEO
C OXYGEN CONCENTPATION OfCOfASES BELO~ THE Sf::T FOH1T
C FOR THE FIOST TIMf
C • • • IFP'.LT.2,GOTf''t
C • • •
C 4/
C THF FOLLOWING STATcMFNTS SIMULATf T~E ACTION or: THF C: PROPOPTIONAL CONTPOllfP. THE FLO .. INTO Tl-4f. FERMEtJTOP STARTS WHfN
C THE O.O. CONCFNTRATION EXEEDS THE SET POINT IJ.O. CONCENTRATIC'~!.
C • • • C CONTPOLLEP r::QUATIONS
C • • • E=(CSP-C) vx=-KC•E IF< VX. LT. 0. > 1/X-=O • I) IF(VX.GT.t.)VX=t.O
C • • • C VALVf Ef1UATIONS. HEPf CV A~lO SQPT(f)D/SP.r-P.)
C IS INCORPORATED INTO ON~ FIGLJPE.
C • • • F=FF•VX GOTOL+
1 F= FO IF<C.LE.CTP)GOT03 GOT04
3 M= M+ 1 IF ( t-4. GT. 2 0 l M= 2 0
It CONTINUE
C • • • C SY STEM1 S MOO::L O OE S
C • • • OSDT-=F•(YC-S/RI)/V-(M~X•~/(KS+Sl)•X/VG-MG•X
OVOT=F/RI OXDT=(MMX•S/(KS+Sl-F/(RI•v,,•x OCDT=KLA•(CE~-Cl-{MMX•S/(KS+S))•X/Y~-c•c/(V•DI)-MO•X
RETUPN END
-62-

\
73/77. OPT= 'l TPAC': ~T~! 4.s:i+SS2
SURROUT H!~ PR I NT (NI, MO) rOMMON/T/TIME/Y/S,V,X,C/F/CSOT,DVDT,OXQT,O(DT
+/PARM/JP,~,N,NPAGE,NLIN~~¢F,PI,KLn,~EO,CSP,CT 0,
+KS,MMX,YG,YO,YC,MG,MO,FO,FF,F,KC,~K REAL KS,MMX,KLA,MG,MO,KC IF<NLINE.GT.J·)GOT8300 WPITFHIO,t+OO)
4QO FORMAT(1H1) WPITE(N0,200)NPAGE
200 FOPMAT(//,65X,SHPAGE ,I3,///,13X, + 4HT IME, S X, gHSU 8S TP ATE, 4 X,5 HT OT AL,; X, 4 HC ELL , + IJ X , g H O I S SO L V !: 0 , 1 X , Fi H .GR CWT H ; 1 X , 7 HG t U :; 0 S E , / , +12X,7HFLAPSED,1X,13HCONCENTRATION,1Xt~HVOLUME,1X, + 1 31:l C ON C EN T RA T IO N, ~ X , 6 t:-' 0 X VG E M , 3 X , !+ ~H A T ~ , 3 X , SH Y IE LO , / , + 13 X , 5 H ( HRS ) , n X , 7 H ( GR/ l T ) , 4 X , 4 H < L_T) , 5 X , 7 H ( G c;i / LT ) ,
+ 5 X , 7 H ( GR/LT l , 2 X , 6 H ( 1 / H P > , 1 X ,7 H (GR/ G ~ ) , / ,
NL INF=~:LINE+8 300 PG=MMX•S/(S+KSl
IF(V.LE.3,352>GOTO SOD OY=<v•1-3.35•0~3)/((V-3.35)•1160.0•0.36-s•V+3.35•8.S)
50J WRITf(N0,1GO) (TIME,S,.V,X,C,~-G,OY) 1 CO FO ~ MAT (1 ~X , F5. 2, 4X , F 8. 5 , 4 X , F 6. 3, 5 X, C"E, • 3 , 4 X , F 8 • o ,.2 X , F 6 • 4, 2 X , FE:• 3)
10 N=tH1 NL TNf=NLINE+1 IF<NtINE.LT.S5l~ETURN NPAGE=NPAGE+1 Ml IN f:= 0
nOO CONTINUE RETUPN ENO
-63-
04/

........ \.
PAGE 1
T IHE SUBSTRATf TOT AL CELL OISS'.JLVf:l'.1 .GDCWTH GLUC osi::
ELAPSED C'ONCfNTP~TION VOLUt~F C ()NC ENTPAT TON oxvs::N p~ if YIELD
(HPS) (G~/L Tl (LT> .(GP/LTl (GQ/LT> (1/HP) <.G~/GP)
• ?.7 8.39914 "3.350 • 34, .0050!t1 .c::406 -I
.27 8.39914 3.350 .34~ • 0 0 5 3 !+ 1 ,Sf+ 96 -I
• Cj 2 13. 2 870.2 3.3s·o .401 .OJS871 .c;4gE, -T
.52 8. 2 87 0 2 3.350 .401 .00,871 , 5 4 gf, -I
• 5 2 8.28702 3.350 .401 .005871 .5496 -I
• '5 2 8.287G2 3. 3r:; a • f+ 01 .005871 ,5496 -I
• '5 ~ e.28702 3,350 .401 .005871 • S4gE, -I
.52 8.287C2 3.350 • 401 .00!:>871 , 54g6 -I
.52 8. 2 87 0 2 3 .35 0 .401 • 0 0 :,~ 71 .5496 -I
.52 8.28702 3.350 .401 .OOSB71 .'54Cl6 -I
.52 8,28702 :1,3SO ,401 .OIJ5'371 • '34 q"E, -I
.132 R. 2 87 G 2 3.~Su .40: .00:,871 .54g6 -I
• 5 2 8,287 Q 2 3, 3i:; 0 .401 .005871 .S406 -I
.52 g. 2 87 0? 3,350 .401 .OOSB71 • ti496 ·-I
.77 8,162'57 3. 3s a .461 .005733 • ti496 -I
.71 8.1 f:257 3.350 .461 • 0 Q F- 73 3 • c;4gF, -I
.11 ~. 162.57 3. 35 0 • 461 ,00::>733 • Cj 4 gE, -I
.77 8 .162 57 3. 35·0 ,461 .005733 .54g~ -I
.17 ~. 162 5 7 3.35C .4n1 , 0.0::> 73 3 ,c;4g6 -T
.77 8 .1 f:2 5 7 3,350 • 461 .oosi3J ,54g6 -T
.77 8.1 f:257 3,3SO • 46_1 .005793 • 54g6 -I
.77 8 .162 57 3. 35 0 • 46.1 .00&733 ,54gE, -I
1.03 8.017°5 ~.350 • t; 2 g .OOE>702 .s4gn -I
1.01 8. 0 t 7 95 3.350 • 529 .005702 • 5496 -I
1.03 a.011gs 3.35u .'329 .0067J2 , 5 496 -I
1,03 e.011g5 3.350 • 5 zg ,00:>702 .5496 -I
1.01 8,0179'5 3,3SO .,zg .OOf>702 .54g6 -.I
1,39 7.77234 3.350 .646 .0065~8 ,54gE, -I
1,39 7.77284 3.350 .641:> .0055!+6 .5496 -·r
1,39 7. 772 84 3.350 .646 .0005~8 • 54 g6 -I
1.39 7.77284 3.350 .646 .OOS5!+8 .5f+96 -I
1.3g 7. 772 84 3.350 .646 .OOS5~8 • t:496 -I
1. 3g 7.7728'+ 3,350 • 646 .OOo5!t6 .549fi -T
1. 75 7.ft7015 3.350 .1g8 .00:,358 .5496 -I
1.75 T,47015 "3. 35 0 • 79 0 .OOf>358 ,54gf, -I
1,7'5 1.i.101i::: 3.350 .7gJ .OOS358 • S496 -I
1.75 7.47015 3.350 .790 .006358 ,S496 -I
2.11 7.10395 3.350 • 964 .006129 • c; 4 95 -I
2.11 1.103g5 3 .35 0 .964 ._005129 .'3495 -I
2.11 7.10395 3.350 • 9.64 .005129 ,54gi; -I
2.48 6,65754 3.350 1,177 .00:>8'.9 ,c;4gc; -I
2. 4 '3 6. 6575 4 3.350 1., 177 .J0584g .54g5 -I
2,48 E,. 65754 3.350 1,177 .0058!+9 .54g5 -I
2.g8 5,86660 3.3SO 1.553 • 0 0 5 35 3 .5494 -I
2. 913 5,86660 3.350 1.553 .005353 .5494 -l
2.q~' 5.86660 3.350 1.553 • a os 3 5 3 .5494 -I
2.98 5.86660 3.350 1.553 .005353 .5494 -I
-64-

PAGF
TI~E SUPS TR ATE TOTAL CELL OISSJL~En GPOWT~ r,L UC OSf
fLAPSEn C O ~IC E M TR A T I C ~.' vnLUr-1f CONCENTPATI~~I OXYG:N R~TE V If LO
(HRS) (GR/LT) (LT) (GP/LT) (GP/LT) (1/HR) !GP/G~l
3.4~ l+.62502 3.3SO 2. 04 il .00!+700 .54g~ -I
3. 4 8 l+.'32'30? 3. 3'5 0 2. n1+ ~ .OIJ+700 .54g1 -I
3. 4 ~ 4,82502 3.350 2.04~ ,00!+700 • 54cn -I
3.ga )047280 3,350 2.Fig2 ,003Bj3 .54g1 -I
3.g~ 3, 4 72 8 0 3. 35(' 2.Figz ,0031\53 , 5 4 q1 -1
4. 4 0 2.01sg1 3.350 3.3~5 .002j'+3 .5484 -I
4. I+~ 2.015g7 3.350 3.:rns .oozgr.3 • 5 4 84 -I
4.6? 1. 0 56 4'3 3.35G 3.Fl1+1 .0023j~ .54E,g -I
4.76 .43362 3, 3 Su 4,137 .oczoog ,S425 -I
5. 0 3 .01460 3. 356 4. 65 0 .002gj1 .:!fqf\ .471
5,32 • 0 10 36 3.3n6 5,15q .002qs1 ,34~3 .!+6'i
5. fj) • 0 07 g 3 3.377 5.fig~ .0021s1 .~130 ,460
5.go ,006'36 3.3Rn 6.16? .oczg&1 .2~72 • 4 5 f
0,2g • 0 05 2 3 3. 4 '.J 0 6. 831 .002g&1 ,2562 .450
6,72 • 0 04 2 g 3,415 7.551 .0021jt .22g? • 41+5
7,og .00372 3,428 B, 11+q .0021:,1 • ?1 04 • 441
7,38 .0033Fi 3.4~FI Fl,622 .002gs1 .1q12 ,41q
7. qf, .082~8 3,459 g.552 .002g:">1 .1751 ,433
13. ?6 ,00260 ~.4f,g 10.ong .0021:it .1fi61 .431
8.84 .00225 3.i.go 10.qog .oozoj1 ,1500 • 4 2 E,
g.44 .001g8 3,512 11,816 .1Jo2gs1 , 1 :_<> 66 • 422
1 a. o 4 ,00176 3,534 12,7J3 .0Jzg51 .12 47 • 417
10.54 ,00162 3.552 13.424 ,0029:>1 ,1167 .414
11.04 .0014g 3.570 14.131 • 0029:; 1 • 10 q7 • 411
11.'54 .00138 3,5l3FI 14,825 .oo?gjt .1J27 • 4 0 P,
12.01+ .0J12g ).607 is.sos .OJ2961 ,GCJ?E. • 4 0 S
12.;4 .00120 3,62S 16,173 .002qs1 .ogzo .402
13.54 .00107 3.663 17. 471 .oozg:",t • 0 p, 3' • ~9c
14.37 .ooog~ 3,694 113,510 ,0023S1 • 0 75g ,3g1
15. 2 0 .oooqo 3,726 1g,51s .002gf>1 .011g •. ~ 8 7
16.03 ,000~3 3,758 20.4go .oozgjt ,066g • ,1i82
11.2q .00074 3.81}7 21.g17 .0023,1 • O 6 Do • 376
11.2g .00074 3,807 21,S17 ,0023:>1 ,OF-05 • 376
18.t;'5 ,00067 '3,856 23,277 ,0029:,1 • 0 '554 • 37 0
19.R1 .0~062 3.9:7 24,56g .002g:,1 • OS 13 •. ~64
21.28 .00056 3.966 26.001 .0023:>1 .0467 • 15 7
21.28 .00056 3.966 20 .'o o 1 .oozg51 .0467 , 35 7
22.75 .ooos1 4,0?6 27,35~ • 002'3:i 1 ,042g • 351
24.22 • 0 0 0 46 4.08R 28,f;37 ,0029&1 ,;j3g5 • :745
25.E,g .0001+4 4.150 2 g. 845 .0029S1 .0374 • ~~g
i
26.55 .00042 4.187 30.S21 .002g,1 • 0 356 • 33 c;
' i• 28.g2 .00037 4,290 32.26/i ,0023:>1 ,0322 , 326
30.92 .0003!+ 4,37g 33.62g .OQ29o1 .c207 • 31 '3
32.<:11 .00032 4.470 34.~8?. ,002951 • 0 27 8 .~12
32.91 .00032 4,470 34.88? .002g:">1 ,027R • 312
36.27 .00028 4,626 ~6.787 .0023;1 ,024l3 .301
3g.62 .00026 4,788 38.475 .002q,2 ,0225 • 291
-65-
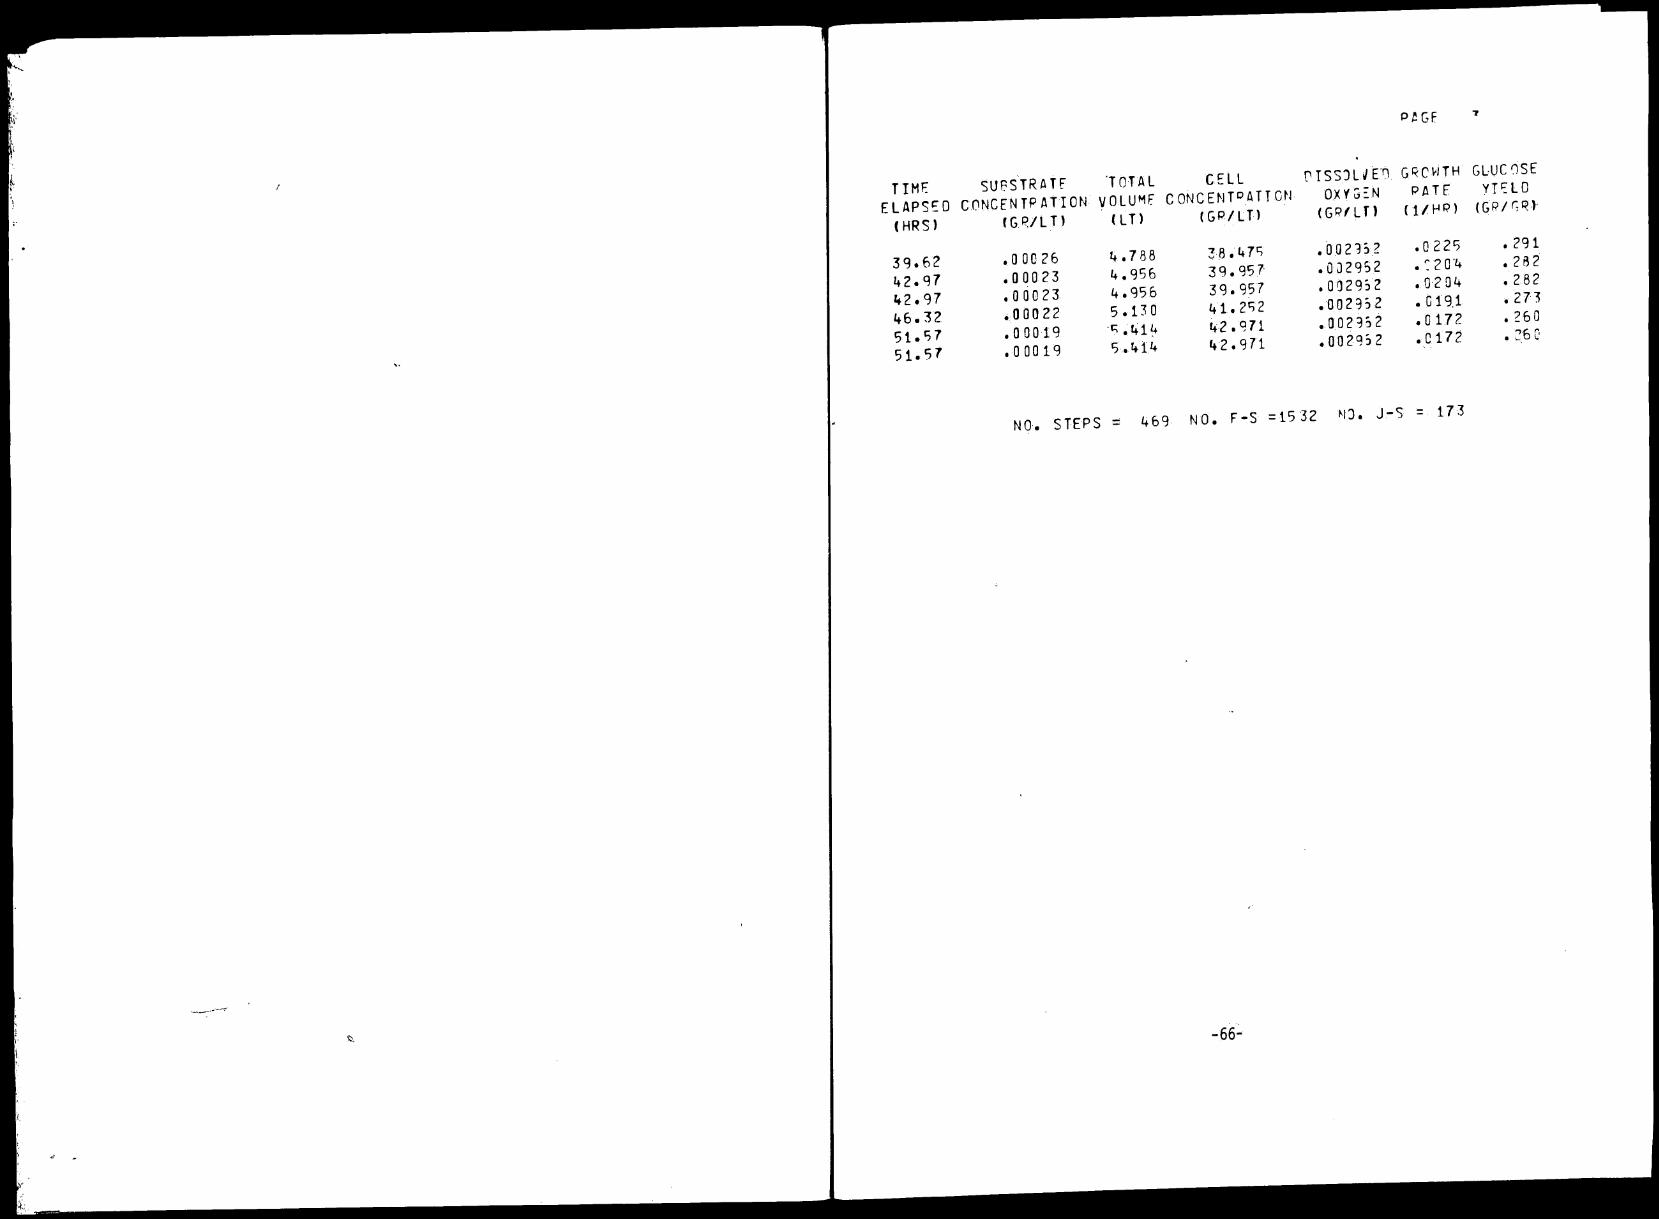
'· i· PtGF
' (
i. • I
'· TIME SUGSTRATf .TOTAL CELL t"'ISSJUET1 G ~C\.ITH GLUC '1SE
ELAPS~D CONCENTPATION VOLUMf CONCENTDATTOtJ O.X 'f c; ~ N PATE YT~LO
(HRS) fG~/l Tl (LT) (GP/LTl (GPfLTl (1/rlR) (GP/GRl
3g.62 .00026 4,788 38,!+F, .002'3:>2 • 0 2 ZS I zg 1
42.q7 .00023 4,gsEi 3 g. glj 7" .0Jzg52 • : 2 0·4 , 2 B 2
r.2.g1 .00023 4,g5E, 3 g. g5 7 .o~zg;2 ,0204 • 2 8 2
46.32 .00022 5,130 41, 2S 2 .002~,2 • G 19.1 .273
c;1.s1 .0001g ·t;.t+1~ 42,CJ71 .002~,2 ,0172 • 2 6 0
5t,S7 .0001g 5,!+14 r.2.g?1 .002g,2 ,C172 • 2f) Q
NO. STEPS= 4E,g NO. F-S =1532 ~I'.), J-S = 173
______ --:-
-66-