Embed Size (px)
Citation preview

Journal of Agricultural Science; Vol. 12, No. 2; 2020 ISSN 1916-9752 E-ISSN 1916-9760
Published by Canadian Center of Science and Education
138
Growth and Productivity of Irrigated Coffee Trees (Coffea arabica) in Ceres-Goiás
Eloisa Aparecida da Silva Ávila1, Cleiton Mateus Sousa1, Welington Pereira2, Vinícius Gonçalves Almeida1, Jefferson Kran Sarti1 & Daniel Pereira da Silva1
1 Instituto Federal Goiano, Campus Ceres, Ceres, GO, Brazil 2 Ministério da Agricultura, Empresa Brasileira de Pesquisa Agropecuária, Pecuária e Abastecimento, Brasília, DF, Brazil
Correspondence: Eloisa Aparecida da Silva Ávila, Instituto Federal Goiano, Campus Ceres, Caixa Postal 51, Rodovia GO 154, Km 03, s/n, Zona Rural, CEP: 76.300-000, Ceres, GO, Brazil. Tel: 62-98457-3458. E-mail: [email protected]
Received: July 3, 2019 Accepted: December 17, 2019 Online Published: January 15, 2020
doi:10.5539/jas.v12n2p138 URL: https://doi.org/10.5539/jas.v12n2p138
Abstract
The objective of this work was to evaluate the growth and productivity of cultivars and progenies of arabica coffee under irrigation by driping in Ceres-Goiás. It was conducted in the experimental area of the Goiano Federal Institute-Ceres Campus. A total of 35 treatments were randomized blocks with four replications, from January 2017 to August 2018. At 30 and 36 months after planting, the diameter of the orthotropic branch, canopy diameter, plant height, number of nodes in the plagiotropic branch 1, length of the plagiotropic branch 1, number of nodes in the plagiotropic branch 2, length of the plagiotropic branch 2, length of the plagiotropic branches 1 and 2, number of nodes of the plagiotropic branches 1 and 2 and productivity were evaluated in 2018. The linear simple correlations were estimated in all evaluated characteristics. There was a difference in growth and yield of the evaluated genotypes. There is a positive correlation among the vegetative characters and the productivity. Catucaí Amarelo 2SL presented higher growth than the other evaluated genotypes. The genotypes Catiguá MG 1, Acauã Novo, Acauã 2 and 8, Catucaí Amarelo 24/137, Catucaí Amarelo 2SL, Asa Branca, Paraíso H419-10-6-2-10-1, Catuaí Vermelho IAC 15, Acauã, Sarchimor MG 8840, IPR 98, Araponga MG 1 and Obatã Vermelho IAC 1669-20 were the ones that had the highest productivity.
Keywords: production, genotypes, vegetative characters, irrigation
1. Introduction
The coffee tree originates in Africa, from regions where there is an extensive period of drought. This fact led several species of this plant genus to develop an adaptation to different edaphoclimatic conditions (Aerts et al., 2017; Herrera & Lambot, 2017). Due to its high demand and economic relevance, it is therefore necessary to find genetic material that adapts to different regions and presents higher productivity.
The custom of drinking coffee was given by the Arabs (Aerts et al., 2017). Currently, it is considered the most consumed beverage in the world, Brazil being the second largest consumer, losing only to the United States (CECAFÉ, 2018). Its importance in the world agricultural scenario is due not only to the economic bias, but also to political and socio-cultural aspects (Aerts et al., 2017).
In 2018, there was a record in coffee exports, but this growth was already accelerating since 2012 (ICO, 2018a). In Brazilian agribusiness, production in the 2017-2018 crop year was 51 million bags of coffee and this represents 31.9% of world production, followed by Vietnam, 18.5% and Colombia, 8.8% (ICO, 2018b).
Commercial coffee began to be produced also in the Cerrado and its expansion occurred because production can be favored by aspects such as topography and temperature, combined with irrigation, fertilization and production technologies (Krohling et al., 2017). Goiás is in the eighth position in the national ranking, where 195.4 thousand sacks, exclusively of the Arabica type, were produced that year under irrigation regime (CONAB, 2018).
The increase in night minimum temperatures has been a factor that has affected the production of coffee, in the last harvests, in several places like Tanzania, Colombia, India and Southeast Africa (Krohling et al., 2017). Producers of coffee from around the world are looking for solutions to optimize production, lower costs, and

jas.ccsenet.org Journal of Agricultural Science Vol. 12, No. 2; 2020
139
worry about sustainability, through partnerships between scientists and cooperatives, both governmental and nongovernmental, focusing on training and search for new research and modern production techniques (Lambot et al., 2017).
Comparing the vegetative characteristics with productivity is an important method to study the adaptation of genotypes, observing their performance in a certain region (Rodrigues et al., 2012). The main criterion of selection in coffee is productivity and, for the recommendation of cultivars, it is essential to observe the interaction of the genotype with the environment (Krohling et al., 2017). Genetic variability is a determinant of the differences between coffees (Kitzberger et al., 2014). The genetic divergence among Arabic coffee cultivars can be decisive in the adaptation to the edaphoclimatic conditions of the environment, some being more resistant to pests, diseases, abiotic factors, water deficit, among others.
The evaluation of the cultivar architecture during its development cycle allows the selection of those that are more resistant and, at the same time, more productive. Productivity is one of the most important variables, especially when irrigation is used (Vicente et al., 2015). Studies on the architecture of the coffee tree have collaborated very effectively with the breeding programs, in the recommendation of new cultivars through the selection and validation of coffee progenies (Castanheira et al., 2016). The identification of cultivars with greater tolerance to different edaphoclimatic conditions becomes an essential factor for the growth of the national coffee industry. The objective of this study was to evaluate the growth and productivity of cultivars and progenies of arabica coffee with drip irrigation under Ceres - Goiás soil and climatic conditions.
2. Material and Methods
The experiment was implemented in April 2015, but this study was conducted from March 2017 to October 2018, at the Goiano Federal Institute-Campus Ceres, located in the mesoregion of the Centro Goiano, in the city of Ceres-GO. For the evaluations of this work, the data of the second production cycle, that is, of the 2017/2018 harvest, were considered. The municipality of Ceres is located in the Valley of São Patrício, has the geographical coordinates and edaphoclimatic conditions, respectively: South latitude 15o21′00.67″, West longitude: 49o35′56.98″, approximate altitude of 570 m.
The climate of the region, according to the classification of Köppen, is Aw type, warm and semi-humid with well defined season, from May to September, with average annual temperature of 27.7 oC, with minimum and maximum averages of 19.0 and 36.4 oC, respectively. The average annual rainfall is about 1,601 mm. The relief is gentle. The soil is characterized as Red Latosol (Santos et al., 2013).
For chemical characterization of the soil, samples were collected about two months before the experiment was installed. The chemical and physical properties of the soil in the experimental area are: 37.7% sand, 8.3% silt and 54.0% clay; pH (in water) = 5.80; M.O. = 20.30 g dm-3 (colorimetric); P = 12.8 mg dm-3; K = 0.2 cmol dm-3; Ca = 3.0 cmolc dm-3; Mg = 1.80 cmolc dm-3; H + Al = 2.70 cmolc dm-3 (SMP buffer at pH 7.5); and V = 65.7%. The methodology used for all soil analyzes followed the recommendations of Embrapa (2013) and were done at the Soil Laboratory of the Goiano IF-Ceres Campus.
The fertilization was done according to the recommendation of the 5th modified approach of the Soil Fertility Commission of the State of Minas Gerais (Guimarães et al., 1999) and based on the results of the soil analysis.
Nitrogen (ammonium sulphate) and potassium (potassium chloride) applications were carried out in 3 plots on 09/22/2017, 06/10/2017 and 10/20/2017. On the other hand, phosphate fertilization (single super phosphate) was carried out, in a single application, on 02/09/2017. 130 kg/ha of N, 150 kg/ha of P2O5 and 100 kg/ha of K2O were applied.
Pest and disease control was done by means of constant monitoring, according to the need of the crop. In the interlining of the coffee plantation, Brachiaria (Urochloa decumbens) was planted with the purpose of favoring the chemical and physical-water attributes of the soil, optimizing its structure and increasing the water storage capacity (Rocha et al., 2016). The weeds were controlled along the planting line, brushing when necessary. Phytosanitary control was performed according to the need of the crop, in an equal manner, in all treatments.
The experiment was conducted in a randomized complete block design (DBC), with 35 genotypes (treatments) and four replicates. Each plot was composed of ten plants, whose spacing was 3.50 × 0.75 meters, constituting an area of 26.25 m2 per plot, totaling an experimental area of 3,675 m2 with 1,400 plants. As a useful part, eight central plants of the plot line were considered, totaling an area of 21 m2.
Thirty-one cultivars (Oeiras MG 6851 (EPAMIG), Catiguá MG 1 (EPAMIG), Sacramento MG 1 (EPAMIG), Catiguá MG 2 (EPAMIG), Araponga MG 1 (EPAMIG), Paraiso MG 419-1), Pau Brazil MG 1 (EPAMIG), Catiguá MG 3 (EPAMIG), Topaz MG 1190 (EPAMIG), IPR 104 (IAPAR), Sarchimor MG 8840 (EPAMIG),

jas.ccsenet.org Journal of Agricultural Science Vol. 12, No. 2; 2020
140
Catucaí Vermelho 20/15 cova 476 (PROCAFÉ), Tupi IAC (IAC), IPR 98 (IAPAR), IPR 99 (IPA 99), IPA 99 (IAC), Obatã Vermelho IAC 1669-20 (IAC), Obatã Amarelo IAC 4932 (IAC), Catuaí Vermelho IAC 15 (IAC), Catuaí Amarelo IAC 062 (PROCAFÉ), Catucaí Amarelo 24/137 (PROCAFÉ), Catucaí Amarelo 20/15 cova 479 (PROCAFÉ), Catucaí Vermelho 785/15 (PROCAFÉ), Catucaí Amarelo 2SL (PROCAFÉ) (PROCAFÉ), Asca Branca (PROCAFÉ), IBC-Palma 2 (PROCAFÉ), Acauã (PROCAFÉ), Acauã Novo (PROCAFÉ), and four advanced progenies [23]. II (EPAMIG), H-419-3-3-7-16-4-1 (EPAMIG), Paradise H 419-10-6-2-12-1 (EPAMIG), Paradise H 419-10-6-2-10-1 (EPAMIG)], all of the Coffea arabica species. The choice of these genotypes occurred because they were low in size, more resistant to rust and to the miner.
The irrigation was of the drip-type type, consisting of simple 16 mm polyethylene lateral lines and self-compensating emitters, with a flow of 2.2 L h-1, spaced 0.5 m apart. Irrigations were carried out in three irrigation shifts: Monday, Wednesday and Friday, according to ETc of the accumulated crop of the previous non-irrigated days. The applied blade was the same for all plots and calculated as a function of the accumulated reference evapotranspiration (ETo) of the Class A tank, located in the meteorological station of the institute itself. The blades are shown in Figure 1.
Figure 1. Water depth applied in the experiment
Note. Water depth applied in the experiment from March 2017 to August 2018.
In order to standardize flowering, controlled water stress management was adopted, suspending irrigation between 10/07/2017 to 11/09/2017 (62 days) and 18/06/2018 to 20/08/2018 (63 days) (Guerra et al., 2005).
To estimate coffee ETc, the daily meteorological data were used during the conduction of the experiment, obtained through the meteorological station of the Goiano Federal Institute-Ceres Campus, which is located near the experimental area. Through the Class A tank, reference evapotranspiration (ETo) was estimated according to the Penman-Monteith model (Allen et al., 1998). The crop evapotranspiration (ETc) was determined as a function of the ETo values, taking into account the crop coefficient (Kc) equal to 1 [new crop (1 to 3 years) and spacing 2 – 3.6 × 0.5 – 1.0] (Oliveira et al., 2007).
The relative humidity was assigned by INMET, registered by the Automatic Meteorological Station, located in the Municipality of Itapaci-GO (Figure 2). The values of maximum, average and minimum temperatures during the period of the experiment are presented in Figure 3. The values of relative humidity and temperature were assigned by the National Institute of Meteorology (INMET), a meteorological station in the city of Itapaci, distant 51.1 km from the city of Ceres, and the weather conditions are similar to the location of the experiment.
0
200
400
600
800
1000
1200
1400
1600
1800
2000
Wat
er d
epth
ap
pli
ed (
mm
)
Months/Years

jas.ccsenet.org Journal of Agricultural Science Vol. 12, No. 2; 2020
141
Figure 2. Relative air humidity
Note. Relative air humidity recorded from March 2017 to August 2018.
Source: INMET-Itapaci-GO.
Figure 3. Maximum, average and minimum temperature
Note. Maximum, average and minimum temperature values from March 2017 to August 2018, in the municipality of Ceres-GO.
Source: INMET-Itapaci-GO.
The values of the daily readings of evapotranspiration of the Class A Tank of the Goiano IF-Ceres Campus from March 2017 to August 2018 are shown in Figure 4.
0
10
20
30
40
50
60
70
80
90
Moi
stu
re (
%)
Months/Years
0
5
10
15
20
25
30
35
40
45
50
Tem
per
atu
re (
⁰C)
Months/Years
Tmín Tmáx Tméd

jas.ccsenet.org Journal of Agricultural Science Vol. 12, No. 2; 2020
142
Figure 4. Evapotranspiration monitored by the class A tank
Note. Evapotranspiration monitored by the class A tank from March 2017 to October 2018. Source: Meteorological Station of the Goiano Federal Institute-Campus Ceres.
The pluviometric rainfall from March 2017 to August 2018, at the Goiano IF-Ceres Campus, based on data from the Itapaci-Goiás Automatic Weather Station, is described in Figure 5.
Figure 5. Pluviometric precipitation
Note. Pluviometric precipitation recorded from March 2017 to August 2018, at the Itapaci-GO Automatic Weather Station.
Source: INMET.
The variation values of the Photoperiod during the experiment period are shown in Figure 6.
0
2
4
6
8
10
12
14
Eva
pot
ran
spir
atio
n-T
ank
Cla
ss A
(m
m)
Months/Years
0
20
40
60
80
100
120
140
160
Pre
cip
itat
ion
(m
m)
Months/Years

jas.ccsenet.org Journal of Agricultural Science Vol. 12, No. 2; 2020
143
Figure 6. Photoperiod recorded during the conduction of the experiments
Note. Photoperiod recorded during the conduction of the experiments, from March 2017 to August 2018. Anápolis Station-GO, INMET (2018).
The amount of light hours per day varies, depending on the time of year. In Ceres-GO, in the period from March 2017 to August 2018, the minimum was 11 h; 4 min; 24 s in June and the maximum was 12 h; 54 min; 36 s in December (INMET, 2018).
The vegetative growth assessments were at 30 and 36 months after planting (MAP), in October 2017 and April 2018, respectively. In the four central plants, the diameter of the orthotropic branch, measured in millimeters, was evaluated with the aid of the digital caliper, at 5 cm from the ground; cup diameter, measured in centimeters; height of plant, in centimeters, measurement of soil level to the apical bud of the orthotropic branch; number of nodes of the orthotropic branch; number of nodes of plagiotropic branch 1, length of plagiotropic branch 1, number of nodes in plagiotropic branch 2, length of plagiotropic branch 2, length of plagiotropic branches 1 and 2, number of nodes of plagiotropic branches 1 and 2. The length and number of nodes of the plagiotropic branches 1 and 2, are the ones that make up the second pair of branches, above the neck of the plant.
Fruit harvest was by manual melting in the cloth, in July 2018, when the majority of the fruits reached cherry or pass stage, and also the “sweeping” coffee was collected. The coffee harvested was dried in the sun, in terreiro and then heavy, in the form of coffee in coconut, which was benefited. The ratio between the amount of coffee in coconut and coffee benefited was obtained and, subsequently, the productivity of coffee benefited per portion of the useful area was calculated, thus determining the productivity per hectare.
The data obtained in the evaluations were submitted to analysis of variance using the SISVAR program and the comparison and grouping of means were performed by the Scott-Knott test, at 5% probability of error. Simple linear correlation analysis was performed between all evaluated characteristics.
4. Discussion
The genotypes showed significant differences in relation to growth at 30 MAP and 36 MAP as well as in coffee productivity, as presented in Tables 1 and 2. According to the presented productivity averages, the genotypes were divided into three groups: (13 genotypes), mean (13 genotypes) and lowest (nine genotypes) productivity (Figure 7). The correlation between productivity and the ten phenological characteristics evaluated at 36 months after planting was significant, except for number of nodes in the plagiotropic branch 2 (Table 3).
The genotypes Catiguá MG 1, Catuaí Vermelho IAC 15, Catucaí Amarelo 24/137, Acauã 2 and 8, Paraíso H 419-10-6-2-10-1 presented smaller diameter of the orthotropic branch in the two evaluated periods, but are among the which belong to the group with the highest average productivity. The correlation was significant at 5% (0.17) between the number of bags of 60 kg of coffee benefited per hectare and the diameter of the orthotropic branch (Table 3). The correlation between the diameter of the orthotropic branch and plant height was significant at 1% (0.69) as can be seen in Table 3. The Yellow Catucaí 2SL was the genotype with the best performance for these two characteristics, in the two evaluated epochs is in the group of the most productive genotypes. There is a growth synchrony between these two variables, to support the plant (Rodrigues et al., 2012).
0
2
4
6
8
10
12
14
Hou
rs li
ght
a d
ay
Months/Years

jas.ccsenet.org Journal of Agricultural Science Vol. 12, No. 2; 2020
144
The correlation between canopy diameter and yield of coffee benefited per hectare was significant at 1% (0.36), as can be seen in Table 3. The IBC-Palma 2 was the one with the smallest crown diameter, in the two evaluated periods and also the lower productivity.
The Catucaí Amarelo 2SL showed higher plant height than the other genotypes in the two evaluated periods and also belongs to the most productive group. However, it is worth noting that there is a preference for lower plants, since it facilitates management and harvesting (Rodrigues et al., 2012). At 36 MAP, 12 genotypes were in the lowest group and three of them are also more productive: Catiguá MG 1, IPR 98 and Paraíso H 419-10-6-2-10-1.
Observing the number of nodes of the orthotropic branch, at the 30 MAPs, 11 genotypes are in the group that presented the greatest number of nodes (Table 1), but three of them had higher productivity: Araponga MG 1, Acauã and Acauã Novo. This was the only variable analyzed in which the Catucaí Amarelo 2SL did not present better performance in the two seasons and in the ten characteristics evaluated. With less orthotropic nodes, at the same evaluation time, there are four genotypes, but two of them are among the most productive: Sarchimor MG 8840 and Asa Branca.
The correlation between the number of nodes in the plagiotropic branch 2, at 36 months after planting and the productivity was not significant (0.12), as can be seen in Table 3. Study of four arabica coffee cultivars in the city of Ervália-MG, Martinez et al. (2007) found, at a spacing of 2.5 × 0.75 m, a non-significant correlation between MAP production and number of plagiotropic branches.
At 36 MAP, seven genotypes showed the highest number of orthotropic nodes (Table 2) and three of them were among the highest productivity (Figure 8), which are: Araponga MG 1, Catucaí Amarelo 2SL and Acauã. Among the four with the lowest numbers of orthotropic nodes, the White Wing is one of the most productive and the IBC-Palma 2 was the least productive of all the genotypes of the experiment. As shown, the number of nodes in the orthotropic branch did not influence productivity.
When evaluating the number of nodes of the plagiotropic branch 1, at the 30 MAPs, eight genotypes presented the highest values, three of them being among the ones that obtained the highest productivity: Catuaí Vermelho IAC 15, IPR 98, Catucaí Amarelo 2SL. Five genotypes had a smaller number of nodes of the plagiotropic branch 1, two of them being among the most productive: Araponga MG 1, Acauã 2 and 8 and one of them is the one that had the lowest productivity of all, the IBC-Palma 2, according to shows Table 2. At 36 MAP, according to Table 2, five genotypes had better performance and among these, two present higher productivity: Catuaí Vermelho IAC 15, Catucaí Amarelo 2SL. With less number of nodes of the plagiotropic branch 1, four genotypes, among them the IBC-Palma 2, with low productivity.
At 30 MAP, two genotypes showed lower length of the plagiotropic branch 1: Catiguá MG 3 and IBC-Palma 2 (Table 1). At 36 MAP, seven genotypes presented a lower length of the plagiotropic branch 1, two of them having high productivity: Catiguá MG 1, Acauã 2 and 8 and genotype IBC-Palma 2, with low productivity. With the longest length of the plagiotropic branch 1, in both evaluations was the Catucaí Amarelo 2SL, which also presented high productivity.
The variable length of the plagiotropic branch 2 was statistically divided into five groups at 30 MAP. With longer length is only the Catucaí Yellow 2SL. In the group with the lowest plagiotropic branch length 2, there are Oeiras MG 6851, Catiguá MG 1, Pau Brasil MG 1, Catiguá MG 3, Acauã 2 and 8 and IBC-Palma 2. The 36 MAPs are five groups with higher values of length are: Catucaí Amarelo 2SL, Catucaí Amarelo 20/15 cova 479, Sabiá Tardio or Sabiá 398 and Asa Branca. In the group of the lowest values are Oeiras MG 6851, Catiguá MG 3 and IBC-Palma 2.

jas.ccsenet.org Journal of Agricultural Science Vol. 12, No. 2; 2020
145
Table 1. Growth data of genotypes evaluated at 30 MAP
Genotypes D Dcopa Alt NROrt NRP1 CRP1 NRP2 CRP2 CTRP NNTRP
-------- mm ------- cm cm --------- cm ---------
Oeiras MG 6851 46.85d 132.38e 182.69f 38.94c 17.63c 62.75d 22.25b 73.25e 136.00e 39.88c
Catiguá MG 1 46.69d 150.75d 183.50f 39.19c 18.50c 65.13c 24.06b 79.56e 144.69d 42.56c
Sacramento MG 1 53.43b 181.63b 210.50c 43.44a 17.69c 68.00c 25.81a 95.50c 163.50c 43.50c
Catiguá MG 2 46.97d 148.06d 182.19f 38.56c 15.50d 60.00d 28.44a 90.56c 150.56d 43.94c
Araponga MG 1 48.29c 166.75c 206.56c 44.56a 16.56d 65.50c 26.94a 91.50c 157.00d 43.50c
Paraíso MG 419-1 46.99d 153.25d 182.81f 41.25b 21.13c 70.19c 27.31a 83.31d 153.50d 48.44b
Pau Brasil MG 1 48.52c 132.25e 181.25f 40.63b 17.69c 58.81d 23.56b 78.88e 137.69e 41.25c
Catiguá MG 3 45.82d 118.38f 178.69f 34.50d 12.38d 50.13e 20.69b 76.38e 126.50e 33.06d
Topázio MG 1190 48.25c 165.06c 192.63d 42.75a 21.19c 71.50c 29.88a 92.50c 164.00c 51.06b
23 II 52.45b 169.88c 198.50d 37.44c 19.44c 80.69b 24.00b 94.69c 175.38b 43.44c
IPR 104 48.77c 159.88c 188.06e 41.50b 23.88b 75.25c 27.13a 87.19d 162.44c 51.00b
Sarchimor MG 8840 51.01b 165.25c 194.69d 35.44d 20.19c 74.00c 25.06b 89.00c 163.00c 45.25c
Catucaí Vermelho 20/15cova 476 46.12d 156.75d 189.19e 42.63a 21.81b 72.56c 28.38a 90.13c 162.69c 50.19b
Tupi IAC 1669-33 45.58d 146.44d 179.25f 39.69c 17.75c 63.06d 24.44b 81.13d 144.19d 42.19c
Obatã Vermelho IAC 1669-20 49.50c 179.75b 190.75e 38.38c 24.06b 82.44b 28.38a 94.56c 177.00b 52.44b
Obatã Amarelo IAC 4932 49.80c 152.88d 182.25f 35.38d 17.63c 63.69d 22.88b 86.50d 150.19d 40.50c
Catuaí Vermelho IAC 15 46.00d 173.31b 192.81d 42.00b 26.44a 85.06b 26.31a 85.94d 171.00c 52.75b
Catuaí Amarelo IAC 062 47.80d 175.31b 199.38d 42.94a 26.69a 83.50b 30.13a 95.88c 179.38b 56.81a
IPR 98 48.98c 172.06c 186.44e 41.06b 27.94a 83.81b 27.63a 87.88d 171.69c 55.56a
IPR 99 50.61c 161.81c 193.00d 39.25c 20.81c 73.44c 27.13a 93.06c 166.50c 47.94b
IPR 100 48.82c 179.56b 192.44d 42.56a 30.63a 91.00b 28.75a 92.00c 183.00b 59.38a
IPR 103 49.36c 179.88b 201.38d 41.50b 22.44b 82.19b 29.43a 99.44c 181.63b 51.88b
Catucaí Amarelo 2SL 60.47a 220.56a 268.69a 42.25b 30.88a 111.13a 27.50a 115.63a 226.75a 58.38a
Catucaí Amarelo 24/137 46.96d 160.06c 196.13d 40.63b 21.69b 71.69c 26.81a 89.81c 161.50c 48.50b
Catucaí Amarelo 20/15 cova 479 51.66b 188.00b 221.13b 45.94a 29.25a 91.31b 30.88a 97.75c 189.06b 60.13a
Catucaí Vermelho 785/15 47.65d 138.94e 188.44e 43.88a 23.94b 70.31c 30.81a 86.06d 156.38d 54.75a
Acauã 2 & 8 47.28d 145.88d 186.13e 40.94b 16.44d 59.19d 21.19b 72.44e 131.63e 37.63d
Sabiá Tardio ou Sabiá 398 47.20d 183.94b 192.00d 43.19a 27.50a 86.31b 34.19a 101.38b 187.69b 61.69a
Asa Branca 48.48c 189.06b 193.94d 36.25d 23.88b 88.81b 26.88a 104.13b 192.94b 50.75b
IBC-Palma 2 46.94d 85.06g 189.44e 38.44c 12.75d 46.38e 19.06b 71.63e 118.00e 31.81d
Acauã 49.62c 174.13b 194.88d 42.44a 25.31b 81.88b 26.31a 89.19c 171.06c 51.63b
Acauã Novo 47.90d 176.56b 193.50d 43.69a 22.81b 74.94c 27.38a 93.75c 168.69c 50.19b
H-419-3-3-7-16-4-1 49.29c 170.44c 188.13e 40.19b 27.63a 87.31b 28.06a 93.13c 180.44b 55.69a
Paraíso H 419-10-6-2-12-1 44.86d 150.75d 174.06f 39.81c 22.31b 72.06c 26.94a 81.38d 153.44d 49.25b
Paraíso H 419-10-6-2-10-1 47.59d 155.19d 175.19f 38.75c 22.56b 74.44c 26.56a 87.31d 161.75c 49.13b
CV (%) 9.61 11.87 6.96 9.14 31.13 22.75 23.88 16.68 15.35 20.60
Note. Diameter of the orthotropic branch (D), Cup diameter (Dcopa), Plant height (Alt), Number of nodes of the orthotropic branch (NROrt), Number of nodes of plagiotropic branch 1 (NRP1), Length of plagiotropic branch 1, number of nodes in the plagiotropic branch 2 (NRP2), length of the plagiotropic branch 2 (CRP2), length of the plagiotropic branches 1 and 2 (CTRP), number of nodes of the plagiotropic branches 1 and 2 (NNTRP) genotypes of Coffea arabica at 30 months of age. Means followed by the same lowercase vertical letter do not differ by Scott-Knott test at the 5% error probability level.

jas.ccsenet.org Journal of Agricultural Science Vol. 12, No. 2; 2020
146
Table 2. Growth data of genotypes evaluated at 36 MAP
Genotypes D Dcopa Alt (cm) NROrt NRP1 CRP1 NRP2 CRP2 CTRP NNTRP
-------- mm ------- cm cm --------- cm ---------
Oeiras MG 6851 55.38c 143.63f 202.13e 46.13c 16.56d 65.44e 25.13c 77.25d 142.69e 41.69c
Catiguá MG 1 57.71c 165.63e 208.06e 46.38c 19.38c 67.31e 25.88c 91.06c 158.38d 45.25c
Sacramento MG 1 63.06b 181.25c 225.69c 50.75b 22.81b 84.81c 28.81b 106.81b 191.63c 51.63b
Catiguá MG 2 57.07c 150.44f 199.75e 46.13c 15.81d 59.81e 25.19c 87.88c 147.69d 41.00c
Araponga MG 1 56.33c 169.00d 221.06c 51.25a 19.31c 78.00c 28.63b 97.69b 175.69c 47.94c
Paraíso MG 419-1 55.21c 156.44e 203.00e 48.25b 24.56b 75.69d 28.06b 90.94c 166.63d 52.63b
Pau Brasil MG 1 56.68c 157.38e 200.69e 46.06c 19.25c 65.75e 27.13c 87.75c 153.50d 46.38c
Catiguá MG 3 55.65c 126.75g 195.06e 39.88d 13.63d 54.19e 21.06d 74.13d 128.31e 34.69d
Topázio MG 1190 58.32b 176.63d 216.00d 52.25a 25.69b 79.88c 33.88a 103.44b 183.31c 59.56a
23 II 60.20b 177.75d 217.00d 44.50c 21.50c 86.50c 28.75b 100.94b 187.44c 50.25c
IPR 104 57.44c 175.81d 213.94d 50.06b 24.25b 79.75c 29.19b 94.88b 174.63c 53.44b
Sarchimor MG 8840 59.41b 172.00d 214.88d 45.25c 20.00c 76.63d 26.81c 98.69b 175.31c 46.81c
Catucaí Vermelho20/15cova 476 57.66c 170.44d 219.69c 52.81a 24.94b 82.63c 29.75b 98.75b 181.38c 54.69b
Tupi IAC 1669-33 52.59c 157.13e 201.63e 47.44c 19.13c 70.13d 25.81c 84.25c 154.38d 44.94c
Obatã Vermelho IAC 1669-20 60.73b 187.69c 212.06d 45.44c 24.69b 84.19c 28.75b 99.50b 183.69c 53.44b
Obatã Amarelo IAC 4932 60.95b 170.81d 203.13e 43.81d 20.81c 74.81d 24.81c 96.44b 171.25c 45.63c
Catuaí Vermelho IAC 15 56.95c 179.94c 216.31d 50.00b 29.06a 88.00c 28.81b 95.69b 183.69c 57.88b
Catuaí Amarelo IAC 062 58.60b 181.06c 223.13c 50.81b 26.00b 87.06c 30.81b 101.81b 188.88c 56.81b
IPR 98 56.54c 178.00d 208.75e 50.69b 25.38b 80.50c 29.44b 96.75b 177.25c 54.81b
IPR 99 59.62b 175.94d 211.06d 48.13b 22.63b 80.69c 28.88b 98.19b 178.88c 51.50b
IPR 100 59.95b 200.25b 217.06d 50.31b 32.06a 98.56b 33.44a 105.31b 203.88b 65.50a
IPR 103 58.60b 193.19b 226.81c 49.13b 24.69b 87.69c 31.56b 105.81b 193.50c 56.25b
Catucaí Amarelo 2SL 75.77a 225.13a 292.50a 51.44a 30.63a 111.56a 30.38b 123.13a 235.69a 61.00a
Catucaí Amarelo 24/137 57.14c 166.13e 226.81c 49.69b 23.06b 79.44c 28.25b 92.44c 171.88c 51.31b
Catucaí Amarelo 20/15 cova 479 60.66b 198.88b 247.94b 54.69a 29.81a 96.56b 34.56a 109.00a 205.56b 64.38a
Catucaí Vermelho 785/15 58.23b 147.13f 212.69d 52.31a 23.38b 71.75d 31.56b 89.06c 160.81d 54.94b
Acauã 2 & 8 58.46b 159.25e 214.13d 48.19b 18.81c 65.69e 26.69c 85.38c 151.06d 45.50c
Sabiá Tardio ou Sabiá 398 55.36c 192.75b 214.25d 50.19b 28.88a 93.88b 38.06a 116.19a 210.06b 66.94a
Asa Branca 56.41c 190.69b 214.44d 42.50d 25.94b 100.31b 29.94b 113.44a 213.75b 55.88b
IBC-Palma 2 54.91c 115.38g 202.13e 42.13d 15.19d 56.75e 17.31d 66.12d 122.88e 32.50d
Acauã 56.32c 186.50c 220.13c 51.38a 25.38b 82.94c 30.69b 99.19b 182.13c 56.06b
Acauã Novo 58.94b 186.75c 216.56d 50.13b 21.50c 71.81d 28.25b 95.63b 167.44d 49.75c
H-419-3-3-7-16-4-1 55.42c 179.13c 210.44d 49.19b 22.25c 83.38c 30.69b 100.56b 183.94c 52.94b
Paraíso H 419-10-6-2-12-1 57.42c 155.56e 198.06e 48.94b 21.38c 75.75d 24.69c 83.63c 159.38d 46.06c
Paraíso H 419-10-6-2-10-1 55.18c 158.94e 194.88e 46.31c 22.81b 79.25c 26.94c 93.94b 173.19c 49.75c
CV (%) 9.67 9.68 6.29 9.43 25.76 20.01 22.16 15.63 14.05 18.66
Note. Diameter of the orthotropic branch (D), Cup diameter (Dcopa), Plant height (Alt), Number of nodes of the orthotropic branch (NROrt), Number of nodes of plagiotropic branch 1 (NRP1), Length of plagiotropic branch 1, number of nodes in plagiotropic branch 2 (NRP2), length of plagiotropic branch 2 (CRP2), length of plagiotropic branches 1 and 2 (CTRP), number of nodes in plagiotropic branches 1 and 2 (NNTRP) in Coffea arabica genotypes at 36 months of age. Means followed by the same lowercase vertical letter do not differ by Scott-Knott test at the 5% error probability level.
jas.ccsenet.org Journal of Agricultural Science Vol. 12, No. 2; 2020
147
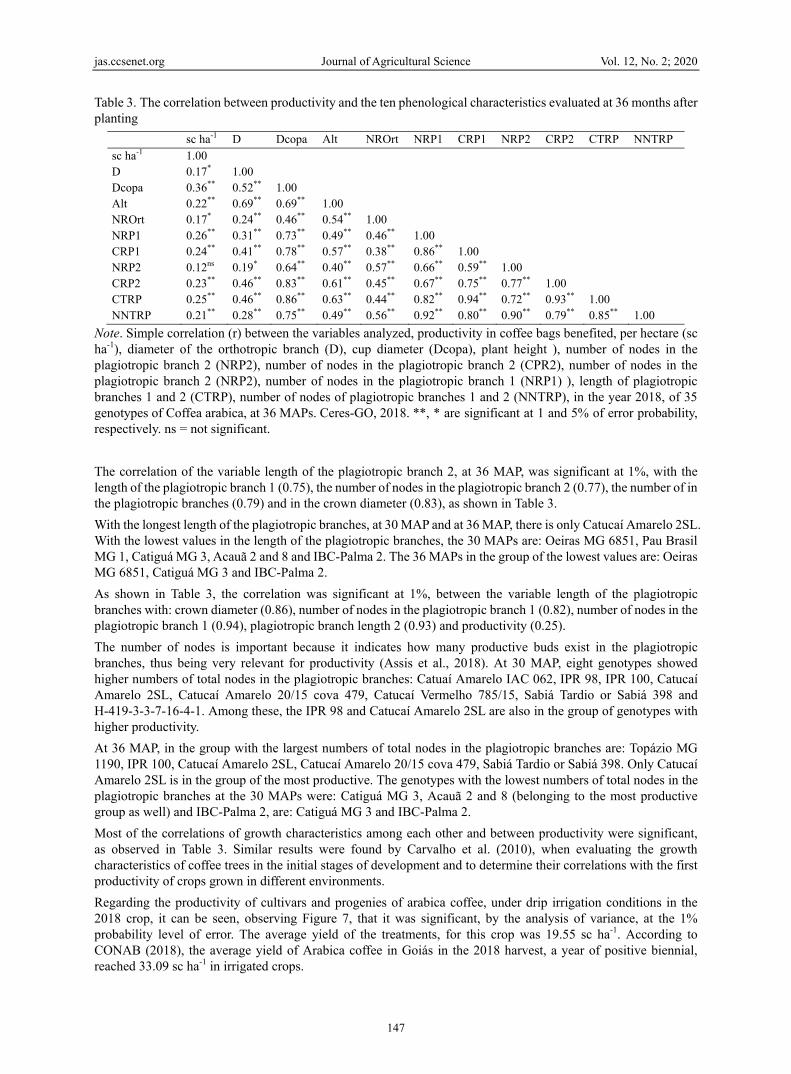
Table 3. The correlation between productivity and the ten phenological characteristics evaluated at 36 months after planting
sc ha-1 D Dcopa Alt NROrt NRP1 CRP1 NRP2 CRP2 CTRP NNTRP
sc ha-1 1.00 D 0.17* 1.00 Dcopa 0.36** 0.52** 1.00 Alt 0.22** 0.69** 0.69** 1.00 NROrt 0.17* 0.24** 0.46** 0.54** 1.00 NRP1 0.26** 0.31** 0.73** 0.49** 0.46** 1.00 CRP1 0.24** 0.41** 0.78** 0.57** 0.38** 0.86** 1.00 NRP2 0.12ns 0.19* 0.64** 0.40** 0.57** 0.66** 0.59** 1.00 CRP2 0.23** 0.46** 0.83** 0.61** 0.45** 0.67** 0.75** 0.77** 1.00 CTRP 0.25** 0.46** 0.86** 0.63** 0.44** 0.82** 0.94** 0.72** 0.93** 1.00 NNTRP 0.21** 0.28** 0.75** 0.49** 0.56** 0.92** 0.80** 0.90** 0.79** 0.85** 1.00
Note. Simple correlation (r) between the variables analyzed, productivity in coffee bags benefited, per hectare (sc ha-1), diameter of the orthotropic branch (D), cup diameter (Dcopa), plant height ), number of nodes in the plagiotropic branch 2 (NRP2), number of nodes in the plagiotropic branch 2 (CPR2), number of nodes in the plagiotropic branch 2 (NRP2), number of nodes in the plagiotropic branch 1 (NRP1) ), length of plagiotropic branches 1 and 2 (CTRP), number of nodes of plagiotropic branches 1 and 2 (NNTRP), in the year 2018, of 35 genotypes of Coffea arabica, at 36 MAPs. Ceres-GO, 2018. **, * are significant at 1 and 5% of error probability, respectively. ns = not significant.
The correlation of the variable length of the plagiotropic branch 2, at 36 MAP, was significant at 1%, with the length of the plagiotropic branch 1 (0.75), the number of nodes in the plagiotropic branch 2 (0.77), the number of in the plagiotropic branches (0.79) and in the crown diameter (0.83), as shown in Table 3.
With the longest length of the plagiotropic branches, at 30 MAP and at 36 MAP, there is only Catucaí Amarelo 2SL. With the lowest values in the length of the plagiotropic branches, the 30 MAPs are: Oeiras MG 6851, Pau Brasil MG 1, Catiguá MG 3, Acauã 2 and 8 and IBC-Palma 2. The 36 MAPs in the group of the lowest values are: Oeiras MG 6851, Catiguá MG 3 and IBC-Palma 2.
As shown in Table 3, the correlation was significant at 1%, between the variable length of the plagiotropic branches with: crown diameter (0.86), number of nodes in the plagiotropic branch 1 (0.82), number of nodes in the plagiotropic branch 1 (0.94), plagiotropic branch length 2 (0.93) and productivity (0.25).
The number of nodes is important because it indicates how many productive buds exist in the plagiotropic branches, thus being very relevant for productivity (Assis et al., 2018). At 30 MAP, eight genotypes showed higher numbers of total nodes in the plagiotropic branches: Catuaí Amarelo IAC 062, IPR 98, IPR 100, Catucaí Amarelo 2SL, Catucaí Amarelo 20/15 cova 479, Catucaí Vermelho 785/15, Sabiá Tardio or Sabiá 398 and H-419-3-3-7-16-4-1. Among these, the IPR 98 and Catucaí Amarelo 2SL are also in the group of genotypes with higher productivity.
At 36 MAP, in the group with the largest numbers of total nodes in the plagiotropic branches are: Topázio MG 1190, IPR 100, Catucaí Amarelo 2SL, Catucaí Amarelo 20/15 cova 479, Sabiá Tardio or Sabiá 398. Only Catucaí Amarelo 2SL is in the group of the most productive. The genotypes with the lowest numbers of total nodes in the plagiotropic branches at the 30 MAPs were: Catiguá MG 3, Acauã 2 and 8 (belonging to the most productive group as well) and IBC-Palma 2, are: Catiguá MG 3 and IBC-Palma 2.
Most of the correlations of growth characteristics among each other and between productivity were significant, as observed in Table 3. Similar results were found by Carvalho et al. (2010), when evaluating the growth characteristics of coffee trees in the initial stages of development and to determine their correlations with the first productivity of crops grown in different environments.
Regarding the productivity of cultivars and progenies of arabica coffee, under drip irrigation conditions in the 2018 crop, it can be seen, observing Figure 7, that it was significant, by the analysis of variance, at the 1% probability level of error. The average yield of the treatments, for this crop was 19.55 sc ha-1. According to CONAB (2018), the average yield of Arabica coffee in Goiás in the 2018 harvest, a year of positive biennial, reached 33.09 sc ha-1 in irrigated crops.

jas.ccsenet.org Journal of Agricultural Science Vol. 12, No. 2; 2020
148
In the group with higher productivity were the genotypes: Catiguá MG 1, Acauã Novo, Acauã 2 and 8, Catucaí Amarelo 24/137, Catucaí Amarelo 2SL, Asa Branca, Paraiso H 419-10-6-2-10-1, Catuaí Vermelho IAC 15, Acauã, Sarchimor MG 8840, IPR 98, Araponga MG 1 and Obatã Vermelho IAC 1669-20. The productivity of these genotypes varied between 21.92 and 36.61 sc ha-1. They are genotypes of low size, for the most part, however, Catucaí Amarelo 2 SL belongs also to the group of the highest averages of plant height. Low-sized plants facilitate handling with crop and harvest.
Of the thirteen most productive genotypes, two cultivars obtained a productivity higher than this state average, in the 2018 crop, Araponga MG 1, with 36.3 sc ha-1 and Obatã Vermelho IAC 1669-20, with 36.61 sc ha-1 (approximately 10.6% more, productivity). The genotype IPR 98 (33.0 sc ha-1) was in the state average. It then shows the potential for adaptation of some genotypes to planting in this region.
Carvalho et al. (2005), studying the agronomic performance of coffee cultivars in the state of Minas Gerais, found that in Turmalina, Catucaí Amarelo 2SL and Obatã Vermelho IAC 1669-20 were in the group with higher productivity, considering a general average of four harvests. Carvalho et al. (2017) found that in the municipalities of Lavras and Patrocínio, among three groups, Araponga MG 1 was in the less productive group, considering an average of productivity in the 2011/2012 and 2012/2013 harvests.
The group of those that presented average productivity, were nine cultivars [Paraíso MG 419-1, Catiguá MG 3, IPR 104, Tupi IAC 1669-33, Catuaí Amarelo IAC 062, IPR 99, IPR 100, IPR 103, Catucaí Amarelo 20/15 cave 479, Sabiá Tardio or Sabiá 398] and three advanced progenies [23II, H-419-3-3-7-16-4-1 and Paradise H 419-10-6-2-12-1]. Their average ranged between 15.2 and 20.6 bags of coffee benefited per hectare.
Figure 7. Productivity of coffee benefited
Note. Productivity of coffee benefited (60 kg/ha) of 35 genotypes of Coffea arabica, compared to the average state of Goiás, in the 2018 harvest.
Among the 35 recommended genotypes, Oeiras MG 6851, Sacramento MG 1, Catiguá MG 2, Pau MG Brasil 1, Topázio MG 1190, Catucaí Vermelho 20/15 cova 476, Obatã Amarelo IAC 4932, Catucaí Vermelho 785/15, IBC-Palma 2 The productivity of coffee bags benefited from 60 kg of coffee ranged from 3.6 to 13.0 bags of coffee benefited per hectare. The IBC-Palma 2 was the least productive genotype, being therefore the least indicated for these growing conditions, because it is only a little.
5. Conclusions
There was a difference in growth and yield of the evaluated genotypes.
There is a positive correlation between the vegetative characters and between them and the productivity, in the second crop, of coffee.
[VA
LO
R]
c [VA
LO
R]
a
[VA
LO
R]
c
[VA
LO
R]
c
[VA
LO
R]
a
[VA
LO
R]
b
[VA
LO
R]
c [VA
LO
R]
b
[VA
LO
R]
c
[VA
LO
R]
b
[VA
LO
R]
b [VA
LO
R]
a
[VA
LO
R]
c
[VA
LO
R]
b [VA
LO
R]
a
[VA
LO
R]
c
[VA
LO
R]
a
[VA
LO
R]
b
[VA
LO
R]
a
[VA
LO
R]
b
[VA
LO
R]
b
[VA
LO
R]
b
[VA
LO
R]
a
[VA
LO
R]
a
[VA
LO
R]
b
[VA
LO
R]
c
[VA
LO
R]
a
[VA
LO
R]
b
[VA
LO
R]
a
[VA
LO
R]
c
[VA
LO
R]
a
[VA
LO
R]
a
[VA
LO
R]
b
[VA
LO
R]
b
[VA
LO
R]
a
33.0
0
5
10
15
20
25
30
35
40
45
sc h
a-1of
pro
cess
ed c
offe
e
Genotypes
Produtividade - Ceres - GO Média Estadual

jas.ccsenet.org Journal of Agricultural Science Vol. 12, No. 2; 2020
149
Catucaí Amarelo 2SL presented higher growth than the other evaluated genotypes.
The genotypes Catiguá MG 1, Acauã Novo, Acauã 2 and 8, Catucaí Amarelo 24/137, Catucaí Amarelo 2SL, Asa Branca, Paraíso H 419-10-6-2-10-1, Catuaí Vermelho IAC 15, Acauã, Sarchimor MG 8840, IPR 98, Araponga MG 1 and Obatã Vermelho IAC 1669-20 were the ones that had the highest productivity in the year 2018.
Acknowledgements
The authors are grateful to the Goian Federal Institute-Campus Ceres for the support given to the Research Support Foundation of the State of Goiás-FAPEG for the research assistance in the implementation of the experiment, to the National Council for Research and Scientific and Technological Development-CNPq, and Dr. Antônio Alves Pereira (Agricultural Research Company of the State of Minas Gerais-EPAMIG) for the supply of seeds of the coffee genotypes.
References
Aerts, R., Geeraet, L., Berecha, G., Hundera, K., Muys, B., Kort, H. D., & Honnay, O. (2017). Conserving wild Arabica coffee: Emerging threats and opportunities. Agriculture, Ecosystems and Environment, 237, 75-79. https://doi.org/10.1016/j.agee.2016.12.023
Allen, R. G., Pereira, L. S., Raes, D., & Smith, M. (1998). Crop evapotranspiration: Guidelines for computing crop water requirements. FAO Irrigation and Drainage Paper 56 (p. 300). Rome: FAO. https://doi.org/ 10.4236/jacen.2014.32B010
Assis, G. A., Silva, L. R. S., Martins, W. E. R., Carvalho, F. J., & Pires, O. S. (2018). Coffee plant growth and produtivity in Alto Paranaíba region based on punning type and on thinning. Ciência Agrícola, 16(2), 9-21, 2018. https://doi.org/10.28998/rca.v16i2.4467
Carvalho, A. M., Cardoso, D. A., Carvalho, G. R., Carvalho, V. L., Pereira, A. A., Ferreira, A. D., & Carneiro, L. F. (2017). Behavior of coffee cultivars under the incidence of diseases of rust and gray leaf spot in two cultivation environments. Coffee Science, 12(1), 100-107. https://doi.org/10.25186/cs.v12i1.1248
Carvalho, A. M., Mendes, A. N. G., Botelho, C. E., Oliveira, A. C. B., Rezende, J. C., & Rezende, R. M. (2012). Agronomic performance of coffee cultivars resistant to coffee rust in Minas Gerais State, Brazil. Bragantia, 71(4), 481-487. https://doi.org/10.1590/S0006-87052013005000007
Carvalho, A. M., Mendes, A. N. G., Carvalho, G. R., Botelho, C. E., Gonçalves, F. M. A., & Ferreira, A. D. (2010). Correlation between growth and yield of coffee cultivars in different regions of the state of Minas Gerais, Brazil. Pesquisa Agropecuária Brasileira, 45(3), 269-275. https://doi.org/10.1590/s0100-204x2010 000300006
Castanheira, D. T., Rezende, T. T., Baliza, D. P., Guedes, J. M., Carvalho, S. P., Guimarães, R. J., & Viana, M. J. R. (2016). Potential use of anatomical and physiological characteristics in the selection of coffee progênies. Coffee Science, 11(3), 375-386. https://doi.org/10.5965/223811711732018547
CECAFÉ (Conselho dos Exportadores de Café do Brasil). (2018). Relatório Mensal de Exportações—Dezembro de 2018. Retrieved from https://www.cecafe.com.br/publicacoes/relatorio-de-exportacoes
CONAB (Companhia Nacional de Abastecimento). (2018). Acompanhamento da safra brasileira—Quarto levantamento (Vol. 5, pp. 1-84). Retrieved from https://www.conab.gov.br/info-agro/safras/cafe
Guerra, A. F., Rocha, O. C., Rodrigues, G. C., Sanzonowicz, C., Sampaio, J. B. R., Silva, H. C., & Araújo, M. C. (2005). Irrigation coffee in the Cerrado: Water management strategy for uniform blossoming (Embrapa Cerrados, Comunicado Técnico, 122, p. 4). Planaltina: Embrapa Cerrados. Retrieved from https://ainfo.cnptia.embrapa.br/digital/bitstream/CPAC-2009/27309/1/comtec_122.pdf
Guimarães, P. T. G., Garcia, A. W. R., Alvarez, V. H., Prezotti, L. C., Viana, A. S., Miguel, A. E., … Monteiro, A. V. C. (1999). Cafeeiro. In A. C. Ribeiro, P. T. G. Guimarães, & V. H. Alvarez (Eds.), Recomendações para uso de corretivos fertilizantes em Minas Gerais: 5ª aproximação (pp. 289-302). Viçosa: CFSEMG. Retrieved from https://www.skoob.com.br/livro/pdf/recomendacoes-para-o-uso-de-corretivos-e/livro:12194 3/edicao:135332
Herrera, J. C., & Lambot, C. (2017). The Coffee Tree—Genetic Diversity and Origin (Chapter 1, pp. 1-16). In B. Folmer (Ed.), The Craft and Science of Coffee (p. 529). Amsterdam: Academic Press. https://doi.org/ 10.1016/B978-0-12-803520-7.00001-3
ICO (International Coffee Organization). (2018a). Record exports in coffee year 2017/2018. Retrieved from http://www.ico.org/show_news.asp?id=67

jas.ccsenet.org Journal of Agricultural Science Vol. 12, No. 2; 2020
150
ICO (International Coffee Organization). (2018b). World coffee production reaches 160 million and consumes 159 million bags in coffee year 2017/2018. Retrieved from http://www.ico.org/show_news.asp?id=671
INMET (Instituto Nacional de Meteorologia). (2018). Estações automáticas: Gráficos. Retrieved from http://www.inmet.gov.br/portal/index.php?r=home/page&page=rede_estacoes_auto_graf
Kitzberger, C. S. G., Scholz, M. B. S., & Benassi, M. T. (2014). Bioactive compounds content in roasted coffee from traditional and modern Coffea arabica cultivars grown under the same edapho-climatic conditions. Food Research International, 61, 61-66. https://doi.org/10.1016/j.foodres.2014.04.031
Krohling, C. A., Matiello, J. B., Almeida, S. R., Eutrópio, F. T., & Carvalho, C. H. S. (2017). Adaptation of progenies/cultivars of arabica coffee (Coffea arabica L.) in mountainous edafoclimatic conditions. Coffee Science, 13(2), 198-209. https://doi.org/10.25186/cs.v13i2.1417
Lambot, C., Herrera, J. C., Bertrand, B., Sadeghian, S., Benavides, P., & Gaitán, A. G. (2017). Cultivating coffee quality: Terroir and agro ecosystem (pp. 17-49). In B. Folmer (Ed.), The craft and science of coffee (p. 529). Academic Press, Amsterdam, Netherlans. https://doi.org/10.1016/B978-0-12-803520-7.00002-5
Oliveira, L. F. C., Oliveira, R. Z., Borges, L. B., & Wehr, T. R. (2007). Crop coefficient and water relationships of coffee Catucaí cultivar under two systems of irrigation management. Pesquisa Agropecuária Tropical, 37(3), 154-162. https://doi.org/10.5216/pat.v37i3.1855
Rodrigues, W. P., Vieira, H. D., Barbosa, D. H. S. G., & Vittorazzi, C. (2012). Growth and yield of Coffea arabica L. in Northwest Fluminense: 2nd harvest. Revista Ceres, 59(6), 809-815. https://doi.org/10.1590/ S0034-737X2012000600011
Santos, H. G., Jacomine, P. K. T., Anjos, L. H. C., Oliveira, V. A., Lumbreras, J. F., Coelho, M. R., … Oliveira, J. B. (2013). Sistema Brasileiro de Classificação de Solos (3rd ed., p. 353). Brasília: Embrapa. Retrieved from https://livimagens.sct.embrapa.br/amostras/00053080.pdf
Vicente, M. R., Mantovani, E. C., Fernandes, A. L. T., Delazari, F. T., & Figueiredo, E. M. (2015). Effects of different levels of irrigation depth on growth and production variables of coffee under center pivot irrigation. Irriga, 20(3), 528-543. https://doi.org/10.15809/irriga.2015v20n3p528
Copyrights
Copyright for this article is retained by the author(s), with first publication rights granted to the journal.
This is an open-access article distributed under the terms and conditions of the Creative Commons Attribution license (http://creativecommons.org/licenses/by/4.0/).