Embed Size (px)
Citation preview

Growth and Employment in the Dominican Republic: Options for a Job-Rich Growth
Umidjon Abdullaev and Marcello Estevão
WP/13/40

© 2013 International Monetary Fund WP/13/40
IMF Working Paper
Western Hemisphere Department
Growth and Employment in the Dominican Republic: Options for a Job-Rich Growth
Prepared by Umidjon Abdullaev and Marcello Estevão1
Authorized for distribution by Przemek Gajdeczka
February 2013
Abstract
The Dominican Republic has posted high rates of output and productivity growth, but labor market indicators have remained weak during the past 20 years. This paper documents these trends, showing that the rapid productivity growth originates in a few sectors, while the bulk of job creation is concentrated elsewhere. The speed of job creation has not been enough to raise employment rates, and lackluster real earnings along with still-rampant labor market informality suggest that most of the new jobs are of low quality. Low real wages and low labor force participation suggest the need of raising market wages above fallback incomes to attract individuals to the labor force. For that, measures to improve education and reduce product market distortions would be helpful.
JEL Classification Numbers: O40, J21, E26
Keywords: Labor force participation, productivity growth, inclusive growth
Author’s E-Mail Address: [email protected], [email protected]
1 University of Vienna and IMF, respectively. The authors thank Janine Berg, Teresa Daban, Mario Dehesa, Przemek Gajdeczka, Jesus Gonzalez Garcia, Letty Gutierrez, Aurelio Parisotto, and other ILO colleagues for their comments on earlier versions of this paper. The Central Bank of the Dominican Republic provided essential disaggregated information from the Dominican Labor Force Survey. Alexander Herman provided quality research assistance and Joy Villacorte provided excellent editorial help. All remaining errors are our own.
This Working Paper should not be reported as representing the views of the IMF. The views expressed in this Working Paper are those of the author(s) and do not necessarily represent those of the IMF or IMF policy. Working Papers describe research in progress by the author(s) and are published to elicit comments and to further debate.

2
Contents Page I. Introduction ............................................................................................................................3 II. Growth and employment .......................................................................................................4
A. Fast output and labor productivity growth ................................................................................. 4 B. Weak labor market performance ................................................................................................ 5 C. Low wages and job quality ........................................................................................................ 8
III. Labor supply, human capital and unemployment ..............................................................11 A. Determinants of labor force participation and employment situation ...................................... 11 B. The case for better schooling ................................................................................................... 13
IV. Business environment and regulation ................................................................................15 V. Policy guidelines and concluding remarks..........................................................................18 Appendix ............................................................................................................................................... 21
References ............................................................................................................................................. 23 Figures
Figure 1. Real GDP and per capita real GDP in the Dominican Republic ............................................. 5 Figure 2. Real GDP growth, percent, annual averages ........................................................................... 5 Figure 3. Decomposition of per capita GDP growth rate, percent, annual averages .............................. 5 Figure 4. Decomposition of per worker GDP growth rate, percent, annual averages ............................ 5 Figure 5. Employment to population ratio, 15+, percent ........................................................................ 6 Figure 6. Unemployment rate, percent .................................................................................................... 6 Figure 7. Decomposition of labor productivity growth, in percent ......................................................... 7 Figure 8. Decomposition of labor productivity growth, 1996-2011, in percent ..................................... 7 Figure 9. Contribution of each sector to change in the employment rate, 2011 to 1996, percentage points .................................................................................................................................... 8 Figure 10. Labor productivity and real earnings, indices in logarithm ................................................... 9 Figure 11. Real earnings per hour by level of education, real 2005 RD$ ............................................... 9 Figure 12. Evolution of labor productivity and real earnings per hour, by sector .................................. 9 Figure 13. Informal employment, percent of total employment, productivity based definition ........... 10 Figure 14. Share of informal employment in total wage employment, legalistic definition, by age, percent ................................................................................................................................................... 10 Figure 15. Broad unemployment, by education level ........................................................................... 13 Figure 16. Open unemployment, by education level ............................................................................ 13 Figure 17. Share of first-time job seekers in unemployment, percent .................................................. 13 Figure 18. Labor force participation, percent ....................................................................................... 14 Figure 19. Years of schooling, age 25-65 ............................................................................................. 14 Figure 20. Business and labor market policies and labor productivity ................................................. 17 Tables
Table 1. Gross value added, annual averages ......................................................................................... 5 Table 2. Contribution to gross value added growth rate, annual averages .............................................. 5 Table 3. Employment by sectors, annual averages ................................................................................. 7 Table 4. Determinants of labor force participation, probit models ....................................................... 12 Table 5. Education intensity and employment, by sector ..................................................................... 14 Table 6. Education intensity and employment, by occupational groups ............................................... 15 Table 7. Labor productivity and regulation………........... ................................................................... 18 Table 8. Employment growth in the DR……………………………… ............................................... 18 Table A1. Characteristics of formal and informal workers (age 15-65) .............................................. 21 Table A2. Characteristics of the working age population (15–65), currently not attending any type of schooling, by gender .......................................................................................................... 22
3
I. INTRODUCTION
The Dominican Republic (DR) posted remarkable growth rates in recent decades, which outpaced the performance of many peer countries in Latin America and the Caribbean. Nevertheless, several studies conclude that the DR’s growth performance has been unbalanced, in particular because of persistent and widespread labor market informality, inequality, and poverty. 1 These issues are recognized by the government authorities, whose concerns are reflected in the recently approved National Development Strategy. Against this background, the Dominican Republic was selected as one of the pilot cases for the joint IMF-ILO initiative to design policies to foster job creation and promote inclusive growth. The project aims at identifying key structural issues that have been preventing the Dominican Republic from fully using abundant labor and at formulating policies to address these issues. This study documents the divergent nature of recent growth performance in the DR, showing in particular that high output growth and large productivity gains have been concentrated in a few sectors. Such sectors (especially manufacturing, telecommunications and financial services) have had limited impact on employment generation, even though they have been growing at above-average growth rates and generating a large share of the Dominican GDP. This paper also shows that open unemployment rates are actually relatively moderate, but very low labor force participation is an acute problem. Moreover, the jobs being created tend to be of low quality and real wages have remained stagnant. Against this backdrop, relatively low labor force participation in the Dominican Republic is not as surprising, in particular because our econometric estimations showcase the importance of nonmarket sources of income (e.g. remittances from abroad) for labor force participation decisions. Addressing low labor force participation in the presence of low wages requires measures to lift market productivity, so that jobs become more attractive to potential workers. Among key policy actions, the paper discusses the importance of raising the quality of education so that individuals would command higher wages. That would include molding the educational system to more pressing market needs, which could involve greater support to technical training. However, improving education would raise market wages only in the longer-term, while, say, addressing product market deficiencies would have more immediate effects on incentives for innovation, on-the-job training, and competition for qualified workers, which would bid up wages and boost labor force participation. The paper goes over some of the areas where product market conditions could improve in the Dominican Republic. More specific challenges—e.g, particularly low labor force participation of prime-working-age women and younger workers—could be addressed with focused policies—for instance, better provision of day care benefits and enhanced programs to facilitate school-to-work transitions. The paper is organized as follows. The following section characterizes the growth performance of the economy, including the contribution of different production factors to growth. It also provides a detailed account of job creation patterns across sectors and the recent evolution of employment quality. Section III explores the role of labor supply factors in determining current labor market outcomes, while section IV examines product market constraints to growth and job creation. Section V discusses relevant policy suggestions and concludes the paper. 1 For recent studies, see Bussolo et al. (2010), Guzman and Cruz (2010), and Sánchez-Ancochea (2012).

4
II. GROWTH AND EMPLOYMENT
A. Fast output and labor productivity growth
The Dominican Republic posted consistently high output growth during several decades and has been one of the most dynamic and fast-growing economies in Latin America and the Caribbean, LAC (Figures 1 and 2). More recently, the DR has grown on average nearly 4 percent a year since 2000, almost double the LAC average and four times more than the OECD average. Political stability, implementation of targeted structural reforms, export promotion, and relative macroeconomic stability have been central to ensuring consistent growth in the country (Jaramillo and Sancak (2007), Sánchez-Ancochea (2012)).
Looking at the last twenty years of data, the DR’s remarkable GDP per capita growth performance was rooted in fast-growing labor productivity (approximated by output per worker, Figure 3). Changes in employment rate (ratio of employment to working-age population) and in working-age population also contributed to GDP per capita growth, but had smaller roles. The smaller importance of increases in labor input to underpin growth mimics the experience of several other Latin American countries (Loayza et al., 2005), but even taking these countries as a benchmark, the DR is a clear outlier in the region. Higher
Figure 3. Decomposition of per capita GDP growth rate, percent, annual averages
Figure 4. Decomposition of per worker GDP growth rate, percent, annual averages
Figure 1. Real GDP and per capita real GDP in the Dominican Republic
Figure 2. Real GDP growth, percent, annual averages
0
5,000
10,000
15,000
20,000
25,000
30,000
35,000
40,000
0
50,000
100,000
150,000
200,000
250,000
300,000
350,000
400,000
1960 1970 1980 1990 2000 2010
GDP, mln RD$ (left scale)
GDP per capita, RD$
Source: WDI Database.
-1.0
0.0
1.0
2.0
3.0
4.0
5.0
6.0
1970s 1980s 1990s 2000s
Dominican RepublicLACOECD
Source: WDI Database.
-2.0
-1.0
0.0
1.0
2.0
3.0
4.0
5.0
6.0
1991-1995 1996-2000 2001-2005 2006-2011
GDP per capitaGDP per workerEmployment/Working age populationWorking age population/Population
Source: CBDR, IMF staff estimates.
-0.5
0.0
0.5
1.0
1.5
2.0
2.5
3.0
3.5
4.0
1991-1995 1996-2000 2001-2005 2006-2011
GDP per workerCapital per worker ratioTFP
Source: CBDR, IMF staff estimates.

5
capital-labor ratios have been the main driver of productivity growth, although total factor productivity growth surged in the past 5 years (Figure 4). The sectoral pattern of growth provides further insights into its drivers.2 Good economic performance has largely been fueled by above-average growth in manufacturing, wholesale and retail trade, construction, transportation and communication, and financial services. Jointly, these sectors currently generate about 70 percent of total value added (Table 1). While during the past decade, manufacturing, and transportation and communication accounted for about 60 percent of aggregate growth, the importance of wholesale and retail trade, and financial services has increased in the last 5 years (Table 2).
Table 1. Gross value added, annual averages
Table 2. Contribution to gross value added growth rate, annual averages
B. Weak labor market performance
Despite fast output growth, especially in the sectors mentioned above, labor market indicators have underperformed. First of all, employment rates in the Dominican Republic have been 2 Most of the industry-level analysis in this study starts in 1996, when the industry-level employment data began distinguishing employment in ‘Public administration and defense’ from employment in other service sectors.
Gross value added 6.3 3.9 5.7
Agriculture 2.0 3.4 5.0 10.0 9.6 8.7 Mining and quarrying 2.5 1.7 1.7 30.3 0.9 0.5 Manufacturing 7.9 2.5 3.4 30.2 28.8 25.3 Electricity, gas and water 9.3 -0.2 5.2 2.0 2.0 1.6 Construction 7.7 -1.9 6.0 6.7 5.4 5.1 Wholesale and retail trade 5.6 0.6 7.6 11.6 9.9 10.2 Hotels, bars and restaurants 7.8 5.4 3.0 7.6 7.8 7.4 Transport and communication 11.7 13.2 10.7 11.1 16.5 23.7 Financial intermediation and insurance 9.2 4.8 14.6 2.6 3.2 4.2 Public administration and defence 2.7 5.6 2.1 1.4 1.5 1.3 Other services 1.8 3.1 2.6 15.6 14.4 11.9Souce: CBRD, IMF staff estimates.
2001 - 2005 2006 - 2011 1996 - 2000 2001 - 2005 2006 - 20111996 - 2000
Growth rate (%) Share in gross value added (%)
Gross value added 3.95 5.74
Agriculture 0.33 0.43 Mining and quarrying 0.01 -0.04 Manufacturing 0.73 0.87 Electricity, gas and water -0.01 0.08 Construction -0.14 0.29 Wholesale and retail trade 0.02 0.74 Hotels, bars and restaurants 0.41 0.23 Transport and communication 1.96 2.29 Financial intermediation and insurance 0.14 0.52 Public administration and defence 0.08 0.03 Other services 0.42 0.31Souce: CBRD, IMF staff estimates.
2001 - 2005 2006 - 2011

6
traditionally low compared to other countries (Figure 5). In addition, even though unemployment measures based on the job-search behavior of non-employed individuals (referred to as “open unemployment rate”) have remained relatively low, the broad unemployment rate, which includes discouraged workers, has been quite high (Figure 6). Low employment rates in tandem with low open unemployment rates point to low labor force participation as a significant labor market problem in the Dominican Republic.
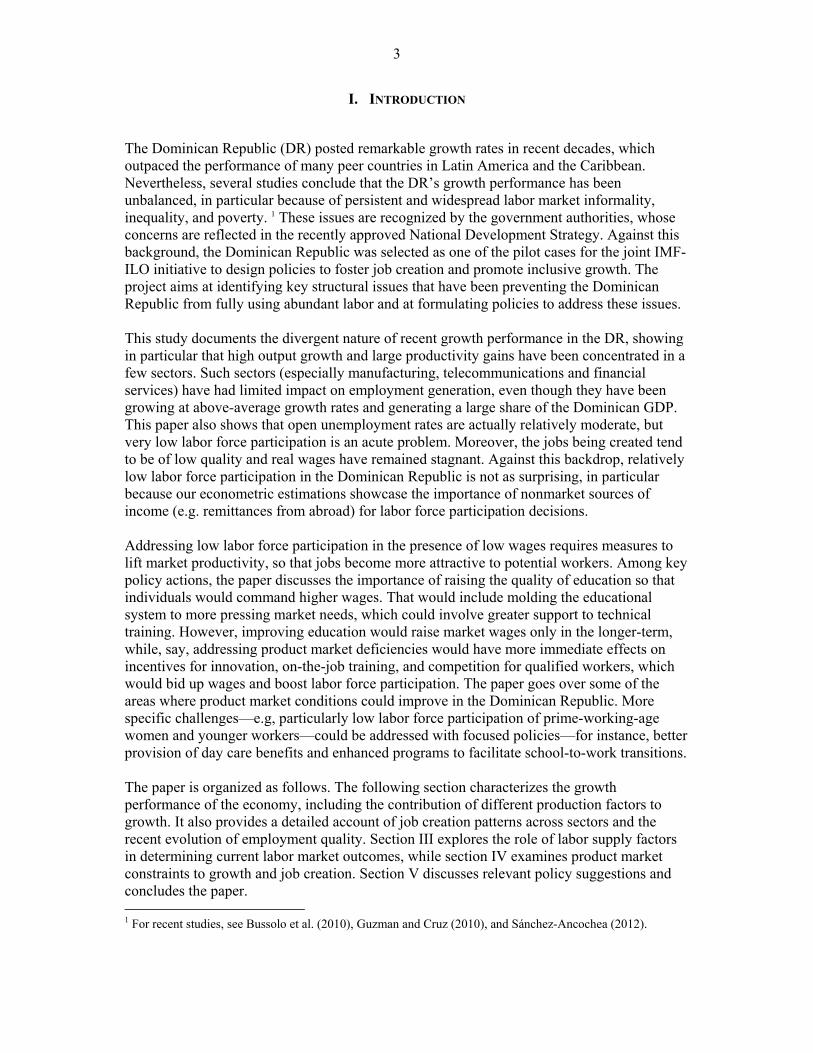
Fast output growth with sub-par employment performance can be better understood by analyzing sectoral developments. While manufacturing, transportation and communication, wholesale and retail trade, and financial services have been key drivers of economic growth, their contribution to employment growth has been more modest (Table 3). Indeed, a large share of the labor force is employed in manufacturing, wholesale and retail trade, and other services, but the importance of each of these sectors in total employment has either declined (from 18 percent in manufacturing in the early 1990s to 12 percent more recently) or remained unchanged (at about 20 percent of total employment in retail trade). Thus, fast output growth has been fueled by fast labor productivity growth in particular sectors, with little employment gains. The concentration of productivity growth in particular sectors can be confirmed by a shift-share analysis (Figures 7 and 8).3
3 A shift-share analysis allows decomposing aggregate productivity growth into three terms: (i) the within term captures the within-sector contribution to aggregate productivity growth; (ii) the between term captures the effect of the reallocation of workers between sectors; and (iii) the cross-term captures the simultaneous effect of sector productivity changes and the movement of labor across sectors. The latter term is positive either when a sector that is posting productivity increases is also expanding employment or when a sector with declining productivity is shrinking. Equivalently, the cross-term is negative, when a sector with shrinking (augmenting) productivity is gaining (losing) employment. Aggregate labor productivity growth can be explained mainly by the growth of output per worker in manufacturing and in communication, sectors that contributed very little to employment growth in the same period. Among other notable developments, labor productivity has grown at an astounding 14-percent annual rate in the communications sector since 1996—a fact masked by the usual aggregation with data from the transportation sector. “Other services”, a champion in job creation, has contributed negatively to aggregate productivity growth.
Figure 5. Employment to population ratio, 15+, percent
Figure 6. Unemployment rate, percent
45.0
47.0
49.0
51.0
53.0
55.0
57.0
59.0
61.0
63.0
1991 1994 1997 2000 2003 2006 2009
Latin America and CaribbeanDominican Republic
Source: WDI Database.
2.0
4.0
6.0
8.0
10.0
12.0
14.0
16.0
18.0
20.0
2000 2002 2004 2006 2008 2010
Broad
Open
Source: CBDR.
7
Table 3. Employment by sectors, annual averages
Employment has performed better in services sectors, particularly in activities associated with a less-skilled labor force. Better employment performance has been particularly noticeable in “other services”, which currently accounts for about 25 percent of total employment (18 percent in the mid 1990s). 4 At the same time, the share of “other services” in total value added declined from 17 percent in 1996 to 11 percent in 2011; underlining the weak productivity growth in the sector. The same pattern is present in wholesale and retail trade, and hotels, bars and restaurants. As a result, these services sectors contributed with the lion share of the small, 4.1 percentage-point increase in the employment rate between 1996 and 2011 (Figure 9). Within “other services”, detailed data from the National Labor Force Survey shows that “Private households with employed persons” has been the fastest growing segment, especially prior to 2007. Occupations in these sectors tend to have lower skill content, thus suggesting that a significant share of new jobs generated in the economy is of low quality, besides being created in low-productivity activities.
4 The category “other services” includes community, social, and personal service activities, private households with employed persons, and education and health services.
Total employment 4.9 1.2 3.2
Agriculture -0.4 0.2 3.1 17.3 14.5 14.2 Mining and quarrying -9.1 2.1 24.9 0.3 0.2 0.3 Manufacturing 2.8 -1.6 -2.6 18.2 15.0 12.2 Electricity, gas and water 21.7 2.1 3.8 0.6 0.9 0.9 Construction 3.6 2.6 2.5 6.9 6.7 6.7 Wholesale and retail trade 7.5 0.5 4.0 20.6 20.6 20.7 Hotels, bars and restaurants 6.8 3.8 3.5 4.8 5.5 6.0 Transport and communication 3.2 5.2 3.2 7.0 7.6 7.6 Financial intermediation and insurance 15.4 2.1 7.8 1.5 1.9 2.3 Public administration and defence 6.5 3.2 4.3 3.9 4.7 4.7 Other services 9.4 2.9 5.3 18.9 22.4 24.5Souce: CBRD, IMF staff estimates.
1996 - 2000
Growth rate (%) Share in total employment (%)
2001 - 2005 2006 - 2011 1996 - 2000 2001 - 2005 2006 - 2011
Figure 7. Decomposition of labor productivity growth, in percent
Figure 8. Decomposition of labor productivity growth, 1996-2011, in percent
-10.0
-5.0
0.0
5.0
10.0
15.0
20.0
25.0
1996-2000 2000-2005 2005-2010
Cross termBetween termWithin term
Source: CBDR, IMF staff estimates.
-0.20 -0.10 0.00 0.10 0.20 0.30 0.40
Agriculture
Mining and quarrying
Manufacturing
Electricity, gas and water
Construction
Wholesale and retail trade
Hotels, bars and restaurants
Transport and communication
Public administration and defence
Other services
WithinBetweenCross-term
Source: CBDR, IMF staff estimates.

8
Figure 9. Contribution of each sector to change
in the employment rate, 2011 to 1996, percentage points
These sectoral differences are also associated with differences in employment performance by gender. Manufacturing currently accounts for about 8 percent of total female employment, down from about 20 percent in 2000 largely due to shrinking textile and apparel industries. The rate of decline in manufacturing male employment has been substantially lower (male employment in manufacturing declined at an annualized rate of 1.3 percent between 2000 and 2010, while female employment declined at an annualized rate of 5.5 percent in the same period). At the same time, during the past two decades female employment increased strongly in low-productivity service sectors—particularly in “other services”, which currently accounts for about 50 percent of total female employment.
C. Low wages and job quality
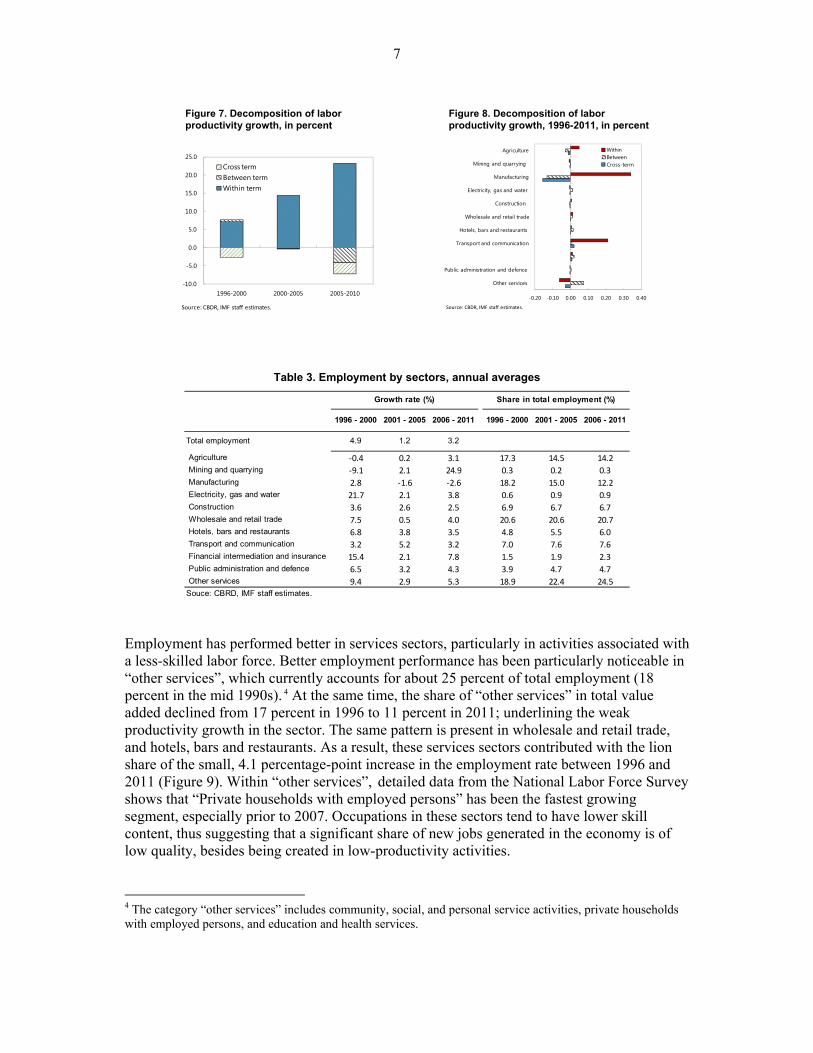
The concentration of employment creation in low-productivity sectors is a sign that many of the jobs created are of low quality. The stagnant employment quality in the Dominican Republic is also captured by real earnings dynamics (Figure 10). In general, real earnings started to fall at the end of the 1990s and the banking crisis of 2003-2004 (with resulting high inflation) only intensified this negative dynamic. Earnings of high-skill workers grew fast in the late 1990s, but have stagnated since 2003 after a sharp downward adjustment during the banking crisis; a puzzling phenomenon that deserves further future investigation (Figure 11). More generally, real wages declined uniformly along the earnings distribution, with somewhat stronger decline among private sector employees in the highest earnings deciles. On average, real earnings per hour of both self-employed and private sector wage workers are about 27 percent lower in 2011 than in 2000. The decline has been somewhat more pronounced among self-employed workers, particularly among women (35 percent versus a 27 percent decline for self-employed men). Looking at sectoral developments, lackluster real earnings are widespread, including in sectors with strong productivity growth; another puzzling development that could be related with weak worker bargaining power (Figure 12). For instance, transportation and communications, and manufacturing have posted very high rates of productivity growth while real hourly wages have moved sideways, mirroring other sectors with much weaker productivity developments. Public service and defense have posted slightly better real hourly wage growth than other sectors but with mediocre productivity growth; a common result that also reflects the difficulties in measuring true productivity in the public sector. Real wages in “other services”, where most jobs have been created, have trended down in the last 20 years.
-5.00 -3.00 -1.00 1.00 3.00 5.00
Agriculture
Mining and quarrying
Manufacturing
Electricity, gas and water
Construction
Wholesale and retail trade
Hotels, bars and restaurants
Transport and communication
Public administration and defence
Other services
Source: CBRD, IMF Staff estimates.Note: Bars show the percentage point contribution of each sector to the change in the ratio of employment to working age population.
9
Figure 12. Evolution of labor productivity and real earnings per hour, by sector
Source: CBDR, IMF staff estimates.
3.00
3.50
4.00
4.50
5.00
5.50
1996 1998 2000 2002 2004 2006 2008 2010
Log of labor productivity index (output per hour)Log of real earnings per hour index
Agriculture
3.00
3.50
4.00
4.50
5.00
5.50
6.00
1996 1998 2000 2002 2004 2006 2008 2010
Log of labor productivity index (output per hour)Log of real earnings per hour index
Mining and quarrying
3.00
3.50
4.00
4.50
5.00
5.50
6.00
1996 1998 2000 2002 2004 2006 2008 2010
Log of labor productivity index (output per hour)Log of real earnings per hour index
Manufacturing
3.00
3.50
4.00
4.50
5.00
5.50
1996 1998 2000 2002 2004 2006 2008 2010
Log of labor productivity index (output per hour)Log of real earnings per hour index
Electricity, gas and water
3.00
3.20
3.40
3.60
3.80
4.00
4.20
4.40
4.60
4.80
5.00
1996 1998 2000 2002 2004 2006 2008 2010
Log of labor productivity index (output per hour)Log of real earnings per hour index
Construction
3.00
3.20
3.40
3.60
3.80
4.00
4.20
4.40
4.60
4.80
5.00
1996 1998 2000 2002 2004 2006 2008 2010
Log of labor productivity index (output per hour)Log of real earnings per hour index
Wholesale and retail trade
3.00
3.50
4.00
4.50
5.00
5.50
1996 1998 2000 2002 2004 2006 2008 2010
Log of labor productivity index (output per hour)Log of real earnings per hour index
Hotels, bars and restaurants
3.00
3.50
4.00
4.50
5.00
5.50
6.00
1996 1998 2000 2002 2004 2006 2008 2010
Log of labor productivity index (output per hour)Log of real earnings per hour index
Transport and communication
3.00
3.50
4.00
4.50
5.00
5.50
1996 1998 2000 2002 2004 2006 2008 2010
Log of labor productivity index (output per hour)Log of real earnings per hour index
Financial intermediation and insurance
3.00
3.50
4.00
4.50
5.00
5.50
1996 1998 2000 2002 2004 2006 2008 2010
Log of labor productivity index (output per hour)Log of real earnings per hour index
Public administration and defense
3.00
3.20
3.40
3.60
3.80
4.00
4.20
4.40
4.60
4.80
5.00
1996 1998 2000 2002 2004 2006 2008 2010
Log of labor productivity index (output per hour)Log of real earnings per hour index
Other services
Figure 10. Labor productivity and real earnings, indices in logarithm
Figure 11. Real earnings per hour by level of education, real 2005 RD$
3.80
4.00
4.20
4.40
4.60
4.80
5.00
5.20
1996 1998 2000 2002 2004 2006 2008 2010
Labor productivity (output per hour)
Real earnings per hour
Source: CBDR, IMF staff estimates.
0
50
100
150
200
250
1996 1998 2000 2002 2004 2006 2008 2010
PrimarySecondaryTertiaryNone
Source: CBDR, WDI Database, IMF staff estimates.

10
Low job quality is also reflected in the very high rates of labor market informality in the Dominican Republic, although there has been some improvement recently. The share of self-employment in total employment increased from 34 percent in 1991 to about 43 percent in 2011, leading to measured increases in informality under a “productivity-based” definition (Figure 13).5 However, a different and more precise definition of informal employment suggests that informality, at least within the group of wage earners, has been declining. Recent waves of the National Labor Force Survey permit defining informal employment based on social security affiliation. Using this definition, we estimate that the share of salaried workers without affiliation with the social security system is declining, which seems to capture the nationwide initiative to increase social security enrollment (Figure 14).
In summary, DR’s fast growth with slow improvements in employment rates can be explained by very fast labor productivity growth in particular sectors. Moreover, sectors associated with lower-skill activities are responsible for the bulk of employment growth, which raises doubts about the quality of the jobs being created. Lackluster real wage growth, in particular since the end of the 1990s, also suggests that the new jobs being created are of low quality, although the large gap between productivity and wage growth in some sectors is consistent with workers having low bargaining power. The DR’s labor market is also characterized by high informality (another sign of low-quality jobs), but recent evidence points to some improvement. The next section looks at how the apparent low job quality in the DR can be interacting with determinants of labor supply decisions, which could partly explain the low labor force participation in the country.
5 The productivity-based measure of informal employment—used as the primary measure of informal employment by the Central Bank of the Dominican Republic—includes workers employed in enterprises with fewer than five employees, as well as non-professional self-employed workers and employers in several low-productivity occupational categories (farmers, operators and drivers, artisans and workers, merchants, sellers and unskilled workers). Table A1 presents key demographic characteristics of formal and informal workers.
Figure 13. Informal employment, percent of total employment, productivity based definition
Figure 14. Share of informal employment in total wage employment, legalistic definition, by age, percent
50.0
52.0
54.0
56.0
58.0
60.0
2000 2002 2004 2006 2008 2010Source: CBDR.
0.0
10.0
20.0
30.0
40.0
50.0
60.0
70.0
80.0
2005 2006 2007 2008 2009 2010
Total15-2425-6465+
Note: A worker is considered informal if he/she has no access to the
pension system upon retirement.

11
III. LABOR SUPPLY, HUMAN CAPITAL AND UNEMPLOYMENT
A. Determinants of labor force participation and employment situation
Low job quality may provide little incentive for people to offer their labor supply in the Dominican Republic, unless they have low reservation wages. This section builds this case by, first, analyzing the determinants of labor supply in the DR. Probit estimation shows that education is indeed important to determine whether an individual would participate in the labor force, with a significantly stronger effect for women than for men (Table 4). Among other characteristics, inactive men tend to be less educated, younger, and not a head of household. Participation patterns also differ considerably across rural and urban locations, and across regions of the Dominican Republic, with considerably lower participation of women outside of the capital region. International remittances are a strong determinant of labor force participation decision, especially for male workers. This finding is in line with evidence from other developing countries on the negative effect of remittances on labor force participation (Adams, 2011). The effect of this steady stream of “foreign income” to the country on labor supply has strengthened during the last decade, as the total volume of remittances has grown by 6 percent a year and reached about 6 percent of GDP in 2011, suggesting that reservation wages of segments of the labor force have been increasing. Following a decision to participate in the labor market, decomposing the characteristics of the unemployed indeed reveals that the better educated has a harder time finding adequate jobs. More broadly, an individual’s education level, age, and gender are key determinants of his/her employment situation.
Unemployment rates are smallest among the least educated (individuals with only primary school education or less than that) (Figures 15 and 16). This suggests that the job market for low-skill workers works adequately.
Higher unemployment rates for individuals with better education/skill levels could be the result of:
o scarcity of good jobs (so, even after deciding to offer their labor supply, more educated individuals have a hard time finding adequate jobs)—a fact consistent with the apparent prevalence of low-quality jobs in the country;
o a decoupling between education attainment and marketable skills; o partly, a statistical effect, as steady increases in education levels of new
worker cohorts would bias upward the measurement of unemployment for better educated workers because older (and more experienced and already-employed) workers tend to have lower education levels.
Youth and first-time job seekers account for a large share of broad and open unemployment (Figure 17). More than a third of the men in open unemployment and more than 50 percent of the discouraged men are young individuals (ages 15 to 24).
Prime-age women are overrepresented among the unemployed. While men and women are equally present in open unemployment, the share of women is somewhat higher in broad unemployment (58 percent as opposed to 42 percent of men in 2011).

12
Table 4. Determinants of labor force participation, probit models
Men Women
Years of schooling 0.032* 0.108***(0.018) (0.013)
Age 0.171*** 0.166***(0.006) (0.012)
Age sq. -0.002*** -0.002***(0.000) (0.000)
Age*Years of schooling -0.000 -0.001***(0.000) (0.000)
Currently enrolled in school -0.975*** -0.400***(0.071) (0.048)
Male household head 0.198*** -0.144***(0.048) (0.029)
Married 0.513*** 0.001(0.103) (0.081)
Cohabiting 0.754*** 0.020(0.074) (0.049)
Divorced 0.631 0.315**(0.390) (0.123)
Separated 0.342*** 0.263***(0.104) (0.064)
Widowed 0.016 0.031(0.104) (0.120)
Number of children under 6 0.020 -0.063**(0.013) (0.029)
Household received remittances from abroad -0.217*** -0.106**
(0.070) (0.041)Rural location 0.114** -0.086
(0.056) (0.062)Regions
Cibao Nordeste -0.199*** -0.477***(0.027) (0.031)
Cibao Noroeste -0.309*** -0.515***(0.024) (0.022)
Cibao Norte 0.041 -0.168***(0.026) (0.025)
Cibao Sur -0.009 -0.344***(0.025) (0.029)
Valdesia -0.056** -0.217***(0.025) (0.029)
El Valle -0.098*** -0.138***(0.037) (0.039)
Enriquillo -0.042** -0.146***(0.017) (0.023)
Higamo -0.143*** -0.188***(0.013) (0.017)
Yuma 0.131*** -0.226***(0.019) (0.018)
Constant -1.971*** -3.105***(0.148) (0.231)
Number of observations 9,471 9,222 *** p<0.01, ** p<0.05, * p<0.1Notes: October 2011 wave of the National Labor Force Survey is used. Sample consists of working age population of age 15-65. Region-clustered standard erros in parentheses.

13
Figure 17. Share of first-time job seekers in unemployment, percent
Thus, the picture from the unemployment and labor force participation data in the DR is consistent with a scarcity of good jobs for better educated and/or workers with higher reservation wages (e.g. those receiving large remittances from abroad). The policy challenge is clear: how to entice those workers into jobs? More specifically, how can their market productivity be increased so that they command higher wages, which would in turn raise incentives for labor force participation? Low labor force participation and higher unemployment rates among women and younger workers are other policy challenges.
B. The case for better schooling
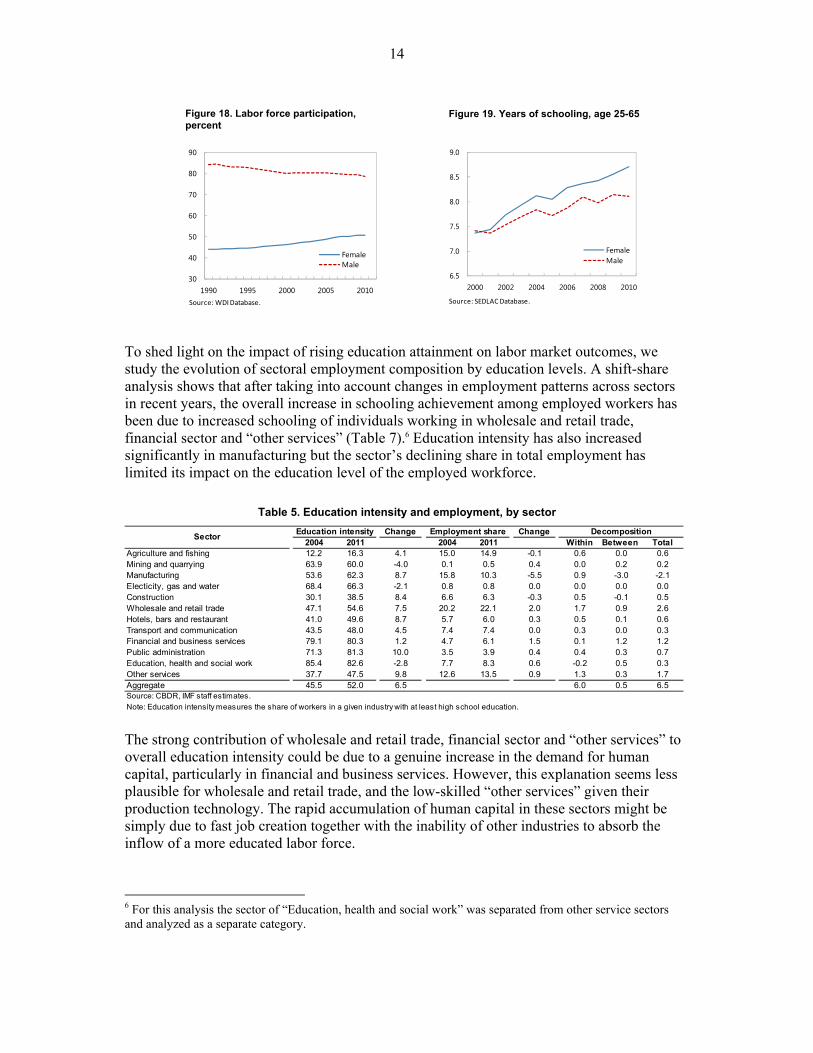
Most studies show that better schooling raises worker productivity and improves labor market outcomes in the longer run. In particular, better schooling tends to raise the quality of the labor force and, thus, market wages vis-à-vis sources of fallback income. However, the slow improvement in labor market outcomes in the past 20 years casts doubts on the benefits of past gains in schooling years. (Although, faster increases in years of schooling among women could potentially explain part of the upward trend in female labor force participation of the last 20 years, Figures 18 and 19).
0
10
20
30
40
50
60
2000 2002 2004 2006 2008 2010
Open unemployment
Broad unemployment
Source: CBRD.
Figure 15. Broad unemployment, by education level
Figure 16. Open unemployment, by education level
0.0
5.0
10.0
15.0
20.0
25.0
2000 2002 2004 2006 2008 2010
PrimarySecondaryUniverityNone
Source: CBDR.
0.0
1.0
2.0
3.0
4.0
5.0
6.0
7.0
8.0
9.0
2000 2002 2004 2006 2008 2010
PrimarySecondaryUniverityNone
Source: CBDR.
14
To shed light on the impact of rising education attainment on labor market outcomes, we study the evolution of sectoral employment composition by education levels. A shift-share analysis shows that after taking into account changes in employment patterns across sectors in recent years, the overall increase in schooling achievement among employed workers has been due to increased schooling of individuals working in wholesale and retail trade, financial sector and “other services” (Table 7).6 Education intensity has also increased significantly in manufacturing but the sector’s declining share in total employment has limited its impact on the education level of the employed workforce.
Table 5. Education intensity and employment, by sector
The strong contribution of wholesale and retail trade, financial sector and “other services” to overall education intensity could be due to a genuine increase in the demand for human capital, particularly in financial and business services. However, this explanation seems less plausible for wholesale and retail trade, and the low-skilled “other services” given their production technology. The rapid accumulation of human capital in these sectors might be simply due to fast job creation together with the inability of other industries to absorb the inflow of a more educated labor force.
6 For this analysis the sector of “Education, health and social work” was separated from other service sectors and analyzed as a separate category.
Change Change2004 2011 2004 2011 Within Between Total
Agriculture and fishing 12.2 16.3 4.1 15.0 14.9 -0.1 0.6 0.0 0.6Mining and quarrying 63.9 60.0 -4.0 0.1 0.5 0.4 0.0 0.2 0.2Manufacturing 53.6 62.3 8.7 15.8 10.3 -5.5 0.9 -3.0 -2.1Electicity, gas and water 68.4 66.3 -2.1 0.8 0.8 0.0 0.0 0.0 0.0Construction 30.1 38.5 8.4 6.6 6.3 -0.3 0.5 -0.1 0.5Wholesale and retail trade 47.1 54.6 7.5 20.2 22.1 2.0 1.7 0.9 2.6Hotels, bars and restaurant 41.0 49.6 8.7 5.7 6.0 0.3 0.5 0.1 0.6Transport and communication 43.5 48.0 4.5 7.4 7.4 0.0 0.3 0.0 0.3Financial and business services 79.1 80.3 1.2 4.7 6.1 1.5 0.1 1.2 1.2Public administration 71.3 81.3 10.0 3.5 3.9 0.4 0.4 0.3 0.7Education, health and social work 85.4 82.6 -2.8 7.7 8.3 0.6 -0.2 0.5 0.3Other services 37.7 47.5 9.8 12.6 13.5 0.9 1.3 0.3 1.7Aggregate 45.5 52.0 6.5 6.0 0.5 6.5Source: CBDR, IMF staff estimates.
Note: Education intensity measures the share of workers in a given industry with at least high school education.
SectorEducation intensity Employment share Decomposition
Figure 18. Labor force participation, percent
Figure 19. Years of schooling, age 25-65
30
40
50
60
70
80
90
1990 1995 2000 2005 2010
FemaleMale
Source: WDI Database.
6.5
7.0
7.5
8.0
8.5
9.0
2000 2002 2004 2006 2008 2010
FemaleMale
Source: SEDLAC Database.

15
Table 6. Education intensity and employment, by occupational groups
A decomposition of education intensity across occupation categories suggests that, indeed, the bulk of the better educated workers are being absorbed in lower-skill activities (Table 8). Higher education intensity in ‘service and sales workers’ and ‘elementary occupations’ made the largest contribution to growth in total education intensity. Developments at the two-digit classification of occupations confirm that education intensity increased particularly strongly in occupations related to the provision of various personal services (travel, housekeeping, catering, personal care) and a number of elementary occupations (street sales and services, cleaning and related). Thus, a disproportionately larger share of the more educated labor force is entering occupations that are not usually associated with higher skill needs. In summary, making workers “more productive” by raising education levels may not be a solution, at least in the short to medium term. Moreover, while raising education levels is certainly important, recent increases have not been associated with relatively higher employment levels in high-productivity industries, as better educated workers have been absorbed mostly by low-skill occupations and sectors.
IV. BUSINESS ENVIRONMENT AND REGULATION
A better way to improve labor market outcomes in the nearer term could be making labor demand more dynamic. Indeed, labor demand constraints and limited dynamism in product markets (which would affect not only the number of available jobs but also how attractive they are) may be at the root of low job quality and labor force participation in the country. There are several channels through which improvements in product market conditions, particularly in regulations, might increase productivity and job creation. For instance, removing market entry barriers would increase competition and raise incentives for investments and technological improvements, thus raising workers’ productivity and, in turn, market wages. Product market reforms could also improve the allocation of production factors, hence raising aggregate productivity. Finally, product market reforms would reduce economic rents, and boost output and job creation, with possible increases in real labor earnings.7 Cross-country evidence is consistent with product market restrictions having a deleterious effect on a country’s macroeconomic performance, including labor productivity. Data from the “Economic Freedom of the World” database compiled by the Fraser Institute illustrate
7 See Dutz et al. (2011) for recent firm-level evidence on the effect of labor productivity on employment growth.
Change Change2004 2011 2004 2011 Within Between Total
Legislators and senior officials 84.1 85.4 1.2 2.9 3.6 0.7 0.0 0.6 0.6Professionals 99.7 100.0 0.3 6.7 6.4 -0.3 0.0 -0.3 -0.2Technicians and associate professionals 83.9 89.3 5.5 6.6 6.6 0.0 0.4 0.0 0.4Clerks 84.2 85.4 1.2 6.7 6.9 0.2 0.1 0.1 0.2Service and sales workers 44.5 53.9 9.4 17.7 19.9 2.2 1.9 1.0 2.8Skilled agricultural and fishery workers 12.2 16.2 4.0 10.3 9.2 -1.1 0.4 -0.1 0.2Craft and related workers 40.4 49.6 9.2 15.6 13.6 -2.0 1.3 -0.8 0.5Plant and machine operators, assemblers 40.8 45.9 5.1 12.5 9.6 -2.9 0.5 -1.2 -0.7Elementary occupations 22.3 30.3 8.0 21.0 24.2 3.2 1.9 0.7 2.6
Aggregate 45.5 52.0 6.5 6.4 0.1 6.5
OccupationEducation intensity Employment share Decomposition
Source: CBDR, IMF staff estimates.
Note: Education intensity measures the share of workers in a given occupational category with at least high school education.

16
these effects through a range of indicators aimed at measuring the severity of labor and product market constraints that are believed to have strong effects on macroeconomic outcomes.8 Figures 20(a) and 20(b) plot the values of aggregated indices for product and labor market policies, which range from 0 (restrictive policies) to 10 (flexible policies), against a measure of labor productivity for more than 100 countries. Figures 20(c) to 20(h) plot specific components of the product market policies index, but, as opposed to the aggregate index shown in Figure 20(a), are indexed from “least burdensome” to “most burdensome” to facilitate a uniform interpretation across different components. The Dominican Republic is ranked in the middle of the range of product market constraints in Latin America and the Caribbean region, with particularly poor performance in measures of bureaucracy costs, administrative requirements, corruption, and cost of tax compliance. According to the latest wave of the World Bank Enterprise Survey in the Dominican Republic, corruption is also indicated by entrepreneurs as one of the major obstacles to a better investment climate (following the availability of reliable sources of electricity and high tax rates). Values of the product market policies index and its components clearly indicate that an improved investment climate, specifically less burdensome administrative requirements and bureaucracy costs, fewer incidences of corruption associated with business operations and less costly (in terms of hours) procedures for paying taxes are associated with high labor productivity. Simple econometric analysis confirms that improvements in product market conditions have a strong positive effect on labor productivity (Table 7), while better labor market policies do not have a significant effect on productivity. Special attention should be paid to constraints that are identified by small and medium-size firms, as they are responsible for the bulk of employment growth in the Dominican Republic. Regression analysis results show that very small firms (the excluded group in the regression results reported in Table 8) produce the largest increases in employment, and the largest firms account for the least amount of job creation. The latest issue of the Enterprise Survey records problems in electricity supply, corruption, practices of the informal sector, tax rates and access to finance as the main obstacles to the operation of small and medium-size enterprises. Improving the operational environment of these firms could have the largest impact on employment, aggregate productivity, and market wages.
8 See Gwartney et al. (2012) for more information on the “Economic Freedom of the World” database.

17
Figure 20. Business and labor market policies and labor productivity
Note: Figure (a) is a composite of indices presented in figures (c)-(h). In figures (a) and (b) indices range from 0 (restrictive policies) to 10 (favorable policies). Sub-index for “Administrative requirements” captures how burdensome it is for businesses to comply with various administrative requirements; “Bureaucracy costs” captures the extent of stringency of various regulations; “Starting a business” measures the easiness of starting a new business (monetary and time costs); “Extra payments/Bribes” captures the frequency of incidences of making extra payments to government officials and extent of favoritism; “Licensing restrictions” measures the costs (monetary and time) required for obtaining a license to construct a standard warehouse; and “Cost of tax compliance” measures the time required for preparing, filing and paying various business related taxes. See the Appendix in Gwartney et al. (2012) for more details. Plotted data refer to year 2007. Source: EFW database, Total Economy Database.
ARG
BOL
BRA
BRB
CHLCOLCRI
ECU
GTMJAM
PER
TTOURY
VEN
DOM3
45
67
8V
alor
de
índ
ice
0 20 40 60Labor productivity (GDP (PPP) per worker, thousand USD)
(a) Product market policies
ARG
BOLBRA
BRB
CHL
COL
CRI
ECU
GTM
JAM
PER
TTO
URY
VEN
DOM
24
68
10V
alor
de
índ
ice
0 20 40 60Labor productivity (GDP (PPP) per worker, thousand USD)
(b) Labor market policies
ARGBOL
BRA
BRBCHL
COL
CRI
ECU
GTM
JAMPER
TTOURY
VEN
DOM
24
68
10V
alor
de
índ
ice
0 20 40 60Labor productivity (GDP (PPP) per worker, thousand USD)
(c) Burden of administration requirements
ARG
BOL
BRA
BRB
CHL
COL
CRI
ECU
GTM
JAMPER TTO
URY
VEN
DOM
02
46
8V
alor
de
índ
ice
0 20 40 60Labor productivity (GDP (PPP) per worker, thousand USD)
(d) Bureaucracy costs
ARG
BOL
BRA
CHLCOL
CRIECU
GTM
JAM
PER
TTO
URY
VEN
DOM
02
46
8V
alor
de
índ
ice
0 20 40 60Labor productivity (GDP (PPP) per worker, thousand USD)
(e) Easiness of starting a business (monetary and time costs)
ARGBOL
BRA
BRB CHL
COL
CRI
ECU
GTM
JAM
PER
TTO
URY
VEN
DOM
02
46
8V
alor
de
índ
ice
0 20 40 60Labor productivity (GDP (PPP) per worker, thousand USD)
(f) Incidence of extra payments/bribes
ARG
BOL
BRA
CHLCOL
CRIECU
GTM
JAMPER
TTOURY
VEN
DOM
02
46
810
Val
or d
e ín
dic
e
0 20 40 60Labor productivity (GDP (PPP) per worker, thousand USD)
(g) Monetary and time costs due to licensing restrictions
ARG
BOL BRA
CHL
COLCRI
ECU
GTM
JAM PER
TTO
URY
VEN
DOM
02
46
810
Val
or d
e ín
dic
e
0 20 40 60Labor productivity (GDP (PPP) per worker, thousand USD)
(h) Cost of tax compliance

18
Table 7. Labor productivity and regulation Table 8. Employment growth in the DR
V. POLICY GUIDELINES AND CONCLUDING REMARKS
This paper identified two distinct, but closely related, labor market challenges for the Dominican Republic. First, the dynamics of real earnings and employment composition point to stagnant job quality in the country. Real earnings have been declining consistently across all economic sectors and most new jobs have been created in low-productivity industries. Second, a large share of the population remains inactive, which can be explained by low (or, “inadequate” from the market’s perspective) average skill levels and scant employment opportunities at attractive wages. Better training, education, and product market conditions could be ways to address these issues by raising job quality and living standards. Indeed, academic work has shown that aggregate labor productivity is primarily determined by (i) the quality of institutions, labor force (including the quality of the educational system), and public infrastructure; (ii) the diffusion information technologies; (iii) financial market depth; and (iv) labor and product market regulations.10 Labor market regulations do not seem to be particularly burdensome in the Dominican Republic but there is space to improve efficiency and competition in product markets. The World Bank Enterprise Surveys clearly indicate that firms in the DR operate in a regulatory environment that is not fully conducive to expansion and growth. Indeed, business conditions in the Dominican Republic lag several other Latin American and Caribbean countries, resulting in a prevalence of small-size enterprises and self-employed workers—traits usually associated with lower productivity levels (Perry et al., 2007). Lowering bureaucracy costs, the incidence of business-related corruption, and the cost of tax compliance 10 See, for instance, Autor et al., (2007), Kaplan (2009), Besley and Burgess (2004), Belorgey et al. (2006), and Gust and Marquez (2004).
Log of labor productivity
Labor market policies (t-1) -0.005
(0.010)
Product market policies (t-1) 0.025**
(0.011)
Credit market regulation (t-1) 0.022***
(0.007)
Constant 9.240***
(0.108)
Number of observations 956
Number of countries 107
R-sq. (within) 0.48
F statistic 22.04
*** p<0.01, ** p<0.05, * p<0.1
Note: Pooled least squares estimation with country and year fixed effects is
used. Sample includes the unbalanced panel data on 107 countries for the
period from 2000 to 2010. Labor productivity is measured in 1990 USD (PPP).
Robust standard errors are reported. Policy indices are obtained from the
"Economic Freedom of the World" database (Gwartney et al., 2007).
Employment growth rate
Firm size
Small (11-50 employees) -0.165**
(0.075)
Medium (51-250 employees) -0.165**
(0.065)
Large (251 and more employees) -0.284***(0.067)
Foreign ownership -0.117
(0.149)Exporter 0.037
(0.117)Age -0.003*
(0.002)Constant 0.393***
(0.145)Number of observations 322
R-sq. 0.186*** p<0.01, ** p<0.05, * p<0.1
Note: World Bank Enterprise Survey wave for year 2010 is used.
Employment growth rate is defined as the annualized growth rate of the
number of permanent workers between fiscal years t and t-3. Industry
controls are included. Sample weights are used and robust standard
errors are reported.
19
would notably contribute to an improved business climate with significant payoffs in terms of higher labor productivity growth. Reducing the incidence of corruption in firms’ everyday operations might strengthen the effect of other initiatives aimed at improving the business climate.11 In addition, improving the quality of education, including by matching technical training programs to labor market realities, and enacting measures to boost the labor force participation of key demographic groups would enhance labor market performance. So far, simply increasing education levels has not resulted in significantly better job quality. Moreover, women and young workers seem to have fewer incentives to offer their labor force given that they would command low real wages in the market and many receive income from abroad and/or from the head of their household. To break this vicious circle of dependence, better technical education would mold the skills of these demographic groups to market demand, thus raising their market wages and incentives to participate in the labor force. Mechanisms to improve the school-to-job transition could also be helpful, possibly through a tighter collaboration between technical schools and private sector employers. A deeper look into existing barriers for higher labor force participation of women could reveal a lack of affordable and reliable daycare centers for children, but more research is needed on this point. Broadly speaking, active labor market programs (including job training and job-search assistance) should be tailored to the skill set and needs of each overrepresented group in the jobless population (Box 1). These measures may also be accompanied by extensive provision of business training (e.g. managerial skills, financial literacy, quality management, product development, etc.) to owners of small and medium-size enterprises. Recent empirical evidence shows a range of improvements in enterprise productivity and performance from such training programs (McKenzie and Woodruff, 2012). Widespread labor market informality is also an obstacle to raising job quality in the Dominican Republic. Informality is pervasive and self-reinforcing: firms using informal labor arrangements tend to pay less tax and interact mostly with other firms hiring informal workers to avoid detection, which spreads the incidence of informality in the economy. In addition, informal firms tend to be smaller (and thus less productive), again to avoid detection. The resulting tenuous labor relations give little incentives to firms and workers to invest in human capital, which also hurts productivity and job quality. Continuing government efforts to reduce informality will pay off in the medium term as productivity and real wages would rise (the latter also because more formal employment would raise workers’ bargaining power).
11 For instance, Honorati and Mengistae (2007) use data for Indian manufacturing firms to show that the effect of regulation, infrastructure and credit constraints on firm growth is conditional on the incidence of corruption. In other words, improvements in those aspects of business environment would boost firms’ growth only if corruption is not a significantly constraining factor.

20
Box 1. Active Labor Market Programs and Their Effectiveness Active labor market programs (ALMPs) are important instruments aimed at reducing unemployment, facilitating the school-to-work transition among the youth and increasing the level of activity of the working-age population. ALMPs have traditionally been widely employed in OECD countries, but during the past two decades developing and emerging economies have also resorted to them to spur job creation and employment. There are several channels and mechanisms through which ALMPs can affect employment. Training and retraining programs may increase the productivity of the labor force, which would translate into higher wages and further increases in labor demand. Job search assistance programs may alleviate informational asymmetries between labor supply and demand, common in many developing countries, and, thus, facilitate the matching between workers and jobs. Wage and employment subsidies are another mechanism for supporting job creation, although these measures are often associated with a number of negative outcomes, particularly, due to the substitution effect (i.e. displacement of nonsubsidized workers) and deadweight losses (i.e. subsidizing jobs that would have been created without external assistance). Many countries also resort to the provision of entrepreneurship training aimed at providing skills for starting a business, obtaining initial capital, and operating a small-scale business. The fiscal burden of some of ALMPs might be substantial and their use in a specific country context requires a careful assessment of their potential benefits and costs. Moreover, the effectiveness of ALMPs can be substantially undermined in an environment with weak labor demand and slow growth. There is plenty of evidence on the effectiveness of ALMPs. For instance, relatively long time series data available for many OECD countries allows estimating the effect of ALMPs on aggregate labor market outcomes. In particular, Estevão (2007) show that ALMPs have been effective in raising employment rates in the business sector in a number of OECD countries. Direct job creation subsidies have been found to be the most effective mechanism for raising aggregate employment rate, even after taking into account externalities associated with them. The absence of significant dynamic effects of ALMPs on employment rates suggests that using ALMPs as an employment generation mechanism does not replace the need of implementing structural and institutional reforms, which is particularly relevant in the context of developing countries. Recent meta-analyses of a large number of evaluation studies on the effectiveness of ALMPs point to mixed results (Kluve (2010), Betcherman et al. (2007), Puerto (2007)). Job search assistance and employment services are largely found to be an effective mechanism to raise employment, while the effect of training programs (including entrepreneurship training) is mixed. Interestingly, training programs in developing and emerging economies are found to be more effective in raising youth employment than analogous programs in developed countries. Available evidence on the effectiveness of certain active labor market interventions in the Dominican Republic also points to mixed results. Card et al. (2011) estimates the effect of a youth training program (Juventud y Empleo) using a sample for 2004 and finds no significant effect on the post-training probability of finding employment, although there is evidence of improved employment quality (in terms of earnings and availability of medical insurance) conditional on having a job. This result is probably not the final conclusion on the effect of youth training programs in the Dominican Republic, as Ibarrarán and Rosas-Shady (2008) find a positive employment effect of the same training program for a larger sample collected at a later period. Another study points to the importance of providing more information on the benefits of schooling in the Dominican Republic. Jensen (2010) finds that perceived returns to schooling among eighth grade boys are significantly lower than observed earnings of high-school graduates. Informing randomly selected students about actual average earnings of high-school graduates increased the completed years of schooling on average by about 0.20 – 0.35 years.

21
APPENDIX
Table A1. Characteristics of formal and informal workers (age 15-65)
Formal Informal Formal Informal Formal Informal
Gender
Male 60.53 69.61 57.22 63.31 64.56 68.45
Female 39.47 30.39 42.78 36.69 35.44 31.55
Age
15 - 19 4.33 7.70 2.52 10.44 3.55 14.41
20 - 24 14.43 12.48 13.61 20.18 16.87 26.26
25 - 29 14.70 11.35 14.91 14.39 16.82 17.05
30 - 39 27.50 22.98 28.83 25.38 30.77 23.06
40 - 49 22.66 22.48 23.39 18.13 20.16 12.33
50 - 59 12.53 15.53 13.09 8.77 9.07 4.88
60 - 65 3.85 7.48 3.65 2.71 2.76 2.00
Family status
Married 21.47 13.95 23.74 14.34 18.73 9.05
Cohabiting 36.09 42.19 35.00 36.15 36.50 33.55
Single 24.75 25.64 22.61 33.17 26.79 42.59
Separated 17.69 18.22 18.65 16.34 17.98 14.81
Education
No education 4.50 11.92 4.26 4.87 4.46 4.80
Primary 30.25 52.59 27.39 36.31 30.82 38.51
Secondary 34.00 29.04 33.35 39.29 38.25 44.36
Tertiary 31.25 6.45 35.00 19.53 26.47 12.33
Income* 12969.1 9101.3 13085.2 9110.9 12571.6 7967.5
(13184.1) (10517.3) (11717.2) (8626.3) (10570.2) (8171.0)
Number of observations 4109 6509 2300 1848 1885 1249
Definitions of informal employment
Productivity based Employment contract based Social security affiliation based
Source: Nationa l Labor Force Survey, IMF s ta ff es timates .
Notes: Percent refers to shares of workers wi th corresponding characteri s ti cs in tota l number of observations . October 2011
wave of the National Labor Force Survey is used. Socia l securi ty a ffi l iation based defini tion of formal/informal employment
appl ies only to private sector employees.
* Monthly income in the main job, average, in RD$, s tandard deviation in parentheses .
22
Table A2. Characteristics of the working age population (15 – 65), currently not attending any type of schooling, by gender
EmployedUnemployed
(broad)
Unemployed
(search)(2) - (3) Inactivity Employed
Unemployed
(broad)
Unemployed
(search)(2) - (3) Inactivity
(1) (2) (3) (4) (5) (1) (2) (3) (4) (5)
Age Age
15 - 19 7,28 23,84 18,06 27,63 58,89 15 - 19 4,67 13,40 14,85 12,80 27,03
20 - 24 14,28 28,21 24,75 30,48 13,07 20 - 24 11,19 26,51 27,06 26,28 12,50
25 - 29 12,67 14,57 17,73 12,50 3,36 25 - 29 12,61 16,17 14,19 16,98 8,08
30 - 39 23,61 15,10 18,39 12,94 4,71 30 - 39 26,92 23,44 27,72 21,70 14,29
40 - 49 20,79 10,07 12,04 8,77 5,71 40 - 49 25,97 13,68 12,87 14,02 14,31
50 - 59 14,51 5,56 6,69 4,82 6,54 50 - 59 14,11 6,12 3,30 7,28 14,44
60 - 65 6,87 2,65 2,34 2,85 7,71 60 - 65 4,53 0,67 0,00 0,94 9,35
Family status Family status
Married 15,33 8,34 12,04 5,92 5,71 Married 19,83 8,52 8,91 8,36 13,79
Cohabiting 41,64 14,83 17,73 12,94 7,36 Cohabiting 36,31 36,36 26,40 40,43 37,67
Single 30,28 65,96 55,85 72,59 80,33 Single 15,58 28,42 30,36 27,63 30,59
Separated 12,75 10,86 14,38 8,55 6,60 Separated 28,28 26,70 34,32 23,58 17,96
Education Education
No education 10,33 2,91 4,68 1,75 7,48 No education 6,56 5,26 2,31 6,47 9,53
Primary 48,19 36,16 36,79 35,75 39,93 Primary 35,67 32,44 29,37 33,69 44,13
Secondary 30,79 47,42 44,15 49,56 44,05 Secondary 31,28 43,54 41,25 44,47 36,01
Tertiary 10,69 13,51 14,38 12,94 8,54 Tertiary 26,50 18,76 27,06 15,36 10,33
Relationship to household head Relationship to household head
Household head 60,76 22,38 28,76 18,20 15,31 Household head 30,25 18,56 24,75 16,04 16,04
Spouse or partner 3,26 2,52 2,68 2,41 1,41 Spouse or partner 46,19 34,93 25,41 38,81 43,33
Child 24,86 53,38 46,82 57,68 58,48 Child 16,44 34,83 39,60 32,88 26,24
Sibl ing 2,81 4,37 5,35 3,73 2,53 Sibling 1,33 2,01 1,98 2,02 1,29
Other relative 8,31 17,35 16,39 17,98 22,26 Other relative 5,78 9,67 8,25 10,24 13,11
Number of observations 7018 755 299 456 1698 Number of observations 3600 1045 303 742 4577
WomenMen
Source: National Labor Force Survey, October 2011 wave; IMF staff estimates.Notes: Percent refers to shares of workers with corresponding characteristics in total number of observations. Column (4) refers to individuals, who are included in the broad measure of unemployment (column (2)), but not in the search based definition of unemployment (column (3)).

23
REFERENCES Adams, R., 2011, Evaluating the Economic Impact of International Remmittances on
Developing Countries Using Household Surveys: A Literature Review, Journal of Development Studies, 47:6, 809-828.
Autor, D., Kerr, W., and Kugler A., 2007, Does employment protection reduce productivity? Evidence from US states, Economic Journal, 117 (June), F189-F217.
Belorgey, N., Lecat, R., and Maury, T., 2006, Determinants of productivity per employee. An empirical estimation using panel data, Economic Letters, 91(2), 153-157.
Besley, T., Burgess, R., 2004, Can labor regulation hinder economic performance? Evidence from India, Quarterly Journal of Economics, 119(1), 91-134.
Betcherman, G., Godfrey, M., Puerto, S., Rother, F., Stavreska, A., 2007, A review of interventions to support youth workers: findings of the Youth Employment Inventory, (Washington: World Bank).
Bussolo, M., Freije-Rodriguez, S., Diaz-Bonilla, C. and Zebaze Djiofack, C., 2010, “Crecimiento Económico y Desarrollo Social en la Republica Dominicana”, in Senderowitsch, R and Tsikata, Y.M., (ed.), De la Crisis Financiera Internacional al Crecimiento para Todos, Notas de Política, (Washington: World Bank).
Card, D., Ibarrarán, P, Regalia, F., Rosas-Shady, D., and Soares, Y., 2011, The Labor Market Impacts of Youth Training in the Dominican Republic, Journal of Population Economics, 29(2), 267-300.
Dutz, M., Kessides, I., O’Connell, S., and Willig, R., 2011, Competition and Innovation-Driven Inclusive Growth, World Bank Policy Research Working Paper 5852, (Washington: World Bank).
Estevão, M., 2007, “Labor Policies to Raise Employment,” IMF Staff Papers, Vol. 54, No. 1, pp. 113-138, March (Washington: International Monetary Fund).
Gust, C., and Marquez, J., 2004, International comparisons of productivity growth: the role of information technology and regulatory practices, Labour Economics, 11(1), 33-58.
Guzman, R., Cruz, C. , 2010, Estudio, Salario y Seguridad Social en el Tránsito de la Crisis a la Recuperación, Observatorio del Mercado Laboral Dominicano.
Gwartney, J., Lawson, R., and Hall, J., 2012, 2012 Economic Freedom Dataset, published in Economic Freedom of the World: 2012 Annual Report, Fraser Institute.
Honorati, M., and Mengistae, T., 2007, Corruption, the Business Environment, and Small Business Growth in India. World Bank Policy Research Working Paper 4339, (Washington: World Bank).
Ibarrarán, P., Rosas Shady, D., 2009, Evaluating the impact of job training programmes in Latin America: evidence from IDB funded operations, Journal of Development Effectiveness, 1(2), 195-216.

24
Jaramillo, L., and Sancak, C., 2007, Growth in the Dominican Republic and Haiti: Why has the Grass Been Greener on One Side of Hispaniola?, IMF Working Paper No. 07/63, (Washington: International Monetary Fund).
Kaplan, D., 2009, Job creation and labor reform in Latin America, Journal of Comparative Studies, 37, 91-105.
Kluve, J. , 2010, The effectiveness of European active labor market programs, Labour Economics, 17(6), 904-918.
Loayza, N., Fajnzylber, P., and Calderón, C., 2005, Economic Growth in Latin America and the Caribbean: Stylized Facts, Explanations and Forecasts, (Washington: World Bank).
McKenzie, D. and Woodruff, C., 2012, What are we learning from business training and enterpreneurship evaluations around the developing world?, IZA Discussion Paper No. 6895.
Perry, G., Maloney, W., Arias, O., Fajnzylber, P, Mason, A., and Saavedra-Chanduvi, J., 2007, Informality: Exit and Exclusion, (Washington: World Bank).
Puerto, O., 2007, Labor Market Impacts for Youth: A meta-analysis of the Youth Employment Inventory, (Washington: World Bank).
Sánchez-Ancochea, D., 2012, A Fast Herd and a Slow Tortoise? The Challenge of Upgrading in the Dominican Republic, Studies in Comparative International Development, 47, 208-230.