Embed Size (px)
Citation preview

ID PROGRAM
GLOBAL STUDY ABROAD
Abroad
© 2015 All Rights Reserved ó Texas A&M University
GROWING SALES AND MARKETSHARE PROFITABLY

Business Processes Process Metrics Finance Elements Financial Drivers
DISTRIBUTOR PROFITABILITY FRAMEWORKLinking Business Processes and Shareholder Value
STORE
SELL
SHIP
SUPPLYCHAIN
PLANNING
SUPPORTSERVICES
SOURCE
STOCK
Gross Margin
Days Payable Outstanding
Cash-To-Cash Cycle Time
Working Capital
Inventory Turnover
GMROII
Total Asset Turnover
Revenue Growth
Cash-To-Cash Cycle Time
Working Capital
Inventory Turnover
GMROII
Total Asset Turnover
Revenue Growth
Gross Margin
BUSINES
S
PROCESSES
SHAREHOLDER
VALUE
http://supplychain.tamu.edu© 2008 Supply Chain Systems Laboratory, Texas A&M University
SHAREHOLDER VALUE
GROWTH PROFITABILITY ASSETEFFICIENCY
CASHFLOW
BUSINESSPROCESSES
FINANCIALDRIVERS
SOURCE STOCK STORE SELL SHIP
SUPPLY CHAIN PLANNING
SUPPORT SERVICES
Days Sales Outstanding
Gross Margin
Total Asset Turnover
Revenue Growth
EBITDA
Supplier Management(Strategic Sourcing)
Fleet Management
Dispatch Management
3PL / Carrier Management
Customer Order Fulfillment
Sales Management
Pricing Management
Marketing Management
Warehouse Fulfillment (Inbound)
Warehouse Management
Inventory Management
Supply Chain Optimization
Information Technology
Finance Management
Human Resource Management
Product ReceivingProduct Put-Away
Product PlacementLocation TypeLocation IdentificationProduct Storage
Cycle Counting
Sales Force StratificationMapping Customers & Sales Force
Customer StratificationCost To Serve AssessmentNew Customer Identification
Pricing Optimization
Voice Of CustomerNew Product Introduction Market Selection & Target StrategyCustomer Portfolio Management
Fleet Capacity ManagementFleet Cost Assessment
Routing OptimizationLoading Optimization
Carrier Selection & Performance
Product PickingOrder Delivery
New Facility Location
Network OptimizationResource & Asset Alignment(Supplier - Inventory - Customer)Service Level Optimization
System Integration
Credit Management
Training & Development
Recruitment & RetentionCompensation Design
Total Landed Cost
Payment Terms
Quality & Flexibility
Lead Time & Variability
Fill Rate
Growth Potential
Data Integrity
Invoice Accuracy
Past Due Tracking Efficiency
Training Effectiveness (Benefit-To-Cost Ratio)
Time & Cost To Hire
Retention Rate
Accuracy & Efficiency
Space Utilization
Item & Location Accuracy
Sales Force Mix
Customer Mix
Cost-To-Serve & Right Price
Time-To-Market
Qualified Leads Per Marketing Activity
Asset Utilization
On-Time Delivery
Accuracy & Efficiency
Cost Of Goods Sold
Accounts Payable
Inventory
Revenue
Inventory
Revenue
Cost Of Goods Sold
Accounts Receivable
Revenue
Marketing Expenses (Payroll, Promotion, Media)
Fixed Assets (Plant, Property, Equipment)
Transportation Expenses
Warehouse Payroll
Revenue
GROWTH
PROFITABILITY
CASH FLOW
Total Asset Turnover
Working Capital
Inventory Turnover
EBITDA
Revenue Growth
Working Capital
Days Sales Outstanding
Account Receivable Turnover
EBITDA
Revenue Growth
ASSETEFFICIENCY
GROWTH
PROFITABILITY
CASH FLOW
ASSETEFFICIENCY
GROWTH
PROFITABILITY
CASH FLOW
ASSETEFFICIENCY
GROWTH
PROFITABILITY
CASH FLOW
ASSETEFFICIENCY
GROWTH
PROFITABILITY
CASH FLOW
ASSETEFFICIENCY
GROWTH
PROFITABILITY
CASH FLOW
ASSETEFFICIENCY
GROWTH
PROFITABILITY
CASH FLOW
ASSETEFFICIENCY
Supplier SelectionSupplier PerformanceSupplier StratificationSupplier Relationship
Inventory Stratification
What to Forecast?Demand ClassificationForecasting Method
When to Order? (Re-Order Point)How much to Order? (Order Quantity)Replenishment Policy
Inventory Mix
Forecast Accuracy
Fill Rate
Total Landed Cost
Revenue
Warehouse Payroll
Warehouse Rent
Inventory Write-Off
Total Asset Turnover
Revenue Growth
EBITDA
Total Asset Turnover
EBITDA
Revenue Growth
Fixed Assets (Plant, Property, Equipment)
Inventory
Operating Expenses (Transportation & Warehouse)
Revenue
Inventory
Accounts Receivable
Additional IT Expenses
Bad Debt (Write-Offs)
Hiring & Training Cost
Revenue
Optimal Network Location
Optimal Resource Deployment
Optimal Service Level

Profitability Framework – Concept
Business Process
• Inventory Stra2fica2on
Process Metric
• % of slow-‐moving inventory
Financial Element
• Inventory
Financial KPI
• GMROII
Financial Driver
• Profitability
Shareholder Value
• Increased ROI
1
Business Process
• Supplier Performance
Process Metric
• LT Variability
Financial Element
• Inventory
Financial KPI
• GMROII
Financial Driver
• Profitability
Shareholder Value
• Increased ROI
Business Process
• Customer Stra2fica2on
Process Metric
• Cost-‐to-‐serve
Financial Element
• Revenue, A/R
Financial KPI
• GM & DSO
Financial Driver
• Profitability & Cash Flow
Shareholder Value
• Increased ROI

GENERATING GROWTH - BEST PRACTICESHow do we generate growth opportunities?
COUNCIL F R RESEARCHON DISTRIBUTOR BEST PRACTICESAn Alliance of the NAW Institute & Texas A&M University
CRDBP
www.naw.org/crdbp http://supplychain.tamu.eduwww.nawpubs.org
MetricsGrowth Strategy Best Practices
LEVERAGEAccount Penetration - Existing customers
GrowthMechanism
GROWTH
PROFITABILITY
CASH FLOW
ASSETEFFICIENCY
PENETRATEMarket penetration - New Customers
BROADENNew Products and Services
ADDSales & Marketing Channels
REACH OUTGeography
EXPANDMarket Segments
BUILDNew Platform (multiple drivers)
INNOVATEValue Proposition Innovation
DIVERSIFYLine of Trade & Value Chain Function
GROWTHDRIVERS
IndustryDynamics
CustomerRelationships
SupplierRelationships
Sales &MarketingStrategy
Sales ForceEffectiveness
Account gap analysisCustomer stratificationSales force effectivenessRetention strategyValue proposition update
Market gap analysisSupplier collaborationCompetitive value propositionSales force performance managementSelling process
Growth mapping core customer andstrategic supplierIndustry trends analysisCompetitive analysis
Customer feedbackPain point analysisGrowth mapping core customer and strategic supplierProduct & service portfolio management
Market mappingTechnology developmentsCustomer need/convenience
Market mappingIndustry trends analysisCompetitive analysis
Growth mapping core customer andstrategic supplierMapping key competitorsSupply chain network optimization
Market segmentationSupplier growth inputsCompetitive analysisIndustry trends analysis
Customer feedbackSupplier inputsValue chain analysisCross-industry best practices
Core customer retention rateCore customer conversion rateShare of walletBalance revenue reliance (risk)
New customer acquisition rateRevenue from new (core) customersNew customer retention rate
Growth pipeline run rateGrowth from new platformsChange in competitive advantage
Growth from new products and services Value proposition leverageBalance over-dependency
Growth from new channelsChange in competitive advantage
Change in competitive advantageRisk managementGrowth from diversification
Growth from new territories Value proposition leverage(national accounts)
Growth from new market segmentsDegree of variety in end markets(risk factors)
Number of innovative effortsGrowth from innovate opportunitiesChange in competitive advantage
OrganicDevelopment
Acquisition
Merger
Strategic Alliance
Growth Drivers
© 2011 Global Supply Chain Laboratory

Strategic Planning Process Process Metrics Financial Elements Financial Metrics
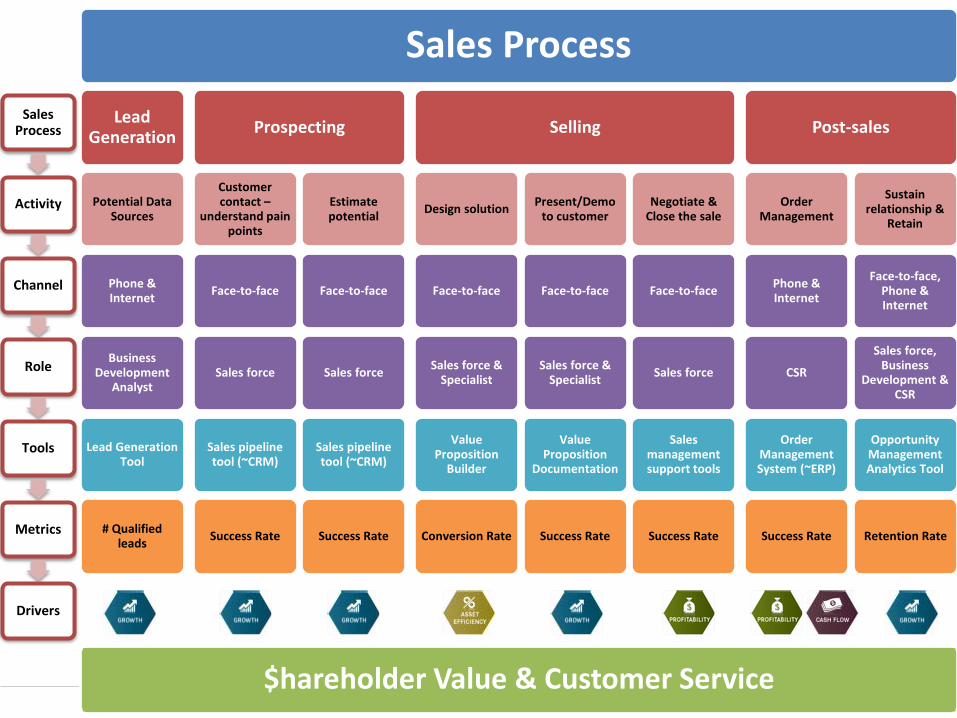
SALES AND MARKETING FRAMEWORKLinking Sales and Marketing Processes to Shareholder Value & Customer Service
SHAREHOLDER
VALUE
CUSTOMER SERVICE
BUSINESS DEVELOPMENT (Markets, Products & Services)
New market segment development
New products and services development
Existing products and services management
Existing market segment management
SALES FORCE DESIGN, DEVELOPMENT AND MANAGEMENT
PERSONAL SELLING (SALES FORCE)
MARKETING COMMUNICATIONS
Customer mix - customer stratification Product & services mix Geographic mix Number of identified opportunities (leads, new customers, etc.) Number of realized opportunities Opportunity-to-sales ratio
Chargeback / rebate by supplier Returns trend by supplier Quality index by supplier Warranty Issues - frequency & resolution (time and cost) Safety / regulation compliance Customer satisfaction index
Customer’s product & service needs (voice of customer) Number of new products introduced Coordination with promotion, sales, purchasing & vendors Training & demo programs completed Customer satisfaction index
Number of new market segments Identified Segment attractiveness (potential) Segment competitiveness Coordination with vendors, sales and potential customers Potential core customer profiling Qualified leads
Alignment with sales force Synergy among media mix Effectiveness metrics Efficiency metrics
Qualified customer complaints Qualified sales force complaints Ease of coordation and control
Voice of customer Sales people complaints & morale Sales turnover Sales or GM per salesperson Cost of sales
Qualified customer complaints Qualified sales force complaints Patterns in quota attainment Alignment with sales strategy
Goal achievement Alignment with company objectives and customer needs Simplicity, consistency, ease of implementation, results and reward relationship Sales force satisfaction (engagement and pay variation)
Average training hours Training frequency Training content mix Training method mix
Degree of consensus in the sales system Alignment with sales strategy Relevance to selling environment
Sales force efficiency Sales force effectiveness
Level of integration with sales process Source of value for sales force Complexity & flexibility of tools Coordination between sales and IT
Sales force retention or attrition rate Percentage of low performers Quality of hire Sales force satisfaction index
Incremental revenue Operating expenses (cost-to-serve) Accounts receivables
Operating expenses (cost-to-serve) Outstanding credit - rebate / chargeback / Volume discount Impact on revenue
Revenue by product Revenue by market segment Operating expenses (cost-to-serve)
Incremental revenue Advertising / promotion expenses (payroll, media, services)
Revenue Selling expenses Operating expenses (cost-to-serve)
Revenue Selling expenses Operating expenses (cost-to-serve)
Recruiting and hiring Cost
Revenue
Operating expenses (cost-to-serve) Training expenses
Revenue Selling expenses Operating expenses (cost-to-serve)
Revenue Growth
EBITDA
Days Chargeback Outstanding
Days Sales Outstanding
Market Share
An Alliance of the NAW Institute & Texas A&M University
COMPANYOBJECTIVES
SALES FORCEPRIORITIES
CUSTOMERNEEDS
Value
Pro
posit
ion Sales Process
Sales Management
IdentifyLeads
InterviewPotentialCustomer
DiscoverPotential
Presentto Customer
DesignSolution
Follow-up & Close the Sale
DeliverProducts &
Services
Post-SalesSupport
Negotiatewith Customer
VALUE POSITIONING
SALES AND MARKETING STRATEGYCross Functional Team
MARKET SEGMENTATION
MARKETSEGMENTATION
1
2
3
TARGETMARKET SELECTION
VALUEPOSITIONING
SUPPLY CHAINPLANNING
STOCK
Warehouse Fulfillment Warehouse Management Number of Locations
Inventory Stratification Forecasting Replenishment Policies
STORE
Strategic Sourcing Supplier Management
SOURCE SHIP
Information Technology Finance Management Human Resource Management
SUPPORTSERVICES
COMPANY
VISI
N
&
MISSION
Sales & Marketing Strategy Sales & Marketing Processes
What is the market?1
Market Analysis (Supplier & Customer-focused) Competition Analysis Economy & Political Impact Technological & Social Change
Where are we?2
SWOT Analysis Current Performance 4 Stakeholders - Shareholder, Customer, Employee & Supplier
Where do we want to be?3
Shareholder Value Expectation Customer Needs Company Objectives / Goals Benchmarking
Why should customersdo business with us?
5
Core Competence Value Proposition Competitive Advantage
How do we get there?4
Market Penetration (New) Product and Service Development (New) Market Development Diversification
COMPANYOBJECTIVES
(Shareholder Value Goals)
COMPANYSTRATEGY
FUNCTIONALOBJECTIVES
Communication Objectives
Target Audience
Communication Budget
Message (value proposition)
Media Mix
Performance Evaluation
SELL
Products (Brand) Inventory Availability Breadth and Depth (Capital) Market Coverage (Exclusivity) Price (Supplier Driven)
Value-add Services (Capability) Delivery (Capability) Facilities (Capability) Market Coverage (Capability) Cost (Cost-to-serve Driven)
Direct Sales Force (Market / Industry Knowledge & Selling Skills) Technical Support (Product & Application Knowledge) Price (Market Driven)
Credit Terms (Capital) Customer Service (Order Management) Market Presence & Experience (Knowledge & Relationship) Value-add Services (Capability)
SOURCE & STOCK
SELLSUPPORTSERVICES
STORE, SHIP &SUPPLY CHAIN
PLANNING
VALUEPROPOSITION
CREATE VALUE PROPOSITION DELIVER VALUE PROPOSITION SUSTAIN VALUE PROPOSITIONCOMMUNICATE VALUE PROPOSITION
DiversificationProduct &Services
Development
MarketDevelopment
MarketPenetration
BUSINESSDEVELOPMENT
CATALOG &LINE CARDS
WEBSITE DIRECTMAIL
SOCIAL MEDIA& PR
EMAILCAMPAIGN
TRADESHOW
ADVERTISING(ONLINE &OFFLINE)
CUSTOMERSERVICE
REP
FIELD SALESFORCE
SPECIALIST
CUSTOMER
Sales Process
Sales Force Structure
Sales Force Size
Sales Force Deployment
Sales Force Compensation
Sales Force Recruitment
Sales Force Training
Sales Force Culture
Sales Management
Sales Support Tools
Hit rate or conversion rate Completeness of sales process
Revenue Growth
Market Share
EBITDA"EBITDA
Revenue Growth
Market Share
EBITDA
EBITDA"Return on Marketing Spending(Advertising & Promotion)
www.naw.org/crdbphttp://id.tamu.edu
Created by Senthil Gunasekaran, Pradip Krishnadevarajan and Barry Lawrence
www.nawpubs.org
Revenue Growth
Market Share
EBITDA"Gross Margin
Days Sales Outstanding
EBITDA
Total Asset Turnover
Revenue Growth
Market Share
EBITDA"Gross Margin
Days Sales Outstanding
EBITDA
Total Asset Turnover
GROWTH
PROFITABILITYASSET
EFFICIENCY
SELL
FUNCTIONALSTRATEGY
Fleet Management Dispatch Management 3PL/Carrier Management Customer Order Fulfillment
CASH FLOW
© 2012 Global Supply Chain Lab, Texas A&M University
1
2
4
3
Market Macro Segments
ClusteredMicro Segments
MicroSegments
A
B
E
C
D
F

Customer Stra,fica,on Model
1
• High Profitability • No Rela2onship • Low Cost to Serve • Low Volume
Opportunis2c Customers
• High Profitability • Sustained Rela2onship • Low Cost to Serve • High Volume
Core Customers
• Low Profitability • No Rela2onship • High Cost to Serve • Low Volume
Marginal Customers
• Low Profitability • Sustained Rela2onship • High Cost to Serve • High Volume
Service Drain Customers
Customer Loyalty (Life)
Custom
er Profitab
ility
Customer Buying Power
Cost-‐To-‐Serve (CTS)
• # Customers: 5-‐10% • Revenue: 60% • NP: 80%
• # Customers: 5% • Revenue: 5% • NP: <10%
• # Customers: 5-‐10% • Revenue: 30% • NP: <10%
• # Customers: 70-‐75% • Revenue: 5-‐10% • NP: <5%

MANAGING GROWTH - BEST PRACTICESHow do we manage profitability while growing?
COUNCIL F R RESEARCHON DISTRIBUTOR BEST PRACTICESAn Alliance of the NAW Institute & Texas A&M University
CRDBP
www.naw.org/crdbp http://supplychain.tamu.edu
© 2011 Global Supply Chain Laboratory
www.nawpubs.org
Profitability Drivers ProcessGroups Growth ForcesGrowth Challenges Best Practices
Supplier proliferationProduct mix Supplier's channel strategyChannel power balanceChannel visibility
Competency GapTalent attractivenessTechnology and applications infrastructureLeadership gapLack of coordination, control & synergiesOrganizational mobility
Margin pressure from growing customersLack of pricing strategy (value proposition)Competency gapLack of support toolsSub-optimal market mix
SKU proliferationProduct portfolio / mixCost Vs service trade-offFill rate challengesSupplier performance
Sales force capacity vs customer coverageLack of sales-support productivity toolsMisaligned sales force incentives
Warehouse capacityOperating cost challengesCustomer service (accuracy & efficiency)
Ownership typeAccess to growth fundingInvestor attractiveness
Transportation capacityTransportation cost (routing & cubing / loading)Customer service (on-time delivery)
Credit requests from growing customers“New Normal” challenges
Credit, return and rebate policies forproduct expansion growth strategies
Supplier stratification & relationship strategyOptimizing channel compensationChannel growth strategy alignmentLeverage supplier performance
Customer stratificationPricing optimizationIn-built mechanism for early warningsActive adaptation of value propositionMarket segmentation
Inventory stratificationFocused forecastingDynamic replenishmentInventory network optimizationCompetency development
Sales force size & structureSales force productivity (support tools)Sales force compensationAligning customer, company and sales force
Operations (inbound & outbound) productivity - LeanEconomy of scaleBest practices sharingInternal benchmarking
Human capital developmentInformation capital readinessStrategic awareness and alignmentCustomer-centricGrowth mindset Creative leadershipStrategy & structure match
Financial fitness through free cash flow andoperating productivityInvestor confidence
Routing and loading optimizationEconomy of scaleSupply chain network optimization (Transportation vs Inventory)
Customers Human andIT Capital
Suppliers Shareholders
GROWTHFORCES
Customized terms based on customer stratificationIn-built mechanism for early warningsActive adaptation of value proposition
Optimizing channel compensation throughstrategic supplier relationshipLeverage supplier performance
GM%
CTS
DSO
DOI
DPO
OPPORTUNITY
CAPABILITY
> HUMAN CAPITAL> INFORMATION CAPITAL> ORGANIZATION CAPITAL
> FINANCIAL CAPITAL
OPERATINGMARGIN
CASHCONVERSION
CYCLE
SUPPORTSERVICES
STORE
SELL
SELL
SOURCE
STOCK
SUPPLYCHAIN
PLANNING
SOURCE
SHIP
BUSINESSMODEL
GROWTH
PROFITABILITY
CASH FLOW
ASSETEFFICIENCY
ECONOMICDRIVERS
RESOURCEDRIVERS
>> Shareholders>> Leadership
>> Human Capital>> Information Capital>> Organization Capital
>> Supplier>> Purchasing Workforce
>> Supplier>> Customer>> Cross-functional Workforce
>> Supplier>> Sourcing Workforce
>> Customer>> Sales Force
>> Customer>> Operations Workforce
>> Customer>> Sales Force
© 2015 All Rights Reserved Texas A&M University Global Supply Chain Lab
Sales Process
Lead Generation
Potential Data Sources
Phone & Internet
Business Development
Analyst
Lead Generation Tool
# Qualified leads
Prospecting
Customer contact –
understand pain points
Face-to-face
Sales force
Sales pipeline tool (~CRM)
Success Rate
Estimate potential
Face-to-face
Sales force
Sales pipeline tool (~CRM)
Success Rate
Selling
Design solution
Face-to-face
Sales force & Specialist
Value Proposition
Builder
Conversion Rate
Present/Demo to customer
Face-to-face
Sales force & Specialist
Value Proposition
Documentation
Success Rate
Negotiate & Close the sale
Face-to-face
Sales force
Sales management support tools
Success Rate
Post-sales
Order Management
Phone & Internet
CSR
Order Management System (~ERP)
Success Rate
Sustain relationship &
Retain
Face-to-face, Phone & Internet
Sales force, Business
Development & CSR
Opportunity Management Analytics Tool
Retention Rate
Sales Process
Activity
Channel
Role
Tools
Metrics
Drivers
$hareholder Value & Customer Service

3
Sales Force Stratification Framework
• High Profitability • Effec2ve Rela2onships • Resists New Business • Developed Skill Set
Farmers • High Profitability • Effec2ve Rela2onships • Business Development • Developed Skill Set
Entrepreneurs
• Low Profitability • Weak Rela2onships • Resists New Business • Undeveloped Skills
Defenders
• Low Profitability • Weak Rela2onships • Busness Development • Innate Skills
Hunters
Produc2vity
Efficien
cy
Opportunity
Skill Develop
men
t
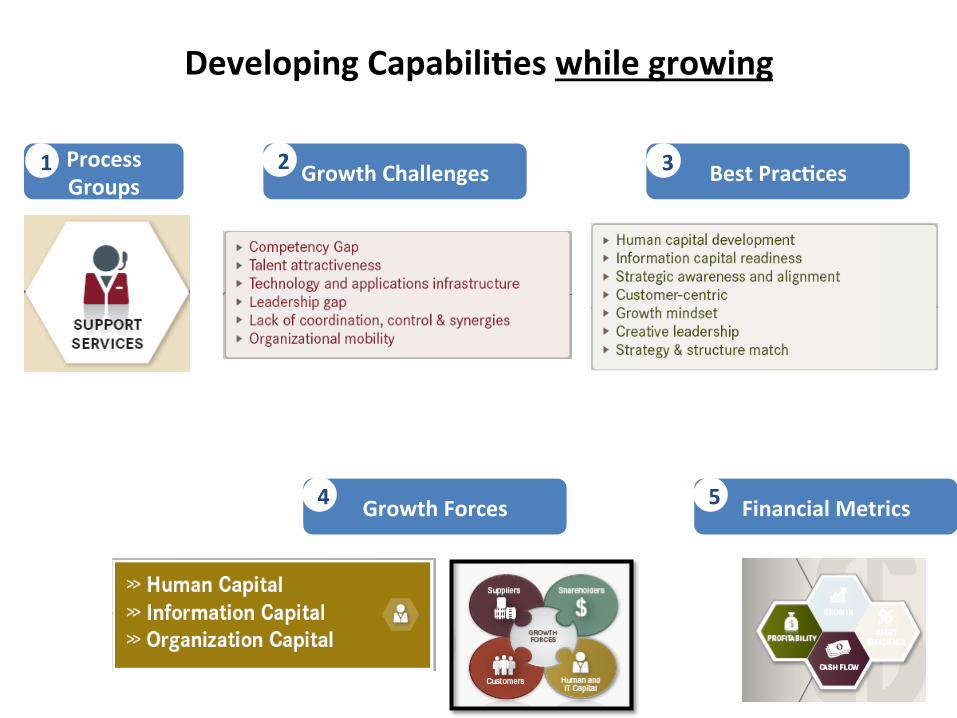
Developing Capabili.es while growing
Process Groups Growth Challenges Best Prac.ces
Growth Forces Financial Metrics
1 2 3
4 5

Texas A&M University ó Industrial Distribu7on Program 1
naw.org

2827
Professional Development Certificate Programs
Number 1 Industrial Distribution program in the world.
24 InstructorsAverage teaching
experience
of at least 16 years
Learn secrets to implement key best practices in
3-6 Months10 unique topics
that will boost your firm’s bottom line.
Proven methods driven by
cutting edge research for over
55 yearsOver 950
business professionals attend our workshops every year
Program duration is
1-5 Days
Help more than 265 companies each year to create competitive advantage
Distributor Profitability
Channel Compensation
Sales & Marketing
Inventory Management
Customer Service
Distributor Competitive Advantage
CustomerManagement
Growth and Marketshare
Distribution Manager Essentials
CompanySpeCifiC
programS
openenrollment programS
Pricing
Why Work With us?
our oFFEriNGs
Offer education
sessions in
13 Countries
professional development

Learn secrets to implement key best practices in
3-6 Months
Help more than 265 companies each year to create competitive advantage
29
professional development
WHO SHOULD ATTENDExecutive and Senior Management
High Potential Candidates
for Management
Strategic Managers
Regional Profit Center Heads
Business Development Managers
“We are impressed with the material and its potential impact on our profitability. Truly informational and education for the times.” - Gary McKillican, President and CEO, McKillican International, Inc.
ACHIEVING COMPETITIVE GROWTH - how to generate growth while achieving competitive advantage?
Generating Growth Opportunities• Growth Framework• Growth Drivers and Strategies• Growth Mechanisms
SUSTAINING COMPETITIVE GROWTH - how to sustain growth while sharpening competitive advantage?
Sustaining and Growing Margins – Pricing Optimization• Primary Drivers – What are the key variables that should drive a pricing decision?• Analytics – How to analyze each variable?• Optimization – Developing and building pricing rules• Execution – Roadmap for success
MANAGING COMPETITIVE GROWTH - how to manage profitability while growing?
Optimizing Distributor Profitability• Business Process Framework• Financial Framework• Optimizing Profitability – The Five-Step Methodology• Double EBITDA and Triple RONA
Building Competitive Advantage• Sales and Marketing Strategy• Market Segmentation• Target Market Selection• Competitive Value Proposition
DAY
1
DAY
2
DAY
3
Sales and Marketing Processes• Customer Stratification• Sales Force Design, Development and Management• Marketing Communications
Sustaining Growth – How to sustain profitable growth against strategic risk?• Growth Barriers• Blind spots – Opportunity & Capability• Risk Management• Competitive Value Proposition
Executive Session on Distributor Competitive Advantage In Pursuit of Competitiveness
3 DAYS

31
Programs on texas a&m Campus Duration DatesIntensive Customer Stratification 4 Days March 9-12, 2015Distribution Manager Certificate 5 Days April 13-17, 2015Executive Session on Distributor Competitive Advantage 3 Days May 19-21, 2015Intensive Inventory Management 5 Days September 7-11, 2015
El Salvador - Central america Programs Duration DatesInventory Management 2 Days March 16-17, 2015Customer Stratification and Pricing Optimization 2 Days April 13-14, 2015Inventory Management and Forecasting Techniques 2 Days August 18-19, 2015Best Practices - Operations Excellence 2 Days October 26-27, 2015 Panama - Central america Programs Duration DatesInventory Management 2 Days March 19-20, 2015Customer Stratification and Pricing Optimization 2 Days April 16-17, 2015Inventory Management and Forecasting Techniques 2 Days August 20-21, 2015Best Practices - Operations Excellence 2 Days October 29-30, 2015 mexico Programs Duration DatesInventory Management 2 Days March - August 2015Customer Stratification and Pricing Optimization 2 Days April 2015Lean Supply Chain Management 2 Days March - August 2015The New Science of Customer Service 2 Days March - August 2015Machining for Profit 2 Days March - August 2015Advanced Statistical Tolerancing 3 Days March - August 2015
CuStom PRogRamS Duration whereOptimizing Distributor Profitability 1-3 Days On-Campus or On-SiteSales and Marketing Optimization 1-3 Days On-Campus or On-SiteOptimizing Growth and Market Share 1-3 Days On-Campus or On-SitePricing Optimization 1-3 Days On-Campus or On-SiteOptimizing Channel Compensation 1-3 Days On-Campus or On-SiteIntensive Customer Stratification 1-4 Days On-Campus or On-SiteDistribution Manager Certificate 1-5 Days On-Campus or On-SiteExecutive Session on Distributor Competitive Advantage 1-5 Days On-Campus or On-SiteIntensive Inventory Management 1-5 Days On-Campus or On-Site
PROGRAM CALENDAR 2015 Professional Development Certificate Programs
professional development
Inventory Management & Forecasting Technique Panama, August 2014
Customer Stratification & Pricing Optimization El Salvador, May 2014
Supply Chain Management India, December 2013