Embed Size (px)
Citation preview
PAGE 1
GROUP MANAGEMENT REPORT AND CONSOLIDATED FINANCIAL STATEMENTS FOR 2008 PREPARED IN ACCORDANCE WITH IFRSs

PAGE 2
RLB NÖ-Wien Group
MONETARY VALUES ARE IN €m 2008 +(-) CHANGE 2007 1
Income Statement
Net interest income after impairment losses on loans and advances 104.2 (10.6%) 116.5
Net fee and commission income 59.0 (16.3%) 70.5
Net trading income (3.3) (123.7%) 13.9
Net income from investments accounted for using the equity method 162.7 (33.2%) 243.7
General administrative expenses (163.5) 3.5% (157.9)
Profit before tax 2.7 (99.1%) 303.7
Consolidated profit 29.1 (90.4%) 303.6
Balance Sheet
Loans and advances to other banks 9,162 73.0% 5,295 Loans and advances to customers 8,514 23.7% 6,883
Deposits from other banks 11,359 52.3% 7,460
Deposits from customers 6,462 17.0% 5,521
Equity (incl. Profit) 1,920 1.2% 1,897
Assets 27,533 40.8% 19,549
Regulatory information
Risk-weighted basis of assessment (BWG: Austrian banking act) 12,012 28.2% 9,368
Total own funds 1,568 35.8% 1,155
Own funds requirement 1,047 29.3% 810
Surplus own funds ratio 49.8% 7.3 ppt 42.5%
Tier 1 ratio 9.1% 1.6 ppt 7.5%
Own funds ratio 12.0% 0.6 ppt 11.4%
Performance
Return on equity before tax 0.1% (17.0 ppt) 17.1% Consolidated return on equity 1.5% (15.6 ppt) 17.1%
Cost:income ratio 43.4% 12.7 ppt 30.7%
Earnings per share €14.56 (90.4%) €152.39
Return on assets after tax 0.12% (1.56 ppt) 1.69%
Risk:earnings ratio 30.4% 11.4 ppt 19.0%
Additional information
Workforce on the balance-sheet date 1,232 3.6% 1,189
Branches and offices 72 ² 2 70
1 The RLB NÖ-Wien Group is a subgroup of the Raiffeisen-Holding NÖ-Wien Group. The Bankwesengesetz (BWG) does not govern the regulatory own funds of subsidiaries that make up a subgroup. Consequently, the bank regulatory information provided with respect to the Kreditinstitutsgruppe (credit institution group) on a partially consolidated basis in accordance with BWG is provided for informational purposes only.
2 In April 2009.
SURVEY OF KEY DATA

PAGE 3
SURVEY OF KEY DATA 2 GROUP MANAGEMENT REPORT 5 BUSINESS PERFORMANCE AND ECONOMIC CONDITIONS 5 NOTES ON THE GROUP’S ASSETS AND FINANCIAL POSITION AND THE RESULTS OF ITS OPERATIONS 10 FINANCIAL PERFORMANCE INDICATORS 17 MATERIAL EVENTS AFTER THE BALANCE SHEET DATE 18 BRANCHES AND OFFICES 18 RESEARCH AND DEVELOPMENT 18 NON-FINANCIAL PERFORMANCE INDICATORS 19 OUTLOOK FOR 2009 22 CONSOLIDATED FINANCIAL STATEMENTS PREPARED IN ACCORDANCE WITH IFRSs 25 A. INCOME STATEMENT 25 B. BALANCE SHEET 26 C. STATEMENT OF CHANGES IN EQUITY 27 D. CASH FLOW STATEMENT 30 E. NOTES 32
The fundamentals of consolidated financial reporting in compliance with IFRSs 33 Recognition and measurement policies 37 Details of the Income Statement 53 Details of the Balance Sheet 66 Notes on financial instruments 87 Additional information 116 Overview of equity investments (pursuant to § 265 Abs. 2 UGB) 130 Boards and officers 137
DECLARATION BY THE MANAGING BOARD 139 AUDITORS’ REPORT (REPORT BY THE INDEPENDENT AUDITORS) [TRANSLATION] 140
CONTENTS

PAGE 4

PAGE 5
THE ECONOMIC ENVIRONMENT
The Austrian economy suffered a year of economic
downturn in 2008. In 2007, it had still grown by over 3 per
cent in real terms, which was the highest rate of growth in
seven years, but it only grew by approximately 2 per cent
in 2008.
Nonetheless, growth remained dynamic in the first half of
2008, with real GDP growing by 2.8 per cent. Growth was
driven by good capacity utilization in the industrial sector
and in the service industries that supply the corporate
sector. However, the international economic decline
spread to the Austrian economy in the second half. As a
result, output of material goods, which is seen as a
forward indicator, was already weakening significantly in
the summer.
WIFO company surveys in the second half indicated that
the state of the economy would deteriorate rapidly and
severely. The economic downturn was depressing the
investment climate. In addition, the effects of the financial
markets crisis were impacting on the external and internal
financing of investment projects. Capital expenditure on
plant and machinery only grew by just under 2 per cent in
2008.
Austrian exporters have been the main pillar of the Austrian
economy in recent years, but the demand for Austrian
goods and services was increasingly weighed down by the
slump in the international economy during 2008. As a
result, real exports grew by just half as much as in 2007,
increasing by about 4 per cent.
Domestic consumption remained weak, growing by
roughly a mere 1 per cent in 2008. This was once again a
much slower rate of growth than the long-term average as
nominal incomes hardly grew.
High energy and raw material prices led to an average rate
of inflation of 3.2 per cent in 2008. However, having been
very high at the beginning of the year, crude oil and food
prices fell sharply again towards year-end. Crude oil was
thus trading at a very high price of over US$ 145 a barrel in
July 2008 but reached a five-year low of just under US$ 40
a barrel in December 2008.
The economic slowdown had a time-lagged effect on the
job market during 2008. There was still a strong increase
in jobs in the year under review, and using the EUROSTAT
definition, the jobless rate in Austria was static at 3.5 per
cent and was one of the best in the European Union.
However, the slump had a growing impact on the job
market as a series of big companies put staff on short-
time work and laid off subcontracted workers.
GROUP MANAGEMENT REPORT
BUSINESS PERFORMANCE AND ECONOMIC CONDITIONS

PAGE 6
THE INTERNATIONAL ECONOMIC ENVIRONMENT
At the turn of 2008/2009, the eurozone economy was in
recession, having already shrunk by 0.2 per cent on the
previous quarter in the second and the third quarter of
2008. The eurozone’s real GDP grew by just 1 per cent
over 2008 as a whole, which was well below the previous
year’s figure of 3 per cent. The downturn affected every
country. The sole relief came from public sector
investment financed by the national economic
programmes that had been put in place, but they will only
take hold fully in years to come.
The Czech Republic and Slovakia — two countries in the
Centrope region — continued to profit from the
attractiveness of their locations during 2008. They were
only affected by turmoil in the financial markets with a time
lag, achieving slowing but still robust growth. Slovakia’s
stability-orientated policies and relatively strong GDP
growth contributed to the ECOFIN Council’s decision to
allow Slovakia to join the euro on 1 January 2009.
Hungary, which is fighting hard to stabilize its budget
deficit, was pulled furthest into the maelstrom of events in
the global financial markets. The forint fell some 30 per
cent against the euro in October. The International
Monetary Fund, World Bank and European Union all
granted sizeable loans to help stabilize the Hungarian
economy.
Global economic growth also slowed substantially in 2008.
Following unusually strong average growth of 5 per cent
per annum between 2004 and 2007, the global economy
only grew by roughly 3 per cent in 2008. The third and
fourth quarter were particularly hard hit by the adverse
effects of events in the global money economy on the
global real economy. From the third quarter, growth also
slowed in the United States and Japan, and the rate of
growth in the emerging economies fell as well.
MONEY AND CAPITAL MARKETS
The international financial markets crisis got worse and
worse as 2008 progressed, affecting the entirety of the
global capital markets. The news of default by Lehman Brothers — until that time America’s third-largest
investment bank — sent a shock wave of enormous power
into the financial and real economies on
15 September 2008.
The international interconnectedness of the banking
industry intensified the crisis of confidence. Banks around
the world were confronted with undreamt-of counterparty
risks, and risk premiums on all assets classes increased
dramatically. This necessitated large-scale liquidity
support from the bigger central banks and extensive
government financial support packages for banks in
trouble in the property finance and investment banking
fields. In 60 years, the US and European banking
industries had never seen either impairment allowances in
the wake of requisite mark-to-market valuations or capital
increases and partial nationalizations of this kind or of the
rapidity that was needed now.
PAGE 7
The failure of Iceland’s banks and the threatened
insolvency of several countries further aggravated the
situation. Since the beginning of November 2008, a sharp
downturn in the industrialized economies with its roots in
the financial sector has been a virtual certainty.
As a consequence, central banks around the world have
cut their key interest rates. To take one example, in
January 2009, the US Federal Reserve cut its rate to nearly
zero in the pursuit of its growth-orientated targets. The
ECB, which stuck to its declared goal of combating
inflation, was late to cut its key rate. Having increased it
by 0.25 percentage points to 4.25 per cent at the
beginning of July, it lowered it in several steps to 2 per
cent in the middle of January 2009. Despite central bank
interventions, the markets were seriously distorted. For
instance, rates in the interbank market — including, above
all, rates for US dollars, but also rates for the euro in the
third quarter of 2008 — were sometimes 4 and
2 percentage points, respectively, higher than rates for
central bank money. Because counterparty risks had
increased, most liquidity equalization took place through
the central banks. At the same time, risk premiums rose
sharply.
Investors abandoned high-return, high-risk asset classes
in a process called deleveraging, making the day-to-day
raising of funds much more expensive.
There were also big movements in the currency markets.
For instance, by mid-October, the US dollar had
strengthened by as much as 30 per cent against the euro
from a low of US$1.60/€ at the end of July. By year-end, it
had returned to US$1.39/€.
The international stock markets had a particularly poor
year. All of the world’s major stock indices suffered big
losses, including the Vienna stock exchange’s key ATX
index. After years of rising prices, it retreated by 61 per
cent during the year to stand at 1,751 points at year-end
2008.
AUSTRIA’S PARLIAMENT PASSES BANK SUPPORT PACKAGE
In step with the parliaments of other EU member states,
Austria’s Nationalrat enacted the
Finanzmarktstabilitätsgesetz (financial markets stability
act) during its session on 25 October 2008, enabling the
Republic of Austria to give the Austrian banking industry
support whenever banks come under pressure.
The government support package for the Austrian banks
enacted by Parliament is worth €100 billion. €10 billion of
the total is earmarked for deposit guarantees and another
€75 billion for other government guarantees, these
amounts being designed to ensure that banks lend each
other money again. The framework for equity investments
by the government or other measures to strengthen the
financial sector’s equity base is €15 billion. Little use was
made of these funds in 2008.
In addition, the federally guaranteed clearing system —
which channels surplus liquidity to banks threatened with a
liquidity bottleneck via a clearing office, or through which
banks can themselves issue government-guaranteed
bonds — began operating.

PAGE 8
CHANGE IN THE SCOPE OF CONSOLIDATION
In line with the RLB NÖ-Wien Group’s increased strategic
focus on the Centrope region as part of its extended home
market and in accordance with the provisions of IAS 28,
the Centrope banks — Raiffeisenbank a.s. (Czech
Republic), eBanka, a.s. (Czech Republic), Raiffeisen Bank Zrt. (Hungary) and Tatra banka a.s. (Slovakia) — were
added to the list of entities accounted for using the equity
method as of 1 January 2008. Raiffeisen International Bank-Holding AG (R-International) likewise became one of
the entities accounted for using the equity method as of
1 July 2008.
RLB NÖ-Wien AG holds a direct stake of 24 per cent in
Raiffeisenbank a.s. It has an indirect stake of 16.23 per
cent in Raiffeisen Bank Zrt., held through Raiffeisen-RBHU Holding GmbH, a direct stake of 12.28 per cent in Tatra banka a.s. and a direct stake of 0.61 per cent in
R-International. RLB NÖ-Wien AG has a significant
influence over each of these entities within the meaning of
IAS 28. The transition from the prior measurement of
these investments as available for sale to their inclusion
using the equity method gave rise to the recognition of
negative goodwill of €123.0 million as a one-off effect in
the Income Statement.

PAGE 9
RESULTS FROM OPERATIONS IN 2008
In the 2008 financial year, and against the backdrop of turmoil in the money and capital markets, the
RAIFFEISENLANDESBANK NIEDERÖSTERREICH-WIEN Group (RLB NÖ-Wien Group) registered a very respectable
operating profit. However, because of revaluation losses and a drop in its earnings from the RZB Group compared with
2007, consolidated profit was, in the final analysis, disappointing:
• Assets of €27.5 billion reflected the Group’s rapid
growth, increasing by 40.8 per cent or €8.0 billion from
a figure of €19.5 billion at year-end 2007.
• To strengthen the Group’s own funds and ensure
further business growth, the capital increase of
€266.3 million already approved by the AGM in April
2008 was carried out in December 2008. In addition,
the Group issued non-voting non-ownership stock
(Partizipationskapital) in the amount of €76.5 million
which has been recognized as subordinated debt
capital (see Note 29).
• It proved possible to keep RLB NÖ-Wien’s profit from
operating activities at a high level of €213.4 million.
Operating income fell by 26.8 per cent, while general
administrative expenses increased by 3.6 per cent.
• The key items of income from the Bank’s core
operations developed well. For instance, net interest
income came to €149.9 million, which was €6.1 million
or 4.2 per cent more than in 2007.
• Net fee and commission income was €11.5 million or
16.3 per cent down on the previous year to
€59.0 million. This was due to turbulence in the
securities markets and a sharp drop in the turnover of
securities. Net trading income also fell, dropping by
€17.2 million to negative €3.3 million.
• A large part of the decline in profit from operating
activities was attributable to net income from
investments accounted for using the equity method,
which reflected the RZB Group’s performance. It fell
by €81.0 million to €162.7 million.
• General administrative expenses increased by
€5.6 million or 3.6 per cent to €163.5 million. This
compared with €157.9 million in 2007.
• Consolidated profit for the year after tax and
minorities came to €29.1 million, compared with
€303.6 million in 2007. Most of the fall of
€274.5 million was due to the decline in net income
from investments accounted for using the equity
method and net income from financial investments.
• It proved possible to keep the Bank’s Tier 1 ratio very
high, at 9.10 per cent (see Note 50: Regulatory own funds).

PAGE 10
PROFIT FROM OPERATIONS IN 2008 COMPARED WITH 2007
€’000 2008 2007
Net interest income 149,872 143,817 Net fee and commission income 59,049 70,544
Net trading income (3,274) 13,940
Net income from investments accounted for using the equity method 162,676 243,669
Other operating profit 8,590 42,993
Operating income 376,913 514,963
Staff costs (87,545) (85,100)Other administrative expenses (73,109) (69,789)
Depreciation/amortization/write-offs (2,892) (3,015)
General administrative expenses (163,546) (157,904)
Profit from operating activities 213,367 357,059
Despite a difficult market situation and the rise in funding
costs, net interest income increased by €6.1 million or
4.2 per cent to €149.9 million in 2008. Customer business
in particular made a big contribution to this good result
thanks to strong growth in the portfolio of loans in core
segments and widening interest margins in the Corporate Customers segment. Despite higher volatilities, un-
certainty in the markets and some big increases in the cost
of money, net structural income (profit from maturity
transformation) also made a sizeable contribution to net
interest income.
Our development in 2008 was shaped by continued brisk
demand for credit among corporate and retail customers
and by strong growth in our deposit operations, which are
important to our liquidity position. In particular, there was
further growth in savings deposit balances, which
increased by 32.6 per cent. A risk-focused lending policy
and steady growth in our lending to corporate customers
increased our earnings from credit operations. The
healthy development of volumes made up for the
compression of margins on the deposits side of the
equation.
Net fee and commission income came to €59.0 million,
which was 16.3 per cent or €11.5 million down on the
previous year’s figure of €70.5 million. Most of the decline
was due to a sharp drop in our earnings from securities
operations caused by the generally poorer state of the
economy. The increase in fee and commission income
from payment services generated by a broadened
customer base and the intensification of our customer
relationships with existing customers failed to make up for
the drop in earnings from securities operations.
Net trading income was sharply down on the previous
year’s figure of €13.9 million to negative €3.3 million.
Extremely turbulent markets and higher volatilities made
interest rate trading substantially more difficult than in prior
years. In addition, net trading income was dented by
unusually large fluctuations in foreign exchange rates.
Net income from investments accounted for using the
equity method, which reflects the performance of the RZB Group, fell by €81.0 million from €243.7 million in 2007 to
€162.7 million in the year under review. This figure
contains our interest in the profits of the RZB Group,
NOTES ON THE GROUP’S ASSETS AND FINANCIAL POSITION AND THE RESULTS OF ITS OPERATIONS
PAGE 11
R-International and the Raiffeisen banking subsidiaries in
Hungary, the Czech Republic and Slovakia, and a one-off
effect of negative goodwill recognized in the amount of
€123.0 million arising from the transition from the former
classification of investments as available-for-sale assets to
accounting for them using the equity method.
Other operating profit came to €8.6 million, or €34.4
million less than in 2007. The principal reason for the
decrease was a fall in net revaluation gains and losses on
derivative financial instruments neither held for trading nor
designated as hedging instruments within the meaning of
IAS 39.
General administrative expenses increased by €5.6
million or 3.6 per cent to €163.5 million. General
administrative expenses comprised staff costs of
€87.5 million, other administrative expenses of €73.1
million and depreciation/amortization/write-offs of property
and equipment and intangible assets totalling €2.9 million.
During 2008, considerable effort was made to improve
processes and to brake the rise in costs with the help of a
bank-wide cost optimization and efficiency programme.
As a result, we were able to keep the rise in staff costs
during 2008 well below the average increase in prior years,
limiting it to €2.4 million or 2.9 per cent. Other
administrative expenses grew by €3.3 million or 4.8 per
cent. The principal reasons for the increase were IT outlay
on strategic projects and the rental costs associated with
renting new premises.
Active cost management kept the rise in other costs in
check.
Depreciation/amortization/write-offs of property and
equipment and intangible assets fell by 4.1 per cent
or €0.1 million to €2.9 million.
The RLB NÖ-Wien Group’s profit from operating activities
came to a very respectable €213.4 million. The year-on-
year fall of 40.2 per cent was due to a drop in operating
income, which declined by 26.8 per cent, in conjunction
with an increase, albeit a small one, of 3.6 per cent in
general administrative expenses.

PAGE 12
CONSOLIDATED PROFIT IN 2008 COMPARED WITH 2007
€’000 2008 2007
Operating profit 213,367 357,059
Charge for impairment losses on loans and advances (45,623) (27,357)
Net income from financial investments (165,070) (25,960)
Profit before tax 2,674 303,742
Income tax 26,480 (184)
Profit after tax 29,154 303,558
Minority interests in profit (23) (7)
CONSOLIDATED PROFIT 29,131 303,551
The charge for Impairment losses on loans and
advances included new allowances of €80.2 million,
compared with €62.9 million in 2007, and reversals of
€43.1 million, compared with €34.6 million in 2007. This
line item also includes direct write-offs of receivables in the
amount of €1.4 million, as against €0.8 million in 2007.
Recoveries of receivables previously written off came to
€2.3 million in 2008, compared with €1.1 million in the
previous year. The corporate customers segment
accounted for a large part of the increase in the need for
allowances for impairment losses on loans and advances.
Charges for impairment losses on outstanding bank
exposures in Iceland totalled €14.1 million in 2008.
We refer the reader to the notes on the RLB NÖ-Wien
Group’s overall financial risks and its risk management
goals and methodologies contained in the detailed Risk
Report provided in the Notes (Note 31).
Revaluation losses on securities designated as at fair
value through profit or loss were the principal reason for
the Group’s loss from financial investments of
€165.1 million. This loss was €139.1 million bigger than in
2008. The international financial crisis led to sizeable
corrections to the valuations of these financial instruments.
The revaluation loss of €170.3 million therein was largely
accounted for by fixed-interest securities. If there are no
default losses, we can assume that these revaluation
losses will reverse through profit or loss by the time the
securities mature. The collapse of investment bank
Lehman Brothers compelled the RLB NÖ-Wien Group to
make a total of €18.6 million of provisions and allowances
for impairment losses on securities. The charge for
impairment losses on securities arising from direct and
indirect bank exposures in Iceland totalled €15.9 million.
In 2008, the RLB NÖ-Wien’s Group tax income came to
€26.5 million (2007: tax expense of €0.2 million). Current
tax income consisted mainly of the portion of
Körperschaftsteuer (Austrian corporation tax) receivable by
RLB NÖ-Wien pursuant to its Steuerumlagenvereinbarung
(tax contribution agreement) with Raiffeisen-Holding NÖ-Wien, which is the parent of the steuerliche Unternehmensgruppe (taxable enterprises group).
Consolidated profit for the year after tax and minorities
came to €29.1 million, compared with €303.6 million in
2007. The decrease of €274.5 million was attributable to
the fall in net income from investments accounted for
using the equity method and the loss on financial
investments.

PAGE 13
SEGMENT REPORT FOR 2008
The RLB NÖ-Wien Group is divided into the segments
listed below. Our segment definitions focus on the
customers being serviced. (Primary segment reporting in
accordance with IAS 14 is based on the RLB NÖ-Wien
Group’s internal management reporting system.)
Personal and Business Banking Customers
(Retail Banking)
Corporate Customers
Financial Markets
Investments
Management Services
The Personal and Business Banking Customers (Retail
Banking) segment encompasses retail business carried
on through the Group’s branches in Vienna. It therefore
covers the banking needs of personal banking customers
in Vienna, including in particular their need for advisory
services in the loan and investment fields. The Group’s
private banking teams provide professional advice to high
net worth private banking customers in Vienna. Its centres
of excellence for trade and business customers service
small and medium-sized enterprises. Consulting offices
are also open for customers outside normal banking
hours. Thanks to our strategy of expansion in Vienna, this
customer segment had a very good year. Substantial
growth in business volumes — including above all growth
in savings deposit balances, which increased by 32.6 per
cent or €579.0 million, and a net increase of 18,230 in the
customer base in Vienna — partly offset the narrowing of
margins on deposits and the drop in fees and
commission. Profit before tax in this segment came to
€19.2 million, compared with €20.5 million in 2007. The
result was a return on equity before tax of 18.3 per cent
(2007: 19.5 per cent). The segment’s cost:income ratio
increased from 70.7 per cent in 2007 to 73.7 per cent in
the year under review.
The Corporate Customers segment registered a good
profit in 2008. The keys to this customer segment’s
success were specially tailored products and solutions
and close attention to the needs of corporate customers in
the Centrope region. The Group continued to pursue a
systematic business acquisition strategy during the year
under review. At the same time, it deepened its
relationships with existing customers. Its profit-orientated
business policies led to a strong increase in business
volumes and another advance in net interest income. Net
interest income after impairment losses on loans and
advances held steady compared with 2007. However,
turmoil in the securities markets caused a loss on financial
investments. Consequently, the RLB NÖ-Wien Group’s
corporate customers segment turned profit before tax of
€29.7 million, compared with €54.5 million in 2007. With
average equity employed of €548.0 million, it thus
delivered a return on equity of 5.4 per cent. Its
cost:income ratio improved to 29.3 per cent from 30.1 per
cent in 2007.
The Financial Markets segment was particularly hard hit
by the massive distortions in the international money and
capital markets. Asset Liability Management
systematically carried out the risk and profit-optimized
management of the Group’s maturity transformation
activities, making an important contribution to net interest
income. Net trading income was unsatisfactory, at
negative €13.4 million. The loss on interest rate trading
was particularly severe, and foreign exchange trading also
failed to profit from the big fluctuations in the market. This
segment’s profit was dented mainly by massive revaluation
losses on securities designated as at fair value through
profit or loss. However, if there are no further default

PAGE 14
losses, we can generally assume that these losses will be
reversed again through profit or loss by the time the
securities mature. Overall, profit before tax in this segment
came to a very unsatisfactory negative €108.9 million.
Above all, its results were severely affected by turmoil in
the financial markets in the second half.
The Investments segment accounted for the biggest slice
of consolidated profit for the year before tax, namely
€109.8 million. The RZB Group’s profits slumped
dramatically in 2008, so it effectively failed to contribute to
the RLB NÖ-Wien Group’s earnings. The first-time
inclusion of the direct stakes held in R-International and
the Raiffeisen Network Banks in Hungary, the Czech
Republic and Slovakia had a one-off effect of €123.0
million.
The Management Services segment encompasses all the
activities of the RLB NÖ-Wien Group within the scope of its
role within the Austrian Raiffeisen organization — where it
acts as the central institution serving the Raiffeisen Banks in Lower Austria — as well as income and expenses
arising from the work it does to support activities in the
market in the other customer segments. In 2008, this
segment recorded a loss of €47.2 million, compared with a
loss of €12.5 million in 2007. This was predominantly the
result of write-downs that were necessary in connection
with a money market fund acquired by RLB NÖ-Wien from
the Lower Austrian Raiffeisen Banks.

PAGE 15
BALANCE SHEET PERFORMANCE IN 2008
The RLB NÖ-Wien Group’s assets grew by €7,984.1 million
or 40.8 per cent to €27,533.4 million during the year under
review, reflecting the outstanding growth of business
volumes in 2008.
The principal contributors to growth on the assets side of
the Balance Sheet were Loans and advances to customers
and Loans and advances to other banks. Growth on the
equity and liabilities side of the Balance Sheet was driven
by an increase in Deposits from other banks, including in
particular RZB and the Lower Austrian Raiffeisen Banks,
and by growth in Deposits from customers.
Assets
Loans and advances to other banks grew by €3,867.3
million or 73.0 per cent to €9,162.4 million during 2008.
The lion’s share of the increase — €2,583.6 million — was
accounted for by banks in the Raiffeisen organization.
Loans and advances to customers increased by
€1,631.2 million or 23.7 per cent to €8,514.3 million. This
was the commercially most important line item on the
assets side of the Balance Sheet, accounting for about
30.9 per cent of total assets. Loans and advances to
corporate and retail banking customers increased
significantly, whereas lending to the public sector was
virtually static on the year. Although this meant that
lending to customers was expanding, qualitative growth
was always the main priority. The Group remained true to
its conservative risk policy and continued to actively
manage the existing loan portfolio.
Other current financial assets increased by €216.8 million
or 10.9 per cent to €2,213.1 million. Trading assets also
grew, increasing by €1,084.0 million or 94.0 per cent on
the previous year to €2,236.8 million. Derivatives
operations contributed most to this increase.
Investments accounted for using the equity method grew
as well, increasing by €168.2 million to €1,944.5 million.
This was primarily attributable to the first-time inclusion of
RLB NÖ-Wien’s direct stakes in R-International and the
Raiffeisen Network Banks in Hungary, the Czech Republic
and Slovakia as investments accounted for using the
equity method. RLB NÖ-Wien remained RZB’s biggest
single shareholder, with a 31.4 per cent stake.

PAGE 16
Liabilities
Deposits from other banks grew by €3,899.1 million or
52.3 per cent to €11,358.9 million. Deposits from
Raiffeisen Banks in Lower Austria and RZB accounted for
€5,232.0 million or roughly 46.1 per cent of total deposits
from other banks. The structure of the RLB NÖ-Wien
Group’s equity and liabilities is a reflection of RLB NÖ-Wien AG’s role as the central institution of the Raiffeisen Banking Group in Lower Austria and Vienna. The
Raiffeisen Banks in Lower Austria hold their statutory
liquidity reserves at RLB NÖ-Wien. RLB NÖ-Wien does not
itself carry on retail banking business in Lower Austria.
Deposits from customers grew by €940.8 million or 17.0
per cent to €6,462.1 million. Savings deposit balances
accounted for €2,357.0 million of the total at year-end.
This translates into a very satisfactory increase of 32.6 per
cent. Sight deposit balances totalled €2,208.3 million, and
time deposit balances came to €1,896.8 million.
Liabilities evidenced by paper came to €3,852.6 million,
which was 40.4 per cent or €1,108.3 million more than at
the end of the previous year.
Primary funds — comprising deposits from customers and
all liabilities evidenced by paper — totalled €10,314.7
million to account for roughly 37.5 per cent of the RLB NÖ-
Wien Group’s balance sheet total.
Trading liabilities increased by €1,520.9 million to
€2,187.4 million. Financial instruments held for trading
accounted for the larger part of this increase.
Equity
Thanks to a capital increase, equity on the Balance Sheet
of the RLB NÖ-Wien Group increased by a total of
€266.3 million. Because of the Group’s interest in
changes in the equity of entities accounted for using the
equity method in the amount of negative €186.4 million,
which was not recognized in the Income Statement, and
other changes in equity in the amount of negative
€56.8 million, equity on the Balance Sheet before minority
interests came to €1,920.0 million at the end of 2008.
PAGE 17
FINANCIAL PERFORMANCE INDICATORS
PERFORMANCE
We were only able to keep some of the performance
indicators that are in widespread international use at a
genuinely satisfactory level:
The Group’s cost:income ratio — operating expenses
expressed as a percentage of operating income — came
to 43.4 per cent, failing to match the figure of 30.7 per cent
registered in 2007. However, it was still respectable by
international standards.
The Group’s return on equity after tax — its return on
equity based on average consolidated equity — was
disappointing in 2008, at 1.5 per cent. The RLB NÖ-Wien
Group had still recorded a return on equity after tax of 17.1
per cent in 2007.
REGULATORY OWN FUNDS
At 31 December 2008, the RLB NÖ-Wien Group had total
eligible own funds of €1,568.0 million. This compared with
a regulatory own funds requirement of €1,046.8 million,
giving the Group surplus own funds of €521.2 million, or
49.8 per cent of the required minimum, on its balance
sheet date in 2008.
The Group was able to sustain both its Tier 1 ratio within
the meaning of Basel II and its own funds ratio at very high
levels, namely 9.10 per cent (regulatory minimum: 4.0 per
cent) and 11.98 per cent (regulatory minimum: 8.0 per
cent), respectively. (See Note 50, Regulatory own funds.)

PAGE 18
To date, there have been no business transactions or other occurrences that could be of particular public interest or that
could materially affect the Annual Financial Statements for 2009.
BRANCHES AND OFFICES
At year-end 2008, some 600 customer advisors and sales assistants were servicing RLB NÖ-Wien’s customers at 68
branches in Vienna. These comprised 47 retail banking branches, seven private banking units for high net worth personal
banking customers and six special centres of excellence for trade and business customers.
Eight consulting offices are available to our customers. They are also open outside normal banking hours, so consultations
take place when it suits the customer. Moreover, a customer can choose where a consultation session should take place,
for instance at a consulting office or at his or her home. This modern, pioneering approach reflects both RLB NÖ-Wien’s
service-orientated advisory concept and its local roots.
The Group has neither offices nor branches abroad.
RESEARCH AND DEVELOPMENT
Because of the industry in which it operates, the Bank does not perform any relevant research or development activities.
MATERIAL EVENTS AFTER THE BALANCE SHEET DATE
PAGE 19
HUMAN RESOURCES
Continuity is central to RLB NÖ-Wien’s personnel
development activities. As a bank with a strong advisory
focus, it continued to enlarge its workforce in every
customer segment during 2008. It processed over 4,900
job applications, carried out 1,100 individual job interviews
and held 45 assessment centre modules with over 200
participants. 202 new staff joined RLB NÖ-Wien during
2008.
When recruiting staff, RLB NÖ-Wien attaches particular
importance to cooperating with secondary schools,
universities and vocational colleges. Lectures by
management personnel and RLB NÖ-Wien’s presence at
professional fairs help it meet its sizeable staffing
requirements. The Karrieretalk sessions were a great
success during 2008, bringing the organization into
contact with 200 school pupils. During these sessions,
professional experts at RLB NÖ-Wien gave young career
starters career advice in cooperation with the Fonds der Wiener Kaufmannschaft. From their first day at work, staff
members’ development is promoted and encouraged by
an intensive training programme made up of on-the-job
training and seminars.
As in 2007, staff did a large number of training days during
2008, namely about 9,990. Further training for a new
generation of team leaders and senior customer service
staff was provided in the form of head-of-department
training, the Group’s pool programme for young
management personnel, Mehr[WERT] “value added”
training in the corporate customers segment, mentor
training and our trainee programme for young college and
university graduates. RLB NÖ-Wien’s personnel
management activities are particularly focused on staff
satisfaction. This was reflected by a raft of activities during
the year under review. They included an induction scheme
for new staff members consisting of a Welcome Day and
being greeted personally by the Managing Board on the
day of one’s induction.
The health and well-being of employees at the workplace
are also important to RLB NÖ-Wien. 415 employees took
advantage of our health checks, which made a big
contribution to the health and well-being of the workforce.
Staff members attended a series of expert lectures on a
variety of health and fitness themes within the scope of the
Group’s Wellness Programme. To encourage staff to be
physically fit, they are offered a broad range of sporting
opportunities by Turn- und Sportunion Raiffeisen NÖ-Wien,
and these have proven very popular. As in prior years, the
Wellness Programme was rounded off by a company hike.
We continued to attach great importance to cultivating a
feedback culture during 2008, giving us a particularly
valuable instrument for promoting internal structured
communication. During our 360° Feedback process, the
members of third tier management faced extensive
analysis by their superiors and colleagues and those
working with them.
NON-FINANCIAL PERFORMANCE INDICATORS

PAGE 20
THE ENVIRONMENT AND CLIMATE PROTECTION
An RKI Manual for Enterprises and Staff was drawn up
within the scope of the Raiffeisen Climate Protection
Initiative (RKI) set up by the Austrian Raiffeisenverband.
The measures it contains have been in the implementation
stage since the end of 2008. One of the measures being
implemented by RLB NÖ-Wien is the distribution of regular
information to every member of staff using weekly pop-ups
on their PCs from 2009. These pop-ups will contain
valuable tips about ways to save energy in the office and
in one’s free time.
One special measure that goes beyond this is RLB NÖ-
Wien’s payment of a so-called “green subsidy” to
encourage staff to use public transport. It takes the form
of a contribution towards the cost of an annual season
ticket for Vienna’s public transport system. In cooperation
with city of Vienna, RLB NÖ-Wien also offers the city’s
population the use of bicycles free of charge as a form of
public transport that is both novel and environmentally
friendly.
RLB NÖ-Wien’s commitment to protecting the environment
also finds expression in its business activities, with the
financing of environmental investments in Austria and
abroad becoming ever more important. This is particularly
evident in the renewable energy field, which encompasses
wind power, biomass and biogas technologies.
In addition, RLB NÖ-Wien held Lower Austria’s second
Energy Saving Day and Vienna’s first in 2008, offering
visitors extensive information about building materials,
construction ecology, subsidies, financing models, heating
and building regulations in collaboration with the Province
of Lower Austria, the City of Vienna and experts from the
Raiffeisen Banks. Over 3,500 advice sessions took place
during the events, which were held on 28 February 2008.
This successful project will continue in 2009.
RLB NÖ-Wien also acts as a partner in the energy
contracting field. This is a commercially compelling model
for optimizing a building’s energy consumption and energy
(cost) efficiency. Measures taken to boost energy
efficiency also benefit the environment as energy
contracting reduces energy consumption without affecting
comfort. The measurable benefit for the environment is a
significant CO2 saving.
PAGE 21
CORPORATE SOCIAL RESPONSIBILITY
RLB NÖ-Wien’s employees demonstrated their personal
sense of social responsibility in 2008 by cooking for the
clients of the Gruft — a facility for the homeless — within
the scope of the sponsorship of the Gruft by Raiffeisen
and the Kurier newspaper as part of the “Cardinal König”
scheme. Since the beginning of this partnership in 2006,
they have paid for and cooked over 80 evening meals at
this charitable facility, feeding an average of about 120
men and women. A Christmas present collection for
people staying in Caritas facilities was also met with a
warm response.
This charitable work by members of the Group’s staff
mirrored the corporate social responsibility that is lived out
by RLB NÖ-Wien, which did much in 2008 to improve the
quality of life in the regions where its customers live.
Above and beyond its commercial activities, RLB NÖ-Wien
sponsors a range of cultural activities, including, for
instance, the Wiener Festwochen festival, the Designforum
and the Neue Oper Wien opera company, and within the
scope of cooperation with Niederösterreich-Kultur (NÖKU)
in Lower Austria, it also supports the Donaufestival, the
Festspielhaus St. Pölten festival theatre and the
Kunstmeile Krems.
In addition, RLB NÖ-Wien created very local focuses in
individual corners of Vienna under the motto Nachbar schafft Hilfe (a helpful neighbour), both sponsoring and
promoting various social and cultural initiatives. The
attractiveness of one’s neighbourhood also depends
greatly on the leisure opportunities that it offers.
Sponsoring sporting events, including above all running
events like the Business Run, the Frauenlauf (women’s
run) and the Friedenslauf (peace run), was another
important aspect of RLB NÖ-Wien’s activities. The
Group’s commitment to sport is rounded off by its
promotion of young athletes through its sponsorship of the
Austria Juniors (who train young footballers).
Ensuring people’s safety and security is becoming
increasingly important, so there too, RLB NÖ-Wien AG is
playing an active role working together with the police.
Among other things, it sponsors the Sicherheitsverdienst-preis (security prize of honour) for Vienna and Lower
Austria, which is awarded to both law enforcement officers
and civilians.

PAGE 22
The global economy is suffering from a widespread
decline in economic activity in early 2009 that is affecting
many areas of the world. Overall, global economic growth
appears to have slowed significantly in 2009. According to
interim forecasts published by the European Union in mid-
January, it appears to have been running at 0.5 per cent,
compared with roughly 3 per cent in 2008.
Every country in the eurozone will be affected by this
slowdown. EU experts see the real rate of GDP growth
across the European Union falling drastically from about
1 per cent in 2008 to slightly under negative 0.8 per cent in
2009. These numbers reflect the impact of present
problems in the money and capital markets and the real
economy. They have caused a sharp decline in world
trade and industrial production — especially in the export
sector — as well as corrections to property prices in some
countries.
The major industrial nations are doing their utmost to ward
off the impending economic collapse with the help of
extensive economic programmes and investments. In
coordination with these measures, central banks have
done everything they can to stabilize the financial markets
in order to keep the financial sector running; to restore the
necessary confidence; and, by making money relatively
cheap, to prevent another dramatic economic downturn.
Public sector investment should be able to make up for
part of the fall in private and foreign demand. However, it
will only become apparent in the next few quarters whether
all the measures that have been taken will suffice to keep
the recession short.
Austria’s economy will not escape the effects of
international developments during 2009, although thanks
to its slightly more favourable starting position, those
effects are likely to be slightly less severe. On the other
hand, a number of Austria’s trading partners, including in
particular Germany and the high-growth Central European
EU Member States in the Centrope region — Slovakia, the
Czech Republic and Hungary — will be economically
challenged in 2009.
Austria’s new federal government, sworn in on
2 December 2008, has begun its tenure with energy. From
the outset, measures to combat the financial crisis have
been at the centre of its decisions. It has enacted
economic stimulus packages for 2009 and 2010 of about
€1 billion each as well as voting a total of another €1.9
billion for, among other things, investment incentives. In
addition, it decided to carry out a tax reform in 2009 to
reduce the strain on incomes.
The RLB NÖ-Wien Group will stay in its successful path,
serving its customers as the Best Advisor Bank. Its
principal focus will continue to be on satisfying the
financial and investment needs of its personal and
business banking customers in Vienna and the corporate
customers it services in Vienna and the Centrope region.
Cooperating closely with the Raiffeisen Banks in Lower
Austria and Raiffeisen Holding NÖ-Wien and playing an
active role within the Raiffeisen organization as RZB’s
biggest equity holder remain RLB NÖ-Wien’s highest
priorities. RLB NÖ-Wien will not be taking advantage of
the government rescue package. Based on its funding
plan, RLB NÖ-Wien can look forward to having a
satisfactory liquidity position without it.
RLB NÖ-Wien’s cost optimization and efficiency
enhancement programme will continue in 2009. In
particular, processes will be improved and streamlined. In
line with our medium-term plans, we anticipate another
increase in business volumes. It will be driven by both
corporate and retail banking operations. RLB NÖ-Wien will
serve the economy as an active partner, supporting the
implementation of regional economic programmes and,
therefore, living up to its core responsibilities and applying
its skills as a regional bank.
OUTLOOK FOR 2009

PAGE 23
Despite higher allowances for impairments losses, every
segment within the RLB NÖ-Wien Group should register an
increase in profits. We will adapt our key initiatives in the
marketplace — Centrope and Wien erobern — and our
Treasury and equity investment activities to the changed
market conditions and continue them resolutely. The RLB
NÖ-Wien Group should thus achieve further sustainable
growth in 2009, continuing its steady and positive
business development. However — and not least
because of the results that the RZB Group is likely to
record — profit will not be at the same level as in 2006 and
2007.
As of the end of April 2009, Robert Gruber resigned as
Deputy Chairman of the Managing Board of RLB NÖ-Wien.
The Supervisory Board of RLB NÖ-Wien accepted his
resignation during its meeting on 11 March 2009.
Reinhard Karl was elected to the Managing Board of RLB
NÖ-Wien as of 1 May 2009.
Vienna
23 March 2009
The Managing Board
CEO
Erwin HAMESEDER
Deputy CEO
Robert GRUBER
Member
Georg KRAFT-KINZ
Member
Gerhard REHOR
Member
Michael RAB

PAGE 24

PAGE 25
A. INCOME STATEMENT
NOTE 2008 2007
Consolidated profit, €’000 (11) 29,131 303,551 Number of ordinary shares in issue 2,000,789 1,991,973
Undiluted earnings per share, € 14.56 152.39
There were no conversion or option rights in issue. Consequently, earnings per share were undiluted.
1 Pursuant to the opinion on Fragen der IFRS-Bilanzierung und –Berichterstattung im Zusammenhang mit der Einführung der Gruppenbesteuerung (issues relating to IFRS-compliant accounting and reporting in connection with the introduction of group taxation) published by AFRAC (the Austrian Financial Reporting and Auditing Committee), deferred taxes should be measured applying the current corporation tax rate of 25 per cent. The RLB NÖ-Wien Group implemented the contents of this opinion ahead of time as of 1 January 2008.
Since 1 January 2008, the charge for impairment losses on loans and advances has included a collective assessment of impairments of portfolios. Prior-year figures were restated accordingly.
CONSOLIDATED FINANCIAL STATEMENTS PREPARED IN ACCORDANCE WITH IFRSs
€’000 NOTE 2008 2007 1
Interest income (1) 990,876 704,638 Interest expenses (1) (841,004) (560,821)
Net interest income (1) 149,872 143,817
Charge for impairment losses on loans and advances (2) (45,623) (27,357)
Net interest income after impairment losses on loans and advances 104,249 116,460
Fee and commission income (3) 85,108 102,969 Fee and commission expenses (3) (26,059) (32,425)
Net fee and commission income (3) 59,049 70,544
Net trading income (4) (3,274) 13,940
Net income from investments in entities accounted for using the equity method (5) 162,676 243,669
Net income from financial investments (6) (165,070) (25,960)
General administrative expenses (7) (163,546) (157,904)
Other operating profit (8) 8,590 42,993
Profit before tax 2,674 303,742
Income tax (10) 26,480 (184)
Profit after tax 29,154 303,558
Minority interests in profit (23) (7)
CONSOLIDATED PROFIT 29,131 303,551

PAGE 26
B. BALANCE SHEET
ASSETS, €’000 NOTE(S) 2008 2007 1
Cash and balances with the central bank (13) 45,423 47,146 Loans and advances to other banks (14, 34, 35) 9,162,397 5,295,082
Loans and advances to customers (15, 34, 35) 8,514,312 6,883,089
Impairment allowance balance (16, 35) (241,679) (243,712)
Trading assets (17, 34, 35) 2,236,810 1,152,770
Other current financial assets (18, 34, 35) 2,213,147 1,996,264
Financial investments (19, 34, 35) 2,787,195 2,073,650
Investments in entities accounted for using the equity method (34) 1,944,460 1,776,250
Intangible assets (20) 5,958 3,775
Property and equipment (21) 10,270 9,749
Other assets (22, 35) 855,099 555,239
Total assets 27,533,392 19,549,302
EQUITY AND LIABILITIES, €’000 NOTE(S) 2008 2007 2
Deposits from other banks (23, 34, 35) 11,358,887 7,459,808
Deposits from customers (24, 34, 35) 6,462,072 5,521,283
Liabilities evidenced by paper (25, 34) 3,852,601 2,744,260
Trading liabilities (26, 34, 35) 2,187,402 666,486
Other liabilities (27, 35) 939,128 604,091
Provisions (28, 35) 66,196 66,502
Subordinated debt capital (29, 34) 747,108 590,022
Equity (30) 1,919,998 1,896,850
Attributable to equity holders of the parent 1,919,918 1,896,787
Minority interests 80 63
Total equity and liabilities 27,533,392 19,549,302
1 Since 1 January 2008, the impairment allowance balance has included a collective assessment of impairments of portfolios. Prior-year figures were restated accordingly.
2 Pursuant to the opinion on Fragen der IFRS-Bilanzierung und –Berichterstattung im Zusammenhang mit der Einführung der Gruppenbesteuerung (issues relating to IFRS-compliant accounting and reporting in connection with the introduction of group taxation) published by AFRAC (the Austrian Financial Reporting and Auditing Committee), deferred taxes should be measured applying the current corporation tax rate of 25 per cent. The RLB NÖ-Wien Group implemented the contents of this opinion ahead of time as of 1 January 2008. Prior-year figures were restated accordingly.

PAGE 27
C. STATEMENT OF CHANGES IN EQUITY
€’000 SUBSCRIBED
CAPITAL CAPITAL
RESERVES RETAINEDEARNINGS
CONSOLIDATEDPROFIT MINORITIES TOTAL
Equity at 1 January 2008 199,197 181,701 1,515,889 0 63 1,896,850
Capital contributions 15,323 250,987 266,310 Consolidated profit for the period 29,131 23 29,154
Contractual profit transfer (45,300) (45,300)
Use of retained earnings (16,169) 16,169 0
Distributions (3) (3)
Cash flow hedge reserve (34,846) (34,846)
Available-for-sale reserve (18,646) (3) (18,649)
Enterprise’s interest in changes in the equity of the entities accounted for using the equity method not recognized in profit or loss (186,383) (186,383)
Deferred taxes 12,865 12,865
Equity at 31 December 2008 214,520 432,688 1,272,710 0 80 1,919,998

PAGE 28
€’000 SUBSCRIBED
CAPITAL CAPITAL
RESERVES RETAINEDEARNINGS
CONSOLIDATED PROFIT MINORITIES TOTAL
Equity at 1 January 2007 199,197 181,701 1,280,165 0 56 1,661,119
Effect of measuring deferred taxes applying a corporation tax rate of 25 per cent 1 (12,224) (12,224)
Adjustment for the collective assessment of impairments of portfolios 2 (4,468) (4,468)
Equity at 1 January 2007, restated 199,197 181,701 1,263,473 0 56 1,644,427
Consolidated profit for the period 303,551 7 303,558 Contractual profit transfer (63,850) (63,850)
Transferred to retained earnings 239,701 (239,701) 0
Distributions (5) (5)
Cash flow hedge reserve (2,299) (2,299)
Available-for-sale reserve (22,217) 1 (22,216)
Enterprise’s interest in changes in the equity of the entities accounted for using the equity method not recognized in profit or loss 30,727 30,727
Deferred taxes 6,509 6,509
Other changes (5) 4 (1)
Equity at 31 December 2007 199,197 181,701 1,515,889 0 63 1,896,850
1 Pursuant to the AFRAC opinion, deferred taxes should be measured applying the current corporation tax rate of 25 per cent. The RLB NÖ-Wien Group implemented the contents of this opinion ahead of time as of 1 January 2008. Prior-year figures were restated accordingly.
2 Since 1 January 2008, the impairment allowance balance has included a collective assessment of impairments of portfolios. Prior-year figures were restated accordingly.

PAGE 29
The share capital of RAIFFEISENLANDES-BANK NIEDERÖSTERREICH-WIEN AG (RLB NÖ-Wien) was €199,197,300.00
(year-end 2007: €199,197,300.00). Its subscribed capital comprised 2,145,201 (year-end 2007: 1,991,973) no-par bearer
shares (Stückaktien) with a nominal value of €214,520,100.00 (year-end 2007: €199,197,300.00).
The cash flow hedge reserve and the available-for-sale reserve taken to retained earnings, in both cases prior to the
deduction of deferred taxes, and deferred taxes taken directly to equity changed as follows:
€’000 CASH FLOW HEDGE
RESERVE AVAILABLE-FOR-SALE
RESERVE DEFERRED TAXES TAKEN
TO EQUITY
At 1 January 2008 13,016 5,937 (2,360)
Net changes in the financial year (34,846) (18,649) 12,865
of which revaluation gains/(losses) taken directly taken to equity and not recognized in profit or loss (33,122) (14,524)
of which the amount taken out of equity and recognized in profit or loss during the financial year (1,724) (4,125)
At 31 December 2008 (21,830) (12,712) 10,505
€’000 CASH FLOW HEDGE
RESERVE AVAILABLE-FOR-SALE
RESERVE DEFERRED TAXES TAKEN
TO EQUITY 1
Equity at 1 January 2007 15,315 28,153 (3,030)
Effect of measuring deferred taxes applying a corporation tax rate of 25 per cent (5,839)
At 1 January 2007, restated 15,315 28,153 (8,869)
Net changes in the financial year (2,299) (22,216) 6,509
of which revaluation gains/(losses) taken directly taken to equity and not recognized in profit or loss 1,573 (7,251)
of which the amount taken from equity and recognized in profit or loss during the financial year (3,872) (14,965)
Equity at 31 December 2007 13,016 5,937 (2,360)
Amounts charged off against the cash flow hedge reserve through profit or loss were recognized in Net interest income.
1 Pursuant to the opinion on Fragen der IFRS-Bilanzierung und –Berichterstattung im Zusammenhang mit der Einführung der Gruppenbesteuerung (issues relating to IFRS-compliant accounting and reporting in connection with the introduction of group taxation) published by AFRAC (the Austrian Financial Reporting and Auditing Committee), deferred taxes should be measured applying the current corporation tax rate of 25 per cent. The RLB NÖ-Wien Group implemented the contents of this opinion ahead of time as of 1 January 2008. Prior-year figures were restated accordingly.

PAGE 30
D. CASH FLOW STATEMENT
€’000 2008 2007 1
Profit before minorities 29,154 303,558
Non-cash items in profit and transition to net cash from operating activities:
Write-downs/(write-ups) of property and equipment and financial investments 179,296 51,727
Revaluation (gains)/losses on investments in entities accounted for using the equity method (162,676) (243,669)
Net creation of provisions and impairment allowances 61,867 28,914
(Gains)/losses on disposals of property and equipment and financial investments (10,421) (24,807)
Other adjustments (net) (159,854) (162,511)
Subtotal (62,634) (46,788)
Change in assets and liabilities arising from operating activities after corrections for non-cash items:
Loans and advances to customers and other banks (5,499,921) (1,233,357)
Trading assets (1,084,040) (393,607)
Other current financial assets (376,242) (952,311)
Other assets (355,461) (129,376)
Deposits from customers and other banks 4,839,868 2,263,647
Liabilities evidenced by paper 1,108,342 152,743
Trading liabilities 1,520,916 193,353
Other liabilities 363,972 154,147
Interest and dividends received 1,004,163 599,793
Interest paid (790,087) (458,746)
Income taxes paid 56 (607)
Net cash from operating activities 668,932 148,891
1 Pursuant to the opinion on IFRS-compliant accounting in connection with the introduction of group taxation (Gruppenbesteuerung) published by AFRAC, deferred taxes should be measured applying the current corporation tax rate of 25 per cent. The RLB NÖ-Wien Group implemented the contents of this opinion ahead of time as of 1 January 2008. Furthermore, since 1 January 2008, the charge for impairment losses on loans and advances has included a collective assessment of impairments of portfolios. Prior-year figures were restated accordingly.

PAGE 31
€’000 2008 2007
Cash receipts from sales of: Financial investments and equity 2,688,968 133,612
Property and equipment and intangible assets 209 680
Cash paid for:
Financial investments and equity (3,713,576) (288,876)
Property and equipment and intangible assets (5,805) (4,786)
Net cash from/(used in) investing activities (1,030,204) (159,370)
Net cash from capital increases 266,310 0 Net inflows of subordinated debt capital 157,087 38,912
Contractual profit transfer (63,850) (25,000)
Net cash from financing activities 359,547 13,912
€’000 2008 2007
Cash and cash equivalents at end of previous period 47,146 43,745
Net cash from/(used in) operating activities 668,932 148,891
Net cash from/(used in) investing activities (1,030,204) (159,370)
Net cash from financing activities 359,547 13,912
Effect of exchange rate changes 2 (32)
Cash and cash equivalents at end of period 45,423 47,146
Cash and cash equivalents corresponds to Cash and balances with the central bank.

PAGE 32
E. NOTES
The enterprise
RAIFFEISENLANDESBANK NIEDERÖSTERREICH-WIEN
AG (RLB NÖ-Wien) is the regional central institution of
Raiffeisen Bankengruppe NÖ-Wien. It is registered in the
companies register (Firmenbuch) at Vienna trade court
(Handelsgericht Wien) under the number FN 203160 s.
The company’s address is Friedrich-Wilhelm-Raiffeisen-Platz 1, 1020 Vienna.
RAIFFEISEN-HOLDING NIEDERÖSTERREICH-WIEN registrierte Genossenschaft mit beschränkter Haftung (Raiffeisen-Holding NÖ-Wien) is RLB NÖ-Wien’s majority
shareholder with a stake of 78.58 per cent. In accordance
with Austrian disclosure regulations, the consolidated
financial statements of Raiffeisen-Holding NÖ-Wien are
lodged in the companies register and published in the
Raiffeisen newspaper. The remaining shares of RLB
NÖ-Wien are held by the Niederösterreichische Raiffeisenbanken (Lower Austrian Raiffeisen banks). As
their central institution, RLB NÖ-Wien offers them support
in every field of banking.
RLB NÖ-Wien is a regional bank. In its core business
segment, it operates in its regional home market —
eastern Austria — and thus in the Centrope region, where
it provides professional advisory services and optimum
banking products. Thanks to its stake in Raiffeisen Zentralbank Österreich Aktiengesellschaft (RZB), it also
profits from the Raiffeisen Banking Group’s presence in
Central and Eastern Europe.
.
The foundation stones of RLB NÖ-Wien’s banking activities
are personal and business banking (retail banking),
corporate banking and proprietary operations. It provides
retail banking services at its branches and consulting
offices in Vienna under the slogan “Raiffeisen in Wien. Meine BeraterBank” (Raiffeisen in Vienna. My bank
advisor). RLB NÖ-Wien’s core strategic operations are
supplemented by its participation in syndicated loan
projects and its equity investments in banks and other
banking-related investments in Austria, Hungary, the
Czech Republic and Slovakia.

PAGE 33
THE FUNDAMENTALS OF CONSOLIDATED FINANCIAL REPORTING IN COMPLIANCE WITH IFRSs
Principles
The Consolidated Financial Statements for the financial
year 2008 and the prior-year figures for 2007 were
prepared in accordance with EU Directive (EC) 1606/2002,
as issued by the Commission on 11 September 2002, in
conjunction with § 245a UGB (Austrian enterprises code)
and § 59a BWG (Austrian banking act). All the
International Financial Reporting Standards and IFRIC
interpretations whose application in connection with the
Consolidated Financial Statements was mandatory were
taken account of as adopted by the EU.
The basis for the Consolidated Financial Statements was
provided by the separate financial statements of all
consolidated entities, which were prepared applying
uniform, Group-wide standards and in accordance with the
provisions of IFRSs. The effect of the non-consolidated
subsidiaries on the Group’s assets, liabilities, financial
position and profit or loss for the purposes of the
framework in IAS/IFRS F 29 et seq was immaterial.
With the exception of two subsidiaries accounted for as of
and for the periods ended 30 September and 31 October,
respectively, and two companies whose reporting dates
were 28 February or 31 March, for which interim financial
statements were prepared as of and for the period ended
31 December, the consolidated companies and the
entities accounted for using the equity method prepared
their annual financial statements as of and for the period
ended 31 December. Appropriate adjustments were
carried out to allow for the effects of material business
transactions and other events occurring between a
company’s reporting date and 31 December.
Unless specifically stated otherwise, the figures in these
Financial Statements are in full thousands of euros (€’000).
There may be rounding errors in the tables that follow.
Consolidation policies
The consolidation process involves eliminating intragroup
investments and equity, balances, transactions, income
and expenses.
In accordance with IFRS 3 Business Combinations, the
elimination of intragroup investments and equity arising
from combinations took place applying the purchase method of accounting, acquired assets and liabilities
being recognized as at the date of acquisition applying
their fair values on that date. The difference between cost
and the fair value of the acquired net assets was, if
positive, recognized as goodwill.
Pursuant to IFRS 3, par. 55, goodwill is not amortized.
Instead, it is tested for impairment once a year. Following
reassessment, negative goodwill is immediately
recognized in profit or loss in accordance with IFRS 3,
par. 56.
Investments in entities over which the RLB-NÖ-Wien Group
had a significant influence were accounted for using the
equity method and reported on the Balance Sheet in the
line item Investments in entities accounted for using the equity method. The Group’s interests in the annual profits/
(losses) of entities accounted for using the equity method
were reported in Net income from investments in entities accounted for using the equity method. The same rules
were applied to investments in entities accounted for using
the equity method (date of first-time consolidation,
calculation of goodwill or negative goodwill) as to
subsidiaries. The basis for recognition was provided by
the financial statements of the entities accounted for using
the equity method. If an entity accounted for using the

PAGE 34
equity method deviated from Group-wide recognition and
measurement policies in respect of similar transactions
and events, appropriate adjustments were carried out.
Investments in other entities were recognized at fair value,
or if a fair value was not available or could not be
determined reliably, at cost less any impairment losses.
During the elimination of intragroup balances, intragroup
receivables and payables were eliminated.
Intragroup profits were eliminated unless their effect on
line items in the Income Statement was immaterial.
Banking business between the individual companies within
the Group was usually transacted on arm’s length terms.
Expenses and income resulting from transactions between
consolidated entities were eliminated.
Scope of consolidation
The scope of consolidation of the RLB NÖ-Wien Group
included all of the following Group members, in which RLB
NÖ-Wien held direct or indirect interests of more than 50
per cent or over whose operating and/or financial policies
it had a controlling influence.
They were:
• RAIFFEISENLANDESBANK NIEDERÖSTERREICH- WIEN AG (Group parent)
• RLB NÖ-Wien Holding GmbH
• RLB NÖ-Wien Sektorbeteiligungs GmbH
• RLB Ostbankenholding GmbH
• Tatra Holding GmbH
• “ARSIS” Beteiligungs GmbH
• “BARIBAL” Holding GmbH
• “EXEDRA” Holding GmbH
• “FIBULA” Beteiligungs GmbH
• Acceptia Holding GmbH
• VAKS – Veranstaltungskartenservice Ges.m.b.H.
• Raiffeisen Centropa Invest Verwaltungs- und Beteiligungs AG
The number of consolidated entities and entities accounted for using the equity method has changed as follows:
CONSOLIDATED EQUITY METHOD
NUMBER OF ENTITIES 2008 2007 2008 2007
At 1 January 14 14 1 1
First included in the year under review 2 0 5 0 Restructuring carried out during the year under review (5) 0 (1) 0
At 31 December 11 14 5 1
As of 1 January 2008, the Group’s investments in Acceptia Holding GmbH, Vienna, and VAKS – Veranstaltungs-kartenservice Ges.m.b.H., Vienna, were included in the
Consolidated Financial Statements on the grounds of
materiality. During 2008, the number of consolidated
entities was reduced by five (RIBHA Holding GmbH,
“CYGNA” Beteiligungs GmbH, “DEBINA” Holding GmbH,
“GAVIAL” Holding GmbH, „HELIX Beteiligungs GmbH,

PAGE 35
these companies having been merged in the course of
intragroup restructuring).
Twenty subsidiaries (2007: 23 subsidiaries) were not
consolidated because their effect on the Group’s assets,
liabilities, financial position and profit or loss was
immaterial. They were accounted for in the line item
Financial investments at cost less impairments as
Investments in subsidiaries. The assets of excluded
enterprises came to less than 1 per cent of the Group’s
aggregated assets.
Entities over whose operating and/or financial policies the
RLB NÖ-Wien Group had a significant influence were
accounted for using the equity method. In the 2008
financial year, this applied to RZB, Raiffeisen International Bank-Holding AG, Raiffeisenbank a.s. (Czech Republic),
eBanka, a.s. (Czech Republic), Tatra banka a.s. (Slovakia)
and Raiffeisen Bank Zrt. (Hungary).
In addition to a direct interest of 0.58 per cent (year-end
2007: 0.61 per cent), RLB NÖ-Wien AG held an indirect
interest of 30.82 per cent (year-end 2007: 30.76 per cent)
in RZB via RLB NÖ-Wien Holding GmbH.
As of 1 January 2008, the Group’s banks in the Centrope region —Raiffeisenbank a.s. (Czech Republic), eBanka, a.s. (Czech Republic), Tatra banka a.s. (Slovakia) and
Raiffeisen Bank Zrt. (Hungary) — were added to the list of
associates accounted for using the equity method on the
grounds of their material effect on the Consolidated
Financial Statements. Raiffeisen International Bank-Holding AG was likewise added to the list of entities
accounted for using the equity method as of 1 July 2008.
The RLB NÖ-Wien Group held stakes of 24.00 per cent in
Raiffeisenbank a.s. and eBanka, a.s. In the second half of
2008, eBanka a.s. was absorbed by Raiffeisenbank a.s. In
addition, the RLB NÖ-Wien Group held a stake of
16.23 per cent in Raiffeisen Bank Zrt. (via Raiffeisen-RBHU Holding GmbH), of 12.28 per cent in Tatra banka a.s.,
and of 0.61 per cent in Raiffeisen International Bank-Holding AG.
As the result of a strategy, newly adopted in August 2007,
that aims to develop RLB NÖ-Wien into the Centrope region’s foremost regional bank, our Bank greatly
expanded its business relationships with these companies
in the course of 2008. For this reason, the materiality of
these entities, previously accounted for in the line item
Financial investments as available-for-sale financial
assets, was reviewed, as was the Group’s ability to
exercise a significant influence over them.
Because of the growing importance of our business
relationships with Raiffeisenbank a.s. (Czech Republic)
and eBanka, a.s. (Czech Republic), their categorization as
being immaterial to the Consolidated Financial Statements
was revised, and they are now deemed to be material to
the Consolidated Financial Statements. The effect of the
change was recognized in profit or loss in accordance with
IAS 8, par. 36. The presumption that a significant
influence does not exist where less than 20 per cent of the
voting power is held pursuant to IAS 28, par. 6, had not
previously changed in the case of Raiffeisen Bank Zrt. (stake of 16.23 per cent), Tatra banka a.s. (stake of 12.28
per cent) and Raiffeisen International Bank-Holding AG (stake of 0.61 per cent). However, since business
relationships with these companies are also increasing
significantly as a result of the change in the Group’s
strategy in Eastern Europe, it is possible that, all things
considered, RLB NÖ-Wien could be deemed to have a
significant influence over them as of the 2008 financial
year. In accordance with IAS 28, the measurement and
recognition of these banking entities was changed, taking
them out of available-for-sale financial assets within the
line item Financial investments and reclassifying them as
entities accounted for using the equity method.
Thirteen associates (2007: 12 associates) were not
accounted for using the equity method because their

PAGE 36
effect on the Group’s assets, liabilities, financial position
and profit or loss was immaterial. They were recognized in
the line item Financial investments at cost less
impairments. Viewed together and based on current data,
the immaterial associates would have changed the
Group’s consolidated equity and consolidated assets by
less than 1 per cent had they been accounted for using
the equity method.
No financial statements prepared in a foreign currency
required consolidation. A list of consolidated entities,
entities accounted for using the equity method and other
equity investments is provided in the Overview of Equity Investments.

PAGE 37
Financial instruments
A financial instrument is a contract that gives rise to both a
financial asset of one enterprise and a financial liability or
equity instrument of another enterprise. According to
IAS 39, all financial instruments must be recognized on the
Balance Sheet at their fair value at the date of acquisition.
This is usually the transaction price, which corresponds to
the fair value of the consideration given or received.
Financial instruments must be divided into defined
categories. Their subsequent measurement will depend
on the classification carried out.
The following measurement categories result:
At fair value through profit or loss: Financial assets or
liabilities designated as at fair value through profit or loss
are financial instruments either, on initial recognition,
classified by the enterprise as held for trading or
designated as at fair value through profit or loss.
• Financial assets and financial liabilities classified as
financial instruments held for trading serve the purpose
of generating a profit from short-term fluctuations in
price or dealer’s margin. Instruments held for trading
were measured at fair value, revaluation gains and
losses being recognized in profit or loss. Liabilities
held for trading also belong to this measurement
category.
• Upon initial recognition, financial assets, financial
liabilities and groups of financial instruments (financial
assets, financial liabilities or a combination of the two)
were designated as financial instruments at fair value
through profit or loss if more relevant information could
be conveyed that way.
This requirement is met if such a designation eliminates or
substantially reduces mismatches in measurement or
approach (accounting mismatches).
Assignment to this category also took place if financial
assets and/or financial liabilities (including derivatives)
were managed on the basis of a documented risk
management or investment strategy within the scope of
portfolios measured to fair value whose performance was
reported on a regular basis to the Managing Board as a
body. If such derivatives have substantial financial effects,
financial instruments with embedded derivatives can also
be designated as at fair value through profit or loss. If
derivatives embedded in financial instruments could not
be measured separately, the entirety of such a financial
instrument was assigned a priori to this class.
Classification took place as at the date of acquisition of
the financial instrument. This irrevocable designation was
documented by a summary in the portfolio, allowing
separate risk monitoring in each case and, above all,
management action directed at achieving defined profit
goals. Responsibility for individual portfolios was
regulated by clear assignments of responsibilities and the
associated risk was limited by means of monitored lines
and limits.
Financial assets and liabilities designated upon initial
recognition as financial assets at fair value through profit
or loss must subsequently be measured at fair value, with
changes in value being recognized in profit or loss. The
decisive criterion for assignment to this measurement
category was that, at the time of acquisition or upon
designation at the time of the first-time adoption of this
standard, as amended, irrevocable designation to this
class had taken place. Financial investments in equity
instruments that did not have a quoted market price and
whose fair values could not be determined reliably and
derivatives whose values were dependent upon and
required settlement by delivery of such equity instruments
were not measured at fair value through profit or loss.
Such financial instruments were classified as available for
sale and were measured at cost less impairments.
RECOGNITION AND MEASUREMENT POLICIES

PAGE 38
Loans and receivables: Loans and receivables are non-
derivative financial assets with fixed or determinable
payments that are not quoted in an active market and are
not classified as held for trading, at fair value through profit
or loss or available for sale. Such financial instruments
result from the supply of money, goods or services. They
were measured at amortized cost using the effective interest rate method taking account of any impairments.
Held-to-maturity: This category comprises financial assets
with fixed or determinable payments that an entity has the
positive intention and ability to hold to maturity. Such
financial instruments were measured at amortized cost
using the effective interest rate method. Premiums and
discounts were recognized on a proportionate basis.
Write-downs were carried out if there was an impairment of
credit quality. If the reason for a write-down no longer
applies, a write-back will take place up to the amount of
the asset’s amortized cost and will be recognized in the
Income Statement.
Available-for-sale: Available-for-sale financial assets are
non-derivative financial assets that are classified as
available for sale and not as loans or receivables, held-to-
maturity investments or financial assets designated as at
fair value through profit or loss. Such assets were
measured to fair value. Revaluation gains and losses are
recognized in a separate item in equity until the asset is
sold or an impairment occurs. If an increase in fair value is
objectively determinable, impairments of debt instruments
will be reversed and the reversal will be recognized in the
Income Statement; impairments of equity instruments will
also be reversed but the reversal will not be recognized in
the Income Statement.
Equity and debt instruments not meeting the criteria for
classification as held to maturity or as loans and
receivables, that did not have a quoted market price and
whose fair value could not be determined reliably were
classified as available for sale and were carried at cost
less impairments.
Financial liabilities not designated as at fair value through
profit or loss or classified as held for trading were
measured at amortized cost using the effective interest rate method. We refer the reader to the above comments
regarding the recognition of financial liabilities designated
as at fair value through profit or loss or classified as held
for trading.
Reacquired securities issued by the enterprise were
deducted on the equity and liabilities side of the Balance
Sheet.
The fair value is the amount for which an asset could be
exchanged, or a liability settled, between knowledgeable,
willing parties in an arm’s length transaction. The fair
value of listed financial instruments is their market value.
Where no market values were available, future cash flows
from a financial instrument were discounted applying the
pertinent yield curve at the measurement date using the
methods of financial mathematics. If a fair value could not
be determined reliably, measurement took place at cost
less impairments.
Embedded derivatives outside the trading portfolio were
separated from the host contract and accounted for as
separate derivative contracts if the financial instrument
was not measured in its entirety at fair value, if changes in
fair value were not recognized in profit or loss, if the
economic characteristics and risks of the embedded
derivative were not closely related to the economic
characteristics and risks of the host contract and if the
embedded derivative really met the definition of a
derivative contract. The host contract was then
recognized according to its classification. The change in
the value of the separated derivative, measured at fair
value, was recognized in profit or loss. If an embedded
derivative could not be valued either upon acquisition or

PAGE 39
on subsequent reporting dates, the entire structured
product was designated as at fair value through profit or
loss.
According to IAS 32, if an entity reacquires its own equity
instruments (treasury shares), those instruments shall be
taken from equity and not capitalized.
A financial asset or financial liability was recognized on the
Balance Sheet if the Group was a party to the contractual
arrangements for the financial instrument and,
consequently, had a right to receive or a legal obligation to
pay cash. Initial recognition on the Balance Sheet,
measurement in the Income Statement and accounting for
the disposal of a financial instrument took place using
trade date accounting.
Financial assets were derecognized as of the time when
the right to disposal of or the contractual rights under the
asset were lost.
Derivatives
Financial derivatives not designated in a hedge accounting
relationship or accounted for using the fair value option
described above were recognized on the Balance Sheet at
fair value. Changes in value were recognized in profit or
loss.
Because of the different ways in which hedging
relationships between hedged items and derivatives are
accounted for under IAS 39, derivatives acquired for
hedging purposes were divided into the following
categories:
Fair value hedge: In the case of a fair value hedge, an
existing asset or an existing liability is hedged against
possible future changes in fair value attributable to a
particular risk that would affect profit or loss. Using hedge
accounting, the hedging instrument is measured at fair
value, with changes in value being recognized in profit or
loss. The carrying amount of the hedged item is adjusted
through profit or loss by the amount of the revaluation
gains or losses attributable to the hedged risk. These
hedges are formally documented, continually assessed
and expected to be highly effective. In other words,
throughout the term of a hedge, one can assume that
changes in the fair value of a hedged item will be nearly
completely offset by changes in the fair value of the
hedging instrument and that the actual risk offset will lie
within a range of deviation of 80 — 125 per cent.
Cash flow hedge: Cash flow hedges are hedges of the
exposure to variability in cash flows associated with a
recognized asset or liability or a highly probable forecast
transaction that would affect profit or loss. Within the
scope of cash flow hedge accounting, derivatives are used
to hedge against possible future changes in interest
payments. The extent to which derivatives are used to
hedge against the exposure to interest rate risk is decided
within the scope of the asset liability management
process, with future variable interest payments on variable-
yield receivables and debt for the most part being
swapped for fixed-rate payments using interest rate
swaps. Hedging instruments were measured at fair value.
Revaluation gains and losses must be separated into an
effective portion and an ineffective portion. Hedging
relationships are judged to be effective if changes in the
cash flow arising from hedged items are nearly completely
offset by changes in the cash flow arising from the hedges
at the beginning of the transactions and throughout their
term. During the first two years, cash flows are subdivided
into monthly time bands up to the balance sheet date.
From the third to the fifth year, they are subdivided into
quarterly time bands, and from the fifth year into annual
time bands.

PAGE 40
Predictions of hedged interest cash flows were based on the following expectations regarding capital cash flows:
2008 €’000 UP TO 1 YEAR 1 – 3 YEARS 3 – 5 YEARS 5 – 10 YEARS > 10 YEARS
Cash inflows (assets) 1,834,002 2,781,644 2,558,336 1,315,976 1,440,348 Cash outflows (liabilities) (145,000) (279,940) 0 (358,040) (88,480)
Net cash flows 1,689,002 2,501,704 2,558,336 957,936 1,351,868
2007 €’000 UP TO 1 YEAR 1 – 3 YEARS 3 – 5 YEARS 5 – 10 YEARS > 10 YEARS
Cash inflows (assets) 541,420 823,923 294,085 343,060 590,348 Cash outflows (liabilities) (453,670) (489,321) (148,162) (950,183) (375,714)
Net cash flows 87,750 334,602 145,923 (607,123) 214,634
The effective portion of the gain or loss on the hedging
instrument is captured without being recognized in the
Income Statement and taken to equity as a separate line
item (Cash flow hedge reserve).
Gains and losses on these derivatives are set against the
future compensating effects of the hedging relationships,
whose recognition on the Balance Sheet is not yet allowed.
The cash flow hedge reserve is reversed through profit or
loss in the periods in wich the cash flows from a hedged
item affect profit for the period. The ineffective portion of
gains or losses on hedging derivatives must be
recognized in profit or loss.
In the case of hedging instruments where the hedging
relationship can only be determined to be partly effective,
the ineffective portion of the gain or loss must immediately
be recognized in profit or loss.
Receivables
Receivables were measured at amortized cost without
deducting impairments. Accrued interest was reported in
the relevant line item. Premiums and discounts were
accrued over their terms to maturity.
Purchased receivables were also classified as loans and
receivables.
In the case of receivables constituting hedged items in a
fair value hedge, revaluation gains and losses on the
hedged item were captured and the carrying amount of the
receivable was adjusted accordingly (basis adjustment).
Receivables not attributable to a core banking relationship
were classified as loans and receivables and recognized in
Other assets.
Impairment allowance balance
Allowance was made for credit risks by recognizing item-
by-item charges for impairment losses.
Applying uniform Group-wide policies, impairment
allowances in the amount of the expected losses were
made for the recognizable counterparty risks associated
with loans and advances to customers and other banks,
were reversed insofar as the credit risk no longer existed,
and were used if the loan was deemed to be irrecoverable
and was charged off. A risk of default was deemed to
exist if, taking account of collateral, the present value of
expected repayments and interest payments was less than
the carrying amount of the receivable.

PAGE 41
For the first time, as of 31 December 2008, a collective
assessment of impairments of portfolios was recognized in
the Consolidated Financial Statements for losses incurred
but not yet detected on the balance sheet date. Prior-year
figures were restated accordingly. Because of action
needed to implement Basel II, thanks to the development
of historical data series and because of more reliable data
collection in areas including default probabilities, it was
now possible to present more meaningful summaries by
risk class as well as the associated charges for impairment
losses. As this meant that the financial statements could
provide more relevant and reliable information about the
effects of such transactions on the enterprise’s assets,
liabilities, financial position and profit or loss, we changed
our recognition and measurement policies accordingly. As
a result, a collective assessment of impairments of
portfolios in the amount of €4,468 thousand was
recognized on the opening balance sheet as of 1 January
2007.
The balance of impairment allowances for receivables
recognized on the Balance Sheet was presented in a
separate line item on the assets side of the Balance Sheet
below receivables (Loans and advances). The impairment
allowance for off-balance-sheet transactions was
recognized as a provision.
As a rule, direct write-offs only took place if the waiver of a
receivable had been agreed with a borrower or an
unexpected loss had occurred.
Trading assets
Trading assets are held for the purpose of exploiting short-
term fluctuations in market prices.
Securities and derivatives held for trading were measured
at their fair values. In the case of listed products, fair
values were based on exchange prices. In the case of
unlisted products, prices close to market prices
(Bloomberg, Reuters) were used. If such prices were not
available, primary financial instruments and forwards were
measured using internal prices based on present value
calculations, and options were measured using
appropriate option price models. Derivatives held for
trading were also recognized as part of the trading
portfolio. Where fair values were positive, these derivatives
were classified as Trading assets, and where fair values
were negative, they were reported on the Balance Sheet in
the line item Trading liabilities, the fair values of derivatives
being calculated without accrued interest (giving clean
prices). Positive and negative fair values were not netted
off against each other.
Receivables arising from accruals of interest on derivatives
held for trading were also reported in the line item Trading assets. Changes in their clean prices were recognized in
the Income Statement in the line item Net trading income.
Realized and unrealized gains and losses on trading
assets and interest income and expenses arising from
derivatives held for trading were recognized in the Income
Statement in the line item Net trading income. Interest and
dividend income arising from securities held for trading
and the interest costs of funding them were recognized in
the line item Net interest income.
Other current financial assets
This line item comprises financial instruments designated
as at fair value through profit or loss within the scope of
the fair value option. They are bonds and other fixed-
interest securities, shares and other variable-yield
securities. Accrued interest on such financial instruments
was also reported in this line item on the Balance Sheet.
Realized and unrealized gains and losses were recognized
in the Income Statement in the line item Net income from

PAGE 42
financial investments, and current investment income was
recognized in the line item Net interest income.
Financial investments
The line item Financial investments includes all fixed-
interest securities classified as held to maturity, fixed-
interest securities not assigned to this category, variable-
yield securities, investments in subsidiaries not
consolidated on the grounds of immateriality, and other
equity investments. The held-to-maturity portfolio was
recognized on the Balance Sheet at amortized cost.
Securities not classified as held to maturity, investments in
subsidiaries and other equity investments were classified
as available for sale. If listed, these financial assets were
recognized at their exchange prices at the balance sheet
date. Otherwise, they were measured at fair value. If their
fair value could not be determined reliably, they were
measured at cost. Revaluation gains and losses on assets
classified as available for sale were taken to equity in a
special reserve (available-for-sale reserve) and were not
recognized in profit or loss. Gains and losses on their
disposal were recognized in the line item Net income from financial investments. The available-for-sale reserve is
reversed through profit or loss when the asset is disposed
of. Impairments within the meaning of IAS 39 were
recognized in the Income Statement.
Investments in entities accounted for using the equity method
Investments in entities accounted for using the equity
method are presented in a separate line item. Profit from
them is also reported separately in the Income Statement.
Intangible assets
Purchased intangible assets with a determinable useful life
were measured at cost less straight-line, ordinary
amortization. Straight-line amortization is based on
expected useful lives of between three and 50 years.
Pursuant to IAS 36, if there is any indication that an asset
may be impaired, insofar as the carrying amount of the
asset exceeds its recoverable amount, an impairment loss
must be recognized. The recoverable amount is the
higher of the asset’s fair value less costs to sell and its
value in use. If, in subsequent reporting periods, there are
grounds to believe that the impairment no longer exists,
IAS 36 requires a write-back up to the recoverable amount
but not to more than the asset’s amortized cost. A write-
back of goodwill is not permitted.
At the balance sheet date, RLB NÖ Wien had no self-
produced intangible assets with reliably determinable
conversion costs that were likely to generate future
economic benefits.

PAGE 43
Property and equipment
Tangible assets were measured at cost of acquisition or conversion less depreciation. Depreciation is carried out on a
straight-line basis assuming the following useful lives:
USEFUL LIFE YEARS
Buildings 25 – 50 Office furniture and equipment 3 – 20
Fittings in rented premises are depreciated on a straight-
line basis over the shorter of the lease term and their
expected useful life, which is usually 10 years.
Pursuant to IAS 36, if there is any indication that an asset
may be impaired, insofar as the carrying amount of the
asset exceeds its recoverable amount, an impairment loss
must be recognized. The recoverable amount is the
higher of an asset’s fair value less costs to sell and its
value in use. If, in subsequent reporting periods, there are
grounds to believe that the impairment no longer exists,
IAS 36 requires a write-back up to the recoverable amount
but not to more than the asset’s amortized cost.
Other assets
The line item Other assets consists mainly of receivables
not resulting from core banking relationships (essentially,
receivables resulting from supplies and services), tax
assets, coin and inventories as well as the positive fair
values of derivatives not held for trading and receivables
arising from the accrual of interest on such derivatives.
Inventories were measured at the lower of their cost and
net realizable value. Net realizable value is defined as the
estimated selling price in the ordinary course of business
less the estimated costs necessary to make the sale.
Payables
Financial liabilities not designated as at fair value through
profit or loss or classified as held for trading were
measured at amortized cost. Accrued interest was
reported in the pertinent line item on the Balance Sheet.
Premiums and discounts are accrued over their terms to
maturity.
Insofar as the exposure to interest rate risk associated with
payables was hedged against in a fair value hedge,
carrying amounts were adjusted by the amount of the
changes in value arising from the interest rate risk (basis
adjustment).
Liabilities evidenced by paper
Any difference between the issue price and amortization
amount of a liability evidenced by paper and measured at
amortized cost is spread over the term of the liability as
write-ups or write-downs. Zero-coupon bonds and similar
obligations were measured on a present value basis.
The recognized total of liabilities evidenced by paper was
reduced by the amount of reacquired securities issued by
the enterprise. Insofar as the exposure to interest rate risk
associated with such issuances was hedged against in a
fair value hedge, carrying amounts were adjusted by the

PAGE 44
amount of the changes in value arising from the interest
rate risk (basis adjustment).
Trading liabilities
Trading liabilities are held for the purpose of exploiting
short-term fluctuations in market prices.
Derivatives held for trading were measured at fair value. In
the case of listed products, fair values were based on
exchange prices or prices close to the market price
(Bloomberg, Reuters). If such prices were not available,
forwards were measured using internal prices based on
present value calculations and options were measured
using appropriate option price models. Where fair values
were positive, these derivatives were recognized in the line
item Trading assets, and where fair values were negative,
they were reported on the Balance Sheet in the line item
Trading liabilities, their fair values being calculated without
accrued interest (giving clean prices). Positive and
negative fair values were not netted off against each other.
Liabilities arising from accruals of interest on derivatives
held for trading were also recognized in the line item
Trading liabilities. The change in their clean price was
recognized in the Income Statement in the line item Net trading income.
Realized and unrealized gains and losses on trading lia-
bilities and interest income and expenses arising from
derivatives held for trading were recognized in the Income
Statement in the line item Net trading income.
Other liabilities
Other liabilities consists mainly of liabilities not resulting
from core banking relationships. These were essentially
payables resulting from supplies of goods and services,
tax liabilities and other payables. Negative fair values of
derivative financial instruments and liabilities arising from
interest accruals in respect of such derivatives were
reported in this line item. The obligation to transfer profits
to Raiffeisen-Holding NÖ-Wien — the parent of RLB NÖ-
Wien — under the profit-transfer agreement was also
accounted for here.
Provisions
Provisions were created if there was a reliably
determinable legal or actual obligation to a third party.
All provisions for so-called social capital (for post-
employment, termination and jubilee benefits and for part-
time work by older staff) were created in accordance with
IAS 19 Employee Benefits using the projected unit credit method.
We distinguished between two kinds of post-employment
benefit plan:
Defined contribution plan: Sums are transferred to a
pension fund for a group of employees. The fund
manages the money and pays the post-employment
benefits. The enterprise does not have any further
obligations. The investment risk associated with the
pension fund’s investment activities is borne by the
employee. In other words, the enterprise merely makes a
promise to the employee to pay the contributions to the
pension fund and does not promise any amount of
subsequent pension payments. In the case of such plans,
payments to the pension fund are treated as current
expenditure.
Defined benefit plan: The RLB NÖ-Wien Group has, with
legal and binding effect and irrevocably, promised a group
of employees defined benefit plans (by way of so-called
post-employment benefit statutes, special agreements)
defining the amounts of subsequent pensions. These

PAGE 45
plans are in part unfunded (i.e. the funds needed to pay
for them remain within the enterprise) and partly funded
(i.e. the funds are saved with the pension fund and/or
insurers). In the case of benefit payments under post-
employment benefit statutes financed via the pension
fund, the entitlement is determined once, at the time the
employee retires, and then transferred to a defined
contribution plan. Such a removal from the scope of
actuarial valuations is reported separately.
No allowance was made for rates of fluctuation in the
provision for post-employment benefits because the
Group’s commitments were founded on promises made in
individual contracts that were individualized and
irrevocable with respect to the respective post-
employment benefit.
To ascertain termination benefit obligations in the case of
employees who joined the organization up to and
including 2002, the present value of the total obligation
and additional entitlements earned in the period under
review were determined using the projected unit credit method in accordance with generally accepted actuarial
practice. In the case of all employees joining the
organization on or after 1 January 2003, the termination
benefit obligations were assumed by a staff benefit fund
and a defined contribution system is in place. The
enterprise pays contributions to a staff benefit fund on the
basis of legislative provisions. Having paid the
contributions, the enterprise does not have any further
benefit obligations.
Besides invalidity rates, mortality rates and factors arising
in connection with the termination of employment upon the
attainment of retirement age, the Group also applied
annual years-of-service dependent rates of fluctuation
based on internal statistical data for premature
terminations of employment.
The same applies, mutatis mutandis, to the provision for
jubilee benefits (after 25 and 35 years of service). When
calculating the provision for part-time work by older staff,
account was taken of the individual time span of each
promise. No allowance was made for rates of fluctuation.
Allowance was made for gains and losses on provisions
for termination and post-employment benefits using the
corridor method. Applying this method, actuarial gains
and losses were only recognized on the Balance Sheet if
one of the limits laid down in the standard of 10 per cent of
the present value of the defined benefit obligation (DBO)
or 10 per cent of the present value of the plan assets had
been exceeded at the end of the previous reporting period,
the higher basis of assessment being relevant. Amounts
outside the corridor are amortized over the average
remaining period of service of the active employee as
determined by an expert.
An interest rate of 5.5 per cent per annum (2007: 5.0 per
cent) was applied in respect of valuations as at the
balance sheet date. Plan assets were measured on the
basis of an expected return on investment of 5.8 per cent
per annum (2007: 5.8 per cent). We assumed future
increases in salaries of 3.0 per cent per annum in the case
of employees compensated outside the scope of
collective agreements (2007: 3.0 per cent), of 4.0 per cent
per annum in the case of employees compensated under
collective agreements (2007: 4.0 per cent), and of 4.5 per
cent per annum in the case of employees compensated
under the transitional collective agreement
(Überleitungskollektivvertrag) (2007: 4.5 per cent). An
annual increase in pensioners’ post-employment benefits
of 2.5 per cent per annum was assumed (2007: 2.5 per
cent). Increases in the salaries of members of the
Managing Board were calculated separately. The
biometrical basis for the computation of all provisions for
“social capital” was provided by AVÖ 2008-P-Rechnungsgrundlagen für die Pensionsversicherung (computational framework for post-employment benefit
PAGE 46
insurance) – Pagler & Pagler using the variant for salaried
employees. Calculations took place on the basis of the
earliest possible retirement ages of men and women.
Individual retirement ages were only taken into account
when calculating the provision for part-time work by older
staff.
Expenditure on provisions for post-employment benefits
was reported in the Income Statement in the line item
General administrative expenses.
Other provisions were created for indefinite obligations to
third parties in the amount of the expected claims. These
provisions were not discounted because the interest effect
of discounting them was unlikely to have any material
effects on the Annual Financial Statements.
Subordinated debt capital
Subordinated liabilities were recognized at amortized cost.
They comprised subordinated liabilities within the meaning
of § 23 Abs 8 BWG, supplementary capital within the
meaning of § 23 Abs. 7 BWG and non-voting non-
ownership capital (Partizipationskapital) within the
meaning of § 23 Abs. 4 BWG. The capitalized amount was
reduced by the amount of reacquired securities issued by
the enterprise. Insofar as the exposure to the interest rate
risk associated with such instruments was hedged against
in a fair value hedge, carrying amounts were adjusted by
the amount of the changes in value arising from the
interest rate risk (basis adjustment). Associated accrued
interest was also reported in this line item on the Balance
Sheet.
If the performance and repayable amount of subordinated
liabilities had been made dependent on the performance
of a specific portfolio of assets, accounting mismatches
were avoided by designating all the assets and liabilities
as at fair value through profit or loss. Such liabilities were
subordinated within the meaning of § 45 Abs. 4 BWG.
Equity
Equity is made up of paid-in capital, this being capital
contributed to the enterprise (subscribed capital and
capital reserves), and earned capital (retained earnings,
liable reserves [Haftrücklagen], profit carryforward, profit,
profits and losses from cash flow hedges not recognized
in the Income Statement, the available-for-sale reserve, the
Group’s interest in changes in the equity of entities
accounted for using the equity method not recognized in
profit or loss and deferred taxes taken directly to equity).
Minority interests in the equity of consolidated subsidiaries
were reported separately in this line item.
Income tax
Income tax was recognized and measured in conformity
with IAS 12 using the balance sheet liability method.
Deferred taxes were calculated on the basis of temporary
differences between carrying amounts in the Consolidated
Financial Statements and the tax base that were going to
balance out in subsequent periods. Deferred taxes were
formed to adjust current tax expense as recognized in the
Income Statement in the IFRS-compliant financial
statements to the profit for the year reported therein as if
that profit for the year were the basis of assessment for
tax. The recognition of deferred tax assets or liabilities
anticipated the future tax effects of present and past
events. Deferred tax assets and liabilities were netted off
against each other in respect of each taxable unit.
Deferred tax assets resulting from tax loss carryforwards
were recognized if the same taxable unit was expected to
record taxable profits in an appropriate amount in the
future.
PAGE 47
Since the assessment year 2005, RLB NÖ-Wien has been
a member of a taxable enterprises group (steuerliche Unternehmensgruppe) within the meaning of § 9 KStG (Austrian corporation tax act) under group parent
(Gruppenträger) Raiffeisen-Holding NÖ-Wien. It has
signed a tax contribution agreement (Steuerumlagen-vereinbarung) with its group parent. The profit-transfer
agreement, signed among other things because of prior
group taxation rules (Organschaft), remains in place. In
the assessment year 2008, the taxable enterprises group
under the group parentage of Raiffeisen-Holding NÖ-Wien had 87 group members besides group member RLB NÖ-
Wien (2007: 77). The basis of assessment for tax on the
group as a whole is the sum of the earnings of the group
parent and the allocated taxable profits of the group
members taking account of the group parent’s tax loss
carryforwards to the extent allowed by law. RLB NÖ-Wien
incurs group corporation tax (Gruppenkörperschaftsteuer), which is assessed at the level of the group parent
Raiffeisen-Holding NÖ-Wien, on a proportionate basis. A
contractually agreed tax contribution is payable to group
parent Raiffeisen-Holding NÖ-Wien for the untaxed portion
of the taxable profit of RLB NÖ-Wien. If RLB NÖ-Wien
makes a tax loss, a negative tax contribution will be
charged.
Previously, when measuring deferred tax assets and
liabilities, the RLB NÖ-Wien Group applied the tax
contribution rate (inclusive of corporation tax passed on)
laid down in the Gruppenbesteuerungsvertrag (group
taxation agreement). On 18 September 2007, the Austrian
Financial Reporting and Auditing Committee (AFRAC)
published an opinion on Fragen der IFRS-Bilanzierung und Berichterstattung im Zusammenhang mit der Einführung der Gruppenbesteuerung (issues relating to IFRS-
compliant accounting and reporting in connection with the
introduction of group taxation). Pursuant to this opinion,
deferred tax assets and liabilities should be measured
applying the corporation tax rate of 25 per cent in force on
the balance sheet date. This made it necessary to change
the method of recognizing these items. The RLB NÖ-Wien
Group implemented the contents of the AFRAC opinion
ahead of time as of 1 January 2008, leading to the
adjustment of deferred tax liabilities on the Opening
Balance Sheet as of 1 January 2007 by the amount of
€12,224 thousand.
Deferred taxes were measured applying the corporation
tax rate of 25 per cent in force on the balance sheet date.
The gains and losses taken to equity (cash flow hedge
reserve, available-for-sale reserve) were, likewise, adjusted
by the amount of deferred tax on a proportionate basis.
Income tax assets and liabilities were recognized in Other assets or Other liabilities. Deferred tax assets and lia-
bilities were recognized in Other assets or Tax provisions.
Profit-based current and deferred taxes were recognized in
the Income Statement in the line item Income tax. Non-
profit based taxes were recognized in the Income
Statement in the line item Other operating profit. Deferred
taxes were not discounted.
Income Statement
Besides interest income and expenses, the line item Net interest income also includes all similar recurring and non-
recurring income and charges. Interest and similar income
and charges were measured on an accrual basis using the
effective interest rate method. This line item also includes
all interest and dividend income from securities and
earnings from non-consolidated equity investments.
Dividend income was recognized as of the time when the
right to payment arose.
The line item Charge for impairment losses on loans and advances includes all expenses and income in connection
with the revaluation of loans and advances to customers
and other banks and in connection with other credit risks
for which provisions were created.

PAGE 48
The line item Net fee and commission income includes all
income and expenses arising with legally binding effect in
connection with the rendering of services.
Net trading income includes all realized and unrealized
gains and losses arising from trading in securities,
currencies and derivatives and interest income and
expenses arising from derivatives held for trading. Interest
and dividend income arising from securities held for
trading and the costs of funding them were recognized in
the line item Net interest income.
Net income from investments in entities accounted for using the equity method made a material contribution to
consolidated profit. It was presented in a separate line
item.
Net income from financial investments includes all realized
and unrealized gains and losses on financial investments,
securities classified as current financial assets and other
financial instruments designated as at fair value through
profit or loss within the scope of the fair value option.
Consequently, to avoid any accounting mismatch,
unrealized gains and losses on derivatives and
subordinated liabilities designated as at fair value through
profit or loss that bore an economic relationship to
securities classified as Other current financial assets within
the scope of the fair value option were reported in this line
item in the Income Statement. Revaluation gains and
losses arising from an impairment or reversal of an
impairment were likewise recognized in this line item.
General administrative expenses includes staff costs, other
administrative expenses and depreciation/amortization/
write-offs of intangible assets and property and
equipment.
Other operating profit includes all revaluation gains and
losses on “other” derivatives in the banking book as well
as the Group’s other operating profit.
Repo transactions
During “genuine” repurchase (repo) transactions, the
Group sells assets to another party and undertakes at the
same time to repurchase the same assets on a specified
date at a specified price. The assets remain on the
Group’s Balance Sheet and were measured applying the
rules governing the respective measurement category. At
the same time, an obligation in the amount of the
payments received is recognized as a liability.
During reverse repo transactions, assets are acquired
subject to a simultaneous undertaking to sell them in the
future subject to payment. Such transactions were
recognized on the Balance Sheet in the line item Loans and advances to other banks or Loans and advances to customers. Interest expenses arising from repos and
interest income from reverse repos are deferred over their
term. They were recognized in the line item Net interest income.
In the case of a “non-genuine” or “pseudo” repo, the
pledgor is obliged to repurchase the pledged asset but is
not entitled to demand its sale. Retransfer is solely at the
discretion of the secured party. The right to retransfer the
asset constitutes a put option for the secured party in
respect of which the pledgor acts as writer of the option. If
the put option is deeply in the money, the securities will
not be derecognized in the pledgor’s accounts because
the associated rewards and risks are retained. If the put
option is deeply out of the money, repurchase is very
unlikely and the pledged security must be derecognized.
If the put option is neither deeply out of the money nor
deeply in the money, one must ascertain whether the
transferring entity (pledgor) still has power of disposal over
the asset. If the security is traded in an active market, one
can assume that power of disposal will be transferred and
the pledged security will be derecognized. In the case of a
financial asset not traded in an active market, the pledged

PAGE 49
security must continue to be recognized on the pledgor’s
balance sheet.
Trust activities
Transactions undertaken in the management or placing of
assets for account of third parties were not recognized on
the Balance Sheet. Commission payments arising from
such transactions were recognized in the line item Net fee and commission income.
Leasing
During the period under review, the Group did not carry on
any active leasing business as lessor. Lease relationships
only existed in cases where the Group was lessee. The
leases of material importance to the Group, namely vehicle
leases, were operating leases for the purposes of IAS 17.
The resulting lease instalments were recorded in the
Income Statement as current expenditure in the line item
General administrative expenses.
Foreign currency translation
Foreign currency translation took place in accordance with
the provisions of IAS 21. As a result, non-euro monetary
assets and liabilities were translated at the market
exchange rates (usually ECB reference rates) ruling at the
balance sheet date. Non-monetary assets and liabilities
not measured at fair value were measured applying the
rates ruling at the dates of their initial acquisition. Non-
monetary assets and liabilities measured at fair value were
translated at the market exchange rates (usually ECB
reference rates) ruling at the balance sheet date
Items in the Income Statement were immediately
translated into the functional currency as at the time they
came into being applying the rates ruling at the date of the
transaction.
Latitude of judgement and estimates
In the Consolidated Financial Statements, latitude of
judgement was employed when applying recognition and
measurement policies and, to a certain extent, when
estimates and assumptions were made that affected the
recognition of assets and liabilities, the statement of
contingent liabilities at the balance sheet date and the
reporting of income and expenses during the reporting
period.
When applying recognition and measurement policies,
Management exercised its latitude of judgement in the
light of the purpose of the Annual Financial Statements,
which is to provide meaningful information about the
enterprise’s assets, liabilities and financial position and
profit or loss and about changes in its assets, liabilities
and financial position.
Assumptions and estimates were, above all, made when
determining the fair values of some financial instruments,
recognizing impairments in respect of future losses on
loans and advances and interest rebates, creating
provisions for post-employment benefits, termination
benefits and similar obligations as well as other provisions,
determining discounted cash flows during impairment
testing and determining the useful lives of non-current
assets. Actual results may differ from estimates.

PAGE 50
New standards and interpretations
The following new and revised standards and interpretations were applicable to financial years ending on or before
31 December 2008:
New Provisions EFFECTIVE DATE ADOPTED BY
THE EU
Amendments to Standards
IAS 39 Reclassification of Financial Instruments, Recognition and Measurement 1 July 2008 Yes
IFRS 7 Reclassification of Financial Instruments, Disclosures 1 July 2008 Yes
New Interpretations
IFRIC 11 Group and Treasury Share Transactions 1 March 2007 Yes
IFRIC 14 The Limit of a Defined Benefit Asset, Minimum Funding Requirements and their Interaction (IAS 19) 1 January 2008 Yes
The IASB’s revision of IAS 39 Financial Instruments: Recognition and Measurement created new possibilities
for reclassifying individual financial instruments to another
measurement category. In this connection, IFRS 7 lays
down new disclosure requirements. The changes are
effective as of 1 July 2008, and financial instruments could
also be reclassified retrospectively up to 31 October 2008.
The RLB NÖ-Wien Group did not make use of the option of
retrospective reclassifying financial instruments as of
1 July 2008. During the fourth quarter of 2008, some of
the bonds held for trading were reclassified as held to
maturity. The disclosures regarding these reclassifications
as required by IFRS 7 are contained in Note 19: Financial investments.
Because of the lack of relevant transactions, the other
changes to financial reporting standards listed above did
not have any effect on the Consolidated Financial
Statements.

PAGE 51
The following standards and interpretations already issued by the IASB or IFRIC but not yet in force were not applied ahead
of schedule in these Consolidated Financial Statements:
New Provisions EFFECTIVE DATE ADOPTED BY
THE EU
New Standard
IFRS 8 Operating segments 1 January 2009 Yes
Amendments to Standards
IAS 1 Presentation of Financial Statements (revised September 2007) 1 January 2009 Yes
IAS 23 Borrowing Costs (revised March 2007) 1 January 2009 Yes
IAS 27 Consolidated and Separate Financial Statements (2008) 1 July 2009 No
IAS 27 Cost of an Investment in a Subsidiary, Jointly-Controlled Entity or Associate 1 January 2009 Yes
IAS 32 Puttable Financial Instruments and Obligations Arising on Liquidation (2008) 1 January 2009 Yes
IAS 39 Reclassification of Financial Instruments, Effective Date and Transition 1 July 2008 No
IAS 39 Clarification concerning the Assessment of Embedded Derivatives 1 July 2008 No
IAS 39 Financial Instruments: Recognition and Measurement – Eligible Hedged Items (2008) 1 July 2009 No
IFRS 1 Cost of an Investment in a Subsidiary, Jointly-Controlled Entity or Associate 1 January 2009 Yes
IFRS 1 First Time Adoption of IFRSs (2008) 1 July 2009 No
IFRS 2 Share-Based Payment: Vesting Conditions and Cancellations 1 January 2009 Yes
IFRS 3 Business Combinations (2008) 1 July 2009 No
IFRS 7 Financial Instruments: Disclosures – Improving Disclosures about Financial Instruments 1 January 2009 No
Various Improvements to the International Financial Reporting Standards (2008)
Mainly 1 January 2009 Yes
New Interpretations
IFRIC 12 Service Concession Arrangements 1 January 2008 No
IFRIC 13 Customer Loyalty Programmes 1 July 2008 Yes
IFRIC 15 Agreements for the Construction of Real Estate 1 January 2009 No
IFRIC 16 Hedges of a Net Investment in a Foreign Operation 1 October 2008 No
IFRIC 17 Distributions of Non-cash Assets to Owners 1 July 2009 No
IFRIC 18 Transfers of Assets from Customers 1 July 2009 No
Amendments to Interpretations
IFRIC 9 Clarification on the accounting treatment of embedded derivatives 1 July 2008 No

PAGE 52
IFRS 8 supersedes IAS 14 Segment Reporting. In
particular, it requires the adoption of the management approach when measuring segment performance.
As a result of the revision of IAS 23 Borrowing Costs,
borrowing costs that are directly attributable to the
acquisition, construction or production of a qualifying
asset must be capitalized as part of the cost of that asset.
A qualifying asset is an asset that necessarily takes a
substantial period of time to get ready for its intended use
or sale.
The principal changes to IAS 1 can be summed up as
follows: Income and expenses not recognized in profit or
loss are no longer presented in the Statement of Changes
in Equity. Instead, they are presented either in a
comprehensive income statement or in two distinct
statements (a traditional profit and loss account and a
comprehensive income statement). Furthermore, in future,
comparative information for two years must be disclosed if
an accounting policy is changed or an error corrected.
When recognizing goodwill, the revision of IFRS 3 allows
the option of using the full goodwill method, which means
that when the parent acquires less than 100 per cent of
another entity, it also recognizes all of the goodwill
attributable to minority interests. In future, changes in the
ownership interest without loss of control will not be
recognized in profit or loss.
In February 2008, IAS 32 was amended with respect to the
classification of puttable financial instruments and
obligations that only arise on liquidation. As a result of the
changes, a number of financial instruments that currently
meet the definition of a financial liability are classified as
equity if they represent ultimate residual rights to the
enterprise’s net assets.
The changes to IAS 39 Financial Instruments: Recognition and Measurement clarify how the principles underlying
hedge accounting should be applied to the designation of
inflation risk in a financial hedged item and the designation
of a one-sided risk in a hedged item.
The RLB NÖ-Wien Group will be applying the revised
standards in their amended form from 2009. IFRS 8 and
the revision of IAS 1 will lead to corresponding changes in
the Notes and the presentation of the Consolidated
Financial Statements. We do not expect this to have any
material effects on the Group’s assets, liabilities, financial
position or profit or loss.
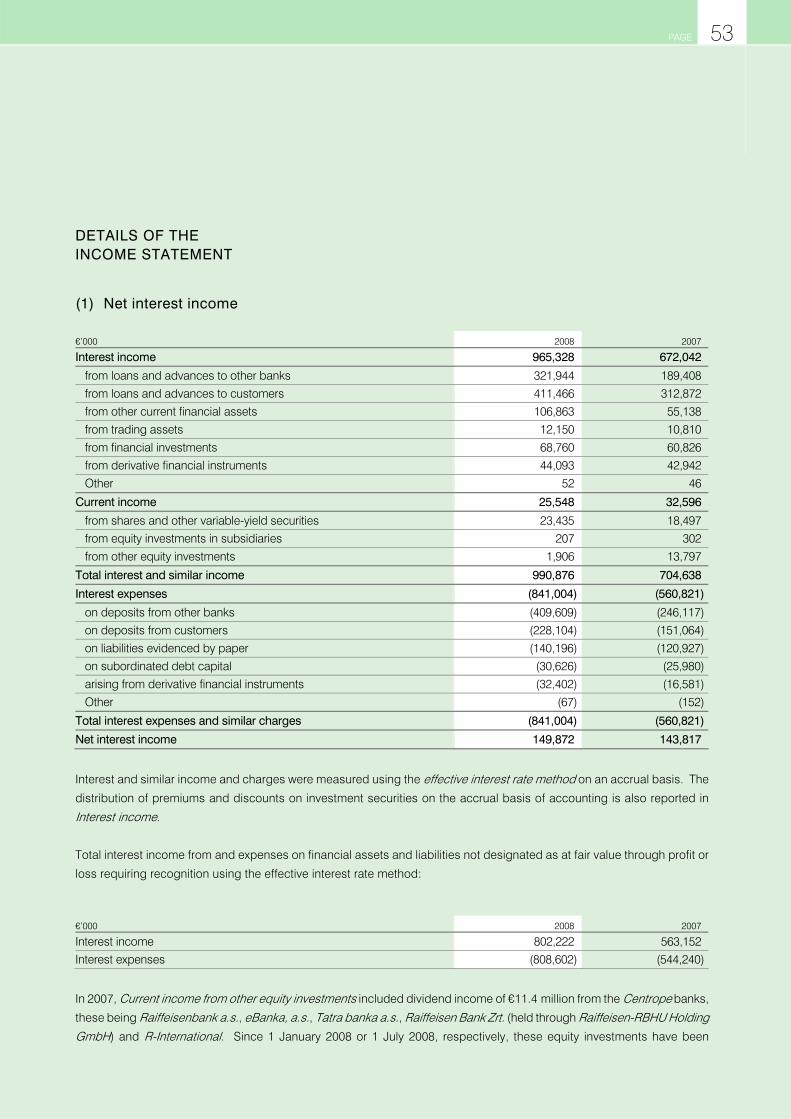
PAGE 53
(1) Net interest income
€’000 2008 2007
Interest income 965,328 672,042
from loans and advances to other banks 321,944 189,408
from loans and advances to customers 411,466 312,872
from other current financial assets 106,863 55,138
from trading assets 12,150 10,810
from financial investments 68,760 60,826
from derivative financial instruments 44,093 42,942
Other 52 46
Current income 25,548 32,596
from shares and other variable-yield securities 23,435 18,497 from equity investments in subsidiaries 207 302
from other equity investments 1,906 13,797
Total interest and similar income 990,876 704,638
Interest expenses (841,004) (560,821)
on deposits from other banks (409,609) (246,117)on deposits from customers (228,104) (151,064)
on liabilities evidenced by paper (140,196) (120,927)
on subordinated debt capital (30,626) (25,980)
arising from derivative financial instruments (32,402) (16,581)
Other (67) (152)
Total interest expenses and similar charges (841,004) (560,821)
Net interest income 149,872 143,817
Interest and similar income and charges were measured using the effective interest rate method on an accrual basis. The
distribution of premiums and discounts on investment securities on the accrual basis of accounting is also reported in
Interest income.
Total interest income from and expenses on financial assets and liabilities not designated as at fair value through profit or
loss requiring recognition using the effective interest rate method:
€’000 2008 2007
Interest income 802,222 563,152 Interest expenses (808,602) (544,240)
In 2007, Current income from other equity investments included dividend income of €11.4 million from the Centrope banks,
these being Raiffeisenbank a.s., eBanka, a.s., Tatra banka a.s., Raiffeisen Bank Zrt. (held through Raiffeisen-RBHU Holding GmbH) and R-International. Since 1 January 2008 or 1 July 2008, respectively, these equity investments have been
DETAILS OF THE INCOME STATEMENT
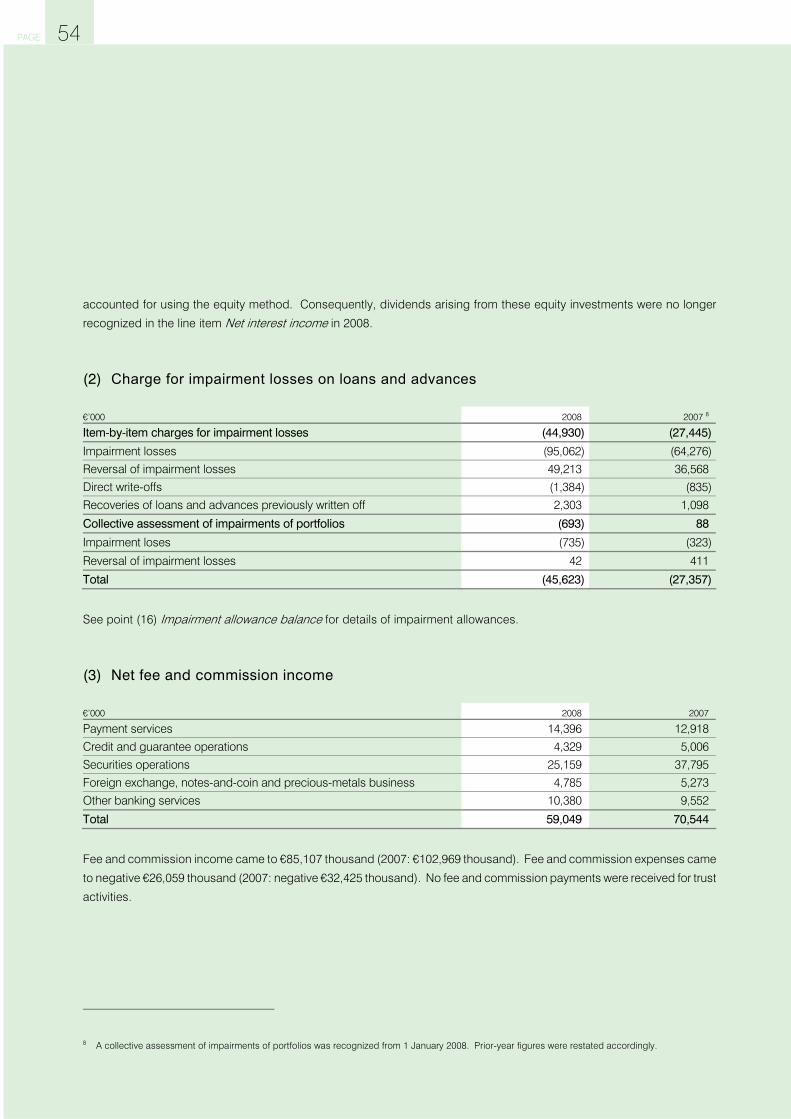
PAGE 54
accounted for using the equity method. Consequently, dividends arising from these equity investments were no longer
recognized in the line item Net interest income in 2008.
(2) Charge for impairment losses on loans and advances
€’000 2008 2007 8
Item-by-item charges for impairment losses (44,930) (27,445)
Impairment losses (95,062) (64,276)Reversal of impairment losses 49,213 36,568
Direct write-offs (1,384) (835)
Recoveries of loans and advances previously written off 2,303 1,098
Collective assessment of impairments of portfolios (693) 88
Impairment loses (735) (323)
Reversal of impairment losses 42 411
Total (45,623) (27,357)
See point (16) Impairment allowance balance for details of impairment allowances.
(3) Net fee and commission income
€’000 2008 2007
Payment services 14,396 12,918
Credit and guarantee operations 4,329 5,006
Securities operations 25,159 37,795
Foreign exchange, notes-and-coin and precious-metals business 4,785 5,273
Other banking services 10,380 9,552
Total 59,049 70,544
Fee and commission income came to €85,107 thousand (2007: €102,969 thousand). Fee and commission expenses came
to negative €26,059 thousand (2007: negative €32,425 thousand). No fee and commission payments were received for trust
activities.
8 A collective assessment of impairments of portfolios was recognized from 1 January 2008. Prior-year figures were restated accordingly.

PAGE 55
(4) Net trading income
Net trading income captures interest income from and interest expenses on derivatives held for trading and realized and
unrealized changes in the fair values of trading portfolios. Interest and dividend income and the interest costs of funding
securities held for trading were recognized in Net interest income.
€’000 2008 2007
Interest rate contracts (8,549) 1,046
of which from securities 1,584 (2,450)of which from derivative contracts (10,133) 3,496
Currency contracts (414) 7,588
Equity and index contracts 4,014 3,847
of which from securities 3,706 3,794 of which from derivative contracts 308 53
Other contracts 1,675 1,459
Total (3,274) 13,940
(5) Net income from investments in entities accounted for using the equity method
€’000 2008 2007
Group interest in annual profits or losses 187,880 243,669 Revaluation gains and losses (25,204) 0
Total 162,676 243,669
This line item includes a one-off effect of €6.9 million caused by the first-time use of the equity method to account for the
investment in Raiffeisenbank a.s. (stake held: 24.00 per cent) in accordance with IAS 8, and it also includes one-off effects
totalling €116.1 million caused by the first-time use of the equity method to account for the investments in Raiffeisen Bank Zrt., held through Raiffeisen-RBHU Holding GmbH (stake held: 16.23 per cent), Tatrabanka a.s. (stake held: 12.28 per cent)
and R-International (stake held: 0.61 per cent) in accordance with IAS 28 as a result of recognizing negative goodwill.

PAGE 56
(6) Net income from financial investments
€’000 2008 2007
Net income from financial investments classified as held to maturity 27 (13,993)
of which revaluation gains and losses 714 (14,002)
of which gains and losses on disposal (687) 9
Net income from financial investments classified as available for sale, measured at fair value (5,205) 15,085
of which revaluation gains and losses (4,885) 0 of which gains and losses on disposal (320) 15,085
Net income from financial investments classified as available for sale, measured at cost 437 (89)
of which revaluation gains and losses (126) (110)of which gains and losses on disposal 563 21
Net income from investments in entities accounted for using the equity method (104) 0
of which gains and losses on disposal (104) 0
Net income from unlisted securities recognized as receivables and classified as loans and receivables (1,781) (803)
of which revaluation gains and losses (1,781) (803)
Net income from financial instruments designated as at fair value through profit or loss (159,358) (24,105)
of which revaluation gains and losses (170,327) (33,797)of which gains and losses on disposal 10,969 9,692
Net income from liabilities measured at cost 914 (2,055)
Total (165,070) (25,960)
Net income from financial instruments designated as at fair value through profit or loss comprises net income from securities
in this category classified as current financial assets and net income from other financial instruments designated as at fair
value through profit or loss within the scope of the fair value option. Consequently, to avoid any accounting mismatch,
revaluation gains and losses on derivatives and subordinated liabilities designated as at fair value through profit or loss that
bore a close economic relationship to securities classified as Other current financial assets within the scope of the fair value
option were reported in this line item in the Income Statement.

PAGE 57
(7) General administrative expenses
€’000 2008 2007
Staff costs (87,545) (85,100)
of which wages and salaries (62,750) (62,643)
of which social security costs (15,956) (15,511)
of which voluntary fringe benefits (1,612) (1,384)
of which expenditure on termination and post-employment benefits (7,227) (5,562)
Other administrative expenses (73,109) (69,789)
of which building rental, maintenance and operating costs (19,375) (18,517)of which IT costs (20,951) (20,094)
of which advertising and entertainment expenses (13,148) (13,102)
of which other items (19,635) (18,076)
Depreciation/amortization/write-offs of property and equipment and intangible assets (2,892) (3,015)
of which of property and equipment (2,361) (2,460)of which of intangible assets (531) (555)
Total (163,546) (157,904)
Other administrative expenses includes rental and leasing expenses in the amount of €17,079 thousand (2007:
€16,013 thousand).

PAGE 58
(8) Other operating profit
Other operating profit includes, inter alia, income and
expenses arising from non-banking activities and income
and expenses arising from the disposal of property and
equipment and intangible assets. Changes in the values
of derivatives designated in a hedge accounting
relationship that required recognition in profit or loss were
recognized in this line item. Moreover, this line item also
contains revaluation gains and losses on derivative
financial instruments that were neither held for trading nor
hedging instruments within the meaning of IAS 39.
€’000 2008 2007
Effect of hedge accounting (1,073) 1,902
of which revaluation gains and losses on hedging instruments in fair value hedges 71,523 (32,749)
of which revaluation gains and losses on hedged items in fair value hedges (72,596) 34,651
Net income from other derivatives (636) 25,255
of which from interest rate derivatives (1,812) 21,337 of which from currency derivatives 2,947 (1,186)
of which from equity and index derivatives (1,855) 5,039
of which from credit derivatives 84 65
Other operating income 16,448 16,986
of which income from services and reimbursed costs 13,496 14,366
of which other items 2,952 2,620
Other operating expenses (6,149) (1,150)
of which damages (1,393) (74)of which arising from the solidarity association (Solidaritätsverein) (575) (611)
of which other items (4,181) (465)
Total 8,590 42,993

PAGE 59
(9) Net income from financial instruments
€’000 2008 2007
Net income from financial instruments designated as at fair value through profit or loss 682 128,161
Held for trading 30,384 81,902
Designated as at fair value through profit or loss (29,702) 46,259
Net income from financial instruments classified as available for sale 15,699 32,381
of which the amount taken from equity and recognized in profit or loss for the period 4,125 14,965
of which the amount taken directly to the Income Statement for the financial year 11,574 17,416
Net income from financial instruments classified as held to maturity 67,765 45,527
Net income from financial instruments classified as loans and receivables 686,058 474,078
Net income from liabilities measured at cost (807,688) (546,295)
Total (37,484) 133,852
Net income in each valuation category comprises realized and unrealized gains and losses, interest income, dividends and
other distributions. Revaluation gains and losses on available-for-sale financial instruments, which were not recognized in
profit or loss, are presented in C. (Statement of Changes in Equity).
(10) Income tax
€’000 2008 2007 1
Current income tax 9,262 (2,158)
of which tax attributed to the group parent 9,526 (1,913)of which current domestic tax (249) (187)
of which current foreign tax (15) (58)
Deferred tax 17,218 1,974
Total 26,480 (184)
1 Pursuant to the opinion on Fragen der IFRS-Bilanzierung und –Berichterstattung im Zusammenhang mit der Einführung der Gruppenbesteuerung (issues relating to IFRS-compliant accounting and reporting in connection with the introduction of group taxation) published by AFRAC (the Austrian Financial Reporting and Auditing Committee), deferred taxes should be measured applying the current corporation tax rate of 25 per cent. The RLB NÖ-Wien Group implemented the contents of this opinion ahead of time as of 1 January 2008. Prior-year figures were restated accordingly.

PAGE 60
The following reconciliation shows the relationship between profit for the year and actual tax expense:
€’000 2008 2007 1
Profit for the year before tax 2,673 303,743
Theoretical income tax expense in the financial year based on the domestic income tax rate of 25 per cent (668) (75,936)
Effect of the lower tax rate assigned to the group parent 2 (13,612) 6,301
Reduction in the tax burden because of tax-exempt income from equity investments and other tax-exempt income 47,104 70,079
Increase in the tax burden because of non-tax-deductible expenses (1,021) (902)
Use of tax loss carryforwards and remeasurement of deferred tax items (3,145) (911)
Other (2,178) 1,185
Actual tax burden 26,480 (184)
(11) Earnings per share
2008 2007 3
Consolidated profit for the year, €’000 29,131 303,551
Number of ordinary shares in issue 2,000,789 1,991,973
Undiluted earnings per share, € 14.56 152.39
There were no conversion or option rights in circulation. Consequently, undiluted earnings per share were identical to
diluted earnings per share.
1 Pursuant to the opinion on Fragen der IFRS-Bilanzierung und –Berichterstattung im Zusammenhang mit der Einführung der Gruppenbesteuerung (issues relating to IFRS-compliant accounting and reporting in connection with the introduction of group taxation) published by AFRAC (the Austrian Financial Reporting and Auditing Committee), deferred taxes should be measured applying the current corporation tax rate of 25 per cent. The RLB NÖ-Wien Group implemented the contents of this opinion ahead of time as of 1 January 2008. Prior-year figures were restated accordingly.
2 The tax contribution rates agreed within the scope of group taxation were lower than the domestic corporation tax rate. This line item shows the resulting effect on the actual income tax burden.
3 Pursuant to the opinion on Fragen der IFRS-Bilanzierung und –Berichterstattung im Zusammenhang mit der Einführung der Gruppenbesteuerung (issues relating to IFRS-compliant accounting and reporting in connection with the introduction of group taxation) published by AFRAC (the Austrian Financial Reporting and Auditing Committee), deferred taxes should be measured applying the current corporation tax rate of 25 per cent. The RLB NÖ-Wien Group implemented the contents of this opinion ahead of time as of 1 January 2008.
Since 1 January 2008, the charge for impairment losses on loans and advances has included a collective assessment of impairments of portfolios. Prior-year figures were restated accordingly.

PAGE 61
(12) Segment reporting
Our segment reporting is based on the Group’s internal
performance calculations, which take the form of a multi-
stage contribution income statement. Income and
expenses are allocated on a cost-by-cause basis. The
income items are Net interest income, Net fee and commission income, Net trading income and Other operating profit. Net interest income is calculated on a
market-interest rate basis.
Interest earnings from equity are allocated to individual
segments according to regulatory capital requirements on
the basis of an assumed interest rate and reported in Net interest income. The Charge for impairment losses on loans and advances captures the net impairment
allowance for counterparty risks and direct write-offs less
recoveries of loans and advances previously written off.
General administrative expenses includes direct and
indirect costs. Direct costs (Staff costs and Other administrative expenses) are incurred by individual
business segments, whereas indirect costs are allocated
on the basis of predefined ratios.
Segments are presented as if they were autonomous
enterprises with their own capital resources and with
responsibility for their own results.
Segments are defined according to the RLB NÖ-Wien
customers being serviced.
The basis for primary segment reporting for the purposes
of IAS 14 is RLB NÖ-Wien’s internal business segment
accounting system, which reflects the management remits
defined within the RLB NÖ-Wien Group.
Our segment reports distinguish between the following
segments:
• The Retail Banking segment (personal and business banking customers), which encompasses the Group’s retail operations in Vienna
This segment encompasses all business conducted with
private individuals, small businesses and self-employed
customers. Branches and offices in Vienna are arranged
into branches for personal banking customers, offices for
high net worth private customers (Private Banking Wien),
special centres of excellence for trade and business
(Gewerbe1) customers, and consulting offices. Consulting
offices are also open for customers outside normal
banking hours, and a customer can, in addition, choose
where a consultation session should take place. This
modern, pioneering approach reflects RLB NÖ-Wien’s
service-orientated advisory concept and its local roots.
Offerings in the Retail Banking segment consist mainly of
standardized products like passbook accounts, savings
deposits, time deposits, current and salary accounts,
personal loans, overdrafts, mortgages and other special
purpose loans.
RLB NÖ-Wien is the only institution in the Raiffeisen Group
operating in this segment in Vienna. Its branch network
also supports the activities of the other institutions within
the Raiffeisen organization.
1 As defined by Austria’s Gewerbeordnung (commercial code).

PAGE 62
• The Corporate Customers segment, which encompasses business conducted with the public sector, institutional clients and corporate customers in the Centrope region
This segment covers classical credit services for corporate
customers, corporate finance (project and investment
finance, acquisition finance, property finance), trade and
export finance, documentary services and the financing of
local authorities and financial institutions.
Classical credit services include the provision of working
capital, investment and trade finance using a wide variety
of financing instruments (e.g. current account loans, fixed
advances, direct loans, factoring, venture capital finance).
The Foreign Department — one of RLB NÖ-Wien’s main
departments — handles the subsidized export loans
available from Oesterreichische Kontrollbank AG (e.g.
special purpose financial loans for purchasers,
concessionary finance for exporters). Its other tasks
include furnishing Austrian and foreign clients with
guarantees and letters of credit.
Corporate finance includes handling project and
investment finance (specially tailored financing of specific
business projects) in the Group’s core market and
processing all subsidized credit products. In addition, it
includes transactions with the ERP Fund and the European
Investment Bank (EIB).
• The Financial Markets segment, which encompasses the Group’s treasury activities, including in particular its earnings from management of the banking book (profit from maturity transformation [Strukturbeitrag]) and from the trading book
The Treasury Department is responsible for the Group’s
proprietary positions in on-balance-sheet products (e.g.
money-market deposits) and off-balance-sheet interest
rate and price products (forwards, futures and options).
These include interest rate and currency contracts, and the
Treasury Department is likewise responsible for liquidity
management and asset liability management (maturity
transformation). Treasury operations also include the
management of RLB NÖ-Wien’s portfolios of bonds, funds
and short-term and long-term alternative investments
(combinations of securities products with derivatives).
Trading in financial instruments takes place centrally and is
subject to strictly controlled limits. Whereas all proprietary
trading was reported in this segment, the profit
contributions made by customer treasury services were
allocated to other segments. The portion of the
contribution to profit made over and above market prices
was allocated to customer segments.
• The Investments segment, which encompasses RLB NÖ-Wien’s banking-related equity investments, including in particular its investment in RZB
This segment mainly encompasses RLB NÖ-Wien’s port-
folio of equity investments in banks and other financial
institutions. This also includes its stake in the RZB Group
— which is accounted for using the equity method — and
all of the RZB Group’s activities in Central and Eastern
European countries as well as RLB NÖ-Wien’s equity
investments in the Raiffeisen Banks in the Czech Republic,
Slovakia and Hungary and its directly held stake in
Raiffeisen International Bank-Holding AG.

PAGE 63
• The Management Services segment (which corresponds to the Raiffeisen Banks and Management Services and Risk Management and Organization divisions in the Group’s organizational chart)
This segment encompasses any activities designed to
support other segments in the marketplace. They consist,
above all, of appropriate marketing activities. All activities
in connection with the Raiffeisenkasse banks are
presented within the scope of this segment. In addition, it
encompasses income and expenses that cannot, by their
nature, be allocated to any other segment.
The RLB NÖ-Wien Group employs two central steering
benchmarks:
Return on equity expresses the relationship between profit
before tax and average equity employed in the particular
segment.
The cost:income ratio expresses a segment’s cost
efficiency. It is the ratio of General administrative expenses to the sum of Net interest income, Net fee and commission income, Net trading income, Net income from investments in entities accounted for using the equity method and Other operating profit (i.e. without Net income from financial investments and the Charge for impairment losses on loans).
The RLB NÖ-Wien Group operates primarily in the
Centrope region, and within that region, mainly in Austria
in the Vienna area. Consequently, all amounts stated in
the Consolidated Financial Statements were attributable to
this single geographical segment.

PAGE 64
FINANCIAL YEAR 2008 €’000
RETAIL
BANKING
CORPORATE
CUSTOMERS
FINANCIAL
MARKETS INVESTMENTS
MANAGEMENT
SERVICES TOTAL
Net interest income 78,848 90,338 19,747 (44,436) 5,375 149,872
Charge for impairment losses on loans and advances (11,196) (31,416) (3,011) 0 0 (45,623)
Net interest income after impairment losses on loans and advances 67,652 58,922 16,736 (44,436) 5,375 104,249
Net fee and commission income 31,601 17,143 1,781 0 8,524 59,049
Net trading income 3,838 2,817 (13,405) 0 3,476 (3,274)
Net income from investments in entities accounted for using the equity method 0 0 0 162,676 0 162,676
Net income from financial investments 0 (14,185) (115,088) 2,317 (38,114) (165,070)
General administrative expenses (85,036) (31,277) (9,808) (1,755) (35,670) (163,546)
Other operating profit/(loss) 1,159 (3,673) 10,929 (9,036) 9,211 8,590
Profit before tax 19,214 29,747 (108,855) 109,766 (47,198) 2,674
Average risk-weighted assets, €m 1,249 6,522 2,294 1,090 315 11,470
Average allocated equity, €m 105 548 193 1,037 26 1,908
Return on equity before tax, % 18.3% 5.4% — 10.6% — 0.1%
Cost:income ratio, % 73.7% 29.3% 51.5% 1.6% 134.2% 43.4%
In 2008, Net income from investments in entities accounted for using the equity method in the Investments Segment was
subject to one-off effects. See point (5) Net income from investments in entities accounted for using the equity method for
details.

PAGE 65
FINANCIAL YEAR 2007 1 €’000
RETAIL
BANKING
CORPORATE
CUSTOMERS
FINANCIAL
MARKETS INVESTMENTS
MANAGEMENT
SERVICES TOTAL
Net interest income 70,971 73,241 16,845 (22,452) 5,212 143,817
Charge for impairment losses on loans and advances (13,251) (14,154) 47 1 0 (27,357)
Net interest income after impairment losses on loans and advances 57,720 59,087 16,892 (22,451) 5,212 116,460
Net fee and commission income 38,726 15,805 2,765 (1,376) 14,624 70,544
Net trading income 3,597 2,977 6,290 (25) 1,101 13,940
Net income from investments in entities accounted for using the equity method 0 0 0 243,669 0 243,669
Net income from financial investments 0 (1,451) (27,286) 14,890 (12,113) (25,960)
General administrative expenses (81,260) (30,151) (9,258) (2,025) (35,210) (157,904)
Other operating profit/(loss) 1,721 8,267 19,349 (190) 13,846 42,993
Profit before tax 20,504 54,534 8,752 232,492 (12,540) 303,742
Average risk-weighted assets, €m 1,142 4,955 1,746 875 348 9,066
Average allocated equity, €m 105 455 160 1,026 32 1,779
Return on equity before tax, % 19.5% 12.0% 5.5% 22.7% — 17.1%
Cost:income ratio, % 70.7% 30.1% 20.5% 0.9% 101.2% 30.7%
1 Since 1 January 2008, the charge for impairment losses on loans and advances has included a collective assessment of impairments of portfolios. Prior-year figures were restated accordingly.

PAGE 66
(13) Cash and balances with the central bank
€’000 2008 2007
Cash 45,423 47,146
Total 45,423 47,146
(14) Loans and advances to other banks
€’000 2008 2007
Demand deposits 1,755,097 750,335 Time deposits 5,227,911 2,790,038
Other loans and advances 1,874,415 1,680,691
Debt instruments 269,923 31,612
Other 35,051 42,406
Total 9,162,397 5,295,082
Loans and advances to other banks broke down by region as follows:
€’000 2008 2007
Austria 7,369,882 4,562,753 Abroad 1,792,515 732,329
Total 9,162,397 5,295,082
With the exception of loans and advances hedged against the exposure to interest rate risks in a fair value hedge, the loans
and advances accounted for here were classified as Loans and receivables.
DETAILS OF THE BALANCE SHEET

PAGE 67
(15) Loans and advances to customers
Loans and advances to customers broke down as follows:
€’000 2008 2007
Giro and current accounts 1,139,956 1,094,855
Cash advances 1,066,485 758,995
Loans 6,246,858 4,989,465
Debt instruments 27,162 8,642
Other 33,851 31,132
Total 8,514,312 6,883,089
Applying Basel II definitions, Loans and advances to customers broke down as follows, prior-year figures having been
restated accordingly:
€’000 2008 2007
Sovereign exposures 388,854 351,802 Retail exposures 1,467,139 1,542,917
Corporate exposures 6,658,318 4,984,836
Other 1 3,534
Total 8,514,312 6,883,089
Loans and advances to customers broke down by region as follows:
€’000 2008 2007
Austria 7,151,315 6,054,196 Abroad 1,362,997 828,893
Total 8,514,312 6,883,089
With the exception of loans and advances hedged against the exposure to interest rate risks in a fair value hedge, the loans
and advances accounted for here were classified as Loans and receivables.

PAGE 68
(16) Impairment allowance balance
2008 €’000
AT 1 JANUARY ADDED RELEASED USED
AT31 DECEMBER
Item-by-item allowances for impairment 239,332 79,469 (43,050) (39,145) 236,606
Loans and advances to other banks 0 12,230 0 0 12,230
of which abroad 0 12,230 0 0 12,230
Loans and advances to customers 239,332 67,239 (43,050) (39,145) 224,376
of which in Austria 231,310 65,935 (42,814) (38,105) 216,326
of which abroad 8,022 1,304 (236) (1,040) 8,050
Collective assessment of impairments of portfolios 4,380 735 (42) 0 5,073
Loans and advances to other banks 1,274 667 0 0 1,941 Loans and advances to customers 3,106 68 (42) 0 3,132
Impairment allowance balance (loans and advances) 1 243,712 80,204 (43,092) (39,145) 241,679
Risks arising from off-balance-sheet liabilities 2 10,098 15,594 (6,163) 0 19,529
Total 253,810 95,798 (49,255) (39,145) 261,208
2007 €’000
AT 1 JANUARY ADDED RELEASED USED
AT31 DECEMBER
Item-by-item allowances for impairment 250,408 62,581 (34,198) (39,459) 239,332
Loans and advances to customers 250,408 62,581 (34,198) (39,459) 239,332 of which in Austria 242,799 61,120 (33,151) (39,458) 231,310
of which abroad 7,609 1,461 (1,047) (1) 8,022
Collective assessment of impairments of portfolios 3 4,468 323 (411) 0 4,380
Loans and advances to other banks 1,023 251 0 0 1,274
Loans and advances to customers 3,445 71 (411) 0 3,106
Impairment allowance balance (loans and advances) 1 254,876 62,904 (34,609) (39,459) 243,712
Risks arising from off-balance-sheet liabilities 2 10,773 1,695 (2,370) 0 10,098
Total 265,649 64,599 (36,979) (39,459) 253,810
1 The balance of impairment allowances for impairment losses on loans and advances was reported on the Balance Sheet in the line item Impairment allowance balance.
2 Risks arising from off-balance-sheet liabilities were reported on the Balance Sheet in the line item Provisions. 3 Since 1 January 2008, the impairment allowance balance has included a collective assessment of impairments of portfolios. Prior-year figures were
restated accordingly.

PAGE 69
(17) Trading assets
Trading assets contains the following held-for-trading securities and derivative financial instruments:
€’000 2008 2007
Bonds and other fixed-interest securities 121,812 463,969
of which public-sector debt instruments eligible for rediscounting 0 5,780 of which bonds and similar securities issued by other issuers 121,812 458,189
Shares and other variable-yield securities 452 30,691
of which shares 0 66
of which units in investment funds 0 30,081
of which other variable-yield securities 452 544
Positive fair values of derivative contracts 1,382,508 263,066
of which interest rate derivatives 1,171,641 184,881 of which currency derivatives 210,268 77,481
of which equity and index derivatives 599 700
of which credit derivatives 0 4
Accruals arising from derivatives 732,038 395,044
of which interest rate derivatives 732,038 395,044
Total 2,236,810 1,152,770
(18) Other current financial assets
€’000 2008 2007
Bonds and other fixed-interest securities 1,856,581 1,651,064
Designated as at fair value through profit or loss 1,856,581 1,651,064
of which public-sector debt instruments eligible for rediscounting 36,636 29,367 of which other debt instruments issued by the public sector 46,577 34,107
of which bonds and similar securities issued by other issuers 1,773,368 1,587,590
Shares and other variable-yield securities 356,566 345,200
Designated as at fair value through profit or loss 356,566 345,200
of which shares 22,987 47,728 of which units in investment funds 310,374 181,196
of which other variable-yield securities 23,205 116,276
Total 2,213,147 1,996,264

PAGE 70
(19) Financial investments
€’000 2008 2007
Bonds and other fixed-interest securities 2,481,713 1,709,931
Classified as held to maturity 2,395,762 1,678,143
of which public-sector debt instruments eligible for rediscounting 580,576 583,023 of which other debt instruments issued by the public sector 36,955 23,979
of which bonds and similar securities issued by other issuers 1,778,231 1,071,141
Classified as available for sale, measured at fair value 85,951 31,788
of which public-sector debt instruments eligible for rediscounting 27,905 2,315
of which bonds and similar securities issued by other issuers 58,046 29,473
Shares and other variable-yield securities 221,177 101,239
Classified as available for sale, measured at fair value 192,477 72,539
of which units in investment funds 168 228
of which other variable-yield securities 192,309 72,311
Classified as available for sale, measured at cost 28,700 28,700
of which other variable-yield securities 28,700 28,700
Equity investments 84,305 262,480
Classified as available for sale, measured at fair value 0 15,648
of which other equity investments 0 15,648
Classified as available for sale, measured at cost 84,305 246,832
of which equity investments in non-consolidated subsidiaries 1 11,080 67,129
of which equity investments in associates not accounted for using the equity method 38,460 18,158
of which other equity investments 34,765 161,545
Total 2,787,195 2,073,650
No sales of available-for-sale financial instruments measured at cost are planned. During the financial year, such financial
instruments with a carrying amount of €73 thousand (2007: €21 thousand) were derecognized, generating a gain on
disposal of €564 thousand (2007: €21 thousand).
In the fourth quarter of 2008, RLB NÖ-Wien reclassified part of its bond holdings out of the held-for-trading category and into
the held-to-maturity category. This was because the liquidity in the secondary market fell sharply in 2008. As a result, these
positions could only have been reduced by granting unjustifiably large discounts. Reclassifications were therefore the
consequence of a change in RLB NÖ-Wien’s positive intention and ability to hold these financial instruments to maturity and
not just short-term for trading. Use was not made of the option of retrospective reclassification as of 1 July 2008.
Reclassifications took place at fair value as on the date of reclassification.
1 This total includes non-voting non-ownership capital (Partizipationskapital) of Raiffeisen-Holding NÖ-Wien in the amount of €277 thousand (year-end 2007: €277 thousand).
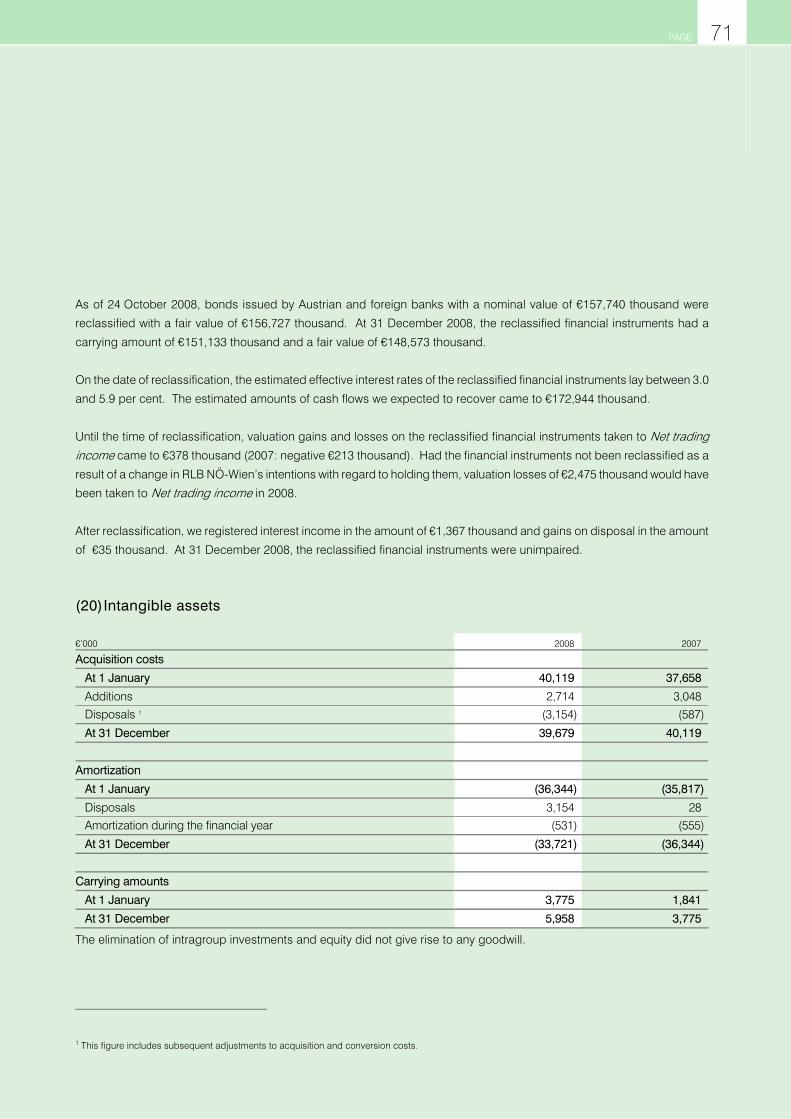
PAGE 71
As of 24 October 2008, bonds issued by Austrian and foreign banks with a nominal value of €157,740 thousand were
reclassified with a fair value of €156,727 thousand. At 31 December 2008, the reclassified financial instruments had a
carrying amount of €151,133 thousand and a fair value of €148,573 thousand.
On the date of reclassification, the estimated effective interest rates of the reclassified financial instruments lay between 3.0
and 5.9 per cent. The estimated amounts of cash flows we expected to recover came to €172,944 thousand.
Until the time of reclassification, valuation gains and losses on the reclassified financial instruments taken to Net trading income came to €378 thousand (2007: negative €213 thousand). Had the financial instruments not been reclassified as a
result of a change in RLB NÖ-Wien’s intentions with regard to holding them, valuation losses of €2,475 thousand would have
been taken to Net trading income in 2008.
After reclassification, we registered interest income in the amount of €1,367 thousand and gains on disposal in the amount
of €35 thousand. At 31 December 2008, the reclassified financial instruments were unimpaired.
(20) Intangible assets
€’000 2008 2007
Acquisition costs
At 1 January 40,119 37,658
Additions 2,714 3,048
Disposals 1 (3,154) (587)
At 31 December 39,679 40,119
Amortization
At 1 January (36,344) (35,817)
Disposals 3,154 28 Amortization during the financial year (531) (555)
At 31 December (33,721) (36,344)
Carrying amounts
At 1 January 3,775 1,841
At 31 December 5,958 3,775
The elimination of intragroup investments and equity did not give rise to any goodwill.
1 This figure includes subsequent adjustments to acquisition and conversion costs.

PAGE 72
(21) Property and equipment
€’000
LAND AND BUILDINGS USED BY THE GROUP FOR
ITS OWN PURPOSES OTHER PROPERTY AND
EQUIPMENT
Acquisition costs
At 1 January 2008 2,088 26,258
Additions 750 2,341 Disposals 1 0 (2,029)
At 31 December 2008 2,838 26,570
Depreciation
At 1 January 2008 (1,341) (17,256)
Additions 0 1
Disposals 0 1,820
Depreciation during the financial year (246) (2,116)
At 31 December 2008 (1,587) (17,551)
Carrying amounts
At 1 January 2008 747 9,002
At 31 December 2008 1,251 9,019
1 This figure includes subsequent adjustments to acquisition and conversion costs.
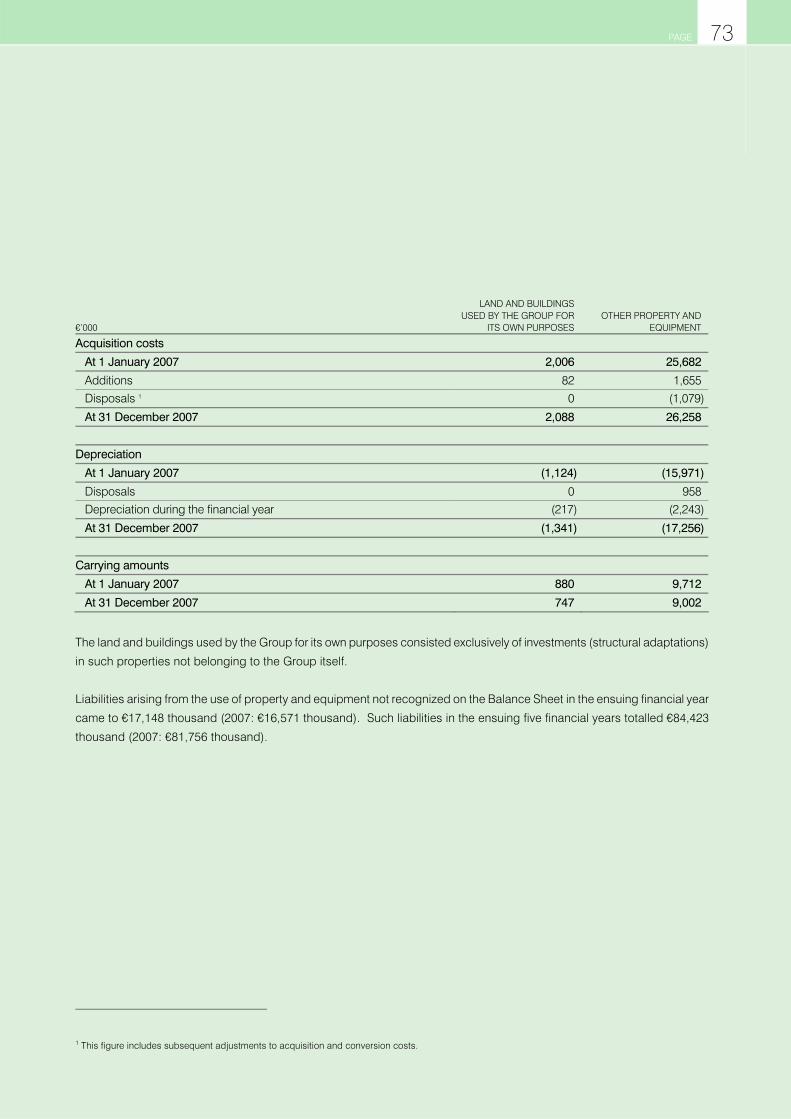
PAGE 73
€’000
LAND AND BUILDINGS USED BY THE GROUP FOR
ITS OWN PURPOSES OTHER PROPERTY AND
EQUIPMENT
Acquisition costs
At 1 January 2007 2,006 25,682
Additions 82 1,655
Disposals 1 0 (1,079)
At 31 December 2007 2,088 26,258
Depreciation
At 1 January 2007 (1,124) (15,971)
Disposals 0 958 Depreciation during the financial year (217) (2,243)
At 31 December 2007 (1,341) (17,256)
Carrying amounts
At 1 January 2007 880 9,712
At 31 December 2007 747 9,002
The land and buildings used by the Group for its own purposes consisted exclusively of investments (structural adaptations)
in such properties not belonging to the Group itself.
Liabilities arising from the use of property and equipment not recognized on the Balance Sheet in the ensuing financial year
came to €17,148 thousand (2007: €16,571 thousand). Such liabilities in the ensuing five financial years totalled €84,423
thousand (2007: €81,756 thousand).
1 This figure includes subsequent adjustments to acquisition and conversion costs.

PAGE 74
(22) Other assets
€’000 2008 2007
Tax assets 20,890 2,015
of which current tax assets 1,470 2,015
of which deferred tax assets 19,420 0
Positive fair values of derivative hedging instruments in fair value hedges 83,651 17,984
of which interest rate derivatives 73,785 15,299 of which equity and index derivatives 9,866 2,685
Positive fair values of derivative hedging instruments in cash flow hedges 26,764 22,579
of which interest rate derivatives 26,764 22,579
Positive fair values of derivative financial instruments designated as at fair value through profit or loss 2,953 14,023
of which interest rate derivatives 1,819 14,002
of which currency derivatives 240 19
of which credit derivatives 894 2
Positive fair values of other derivative financial instruments 350,118 153,512
of which interest rate derivatives 312,735 123,103 of which currency derivatives 15,269 22,834
of which equity and index derivatives 20,445 7,524
of which credit derivatives 1,669 51
Interest accruals arising from derivative financial instruments 228,215 232,787
of which interest rate derivatives 218,583 227,774 of which currency derivatives 7,514 3,300
of which equity and index derivatives 2,112 1,713
of which credit derivatives 6 0
Other assets 142,508 112,339
Total 855,099 555,239
Insofar as they met the requirements for hedge accounting for the purposes of IAS 39, derivative financial instruments were
designated as hedges. The fair values of derivatives were measured without accrued interest (giving clean prices).
In accordance with IAS 39, this line item also includes the positive fair values of derivative financial instruments that were
neither held for trading nor hedging instruments in a fair value or cash flow hedge for the purposes of IAS 39.
The derivative financial instruments designated as at fair value through profit or loss were those derivatives that bore an
economic relationship to securities classified as Other current financial assets within the scope of the fair value option and
were managed on the basis of a documented risk management or investment strategy within the scope of portfolios.

PAGE 75
Deferred tax assets
Tax was deferred as follows:
€’000 2008 2007
Deferred tax assets 19,420 0
Provisions for deferred taxes 0 10,663
Net deferred tax assets/(liabilities) 19,420 (10,663)
Net deferred tax assets/(liabilities) resulted from the following items on the Balance Sheet:
€’000 2008 2007
Intangible assets 1,264 1,770 Other current financial assets 4,925 0
Deposits from customers 4,336 500
Trading liabilities 14,248 0
Other liabilities 109,776 58,328
Provisions 1,203 1,205
Other balance sheet items 12,022 6,160
Deferred tax assets 147,774 67,963
Financial investments 10,419 18,183
Other assets 109,470 40,768
Liabilities evidenced by paper 0 12,488
Other balance sheet items 8,465 7,187
Deferred tax liabilities 128,354 78,626
Net deferred tax assets/(liabilities) 19,420 (10,663)
Assets in the amount of €8,528 thousand (year-end 2007: €2,393 thousand) arising from as yet unused tax loss carry-
forwards and deductible temporary differences were not capitalized in the Consolidated Financial Statements because, as
things stood at the time, it seemed unlikely that it would be possible to realize them within a reasonable period.
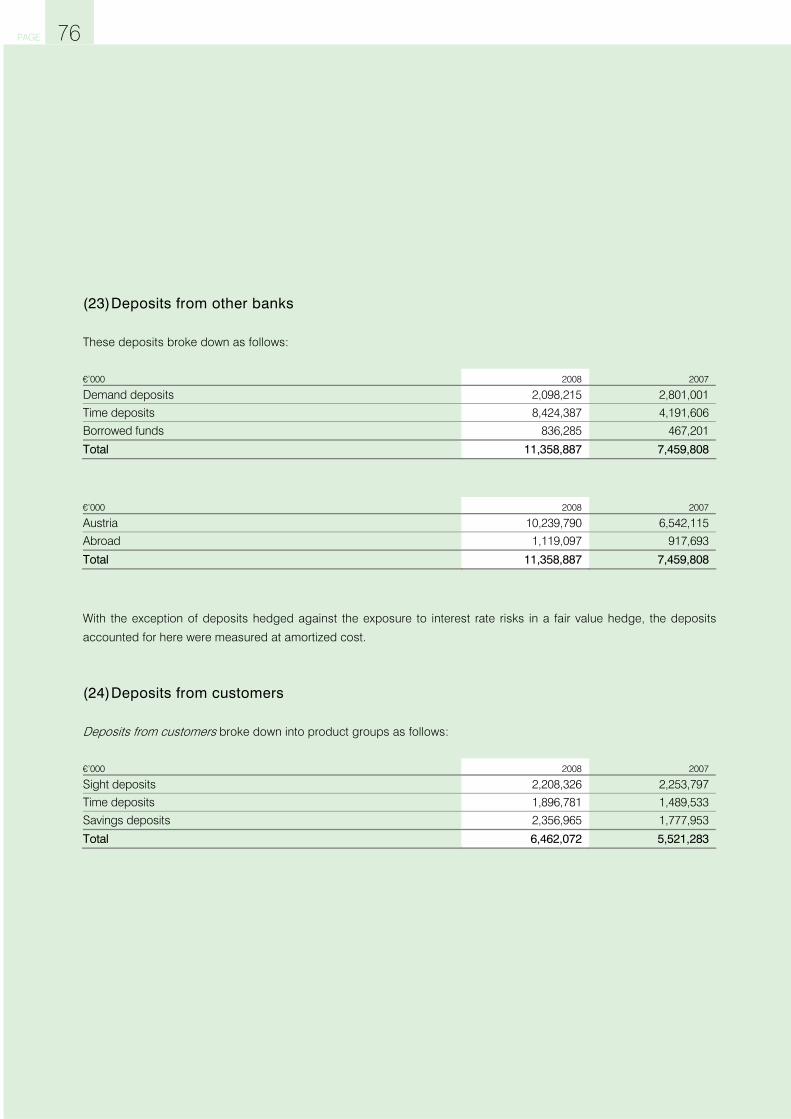
PAGE 76
(23) Deposits from other banks
These deposits broke down as follows:
€’000 2008 2007
Demand deposits 2,098,215 2,801,001
Time deposits 8,424,387 4,191,606
Borrowed funds 836,285 467,201
Total 11,358,887 7,459,808
€’000 2008 2007
Austria 10,239,790 6,542,115 Abroad 1,119,097 917,693
Total 11,358,887 7,459,808
With the exception of deposits hedged against the exposure to interest rate risks in a fair value hedge, the deposits
accounted for here were measured at amortized cost.
(24) Deposits from customers
Deposits from customers broke down into product groups as follows:
€’000 2008 2007
Sight deposits 2,208,326 2,253,797 Time deposits 1,896,781 1,489,533
Savings deposits 2,356,965 1,777,953
Total 6,462,072 5,521,283

PAGE 77
Applying Basel II definitions, Deposits from customers broke down as follows, prior-year figures having been restated
accordingly:
€’000 2008 2007
Sovereigns 688,857 441,731 Retail 3,806,489 2,982,847
Corporates 1,724,283 1,845,329
Other 242,443 251,376
Total 6,462,072 5,521,283
These deposits broke down by region as follows:
€’000 2008 2007
Austria 5,886,188 5,143,844 Abroad 575,884 377,439
Total 6,462,072 5,521,283
With the exception of deposits hedged against the exposure to interest rate risks in a fair value hedge, the deposits
accounted for here were measured at amortized cost.
(25) Liabilities evidenced by paper
€’000 2008 2007
Issued bonds 2,984,240 2,189,804
Other liabilities evidenced by paper 868,361 554,456
Total 3,852,601 2,744,260
With the exception of liabilities hedged against the exposure to interest rate risks in a fair value hedge, the liabilities
accounted for here were measured at amortized cost.

PAGE 78
(26) Trading liabilities
Trading liabilities contains the following derivative instruments held for trading:
€’000 2008 2007
Negative fair values of derivative contracts 1,445,550 268,590
of which interest rate derivatives 1,236,550 200,591 of which currency derivatives 208,400 67,295
of which equity and index derivatives 600 700
of which credit derivatives 0 4
Accruals arising from derivatives 741,852 397,896
of which interest rate derivatives 741,852 397,896
Total 2,187,402 666,486

PAGE 79
(27) Other liabilities
€’000 2008 2007
Tax liabilities 14,892 13,050
of which current tax liabilities 14,892 13,050
Negative fair values of derivative hedging instruments in fair value hedges 81,804 88,184
of which interest rate derivatives 75,342 77,974 of which equity and index derivatives 6,462 10,210
Negative fair values of derivative hedging instruments in cash flow hedges 58,011 19,955
of which interest rate derivatives 58,011 19,955
Negative fair values of derivative financial instruments designated as at fair value through profit or loss 39,440 6,189
of which interest rate derivatives 39,418 6,096
of which equity and index derivatives 22 93
Negative fair values of other derivative financial instruments 349,287 142,063
of which interest rate derivatives 311,977 111,879 of which currency derivatives 12,680 22,655
of which equity and index derivatives 23,337 7,529
of which credit derivatives 1,293 0
Interest accruals arising from derivative financial instruments 221,097 203,413
of which interest rate derivatives 210,158 195,936 of which currency derivatives 9,699 6,459
of which equity and index derivatives 1,232 1,016
of which credit derivatives 8 2
Contractual profit transfer 45,300 63,850
Other liabilities 129,297 67,387
Total 939,128 604,091
Insofar as they met the requirements for hedge accounting for the purposes of IAS 39, derivative financial were designated
as hedges. The fair values of these derivatives were measured without accrued interest (giving clean prices).
In accordance with IAS 39, this line item also includes the negative fair values of derivative financial instruments that were
neither held for trading nor hedging instruments in a fair value or cash flow hedge for the purposes of IAS 39.
The derivative financial instruments designated as at fair value through profit or loss were those derivatives that bore an
economic relationship to securities classified as Other current financial assets within the scope of the fair value option and
were managed on the basis of a documented risk management or investment strategy within the scope of portfolios.

PAGE 80
(28) Provisions
€’000 2008 2007 1
Termination benefits 18,255 17,184
Post-employment benefits 18,767 19,173
Jubilee benefits and part-time work by older staff 3,773 4,267
Taxes 4,261 14,779
of which current 4,261 4,116
of which deferred 0 10,663
Other 21,140 11,099
Total 66,196 66,502
Provisions for staff benefits
Termination benefit obligations changed as follows:
€’000 2008 2007
Present value of the defined benefit obligations at 1 January 19,311 17,548 Obligations assumed without being recognized in the Income Statement (3) 0
Amortization of profit or loss 19 0
Service cost 1,158 1,070
Interest cost 991 797
Termination benefit payments (1,093) (1,335)
Actuarial (gain)/loss in the financial year (1,714) 1,231
Present value of the defined benefit obligations at 31 December 18,669 19,311
Accumulated unrecognized actuarial gains/(losses) (414) (2,127)
Provision balance at 31 December 18,255 17,184
1 Pursuant to the opinion on Fragen der IFRS-Bilanzierung und –Berichterstattung im Zusammenhang mit der Einführung der Gruppenbesteuerung (issues relating to IFRS-compliant accounting and reporting in connection with the introduction of group taxation) published by AFRAC (the Austrian Financial Reporting and Auditing Committee), deferred taxes should be measured applying the current corporation tax rate. The RLB NÖ-Wien Group implemented the contents of this opinion ahead of time as of 1 January 2008. Provisions for deferred taxes recognized in the previous year were restated accordingly.

PAGE 81
Post-employment benefit obligations changed as follows:
€’000 2008 2007
Present value of the defined benefit obligations at 1 January 61,738 59,505 Service cost 1,785 1,463
Interest cost 3,169 2,740
Transferred to defined contribution plan (980) (821)
Payments to beneficiaries (2,840) (2,586)
Actuarial (gain)/loss in the financial year (3,891) 1,438
Present value of the defined benefit obligations at 31 December 58,981 61,738
Plan assets changed as follows:
€’000 2008 2007
Fair value of the plan assets at 1 January 32,412 36,956 Expected return on plan assets 1,853 2,108
Transferred to defined contribution plan (842) (775)
Contributions to plan assets 2,352 776
Retirement benefits paid from plan assets (1,224) (1,122)
Actuarial gain/(loss) in the financial year (1,439) (5,531)
Fair value of the plan assets at 31 December 33,112 32,412
Reconciliation of the present value of the post-employment benefit obligations and the fair value of the plan assets to
recognized provisions:
€’000 2008 2007
Present value of the defined benefit obligations at 31 December 58,981 61,738 Fair value of the plan assets at 31 December 33,112 32,412
Net obligations 25,869 29,326
Accumulated unrecognized actuarial gains/(losses) (7,102) (10,153)
Provision balance at 31 December 18,767 19,173

PAGE 82
Breakdown of post-employment benefit obligations by method of financing:
€’000 2008 2007
Present value of the defined post-employment benefit obligations at 31 December 58,981 61,738
of which directly financed obligations 42,625 16,808
of which financial obligations financed via pension funds and/or insurers 16,356 44,930
The plan assets were structured as follows:
Per cent 2008 2007
Bonds and other fixed-interest securities 70.76 62.45 Shares and other variable-yield securities 16.24 29.73
Property 1.15 1.28
Other 11.85 6.54
Total 100.00 100.00
The plan assets did not include any financial instruments issued by the RLB NÖ-Wien Group or other assets utilized by the
RLB NÖ-Wien Group.
Return on the plan assets:
€’000 2008 1 2007
Actual return on the plan assets (3,038) 30
Provisions for jubilee benefits and part-time work by older staff changed as follows:
€’000 2008 2007
Present value of the defined benefit obligations at 1 January 4,267 4,330 Service cost 240 255
Interest cost 209 189
Payments (624) (676)
Actuarial (gain)/loss in the financial year (319) 169
Present value of the defined benefit obligations at 31 December 3,773 4,267
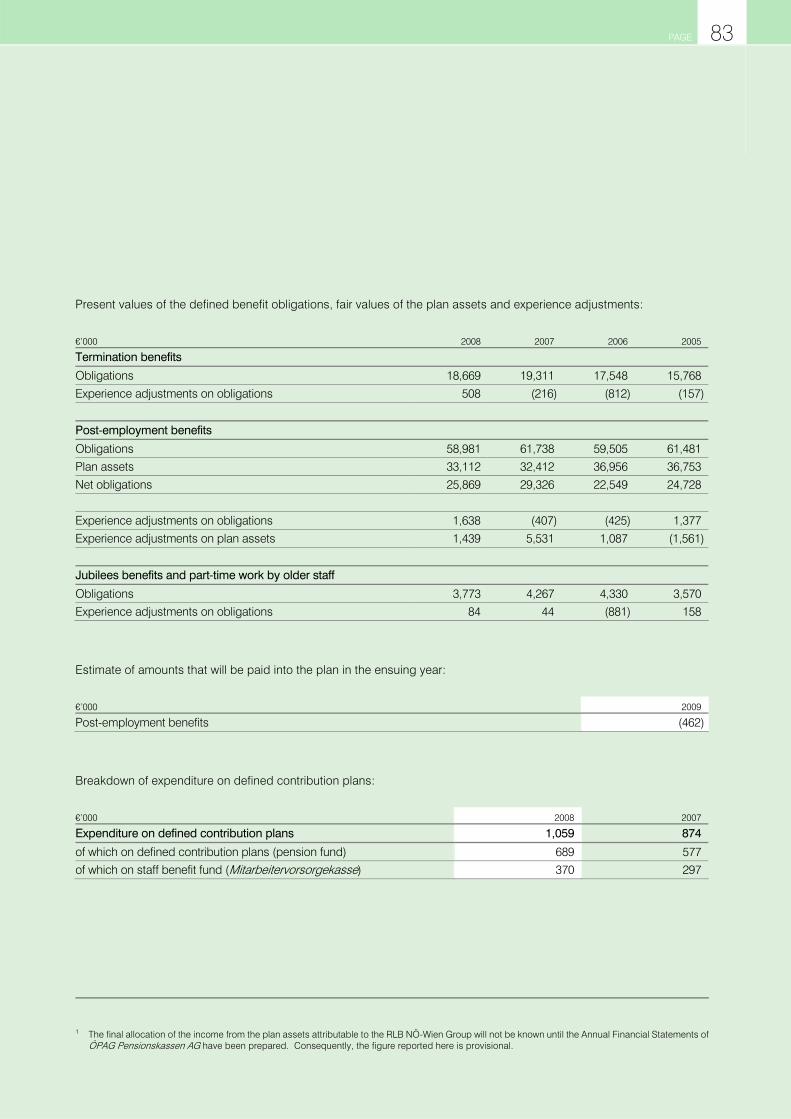
PAGE 83
Present values of the defined benefit obligations, fair values of the plan assets and experience adjustments:
€’000 2008 2007 2006 2005
Termination benefits
Obligations 18,669 19,311 17,548 15,768
Experience adjustments on obligations 508 (216) (812) (157)
Post-employment benefits
Obligations 58,981 61,738 59,505 61,481 Plan assets 33,112 32,412 36,956 36,753
Net obligations 25,869 29,326 22,549 24,728
Experience adjustments on obligations 1,638 (407) (425) 1,377
Experience adjustments on plan assets 1,439 5,531 1,087 (1,561)
Jubilees benefits and part-time work by older staff
Obligations 3,773 4,267 4,330 3,570 Experience adjustments on obligations 84 44 (881) 158
Estimate of amounts that will be paid into the plan in the ensuing year:
€’000 2009
Post-employment benefits (462)
Breakdown of expenditure on defined contribution plans:
€’000 2008 2007
Expenditure on defined contribution plans 1,059 874
of which on defined contribution plans (pension fund) 689 577 of which on staff benefit fund (Mitarbeitervorsorgekasse) 370 297
1 The final allocation of the income from the plan assets attributable to the RLB NÖ-Wien Group will not be known until the Annual Financial Statements of ÖPAG Pensionskassen AG have been prepared. Consequently, the figure reported here is provisional.

PAGE 84
Other provisions
The other provisions changed as follows:
€’000 2008 2007
At 1 January 11,099 12,626 Added 16,969 2,102
Released (3,199) (3,326)
Used (3,729) (303)
At 31 December 21,140 11,099
(29) Subordinated debt capital
€’000 2008 2007
Measured at amortized cost 698,568 530,348
Subordinated debt 253,095 199,300 Supplementary capital 368,973 331,048
Non-voting non-ownership capital (Partizipationskapital) 76,500 0
Designated as at fair value through profit or loss 48,540 59,674
Subordinated debt 48,540 59,674
Total 747,108 590,022
Genussrechte (profit-share certificates) furnished for an indefinite term but with the possibility of termination are included in
this line item as subordinated debt designated as at fair value through profit or loss. These profit-share certificates evidence
a contractual right to a portion of the assets in a specially created portfolio that is likewise designated as at fair value
through profit or loss and is recognized in the line item Other current financial assets. In the event of termination, the
repayment amount will be the fair value and, therefore, the carrying amount reported here. Changes in the fair value thereof
are attributable in their entirety to changes in the fair value of the assets in the portfolio.
With the exception of liabilities hedged against the exposure to interest rate risks in a fair value hedge, the other liabilities
accounted for here were measured at amortized cost.
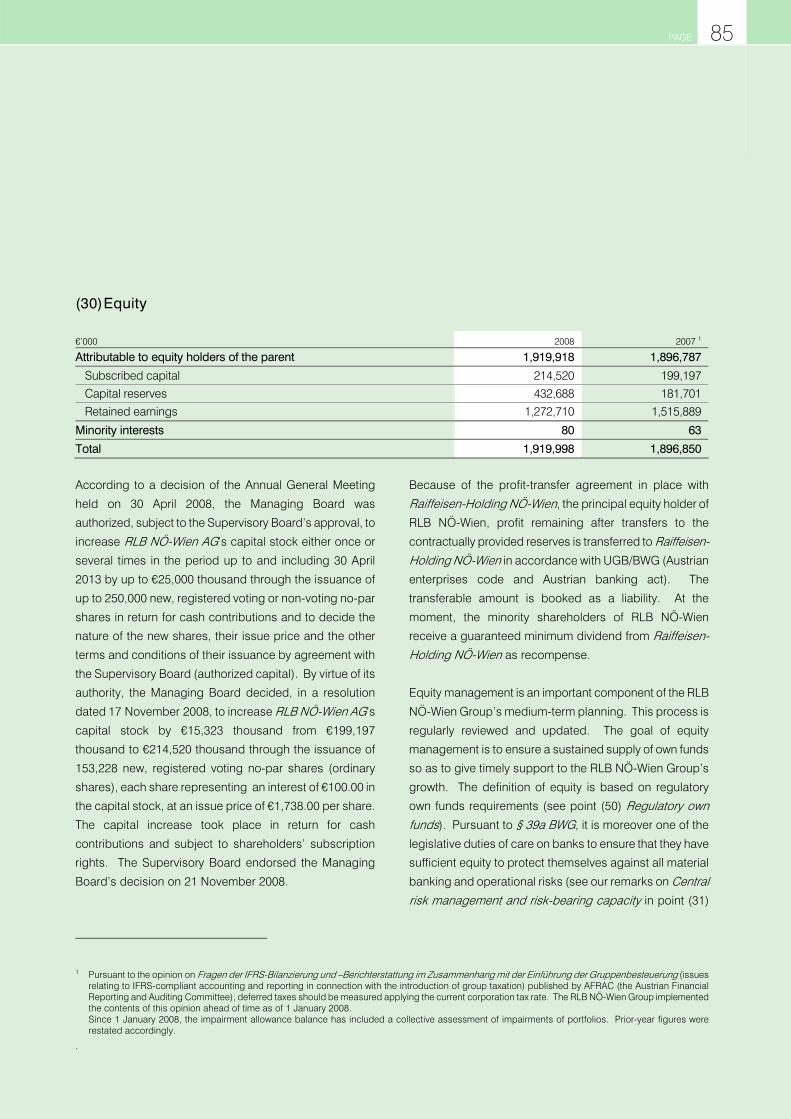
PAGE 85
(30) Equity
€’000 2008 2007 1
Attributable to equity holders of the parent 1,919,918 1,896,787
Subscribed capital 214,520 199,197
Capital reserves 432,688 181,701
Retained earnings 1,272,710 1,515,889
Minority interests 80 63
Total 1,919,998 1,896,850
1 Pursuant to the opinion on Fragen der IFRS-Bilanzierung und –Berichterstattung im Zusammenhang mit der Einführung der Gruppenbesteuerung (issues relating to IFRS-compliant accounting and reporting in connection with the introduction of group taxation) published by AFRAC (the Austrian Financial Reporting and Auditing Committee), deferred taxes should be measured applying the current corporation tax rate. The RLB NÖ-Wien Group implemented the contents of this opinion ahead of time as of 1 January 2008. Since 1 January 2008, the impairment allowance balance has included a collective assessment of impairments of portfolios. Prior-year figures were restated accordingly.
.
According to a decision of the Annual General Meeting
held on 30 April 2008, the Managing Board was
authorized, subject to the Supervisory Board’s approval, to
increase RLB NÖ-Wien AG’s capital stock either once or
several times in the period up to and including 30 April
2013 by up to €25,000 thousand through the issuance of
up to 250,000 new, registered voting or non-voting no-par
shares in return for cash contributions and to decide the
nature of the new shares, their issue price and the other
terms and conditions of their issuance by agreement with
the Supervisory Board (authorized capital). By virtue of its
authority, the Managing Board decided, in a resolution
dated 17 November 2008, to increase RLB NÖ-Wien AG’s capital stock by €15,323 thousand from €199,197
thousand to €214,520 thousand through the issuance of
153,228 new, registered voting no-par shares (ordinary
shares), each share representing an interest of €100.00 in
the capital stock, at an issue price of €1,738.00 per share.
The capital increase took place in return for cash
contributions and subject to shareholders’ subscription
rights. The Supervisory Board endorsed the Managing
Board’s decision on 21 November 2008.
Because of the profit-transfer agreement in place with
Raiffeisen-Holding NÖ-Wien, the principal equity holder of
RLB NÖ-Wien, profit remaining after transfers to the
contractually provided reserves is transferred to Raiffeisen-Holding NÖ-Wien in accordance with UGB/BWG (Austrian
enterprises code and Austrian banking act). The
transferable amount is booked as a liability. At the
moment, the minority shareholders of RLB NÖ-Wien
receive a guaranteed minimum dividend from Raiffeisen-Holding NÖ-Wien as recompense.
Equity management is an important component of the RLB
NÖ-Wien Group’s medium-term planning. This process is
regularly reviewed and updated. The goal of equity
management is to ensure a sustained supply of own funds
so as to give timely support to the RLB NÖ-Wien Group’s
growth. The definition of equity is based on regulatory
own funds requirements (see point (50) Regulatory own funds). Pursuant to § 39a BWG, it is moreover one of the
legislative duties of care on banks to ensure that they have
sufficient equity to protect themselves against all material
banking and operational risks (see our remarks on Central risk management and risk-bearing capacity in point (31)

PAGE 86
Risks arising from financial instruments [Risk Report]). There were no material changes in the equity management
process compared with the previous year. The new capital
adequacy requirements in Basel II have been satisfied
since 1 January 2008. The minimum legislative
requirements contained in BWG were adhered to
throughout the financial year at both bank and group level
at Raiffeisen-Holding NÖ-Wien.

PAGE 87
(31) Risks arising from financial instruments (Risk Report)
Disclosures of the nature and extent of risks arising from
financial instruments in accordance with IFRS 7 (B6) are
contained in the following notes on financial instruments.
Risk policy and risk management
The integrated risk management process at RLB NÖ-Wien
is based on the risk policy laid down by the Managing
Board and on the accompanying strategies. Risk policy
also includes the approval of risk management principles,
the setting of limits for every relevant risk and risk
monitoring procedures.
The professional management of the risks arising from
financial instruments is a core task and, therefore, a
decisive competitive factor for every bank. The ability of a
financial institution to capture and measure all material
risks and to monitor and manage them on a real-time
basis is paramount. RLB NÖ-Wien therefore sees risk
management as a proactive corporate function. The
primary focus is on optimizing risk and returns; in other
words, on “managing opportunities and risks” and not just
on “managing risks.” Subject to the needs of customer-
orientated banking operations within the framework of RLB
NÖ-Wien’s Advisor Bank concept and to the requirements
of the legislative environment, RLB NÖ-Wien’s risk policy
and risk strategy are shaped by its conservative handling
of banking and operational risks.
Risk management and risk controlling
RLB NÖ-Wien employs well-established methods of risk
management and risk controlling to ensure the bank’s
profitability and security in the interests of its customers
and its equity holders.
RLB NÖ-Wien’s risk management activities are based on
clear responsibilities. Risk policy is an integral part of the
bank’s central management procedures, so earnings and
risk management in all business divisions are
systematically interlinked. All relevant risks in the Bank are
captured and subjected to an optimized strategic
management process taking account of the Bank’s own
funds position and other covering assets.
Risk controlling and risk management units and special
committees that act independently from front-office units
support the Managing Board in the performance of its risk-
related tasks. The working committee that analyzes the
Bank’s risk position and makes strategic risk decisions is
called the Central Risk Committee (Gesamtbank-risikorunde). The Bank’s overall risk position is evaluated
on the basis of analysis of its risk-bearing capacity.
Strategic risk decisions encompass the limits systems for
the bank as a whole and for individual business divisions,
and they also include the formulation of risk policy and the
introduction of new risk measurement systems as well as
the identification and valuation of standard credit risk
costs. The Central Risk Committee comprises the
Managing Board member responsible for the Risk
Management and Organization Division, the Head of
Credit Risk Management and the heads of the main
departments that take risks, the Head of Accounts and
Controlling and the Head of Internal Audit under the
leadership of the Head of the Central Risk Department.
This committee meets quarterly. Final decisions are made
during meetings of the Managing Board and presented to
the Supervisory Board by the Managing Board member
responsible for risk on a quarterly basis.
The Central Risk Department (GBR: Gesamtbankrisiko) is
part of the Risk Management and Organization Division. It
reports directly to the responsible member of the
Managing Board. This ensures that the Central Risk
Department acts independently from front-office divisions.
It is where all the pertinent risk analysis activities such as
NOTES ON FINANCIAL INSTRUMENTS

PAGE 88
credit, market, liquidity, equity, equity investment and
operational risk analysis converge. Within the scope of the
risk controlling process, the Treasury Mid-Office
Department — also a part of the Risk Management and
Organization Division and therefore independent from the
Treasury Department — carries out evaluations, checks
adherence to limits and analyzes and reports on trading
books on a daily basis and passes the results on to the
Managing Board. Market risk limits for the banking book
are likewise monitored and analyzed on a daily basis. The
continuous monitoring of risks is one of the core tasks of
the Central Risk Department. On this basis, the various
individual risks (including, in particular, credit, equity
investment, market, liquidity and operational risks) are
presented in an overall, aggregated view within the scope
of the risk-bearing capacity analysis process.
All the tasks, bodies, reports, procedures and
organizational units involved in the risk management
process are defined and described in detail in the
Raiffeisen Holding Group’s Risk Management Manual
(Handbuch Risikomanagement). It is updated annually by
the Central Risk Department jointly with Credit Risk
Management and the Group Controlling and Risk
Management Department at Raiffeisen-Holding NÖ-Wien and adopted by the Managing Board of RLB NÖ-Wien and
the management of Raiffeisen-Holding NÖ-Wien. This
ensures that a coordinated process is in place within the
Bank to capture, limit, measure, report and document
risks.
As an integral part of the risk controlling and risk
management system, the Internal Audit Department of RLB
NÖ-Wien audits the effectiveness of RLB NÖ-Wien’s
internal control system. The Internal Audit Department’s
principal task is to audit and assess the effectiveness of
workflows, processes and internal controls. The Internal
Audit Department works without specific instructions,
acting on the orders of RLB NÖ-Wien’s Managing Board.
This means that this department’s audit procedures are
carried out by staff members who are not involved in
operational workflows and, therefore, are not responsible
for the results of the processes being monitored. This
ensures that evaluations and recommendations are
objective.
Central risk management and risk-bearing capacity
RLB NÖ-Wien’s central risk management procedures
involve measuring the bank’s existing sources of risk-
bearing capacity (profit, equity and hidden reserves)
against all the material risks (including, in particular, credit,
market, liquidity, equity, equity investment and operational
risks). These are captured using well-established methods
and employing appropriate systems. The Bank’s risks are
subdivided into three scenarios (normal case, problem
case and extreme case). Covering assets are divided into
four pools, with covering assets in pools one to three
earmarked to cover the risks assumed within the scope of
the three risk scenarios. The ring-fenced cover pool No. 4
is reserved to ensure RLB NÖ-Wien’s continued existence
as a going concern in an extreme, crisis situation. The
intention is to demonstrate that, given the assumptions
that have been made, sufficient covering assets will be
available even in an unlikely extreme situation. The Bank’s
risk-bearing capacity sets a ceiling on its aggregated
overall bank risk. Detailed risk limits laid down for
individual segments are also taken into account. As is
consistent with the main focuses of RLB NÖ-Wien’s
business activities, credit risks and market risks are at the
forefront of its risk management activities. Because of
their materiality, due attention is also given to the equity
investment risks arising from equity investments in
banking-related fields.
Market risk in the trading and banking books is measured
on the basis of value at risk (VaR: the value at risk is the
potential for loss with a given probability over a specified
holding period). Unexpected credit risk losses are
assessed and analyzed both on a value at risk basis (for

PAGE 89
problem cases) and using scenario techniques (for
extreme cases). Appropriate attention is also paid to
settlement risk within the scope of credit risk, applying a
suitable limits system, developing and extending netting
agreements and settling transactions using settlement
platforms. Equity investment risks are measured on the
basis of expert assessments that cover both problem
cases and extreme cases.
The central risk management process also captures
liquidity and operational risks.
As we have said, the central instrument that brings
together and plots all risk-related information is the
quarterly analysis of the Bank’s risk-bearing capacity. This
analysis is the starting point for our risk policy, which limits
risky activities to a level that is appropriate to the Bank.
Credit risk
RLB NÖ-Wien defines credit risk as the risk that it might
suffer a loss if a customer or counterparty fails to
discharge a contractual obligation. On the one hand,
credit risk arises from traditional lending operations (loan
losses, with the consequent management of the loan
exposure in response to any decline in creditworthiness).
On the other, it results from trading in and acquiring
market risk instruments (counterparty default risk in the
case of derivatives).
Country risks are also taken into account when capturing
credit risk. Country risk is the risk of default caused by
sovereign action by a state and default by sovereign
debtors. This risk is limited separately. The counterparty
risk associated with derivatives operations is also deemed
to belong to this risk category.
RLB NÖ-Wien sees itself as a financier operating in the
Centrope region, which is also one of the focuses of its
business activities. RLB NÖ-Wien offers its customers all
the usual credit products. As part of the strategic credit
management process, the Managing Board formulates
and implements all of the Bank’s strategic goals and
actions according to the risks concerned within the scope
of a credit risk strategy. This strategy is an integral part of
the Bank’s corporate and segmental strategies and
interacts with all other (sub-)strategies. It also specifies
the segments within the Bank where loans can be granted
and defines which products can be used to this end.
Credit risk is a major component of risk at RLB NÖ-Wien.
Consequently, Credit Risk Management (KRM), a main
department, has been created to service sales units. Its
tasks are to provide support and to perform a controlling
role during the measurement and management of credit
risk and to take on the management of problem loans.
Credit risk is handled by Credit Risk Management (KRM).
Its activities range from checking exposures before an
application is made to handling crises to minimizing
damage in the event of insolvency. Refining the Raiffeisen rating system and the scoring model is also one of this
main department’s remits.
Credit risks at RLB NÖ-Wien are monitored and analyzed
both loan-by-loan for each customer and on a portfolio
basis. Credit risk management and credit decisions are
based on the risk policy approved by the Managing Board
of RLB NÖ-Wien. Lending principles are laid down in
writing in our Risk Policy Handbook and in our Risk
Management Manual, which, in particular, contain
business policy statements regarding credit scoring,
collateral and return and risk requirements.
To safeguard its sustained market presence, RLB NÖ-
Wien has an extensive credit limits system at the level of
the Bank as a whole and spanning banks, countries and
corporate customers. When looking at individual
exposures, care is taken to ensure that the Bank’s
approval ceilings are kept below regulatory limits. This

PAGE 90
means that if exposures are greater than or equal to 7.5
per cent of RLB NÖ-Wien’s own funds, they will already be
submitted to the Supervisory Board for approval even
though this is not a legislative requirement.
The risk content of an exposure is captured using an
extensive rating system. Various model variants are
employed, depending on what is required in the customer
segment in question. When assessing creditworthiness,
RLB NÖ-Wien employs the nationally developed Raiffeisen
rating system as well as an additional scoring model for
personal banking customers so as to classify risks and
gauge default risk. The rating models use ten credit
quality classes and ten collateral classes, satisfying the
requirements of Basel II.
The credit process and the involvement of experts from
Credit Risk Management and Credit Back Office, both
main departments, encompass every necessary form of
monitoring measure. Such measures are built directly or
indirectly into the workflows being monitored. Before a
loan involving a risky exposure is approved, the Material
Credit Control Department, the organizational unit Country
and Bank Analysis and, in the case of corporate
customers, the Balance Sheet and Corporate Analysis
Department, are integrated into exposure assessment
procedures as part of the credit risk management process.
Alongside the determination of internal ratings within the
scope of the loan approval process, collateral values are
also checked based on a set collateral assessment
catalogue containing predefined risk charges. This
catalogue is regularly reviewed and revised. Collateral is
captured within the scope of a separate collateral
management system and continuously readjusted. RLB
NÖ-Wien’s derivatives operations are integrated into the
existing limits system. The Financial Services Department
(FIS) performs daily collateral management in connection
with these operations. In risk areas, assessments are
subjected to institutionalized plausibility checks in the
course of the loan application process. The updating of
internal ratings and the investigation and analysis of risk
positions both take place at regular intervals.
The routine updating of ratings also includes regular
evaluation of the need for any impairment allowances.
Direct loan receivables that are highly unlikely to be
recoverable must be revalued, taking furnished collateral
into account, and/or provision must be made for claims
under loans covering commitments. RLB NÖ-Wien has a
default database that allows it to evaluate and analyze key
risk parameters even more effectively. According to Basel II, a loan is overdue if a repayment (instalment) is past due
for more than 90 days.
Besides portfolio data, the Credit Risk Report prepared by
Credit Risk Management, a main department, also shows
movements within the portfolio (migration analysis).
Together with the results of risk-bearing capacity analysis,
this provides the basis for appropriate steering and other
measures.
The expected loss and the available collateral are mirrored
by the Bank’s standard risk costs. Together with liquidity,
own funds and unit costs, they are key parameters in RLB
NÖ-Wien’s internal performance calculations, which are
prepared on a market interest rate basis. Taking these
factors into account places the necessary emphasis on the
relationship between risk and return.
Various analyses of the Bank’s current risk profile are fixed
components of its reporting activities. When calculations
are performed, separate allowance is made for the
differing risk contents of the Bank’s various lending
activities.
The management of problem exposures is taken over by a
separate organizational unit called Special Management
(Sondergestion). Liquidations and the associated

PAGE 91
realization of collateral become the responsibility of the
Risk Management Department (Risikoverwaltung).
Against the backdrop of the financial markets crisis and its
effects, RLB NÖ-Wien has set up a special Problem
Exposures Task Force. This group operates under the
Head of Credit Risk Management, which is a main
department. It is made up of members of both front-office
and banking and back-office units. Its role is to ensure
that crisis events (Iceland exposure, Lehman exposure,
etc.) are monitored, processed and settled and that debts
are collected. This body meets at least every 14 days.
Aggregated credit risk at an overall portfolio level is
measured and managed using a portfolio model on the
basis of credit value at risk. RLB NÖ-Wien’s credit value at
risk is calculated using Monte Carlo simulations. This task
is carried out by the Central Risk Department (GBR). The
credit value at risk is brought into the Bank’s problem-case
risk-bearing capacity analysis process. When calculating
credit value at risk within the scope of risk-bearing
capacity analysis, RLB NÖ-Wien bases its calculations on
a risk horizon of one year and a problem case confidence
interval of 95 per cent. In extreme cases, expert valuations
are obtained.

PAGE 92
The table below provides a breakdown of loans (credit exposures inclusive of guarantees and the positive fair values of
derivatives) applying RLB NÖ-Wien’s internal ratings (in thousands of euros):
INTERNAL RATING 2008 PER CENT 2007 PER CENT
0.5 Minimal risk 965,879 3.7 513,993 2.8 1 Excellent credit standing 5,660,122 21.5 4,625,756 25.2
1.5 Very good credit standing 11,893,781 45.2 7,601,762 41.4
2 Good credit standing 2,666,236 10.1 1,979,860 10.8
2.5 Average credit standing 1,790,385 6.8 1,006,857 5.5
3 Mediocre credit standing 1,462,747 5.6 1,067,819 5.8
3.5 Weak credit standing 905,460 3.4 492,754 2.7
4 Very weak credit standing 399,834 1.5 400,353 2.2
4.5 Doubtful/high default risk 220,324 0.8 155,831 0.8
5 Default 155,618 0.6 166,260 0.9
Unrated 201,553 0.8 353,518 1.9
Total 26,321,939 100.0 18,364,763 100.0
Based on the table above, item-by-item charges for impairment losses broke down as follows: Charges in the range from
0.5 to 3.0 (Minimal risk to Mediocre credit standing) came to €6,925 thousand in 2008, the equivalent figure for 2007 having
been €20,621 thousand. Item-by-item charges for impairment losses in the rating classes 3.5, 4.0, 4.5 and 5.0 came to
€17,600 thousand, €40,426 thousand, €67,290 thousand and €102,151 thousand, respectively, the equivalent
figures for these rating classes in 2007 having been €17,083 thousand, €39,617 thousand, €43,931 thousand and
€117,469 thousand. No item-by-item charges for impairment losses in connection with unrated customers were required in
2007, but item-by-item charges for impairment losses in respect of unrated customers came to €576 thousand in 2008.

PAGE 93
The following table presents RLB NÖ-Wien’s loan exposure net of impaired and past due accounts (in thousands of
euros):
INTERNAL RATING 2008 PER CENT 2007 PER CENT
0.5 Minimal risk 965,879 3.7 513,992 2.9 1 Excellent credit standing 5,659,397 21.9 4,623,502 25.8
1.5 Very good credit standing 11,891,469 46.0 7,595,962 42.4
2 Good credit standing 2,661,519 10.3 1,941,014 10.8
2.5 Average credit standing 1,764,692 6.8 985,724 5.5
3 Mediocre credit standing 1,445,011 5.6 1,005,455 5.6
3.5 Weak credit standing 850,102 3.3 443,364 2.5
4 Very weak credit standing 322,571 1.3 329,547 1.8
4.5 Doubtful/high default risk 83,387 0.3 102,387 0.6
5 Default 30,681 0.1 22,615 0.1
Unrated 188,473 0.7 351,953 2.0
Total 25,863,181 100.0 17,915,515 100.0
The following table presents total loans and advances and financial investments that entailed credit risk:
€’000 LOANS AND ADVANCES TO
CUSTOMERS LOANS AND ADVANCES TO
OTHER BANKS FINANCIAL INVESTMENTS
2008 2007 2008 2007 2008 2007
Loan exposure 8,514,312 6,883,089 8,923,998 5,295,082 2,965,413 1,811,170

PAGE 94
Appropriate impairment losses were also recognized on problem exposures and exposures placed under observation (non-
performing loans). By region, customer exposures thus broke down as follows:
AUSTRIA CENTROPE REGION REST OF EU OTHER
€’000 2008 2007 2008 2007 2008 2007 2008 2007
Financial Institutions 4,333,570 3,117,909 84,618 53,580 862,079 350,154 299,881 228,272 Non-performing loans 0 0 0 0 0 0 13,102 0
Charge for impairment losses on loans and advances 0 0 0 0 0 0 12,230 0
Corporate Customers 5,260,258 4,193,041 379,714 188,294 559,381 262,595 368,482 342,637 Non-performing loans 162,952 183,288 0 1,368 7,062 16,481 1,888 0
Charge for impairment losses on loans and advances 129,564 139,364 0 0 0 5,995 1,664 1,359
Retail Customers 1,373,044 1,328,179 3,453 2,862 19,905 17,107 13,159 14,150
Non-performing loans 95,717 145,546 214 90 248 310 274 450
Charge for impairment losses on loans and advances 90,165 91,946 17 48 1,108 56 219 565
Sovereigns 392,848 310,620 0 0 0 0 56 81 Non-performing loans 0 0 0 0 0 0 0 0
Charge for impairment losses on loans and advances 0 0 0 0 0 0 0 0

PAGE 95
The following table presents RLB NÖ-Wien’s past due customer balances (in thousand of euros):
INTERNAL RATING 2008 PER CENT 2007 PER CENT
0.5 Minimal risk 0 0 0 0 1 Excellent credit standing 681 0.3 2,255 0.7
1.5 Very good credit standing 1,276 0.5 4,668 1.4
2 Good credit standing 2,853 1.1 38,644 11.4
2.5 Average credit standing 21,263 8.6 19,770 5.8
3 Mediocre credit standing 11,965 4.8 49,475 14.6
3.5 Weak credit standing 17,091 6.9 37,974 11.2
4 Very weak credit standing 26,028 10.5 39,063 11.5
4.5 Doubtful/high default risk 68,590 27.7 22,058 6.4
5 Default 97,895 39.5 124,458 36.7
Unrated 243 0.1 972 0.3
Total 247,885 100.0 339,337 100.0

PAGE 96
At the end of the 2008 financial year, impairment losses had not been recognized on past due customer balances totalling
€67,879 thousand (year-end 2007: €126,074 thousand). The table below provides a breakdown by past due period of the
past due credit exposures for which impairment losses had not been recognized:
PAST DUE 2008 PER CENT 2007 PER CENT
up to 30 days 28,055 41.3 25,970 20.6
31 – 60 days 4,242 6.3 34,740 27.6
61 – 90 days 5,372 7.9 4,644 3.7
> 90 days 30,210 44.5 60,720 48.2
Total 67,879 100.0 126,074 100.0
At year-end 2008, the proportion of real estate loans in RLB NÖ-Wien’s total loan portfolio was high at €2,839,643 thousand
(year-end 2007: €2,143,537 thousand).
2008 2007
CATEGORY AUSTRIA PER CENT ABROAD PER CENT AUSTRIA PER CENT ABROAD PER CENT
Residential (subsidized) 461,503 20.1 — — 322,384 18.1 3,938 1.1
Residential (financed without subsidies) 780,638 34.1 85,685 15.6 589,086 33.1 9,680 2.7
Commercial (tourism) 97,623 4.3 93,588 17.1 61,051 3.4 92,994 25.7
Commercial (shopping centres) 170,690 7.4 106,527 19.4 89,666 5.0 58,306 16.1
Commercial (offices) 272,278 11.9 98,793 18.0 255,388 14.3 40,828 11.3
Other 508,065 22.2 164,252 29.9 464,086 26.1 156,129 43.1
Total 2,290,797 100.0 548,845 100.0 1,781,661 100.0 361,875 100.0

PAGE 97
At year-end 2008, most of the real estate loan exposure, namely 80.7 per cent, was Austrian (year-end 2007: 80.7 per cent).
Just 19.3 per cent was foreign (year-end 2007: 19.3 per cent). A breakdown of this foreign real estate loan exposure shows
a predominance of the Centrope region.
0 50,000 100,000 150,000 200,000 250,000 300,000
Czeck Republic
Hungary
Slovakia
Italy
Netherlands
Canada
USA
Poland
Germany
Romania
Switzerland
Egypt
20082007
Centrope= 78.6% (2007: 73.7%)

PAGE 98
RLB NÖ-Wien monitors its risk concentrations within the scope of country risk measurements and limits them by way of
special country limits. At the end of 2008, 98.8 per cent of the approved country exposures were in investment grade
classes and a total of 93 per cent were assigned to one of the three best rating classes (0.5 to 1.5).
The chart below shows the percentage distribution of country limits based on internal ratings in the 2008 financial year and,
by way of comparison, in 2007:
0.0% 10.0% 20.0% 30.0% 40.0% 50.0% 60.0% 70.0% 80.0%
4.0
3.5
3.0
2.5
2.0
1.5
1.0
0.5
Inte
rnal
Rat
ing
20082007
Investment Grade= 98.8% (2007: 98.9%)

PAGE 99
Subsequently, we also look at the regional distribution of country limits. The charts below shows the percentage distribution
of country limits in 2008 and 2007. Best-rated non-EU countries includes countries like the United States, Japan and
Singapore with Moody’s ratings of at least Aa3.
We monitor branch and industry concentrations with the help of regular sector and industry analyses.
The following charts provide breakdowns of the Bank’s loan exposures by sector and industry group (in per cent):
1 Within the meaning of Austria’s Gewerbeordnung (commercial code). Given the specific nature of some of the terms used in this breakdown, the reader is
advised to refer to the German original if greater precision is required.
2008
18%
67%
5%
1%2%2%
2%3%
2007
18%
4%
1%2%1%
1%3%
70%
2008
18%
67%
5%
1%2%2%
2%3%
2008
18%
67%
5%
1%2%2%
2%3%
2007
18%
4%
1%2%1%
1%3%
70%
2007
18%
4%
1%2%1%
1%3%
70%
EU 15Other new EU Member States
Other RegionsNear East
Non-EU Eastern European and CIS countriesAsia
Best-rated non-EU countriesCentrope Region
EU 15Other new EU Member States
Other RegionsNear East
Non-EU Eastern European and CIS countriesAsia
Best-rated non-EU countriesCentrope Region
2008
18.4%
4.4% 2.2%1.4%
3.5%4.0%
3.4%3.0%
2.4%
3.5%1.3%
0.4%0.5%
51.6%
2007
13.4%
1.9%
5.5%1.9%1.5%
5.4%
3.9%
5.3%
4.0%
2.5%
4.7%
48.5%
0.7%0.7%
2008
18.4%
4.4% 2.2%1.4%
3.5%4.0%
3.4%3.0%
2.4%
3.5%1.3%
0.4%0.5%
51.6%
2007
13.4%
1.9%
5.5%1.9%1.5%
5.4%
3.9%
5.3%
4.0%
2.5%
4.7%
48.5%
0.7%0.7%
Federal government and provincesHolding companiesTourismGewerbe 1
Trade
IndustryLeasing companies
Self-employed borrowers
Other corporate customersJobholdersResidential constructionBanks
Public corporationsContract Insurers
Federal government and provincesHolding companiesTourismGewerbe 1
Trade
IndustryLeasing companies
Self-employed borrowers
Other corporate customersJobholdersResidential constructionBanks
Public corporationsContract Insurers

PAGE 100
When assessing the country and bank risks captured by
credit risk evaluations, RLB NÖ-Wien draws, inter alia,
upon the professional support of RZB’s Country and Bank
Risk Management Department. Among other things, the
resulting country ratings provide the basis for RLB NÖ-
Wien’s own country limits system. RLB NÖ-Wien’s
maximum limits system, likewise based on RZB’s country
ratings, is binding on every organizational unit within the
enterprise. In 2008, exposures to other banks were
subjected to additional, detailed scrutiny in the wake of the
financial markets crisis. The resulting risks were also
brought into the assessment of overall bank risk within the
scope of the risk-bearing capacity analysis process.
RLB NÖ-Wien has reached contractual agreements
regarding security in the form of guarantees and other
assets with its customers in the corporate customers and
retail banking segments. When assessing security, the
Bank takes account of its type, quality and realizability and
the duration of realization by carrying out appropriate
write-downs on such security.
The following table presents the structure of security given to RLB NÖ-Wien (in thousands of euros):
CATEGORY OF SECURITY 2008 PER CENT 2007 PER CENT
Land register 2,194,648 35.7 1,723,001 34.9
Securities 224,777 3.7 403,977 8.2
Financial products 962,233 15.7 251,346 5.1
Insurance 147,011 2.4 137,578 2.8
Other rights and claims 493,814 8.0 308,194 6.2
Guarantees 2,116,475 34.5 2,109,267 42.8
Total 6,138,958 100.0 4,933,363 100.0
RLB NÖ-Wien’s statistical data only capture loan
exposures arising within the scope of debt restructuring
and the associated redefinition of terms and conditions if
impairment allowances have already become necessary.
RLB NÖ-Wien does not purchase any collateral directly
from customers. If collateral cannot immediately be
realized, the Bank has subsidiaries through which such
transactions take place. Any proceeds from the realization
of collateral will be netted off against the corresponding
loan accounts. The relevant components of a loan will be
treated as having been secured prior to realization.

PAGE 101
Market risk
Market risk results from movements in market prices,
which lead to fluctuations in the fair values of or future
cash flows from financial instruments. RLB NÖ-Wien
defines interest rate risks, currency risks, other price risks
and volatility risks as market risks.
RLB NÖ-Wien has a trading book of short-term interest
rate and currency transactions. Medium-term and long-
term transactions are captured by the banking book.
Market risk in the trading and banking books is measured
using the customary value at risk approach (VaR: the value
at risk is the potential loss with a given probability over a
specified holding period). In addition, the banking book is
subjected to gap analysis and we calculate basis point
values (BPVs) per currency.
An extensive system of lines and limits (the Treasury Limits
System) is applied to RLB NÖ-Wien’s trading and banking
books, limiting markets risk both for each type of
transaction and for each organizational unit. In this risk
category, a value at risk limit and sensitivity limits are
defined to limit the amount of risk and a stop-loss limit is in
place to limit the risk of losses.
Market risk in the trading book
The Managing Board of RLB NÖ-Wien receives daily VaR (value at risk) reports containing information about current limit
utilization in the trading book as a whole and in the individual portfolios within the trading book.
VALUE AT RISK IN THE TRADING BOOK (2008)€'000
0
500,000
1,000,000
1,500,000
2,000,000
2,500,000
3,000,000
3,500,000
4,000,000
4,500,000
Jan. '08 Feb. '08 M ar. '08 Apr. '08 M ay. '08 Jun. '08 Jul. '08 Aug. '08 Sep. '08 Oct. '08 Nov. '08 Dec. '08
TRADING BOOK (TOTAL) INTEREST RATE TRADING M ONEY TRADINGCURRENCY TRADING SECURITIES TRADING

PAGE 102
The chart shows day-to-day risk in the trading book and its
various sections (interest rate trading, currency trading,
securities trading and money trading) in terms of 99 per
cent one-day value at risk. In addition, daily worst-case
analyses are also carried out, providing information about
losses in extreme cases and showing how big the risk of
losses on money, currency and securities trading was in
the course of 2008. To take an example, a value-at-risk
figure of €200,000 means that, on the particular day of
trading, the Bank would, with a probability of 99 per cent,
not have been able to lose more than €200,000 on trading
operations. This figure says nothing about the amount of
the Bank’s actual loss or gain on the day in question.
From the middle of the year, value at risk in the trading
book was fuelled mainly by interest rate and currency
trading. The effects of the financial markets crisis were
particularly apparent from September/October, causing
high bid-ask spreads in interest rate markets and very high
volatilities in the currency markets. To reduce risks as
much as possible, we cut all our trading book limits in
September and reduced this position as far as we could.
At the beginning of 2008, we closed the trading book’s
money trading portfolio and integrated it into the trading
book’s interest rate portfolio.
For nine years, we have been using daily backtesting to
verify the reliability of the VaR approach, which is based on
historical data, and to continuously improve it.
The table below presents the Bank’s VaR at 31 December 2008 (99%, 1-day) and the comparative figures for 31 December
2007 as shown in the chart above.
€’000 VAR AT 31/12/2008 VAR AT 31/12/2007
Trading book (total) 624 480 Interest rate trading 522 217
Currency trading 399 167
Securities trading 177 302
Money trading 0 30
The value-at-risk figures that we obtain forecast maximum
losses under normal market conditions but do not provide
any information about the effects of exceptional, extreme
market movements. Such events are taken account of
using stress tests that capture the biggest daily market
movements in the previous six years. This allows the
simulation of crisis situations and major fluctuations in
market parameters. These simulations are then applied to
portfolio positions.

PAGE 103
The table below shows the Bank’s VaR (99%, 10-day) for market risk in the trading book.
€’000 VAR AT 31/12/2008 AVERAGE VAR MINIMUM VAR MAXIMUM VAR
Interest rate risk 1,290 2,124 672 7,876 Currency risk 1,245 1,482 138 6,693
Price risk 0 555 0 1,966
€’000 VAR AT 31/12/2007 AVERAGE VAR MINIMUM VAR MAXIMUM VAR
Interest rate risk 1,546 2,589 938 10,036 Currency risk 219 531 150 1,766
Price risk 60 194 30 519
Market risk in the banking book
Interest rate risk is managed centrally by Treasury, a main
department, where all interest rate positions are
systematically aggregated and managed. They are
captured on the basis of internal contracts. In the case of
large exposures, these are specifically agreed between
customer account managers and the Treasury
Department. Retail business is captured by the Bank’s
internal systems.
Interest rate risk is managed using gap analysis. VaR and
scenario analyses take place on the basis of this maturity
gap analysis. The scenarios we use follow the
recommendations of the Finanzmarktaufsicht (Austrian
Financial Market Authority) and OeNB (Austrian
Nationalbank) and the Basel Committee on Banking
Supervision. The Asset Liability Committee meets once
monthly. During its meetings, market risks in the banking
book are reported and the Bank’s interest rates projection
and interest rates policy are decided.
The following maturity gaps mirror the structure of the Bank’s interest rate operations, which are a product of the Asset
Liability Committee’s interest rates projection. (Positive numbers mean that RLB NÖ-Wien, on balance, receives fixed rates;
negative numbers mean that it pays them.)
RLB NÖ-Wien’s maturity gaps at 31 December 2008:
€’000 6 – 12 MONTHS 1 – 2 YEARS 2 – 5 YEARS > 5 YEARS
EUR (1,843,293) 199,155 58,975 345,657 USD (8,863) (182,037) (10,001) 5,190
JPY (122,635) (1,512) (59) 0
CHF 409,041 (1,670) (5,658) (148)
Other (1,021) (529) (1,054) 0
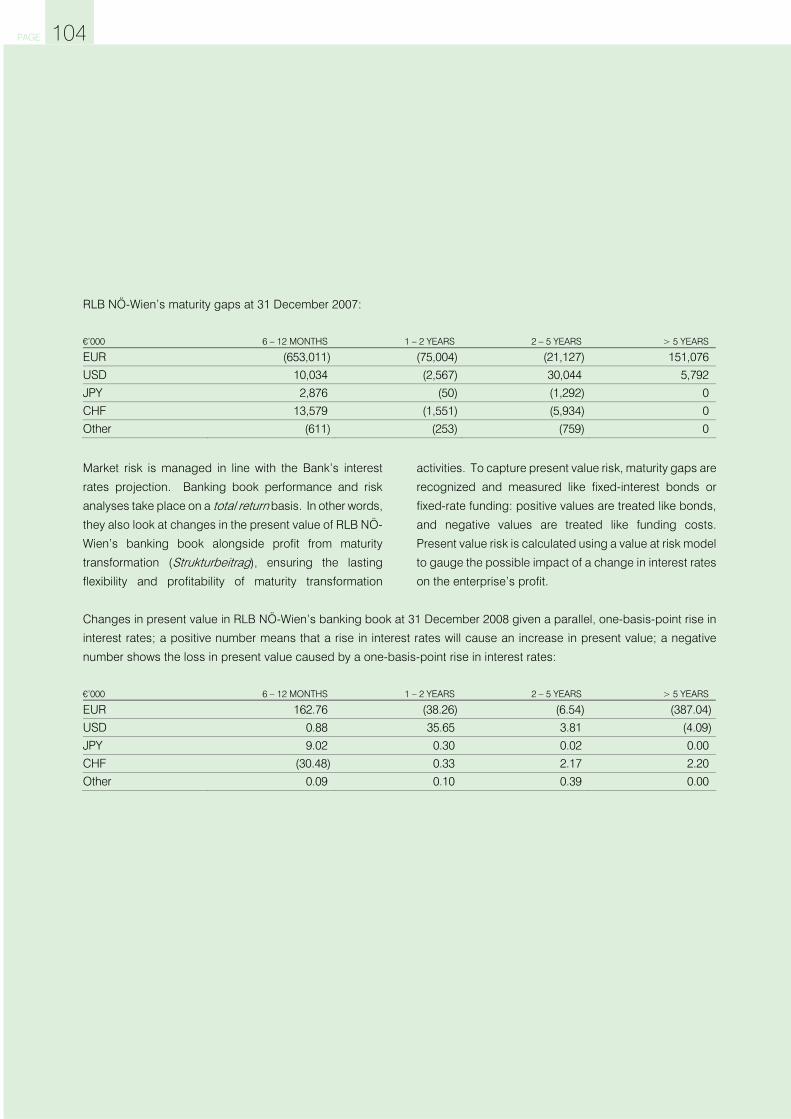
PAGE 104
RLB NÖ-Wien’s maturity gaps at 31 December 2007:
€’000 6 – 12 MONTHS 1 – 2 YEARS 2 – 5 YEARS > 5 YEARS
EUR (653,011) (75,004) (21,127) 151,076 USD 10,034 (2,567) 30,044 5,792
JPY 2,876 (50) (1,292) 0
CHF 13,579 (1,551) (5,934) 0
Other (611) (253) (759) 0
Market risk is managed in line with the Bank’s interest
rates projection. Banking book performance and risk
analyses take place on a total return basis. In other words,
they also look at changes in the present value of RLB NÖ-
Wien’s banking book alongside profit from maturity
transformation (Strukturbeitrag), ensuring the lasting
flexibility and profitability of maturity transformation
activities. To capture present value risk, maturity gaps are
recognized and measured like fixed-interest bonds or
fixed-rate funding: positive values are treated like bonds,
and negative values are treated like funding costs.
Present value risk is calculated using a value at risk model
to gauge the possible impact of a change in interest rates
on the enterprise’s profit.
Changes in present value in RLB NÖ-Wien’s banking book at 31 December 2008 given a parallel, one-basis-point rise in
interest rates; a positive number means that a rise in interest rates will cause an increase in present value; a negative
number shows the loss in present value caused by a one-basis-point rise in interest rates:
€’000 6 – 12 MONTHS 1 – 2 YEARS 2 – 5 YEARS > 5 YEARS
EUR 162.76 (38.26) (6.54) (387.04)
USD 0.88 35.65 3.81 (4.09)
JPY 9.02 0.30 0.02 0.00
CHF (30.48) 0.33 2.17 2.20
Other 0.09 0.10 0.39 0.00

PAGE 105
Changes in present value in RLB NÖ-Wien’s banking book at 31 December 2007 given a parallel, one-basis-point rise in
interest rates:
€’000 6 – 12 MONTHS 1 – 2 YEARS 2 – 5 YEARS > 5 YEARS
EUR 51.08 14.05 6.57 (133.58)USD (0.70) 0.49 (7.72) (4.48)
JPY (0.27) 0.01 0.39 0.00
CHF (1.16) 0.30 2.19 0.00
Other 2.54 0.05 0.27 0.00
Derivative positions are a major cause of market risk. The
risk content of derivative contracts is analyzed daily and
the results are also included in daily reports to the
Managing Board. This ensures that the Managing Board
too is informed about these transactions on a real-time
basis. Point (32) Derivative financial instruments, provides
a detailed overview of their structure.
Foreign currency positions are managed centrally within
the Treasury Department, a main department, by Currency
Trading and Sales (Devisenhandel & Sales). The resulting
currency risks are limited by a detailed system of limits.
The limits system is updated annually by the Managing
Board on the basis of recommendations made by the
Treasury Mid-Office Department (TMO). Adherence to this
limits system is monitored daily by TMO to ensure that
limits are observed. A VaR limit, sensitivity limits and a
stop-loss limit are defined for this department
As a result, all foreign currency positions are continuously
observed, controlled and managed.
Liquidity risk
Liquidity risk includes insolvency risk — i.e. the risk of
being unable to meet due financial obligations in full or in
time — and the risk that, in the event of a liquidity crisis, it
may only be possible to raise funds at above previous
market rates (funding risk) or sell assets at below previous
market prices (market liquidity risk).
The latter type of risk also includes past due risks (late
payments) and withdrawal risks (premature withdrawals).
Since 2007, funding cost risks have been captured on a
scenario analysis basis within the scope of the risk-bearing
capacity analysis process.
In addition, the Central Risk Department calculates and
reports RLB NÖ-Wien’s short-term funding limit on a
weekly basis, comparing current daily funding
requirements with the available tenderable securities.
Being solvent at all times is RLB NÖ-Wien’s central focus.
To achieve this, RLB NÖ-Wien, Raiffeisen-Holding NÖ-Wien and the Raiffeisen Banks in Lower Austria jointly
developed an appropriate limits system in 2007. RLB NÖ-
Wien, having assumed responsibility for liquidity
management for the NÖ-Wien Raiffeisen Banking Group (Raiffeisen-Holding NÖ-Wien, RLB NÖ-Wien and the Lower
Austrian Raiffeisen Banks), regularly prepares liquidity
profiles. In addition, appropriate emergency plans were
put in place to deal with any crises. In the event of a crisis,
they will be executed by the Liquidity Management (LIMA)
Committee. To this end, RLB NÖ-Wien conducts
periodical analyses of the assets that can be realized
within a week. Liquidity is managed centrally by the
Treasury Department, which is a main department.
The liquidity positions of RLB NÖ-Wien and RBG NÖ-Wien are captured by two models that are applied quarterly.

PAGE 106
Operational Liquidity captures liquidity in a maturities
range of between one and 24 months. However, this
model is only applied with respect to RLB NÖ-Wien, from
which RBG NÖ-Wien obtains short-term funds. The short-
term liquidity risk calculated in this way is minimized by
RLB NÖ-Wien’s direct participation in the European
Central Bank’s tender operations and the potentially large
tender volumes associated with them. The second model,
Structural Liquidity, captures the long-term liquidity
positions of all the members of the NÖ-Wien Raiffeisen Banking Group from a maturity of two years to maturities
of more than 15 years both on a member-by-member
basis and in an aggregated form.
The table below presents RLB NÖ-Wien’s structural liquidity in 2008 compared with 2007:
31/12/2008 31/12/2007
Normal Case TARGET MONITOR TARGET MONITOR
€’000 1/3 OF ASSETS LIABILITIES > 1/3 OF ASSETS 1/3 OF ASSETS LIABILITIES > 1/3 OF ASSETS
≥ 2 YRS 3,531,568 0.70 2,887,025 0.70 ≥ 3 YRS 2,883,374 0.69 2,397,120 0.69
≥ 4 YRS 2,334,608 0.71 1,950,646 0.66
≥ 5 YRS 1,775,272 0.70 1,479,315 0.67
≥ 6 YRS 1,579,626 0.73 1,199,281 0.76
≥ 7 YRS 1,309,465 0.75 1,034,395 0.79
≥ 8 YRS 1,097,281 0.74 890,823 0.78
≥ 9 YRS 911,209 0.70 735,636 0.70
≥ 10 YRS 768,678 0.70 573,434 0.61
≥ 15 YRS 428,592 0.81 304,131 0.66
Both models differentiate between normal and problem
cases. The normal case describes the tie-up of capital
associated with RBG NÖ-Wien’s individual assets and
liabilities as per its maturities manual (Kapitalbindungs-handbuch) while also taking account of fixed interest
periods and statistical base effects. The problem case
describes capital tie-ups as per the maturities manual in
crisis scenarios while taking account of legally effective
lock down periods.
If lock down periods have not been defined (e.g. for
current accounts, freely withdrawable passbook account
balances), modelling assumptions regarding remittances
are made on the basis of expert estimates.
Point (34) contains a supplementary breakdown of terms
to maturity at RLB NÖ-Wien that provides an overview of
the Bank’s liquidity structure.
Equity investment risk
Because of its focus on operating as a so-called universal bank, RLB NÖ-Wien holds equity investments within the
Raiffeisen organization, all of which are strategic, as well
as other equity investments that support its banking
activities. All other equity investments, which include
industrial and property investments, are held by Group
parent Raiffeisen-Holding NÖ-Wien.

PAGE 107
Equity investment risk can affect RLB NÖ-Wien in the form
of the risk of losses caused by lost dividends, impairments
of carrying amounts, losses on disposal, transferred
losses and declines in hidden reserves.
Equity investment risk management and the management
and control of equity investments are carried out by
Raiffeisen-Holding NÖ-Wien under the
Geschäftsbesorgungsvertrag (function allocation
agreement). The equity investment risk management
process begins with a due diligence audit as soon as a
new investment is acquired. As a rule, it is performed by
external experts (management consultants, auditors,
lawyers). In addition, in the case of big projects and
poorly rated equity investments, Risk Controlling at
Raiffeisen Holding carries out an additional risk
assessment of the asset being acquired based on
assessments made by operational departments.
RLB NÖ-Wien exercises a significant influence over the
operational activities of the entities in which equity
investments are held by appointing officers of RLB NÖ-
Wien to serve in the managements and as members of the
supervisory and advisory boards of such entities.
The analysis and auditing of figures in financial statements
and business plans and the assessment of strategic
positions using SWOT (Strengths, Weaknesses,
Opportunities and Threats) analyses are important means
and measures used in the course of the Bank’s regular
equity investment and risk control activities.
The following table presents the carrying amounts of RLB NÖ-Wien’s equity investments and their ratings at
31 December 2008 and 31 December 2007:
€’000
CARRYING AMOUNT
31/12/2008 PERCENTAGE
HELD RATING
CARRYING AMOUNT
31/12/2007 PERCENTAGE
HELD RATING
Investments in other banks 1,984,708 97.8% 1.5 1,959,155 96.1% 1.5
Investments in banking-related fields 44,057 2.2% 1.5 79,575 3.9% 1.5
Total equity investments 2,028,765 100.0% 1.5 2,038,730 100.0% 1.5
Although market conditions had become more difficult, at
31 December 2008, RLB NÖ-Wien’s equity investments in
other banks and its investments in banking-related fields
had a rating of 1.5, giving us the same overall rating of 1.5
as in 2007. During 2009, the RZB Group’s performance in
Western Europe will depend mainly on economic
developments and, consequently, on governmental
economic support packages. Meanwhile, even if rates of
growth in Central and Eastern Europe, Southeastern
Europe and the CIS region are higher than in the West,
macroeconomic conditions have become generally more
uncertain.
Each quarter, the potential risks and covering assets
associated with equity investments, as assessed (for both
problem cases and extreme cases) by experts, are
brought into the periodical risk-bearing capacity analyses
carried out at the overall bank level.

PAGE 108
Operational risk
RLB NÖ-Wien defines operational risk as the risk of losses
resulting from failures of systems and processes or
caused by staff or external risks. This definition includes
legal risks.
Operational risks at RLB NÖ-Wien are constantly
monitored and action is taken to mitigate them. This
process is contributed to by continuous staff training,
emergency plans, backup systems and ongoing process
quality enhancement. Rules of procedure are
implemented and instructions issued to minimize these
risks. All action taken to mitigate operational risks must
also take cost/benefit considerations into account.
RLB NÖ-Wien has a loss database containing historical
data from 1999 onward as well as all current cases from
2001. This has created the foundations for an operational
risk management approach that goes beyond the basic
indicators approach. The Managing Board is given
quarterly reports on the course of recorded loss events.
RLB NÖ-Wien is a participant in projects to refine a variety
of risk management systems being carried out within the
Raiffeisen organization.
RLB NÖ-Wien carries out self-assessments spanning the
entire organization at divisional and departmental level to
identify potentially serious but improbable risks.
Consciously grappling with loss events also has a learning
effect that makes it possible to mitigate risks.
During both the self-assessment process and the
capturing of loss events, classification takes place using
internationally accepted methods. In mid-2009, RLB NÖ-
Wien migrated the self-assessment process and the
capturing of loss events to an SAS-based operational risk
application, equipping RLB NÖ-Wien to benchmark versus
a variety of data pools.
Operational risk is currently recognized using the earnings volatility method and taken account of during the risk-
bearing capacity analysis process.
To safeguard against operational risk within the meaning
of § 22i BWG, RLB NÖ-Wien has undertaken to use the
basic indicator approach within the meaning of § 22j BWG
to calculate its minimum own funds requirement and to
make the requisite disclosures to the regulators. The
basic indicator approach does not impose any additional
obligation on the Bank to quantify its operational risks.
Customer deposit guarantee association
(Kundengarantiegemeinschaft) of the Raiffeisen organization
Supplementing internal measures to capture, measure and
manage risk, RLB NÖ-Wien is a member of the Raiffeisen
customer deposit guarantee association (Kundengarantie-gemeinschaft). This association of Raiffeisen banks,
Regional Raiffeisen Banks (Raiffeisenlandesbanken) and
RZB guarantees all customer deposits with those entities
as well as securities issued by those entities, regardless of
their amount, on a mutual basis. The customer deposit
guarantee association is a two-tiered organization. It
functions at a regional level, with, for instance, Raiffeisen banks in Lower Austria mutually guaranteeing customer
deposits, and a second level of security is provided by the
federal customer deposit guarantee association (Bundes-kundengarantiegemeinschaft), which comes into play
when any regional guarantee system proves insufficient.
The customer deposit guarantee association of the
Raiffeisen banks, Regional Raiffeisen Banks and RZB thus
provides a double safety net to secure customer deposits.
The solidarity association (Solidaritätsverein) of
Raiffeisen-Bankengruppe Niederösterreich-Wien
RLB NÖ-Wien and the Lower Austrian Raiffeisen banks
have jointly set up this solidarity association to ensure that

PAGE 109
members in financial difficulties can be given suitable help.
The solidarity association thus provides added security
alongside the Austrian and Lower Austrian Raiffeisen
deposit guarantee system described below.
Deposit guarantee facilities of the Raiffeisen
organization
RLB NÖ-Wien and the Lower Austrian Raiffeisen banks are
members of Österreichische Raiffeisen-Einlagensicherung reg. Gen. mbH. by way of Raiffeisen-Einlagensicherung Niederösterreich-Wien reg. Gen. mbH. This customer
deposit guarantee cooperative is the “liability facility”
(Haftungseinrichtung) for the whole of the Austrian
Raiffeisen Banking Group for the purposes of § 93, § 93a und § 93b BWG. The early-warning system set up to
safeguard deposits within the Raiffeisen organization
provides a high level of security for investors that goes far
beyond the legislative requirements. This early-warning
system is based on extensive income and risk
performance reporting by all the Regional Raiffeisen Banks (including all the Raiffeisen banks within a particular
province) to Österreichische Raiffeisen-Einlagensicherung reg. Gen. mbH. combined with appropriate, ongoing
analysis and monitoring processes.
The Austrian Raiffeisen Banking Group
The Austrian Raiffeisen Banking Group (Österreichische Raiffeisen-Bankengruppe) is the country’s largest private
banking group. Some 551 locally active Raiffeisen banks,
eight Regional Raiffeisen Banks and RZB in Vienna make
up the country’s densest banking network, with a total of
1,695 banking outlets. Roughly 1.7 million Austrians are
members — and therefore also co-owners — of Raiffeisen banks.
Government deposit guarantees
To boost saver confidence, the Austrian government
reacted to the investor uncertainty caused by the financial
markets crisis by guaranteeing 100 per cent of personal
deposit balances that are not covered by other guarantees
facilities. This guarantee will remain in place until
31 December 2009; from 1 January 2010, the guaranteed
amount will be limited to €100,000. At the same time, the
government decided to guarantee the deposit balances of
small and medium-sized enterprises up to a maximum of
€50 thousand.
Personal losses up to €50 thousand are covered by other
guarantee facilities, so the government guarantees will
cover balances in excess of that amount. The package
has earmarked €10 billion for these guarantees.

PAGE 110
(32) Derivative financial instruments
The following tables present the derivative financial products outstanding on the balance sheet date, broken down by
maturity.
• Derivative financial products not held for trading and reported on the Balance Sheet in the line items Other assets or
Other liabilities:
€’000 NOMINAL AMOUNTS FAIR VALUES
2008 TERM TO MATURITY
UP TO
1 YEAR FROM 1 TO
5 YEARS
FROM 5 YEARS AND
OVER TOTAL POSITIVE NEGATIVE
Total 6,708,518 7,671,437 8,644,836 23,024,791 532,666 (645,423)
a) Interest rate contracts 4,427,436 7,156,224 8,385,002 19,968,662 453,402 (526,933)
(contracts traded on a stock exchange)
Interest rate futures 5,800 0 0 5,800 129 0
(OTC products)
Interest rate swaps 4,255,436 5,950,414 7,251,492 17,457,342 447,579 (498,206)
Interest rate options – calls 115,236 492,828 90,982 699,046 5,693 0
Interest rate options – puts 48,964 692,882 1,042,528 1,784,374 0 (28,098)
Bond options - calls 2,000 20,100 0 22,100 0 (629)
b) Exchange rate contracts 2,213,449 214,656 130,207 2,558,312 46,696 (82,185)
(OTC products) Currency forwards 46,586 0 0 46,586 1,331 (2,260)
Cross-currency and cross-currency interest rate swaps 2,148,389 52,282 120,937 2,321,608 39,808 (74,368)
Currency options – calls 9,237 81,187 4,635 95,059 5,557 0
Currency options – puts 9,237 81,187 4,635 95,059 0 (5,557)
c) Securities contracts 67,633 229,257 129,627 426,517 30,016 (35,017)
(contracts traded on a stock exchange) Equity index futures 1,980 0 0 1,980 39 0
(OTC products)
Equity and index options – calls 27,574 167,964 0 195,538 20,445 0
Equity and index options – puts 38,079 45,293 0 83,372 0 (23,337)
Other securities contracts 0 16,000 129,627 145,627 9,532 (11,680)
d) Credit derivatives 0 71,300 0 71,300 2,552 (1,288)
(OTC products)
Credit default swaps – secured party 0 46,300 0 46,300 2,552 0
Credit default swaps – securing party 0 25,000 0 25,000 0 (1,288)
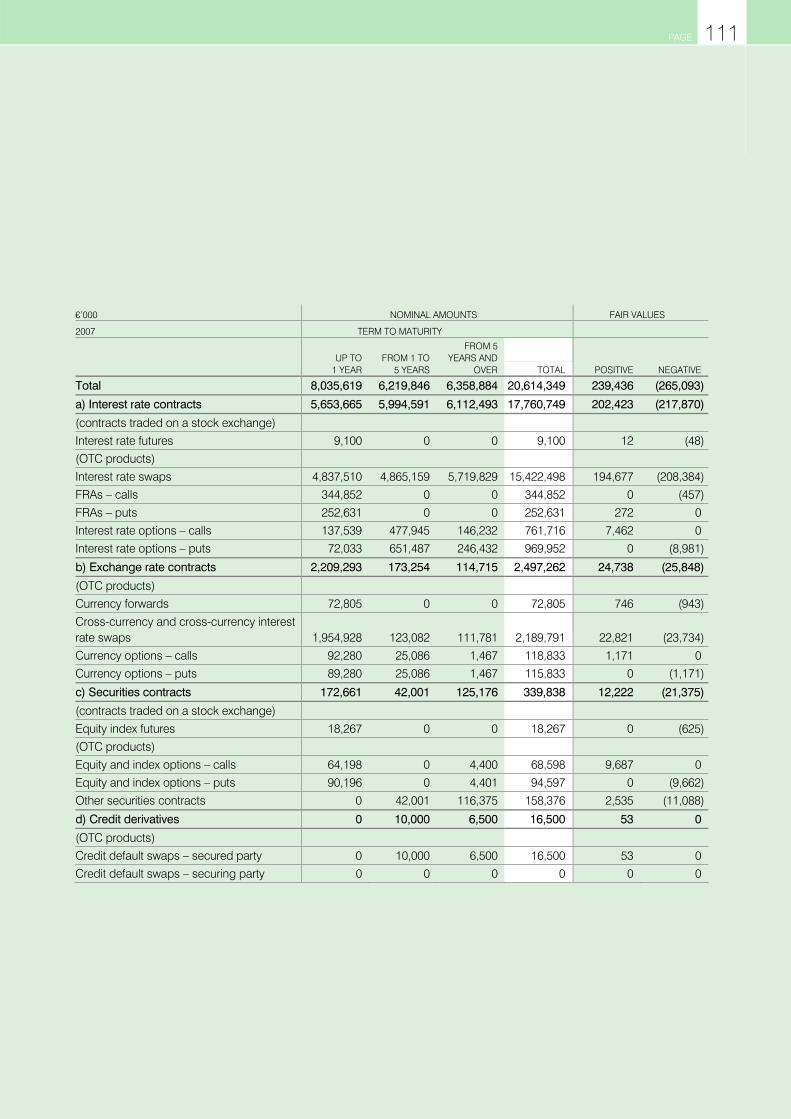
PAGE 111
€’000 NOMINAL AMOUNTS FAIR VALUES
2007 TERM TO MATURITY
UP TO
1 YEAR FROM 1 TO
5 YEARS
FROM 5 YEARS AND
OVER TOTAL POSITIVE NEGATIVE
Total 8,035,619 6,219,846 6,358,884 20,614,349 239,436 (265,093)
a) Interest rate contracts 5,653,665 5,994,591 6,112,493 17,760,749 202,423 (217,870)
(contracts traded on a stock exchange) Interest rate futures 9,100 0 0 9,100 12 (48)
(OTC products)
Interest rate swaps 4,837,510 4,865,159 5,719,829 15,422,498 194,677 (208,384)
FRAs – calls 344,852 0 0 344,852 0 (457)
FRAs – puts 252,631 0 0 252,631 272 0
Interest rate options – calls 137,539 477,945 146,232 761,716 7,462 0
Interest rate options – puts 72,033 651,487 246,432 969,952 0 (8,981)
b) Exchange rate contracts 2,209,293 173,254 114,715 2,497,262 24,738 (25,848)
(OTC products) Currency forwards 72,805 0 0 72,805 746 (943)
Cross-currency and cross-currency interest rate swaps 1,954,928 123,082 111,781 2,189,791 22,821 (23,734)
Currency options – calls 92,280 25,086 1,467 118,833 1,171 0
Currency options – puts 89,280 25,086 1,467 115,833 0 (1,171)
c) Securities contracts 172,661 42,001 125,176 339,838 12,222 (21,375)
(contracts traded on a stock exchange)
Equity index futures 18,267 0 0 18,267 0 (625)
(OTC products)
Equity and index options – calls 64,198 0 4,400 68,598 9,687 0
Equity and index options – puts 90,196 0 4,401 94,597 0 (9,662)
Other securities contracts 0 42,001 116,375 158,376 2,535 (11,088)
d) Credit derivatives 0 10,000 6,500 16,500 53 0
(OTC products) Credit default swaps – secured party 0 10,000 6,500 16,500 53 0
Credit default swaps – securing party 0 0 0 0 0 0

PAGE 112
• Derivative financial products held for trading and recognized on the Balance Sheet in the line items Trading assets or
Trading liabilities:
€’000 NOMINAL AMOUNTS FAIR VALUES
2008 TERM TO MATURITY
UP TO
1 YEAR FROM 1 TO
5 YEARS
FROM 5 YEARS AND
OVER TOTAL POSITIVE NEGATIVE
Total 6,096,519 22,976,215 25,127,783 54,200,517 1,711,928 (1,782,801)
a) Interest rate contracts 3,001,460 22,863,900 25,127,783 50,993,143 1,501,100 (1,573,841)
(contracts traded on a stock exchange)
Interest rate futures 34,000 0 0 34,000 0 (108)
(OTC products)
Interest rate swaps 2,740,460 22,361,900 24,983,599 50,085,959 1,495,025 (1,563,963)
Interest rate options – calls 1,000 251,000 52,092 304,092 6,075 0
Interest rate options – puts 226,000 251,000 92,092 569,092 0 (9,770)
b) Exchange rate contracts 3,093,139 112,315 0 3,205,454 210,268 (208,400)
(OTC products) Currency options – calls 1,475,659 55,814 0 1,531,473 208,463 0
Currency options – puts 1,563,678 56,501 0 1,620,179 0 (206,415)
Other currency contracts – calls 26,109 0 0 26,109 1,805 0
Other currency contracts – puts 27,693 0 0 27,693 0 (1,985)
c) Securities contracts 1,920 0 0 1,920 560 (560)
(OTC products)
Equity and index options – calls 960 0 0 960 560 0 Equity and index options – puts 960 0 0 960 0 (560)
d) Credit derivatives 0 0 0 0 0 0
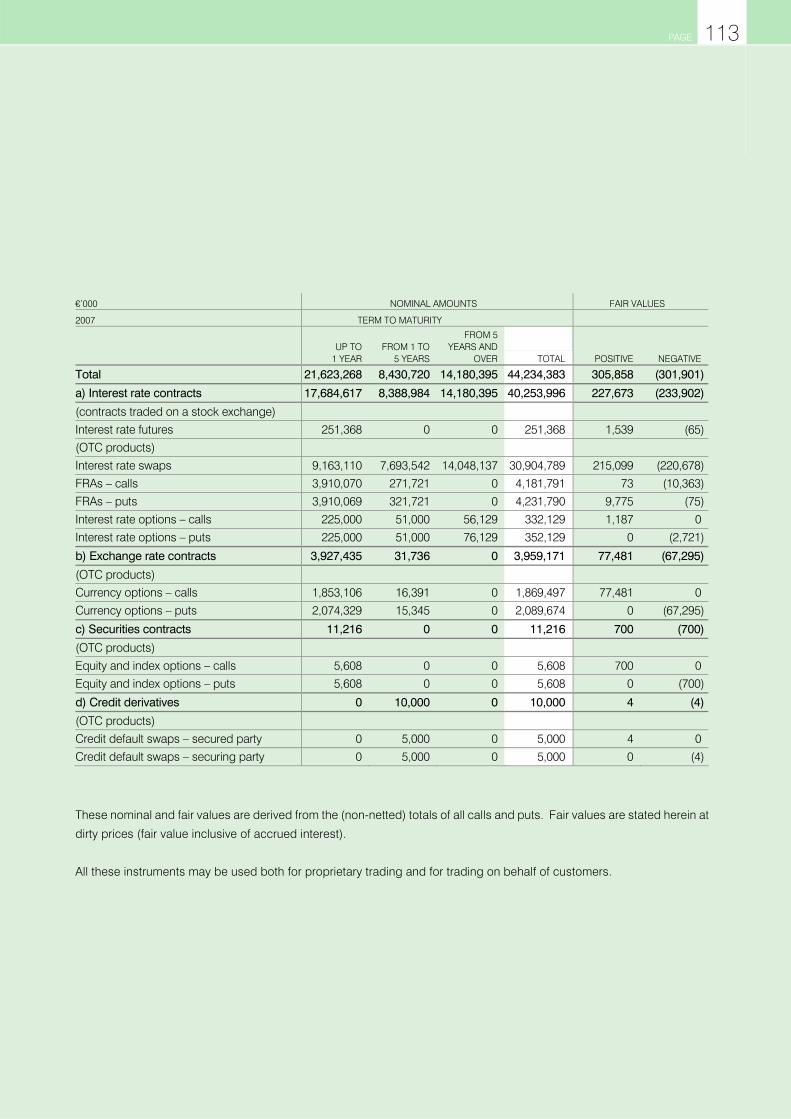
PAGE 113
€’000 NOMINAL AMOUNTS FAIR VALUES
2007 TERM TO MATURITY
UP TO
1 YEAR FROM 1 TO
5 YEARS
FROM 5 YEARS AND
OVER TOTAL POSITIVE NEGATIVE
Total 21,623,268 8,430,720 14,180,395 44,234,383 305,858 (301,901)
a) Interest rate contracts 17,684,617 8,388,984 14,180,395 40,253,996 227,673 (233,902)
(contracts traded on a stock exchange) Interest rate futures 251,368 0 0 251,368 1,539 (65)
(OTC products)
Interest rate swaps 9,163,110 7,693,542 14,048,137 30,904,789 215,099 (220,678)
FRAs – calls 3,910,070 271,721 0 4,181,791 73 (10,363)
FRAs – puts 3,910,069 321,721 0 4,231,790 9,775 (75)
Interest rate options – calls 225,000 51,000 56,129 332,129 1,187 0
Interest rate options – puts 225,000 51,000 76,129 352,129 0 (2,721)
b) Exchange rate contracts 3,927,435 31,736 0 3,959,171 77,481 (67,295)
(OTC products) Currency options – calls 1,853,106 16,391 0 1,869,497 77,481 0
Currency options – puts 2,074,329 15,345 0 2,089,674 0 (67,295)
c) Securities contracts 11,216 0 0 11,216 700 (700)
(OTC products)
Equity and index options – calls 5,608 0 0 5,608 700 0
Equity and index options – puts 5,608 0 0 5,608 0 (700)
d) Credit derivatives 0 10,000 0 10,000 4 (4)
(OTC products) Credit default swaps – secured party 0 5,000 0 5,000 4 0
Credit default swaps – securing party 0 5,000 0 5,000 0 (4)
These nominal and fair values are derived from the (non-netted) totals of all calls and puts. Fair values are stated herein at
dirty prices (fair value inclusive of accrued interest).
All these instruments may be used both for proprietary trading and for trading on behalf of customers.

PAGE 114
(33) Fair values of financial instruments
Fair value is the amount for which a financial instrument could be exchanged between knowledgeable, willing parties in an
arm’s length transaction. Insofar as market prices were available (which mainly applied to securities and derivatives traded
on an exchange or in functioning markets), these were used as fair values. All other financial instruments were valued using
valuation models, including in particular present value models and accepted option price models based on observable
market data. Fixed-interest loans and advances to and deposits from customers and other banks were only measured to
fair values different from their carrying amounts on the Balance Sheet if they had a term to maturity of more than one year,
and variable-rate loans and advances and deposits were only taken into account if they had an interest rate adjustment
period of more than one year. Only in such cases does discounting based on an assumed interest rate in line with market
rates have a material effect. The table below presents the fair values and carrying amounts of balance sheet items that are,
as a rule, not measured at fair value. Loans and advances to other banks and Loans and advances to customers are
reported net of impairment allowance balances.
Financial year 2008 €’000 FAIR VALUES
CARRYING AMOUNTS DIFFERENCE
Assets
Loans and advances to other banks 9,144,797 9,150,167 (5,370)
Loans and advances to customers 8,279,854 8,289,936 (10,082)
Financial investments 2,684,059 2,787,195 (103,136)
of which classified as held to maturity 2,292,626 2,395,762 (103,136)
of which classified as available for sale, measured at cost 113,005 113,005 0
of which classified as available for sale, measured at fair value 278,428 278,428 0
Liabilities
Deposits from other banks 11,436,459 11,358,887 77,572 Deposits from customers 6,465,091 6,462,072 3,019
Liabilities evidenced by paper 3,796,503 3,852,601 (56,098)
Subordinated debt capital 739,461 747,108 (7,647)
of which classified at amortized cost 690,921 698,568 (7,647)
of which designated as at fair value through profit or loss 48,540 48,540 0

PAGE 115
FINANCIAL YEAR 2007 €000 FAIR VALUES
CARRYING AMOUNTS DIFFERENCE
Assets
Loans and advances to other banks 5,295,927 5,295,082 845 Loans and advances to customers 6,632,229 6,643,757 (11,528)
Financial investments 2,022,178 2,073,650 (51,472)
of which classified as held to maturity 1,626,671 1,678,143 (51,472)
of which classified as available for sale, measured at cost 275,532 275,532 0
of which classified as available for sale, measured at fair value 119,975 119,975 0
Liabilities
Deposits from other banks 7,477,491 7,459,808 17,683 Deposits from customers 5,532,653 5,521,283 11,370
Liabilities evidenced by paper 2,724,547 2,744,260 (19,713)
Subordinated debt capital 586,195 590,022 (3,827)
of which classified at amortized cost 526,521 530,348 (3,827)
of which designated as at fair value through profit or loss 59,674 59,674 0
If no reliable market values were available for equity
instruments reported in the line item Financial investments,
they were measured at cost. If the volume or frequency of
trades gave reason to doubt a price’s validity, listed equity
instruments were measured at cost. In the case of
unlisted equity instruments, there were no observable
market transactions in identical or similar equity
instruments on the basis of which reliable fair values could
be deduced. Estimation of a reliable fair value or its
determination within a range of fluctuation weighted on the
basis of specific occurrence probabilities by means of a
discounted cash flow measurement or similar methods
was not productive in that fair values can only be
calculated on the basis of an enterprise’s internal data,
from which, however, no market relevance can be reliably
deduced.

PAGE 116
ADDITIONAL INFORMATION
(34) Breakdown of terms to maturity
Breakdown of terms to maturity at 31 December 2008:
€’000
ON DEMAND OR OF UNSPECIFIED
MATURITY UP TO
3 MONTHS
FROM 3 MONTHS UP
TO 1 YEAR FROM 1 TO
5 YEARS
FROM 5 YEARS
AND OVER TOTAL
Loans and advances to other banks 1,998,689 5,282,193 440,624 1,115,934 324,957 9,162,397
Loans and advances to customers 280,182 1,857,825 1,062,474 2,453,815 2,860,016 8,514,312
Trading assets 0 497,013 475,670 458,041 806,086 2,236,810
Other current financial assets 362,483 195,770 351,899 876,406 426,589 2,213,147
Financial investments 181,264 35,422 358,871 1,522,384 689,254 2,787,195
Investments in entities accounted for using the equity method 1,944,460 0 0 0 0 1,944,460
Deposits from other banks 2,291,943 6,180,697 1,163,338 848,273 874,636 11,358,887
Deposits from customers 2,317,915 1,215,210 2,279,308 120,740 528,899 6,462,072
Liabilities evidenced by paper 0 324,719 657,084 1,953,067 917,731 3,852,601
Trading liabilities 0 463,780 483,242 430,032 810,348 2,187,402
Subordinated debt capital 125,040 39,940 42,174 90,152 449,802 747,108
Breakdown of terms to maturity at 31 December 2007:
€’000
ON DEMAND OR OF UNSPECIFIED
MATURITY UP TO
3 MONTHS
FROM 3 MONTHS UP
TO 1 YEAR FROM 1 TO
5 YEARS
FROM 5 YEARS
AND OVER TOTAL
Loans and advances to other banks 779,045 2,598,796 1,090,414 654,397 172,430 5,295,082 Loans and advances to customers 196,347 1,658,425 705,882 2,005,522 2,316,913 6,883,089
Trading assets 30,147 229,243 329,050 256,953 307,377 1,152,770
Other current financial assets 238,428 31,591 153,069 885,862 687,314 1,996,264
Financial investments 258,831 5,001 168,316 978,190 663,312 2,073,650
Investments in entities accounted for using the equity method 1,776,250 0 0 0 0 1,776,250
Deposits from other banks 2,821,724 3,002,630 471,309 476,075 688,070 7,459,808
Deposits from customers 2,323,390 1,088,215 1,396,564 251,844 461,270 5,521,283
Liabilities evidenced by paper 0 215,416 185,394 1,531,785 811,665 2,744,260
Trading liabilities 0 205,198 280,478 41,489 139,321 666,486
Subordinated debt capital 59,674 21,655 0 157,220 351,473 590,022

PAGE 117
(35) Receivables from and payables and contingent liabilities to related parties
Receivables from, payables to and contingent liabilities to entities in which the RLB NÖ-Wien Group held equity investments
and from or to Raiffeisen-Holding NÖ-Wien and its subsidiaries:
€’000 2008 2007
Loans and advances to other banks
Parent 1,660,905 1,196,038
Entities accounted for using the equity method 3,200,385 1,638,761
Associates (not accounted for using the equity method) 3,222 6,604
Other equity investments 0 20,224
Loans and advances to customers
Entities related via the parent 183,218 143,248 Non-consolidated subsidiaries 12,796 11,766
Associates (not accounted for using the equity method) 9,724 12,425
Other equity investments 0 481
Impairment allowance balance
Non-consolidated subsidiaries (1,658) (1,133)
Trading assets
Parent 38,245 246
Entities accounted for using the equity method 14,520 111,363
Other equity investments 37,404 38,521
Other current financial assets
Entities accounted for using the equity method 263,750 17,924 Other equity investments 284,904 158,420
Financial investments
Parent 277 277 Entities accounted for using the equity method 120,581 7,879
Other equity investments 168 0
Other assets
Parent 38,073 34,207
Entities accounted for using the equity method 42,824 4,703
Associates (not accounted for using the equity method) 50 2

PAGE 118
€’000 2008 2007
Deposits from other banks
Parent 53,386 5,183 Entities accounted for using the equity method 1,599,803 44,632
Other equity investments 3,741,060 2,708,280
Deposits from customers
Entities related via the parent 249,603 283,544 Non-consolidated subsidiaries 6,938 2,732
Associates (not accounted for using the equity method) 4,922 4,236
Other equity investments 3,721 1,936
Liabilities evidenced by paper
Non-consolidated subsidiaries 157 0
Entities accounted for using the equity method 12,606 12,787
Other equity investments 3,871 156
Trading liabilities
Parent 0 7,037 Entities accounted for using the equity method 6,820 0
Other equity investments 1,177 0
Other liabilities
Parent 56,026 73,633 Entities related via the parent 5 84
Entities accounted for using the equity method 40,628 3,812
Associates (not accounted for using the equity method) 0 339
Provisions
Parent 4,183 4,013
Entities related via the parent 11 84
Other equity investments 0 3
Subordinated debt capital
Entities related via the parent 35,032 0 Parent 96,366 0
Entities accounted for using the equity method 43,970 49,137
Other equity investments 41,653 55,818

PAGE 119
€’000 2008 2007
Contingent liabilities
Parent 6,679 7,000 Entities related via the parent 11,244 9,817
Non-consolidated subsidiaries 14,388 41
Entities accounted for using the equity method 1,000 0
Associates (not accounted for using the equity method) 22 292
Other equity investments 18,087 22,814
RLB NÖ-Wien’s parent is Raiffeisen-Holding NÖ-Wien. Business relations between RLB NÖ-Wien and Raiffeisen-Holding NÖ-Wien mainly involved the funding of Raiffeisen-Holding NÖ-Wien and derivative financial instruments.
Business relations with related parties were conducted on arm’s length terms and conditions.
In view of the immaterial amounts involved, receivables from and payables to members of the Managing Board of RLB NÖ-
Wien, members of the management of Raiffeisen-Holding NÖ-Wien and their relatives (related parties within the meaning of
by IAS 24) were not disclosed. Those business relations did not have any material effects on the Consolidated Financial
Statements.
(36) Remuneration of board members
Expenditure on the members of the Managing Board of RLB NÖ-Wien broke down as follows:
€’000 2008 2007
Expenditure on
Short-term benefits 2,423 2,337
Post-employment benefits 996 1,977
Other long-term benefits (2) 29
Termination benefits 0 305
€55 thousand was paid to the members of the Supervisory Board during 2008 (2007: €55 thousand).
Remuneration paid to erstwhile managing board members (including erstwhile board members of the former RLB reg. Gen.m.b.H.) and their surviving dependents came to €977 thousand (2007: €1,260 thousand).

PAGE 120
(37) Disclosure of loans and advances to members of the Managing Board and Supervisory Board in accordance with § 266 Z. 5 UGB
On the balance sheet date, loans outstanding to the
members of the Managing Board came to €1,209
thousand (2007: €546 thousand). Loans and advances to
members of the Supervisory Board came to €361
thousand (2007: €157 thousand).
No guarantees were in place on behalf of this group of
persons. Loans and advances to the Supervisory Board
also included loans and advances to employees
appointed to the Supervisory Board by the Works Council.
Durations and interest rates were those generally on offer
from banks. During the financial year, €49 thousand was
repaid by the members of the Managing Board (2007:
€395 thousand), and €55 thousand was repaid by
members of the Supervisory Board (2007: €9 thousand).
(38) Foreign currency balances
The following balances of assets and liabilities denominated in a foreign currency were recognized in the Consolidated
Financial Statements:
€’000 2008 2007
Assets 3,135,845 2,568,975 Liabilities 1,469,849 843,379
(39) Assets and liabilities abroad
Assets and liabilities vis-à-vis counterparties outside Austria broke down as follows:
€’000 2008 2007
Assets 6,386,759 4,384,774
Liabilities 2,149,709 1,880,192

PAGE 121
(40) Subordinated assets
The line item Assets includes the following subordinated assets:
€’000 2008 2007
Loans and advances to other banks 245,337 30,871
Loans and advances to customers 3,689 6,764
Trading assets 1,064 4,486
Other current financial assets 26,146 147,175
Financial investments 230,653 115,842
Total 506,889 305,138
(41) Subordinated borrowings
Subordinated debt capital
The following subordinated debt instruments were issued during the financial year:
CURRENCY
AMOUNT (€’000)
INTERESTRATE
MATURING ON
EXTRAORDINARY RIGHT OF TERMINATION
1
Nachrangige variabel verzinste Raiffeisen Obligation 2008-2028/23 Privatplatzierung € 30,000 1 16 May 2028 Issuer can terminate
2
Nachrangige variabel verzinste Raiffeisen Obligation 2008-2021/43 Privatplatzierung € 17,900 2 6 August 2021 Issuer can terminate
1 During the first coupon period (16 May 2008 – 15 May 2018), the coupon will be set annually at 2.00 percentage points above the 12-month EURIBOR;
during the second coupon period (16 May 2018 – 15 May 2028), the coupon will be set annually at 3.50 percentage points above the 12-month EURIBOR. Coupon determination takes place two banking days before each interest commencement date.
2 During the first coupon period (6 August 2008 – 5 August 2016), the coupon will be set quarterly at 1.35 percentage points above the 3-month EURIBOR; during the second coupon period (6 August 2016 – 5 August 2021), the coupon will be set quarterly at 2.70 percentage points above the 3-month EURIBOR. Coupon determination takes place two banking days before each interest commencement date.
This is subordinated debt capital within the meaning of § 23 Abs. 8 BWG.
These bonds are securities issued in a continuous manner.

PAGE 122
Moreover, 38,000 debt status Raiffeisen Centropa Regional Fund profit-share certificates (Genussrechte) with a nominal unit
value of €100.00 were issued during the 2008 financial year. These notes are listed in the Vienna stock exchange’s official
market segment (amtlicher Handel). The proceeds from their issuance were accounted for in a separate accounting
domain. These profit-share certificates are valued monthly. The unit value of a profit-share certificate is calculated on the
basis of the difference between assets and liabilities within the accounting domain. These profit-share certificates do not
entitle the holder to regular interest payments or to a share of the proceeds from the liquidation of the issuer Raiffeisen Centropa Invest Verwaltungs- und Beteiligungs AG. These profit-share certificates constitute unsecured debt of the
Company that ranks junior to other creditors’ claims. The holders of the profit-share certificates have provided this capital
for an indefinite period. Holders of profit-share certificates may give notice to the Company by registered letter subject to at
least three weeks’ notice, ending on the valuation date in the month in question. The issuer has the same right of
termination as the holders of the profit-share certificates.
Supplementary capital
The following supplementary capital instruments were issued during the financial year:
CURRENCY
AMOUNT (€’000)
INTERESTRATE
MATURING ON
EXTRAORDINARY RIGHT OF TERMINATION
1
Variable Raiffeisen Ergänzungskapital-Obligation 2008-2023/20 € 31,950 1 9 May 2023 Issuer can terminate
2 Variable Raiffeisen Ergänzungs-kapital-Obligation 2008-2028/33 € 26,096 2 27 July 2028 Issuer can terminate
3 Variable Raiffeisen Ergänzungs-kapital-Obligation 2008-2021/40 € 8,200 3 24 July 2021 Issuer can terminate
4 Raiffeisen Ergänzungskapital Fixzins-Obligation 2008-2023/42 € 20,000 4 1 August 2023 Issuer can terminate
1 During the first coupon period (9 May 2008 – 8 May 2016), the coupon will be set annually at 1.50 percentage points above the 12-month EURIBOR; during the second coupon period (9 May 2016 – 8 May 2023), the coupon will be set annually at 2.50 percentage points above the 12-month EURIBOR. Coupon determination takes place two banking days before each interest commencement date.
2 During the first coupon period (27 June 2008 – 26 October 2008), the coupon was set at 6.561 per cent per annum; during the second coupon period (27 October 2008 to 26 July 2018), the coupon will be set quarterly at 1.55 percentage points above the 3-month EURIBOR; during the third coupon period (27 July 2018 to 26 July 2028), the coupon will be set quarterly at 3.55 percentage points above the 3-month EURIBOR. Coupon determination takes place two banking days before each interest commencement date.
3 During the first coupon period (24 July 2008 to 23 July 2016), the coupon will be set quarterly at 1.50 percentage points above the 3-month EURIBOR; during the second coupon period (24 July 2016 to 23 July 2021), the coupon will be set quarterly at 3.00 percentage points above the 3-month EURIBOR. Coupon determination takes place two banking days before each interest commencement date.
4 These bonds have a coupon of 6.90 per cent of their face value per annum payable retrospectively on 1 August of each year and for the first time on 1 August 2009.
This is subordinated debt capital within the meaning of § 23 Abs. 7 BWG.
These bonds are securities issued in a continuous manner.

PAGE 123
Non-voting non-ownership capital (Partizipationskapital)
In 2008, RLB NÖ-Wien AG issued 765,000 registered non-voting non-ownership “participation” certificates
(Partizipationsschein) within the meaning of § 23 Abs. 3 Z. 8. und Abs. 4 BWG. One such certificate has a face value of
€100.00. The non-voting non-ownership capital has been furnished for the duration of the enterprise and rights of ordinary
and extraordinary termination have been waived. This capital can only be reduced by virtue of the provisions of Austrian
stock corporation law, applied mutatis mutandis, or in accordance with the provisions of § 102 BWG. The return on the non-
voting non-ownership capital will depend on there being a profit, the profit share being €5.00 per non-voting non-ownership
certificate and financial year. This share of profit must be covered by RLB NÖ-Wien AG’s profit for the year for the purposes
of UGB/BWG.
(42) Contingent liabilities and other off-balance-sheet liabilities and commitments
The following off-balance-sheet liabilities and commitments existed at year-end:
€’000 2008 2007
Contingent liabilities 773,378 770,786
of which arising from other guarantees 725,705 706,902 of which arising from letters of credit 47,561 63,772
of which other contingent liabilities 112 112
Commitments 4,579,714 5,479,180
of which arising from revocable loan promises (stand-by facilities) 4,579,714 5,474,452
up to and including 1 year 3,388,537 3,789,639
more than 1 year 1,191,177 1,684,813
of which arising from “non-genuine” or “pseudo” repurchase agreements 0 4,728
RLB NÖ-Wien is a member of Raiffeisen-Kundengarantiegemeinschaft NÖ-Wien (Raiffeisen customer deposit guarantee
association in Lower Austria and Vienna). Under the provisions of the association’s memorandum and articles
(Vereinssatzung), it thus guarantees the joint and several settlement of payables to customers (as per line item 2 of Equity and liabilities on the Balance Sheet) and payables to other banks (as per line item 1 of Equity and liabilities on the Balance
Sheet) and securities issued by any insolvent member of the association up to a limit of the sum of the individual capacities
of the other members of the association.
The capacity of any one member of the association will depend on its freely available reserves subject to the pertinent
provisions of BWG.

PAGE 124
Raiffeisen-Kundengarantiegemeinschaft NÖ-Wien is, in turn, a member of Raiffeisen-Kundengarantiegemeinschaft Österreich (Raiffeisen customer deposit guarantee association in Austria), whose members are RZB and other Raiffeisen customer deposit guarantee associations in individual provinces. The purpose of the association is the same as that of
Raiffeisen-Kundengarantiegemeinschaft NÖ-Wien with respect to RZB and the members of the Raiffeisen Landeskundengarantiegemeinschaften (regional customer deposit guarantee associations) that have joined it (see also
point (31) Risk Report).
(43) “Genuine” repurchase agreements
The following repurchase and redelivery commitments existed at 31 December:
€’000 2008 2007
Genuine repurchase agreements, as pledgor
Commitments made to other banks 139,175 0 Commitments made to customers 0 30,000
Total 139,175 30,000
At year-end, the carrying amount of the securities subject to a sale and repurchase agreement came to €140,047 thousand
(year-end 2007: €30,000 thousand). No securities were purchased within the scope of a sale and repurchase agreement.

PAGE 125
(44) Assets pledged as collateral
The following assets recognized on the Balance Sheet were pledged as collateral for the liabilities listed below:
€’000 2008 2007
Securities lodged in connection with ECB tenders 1,836,851 1,354,717
Collateral for derivative contracts 929,080 204,370
Cover pool for issued covered partial debentures 682,540 751,218
Receivables assigned to OeKB 595,264 380,167
Receivables assigned to the European Investment Bank 122,697 116,609
Bonds lodged with OeKB in connection with EIB loans 66,162 64,087
Collateral for securities transactions with OeKB (securities) 29,348 25,221
Cover pool for fiduciary savings deposit balances 11,238 6,055
Bonds lodged with OeKB as a clearing link for the Deutsche Börse (Xetrahandel) 8,355 2,999
Government bond pledged in favour of Raiffeisen Wohnbaubank AG 6,151 6,149
Deposit for HOAM.AT (Home Accounting Module Austria, formerly ARTIS) lodged with OeNB 5,183 7,468
Collateral for securities transactions lodged with OeKB (cash deposit) 54 52

PAGE 126
The following liabilities were collateralized by the assets recognized on the Balance Sheet:
€’000 2008 2007
Deposits from other banks 2,726,721 1,913,374 Deposits from customers 6,136 2,709
Liabilities evidenced by paper 590,797 569,967
Other liabilities 929,080 204,370
Total 4,252,734 2,690,420
(45) Trust activities
Fiduciary balances on the balance-sheet date that were not included on the Balance Sheet changed as follows:
€’000 2008 2007
Loans and advances to customers 6,764 7,189
Fiduciary assets 6,764 7,189
Deposits from customers 6,764 7,189
Fiduciary liabilities 6,764 7,189
(46) Disclosure of bonds and other fixed-interest securities and of bonds issued by the Group in accordance with § 64 BWG Abs. 1 Z. 7 BWG
Bonds and other fixed-interest securities and bonds issued by the Group maturing in the year following the balance sheet
date broke down as follows:
€’000 2008 2007
a) Receivables arising from bonds and other fixed-interest securities 803,596 385,016
b) Payables arising from bonds issued by the Group 631,490 277,371

PAGE 127
(47) Disclosure of securities admitted for trading on an exchange in accordance with § 64 BWG Abs. 1 Z. 10 BWG
LISTED UNLISTED
€’000 2008 2007 2008 2007
Bonds and other fixed-interest securities 3,765,196 3,150,684 0 0 Shares and other variable-yield securities 187,248 231,706 0 0
Equity investments 0 22,204 0 0
(48) Disclosure of financial investments in accordance with § 64 Abs. 1 Z. 11 BWG
The securities included in the line items Bonds and other fixed-interest securities and Shares and other variable-yield securities that were admitted for trading on an exchange and were classified as investments broke down as follows:
€’000 2008 2007
a) Bonds and other fixed-interest securities 1,872,688 1,127,753 b) Shares and other variable-yield securities 138,707 75,832
Classification as Financial investments or Current financial assets was decided on a case-by-case basis by the responsible
bodies.
(49) Disclosure of (nominal) holdings in the trading book in accordance with § 22 BWG
€’000 2008 2007
Fixed-interest securities (face values) 123,343 470,409 Supplementary capital bonds (Ergänzungskapitalanleihen, face values) 450 550
Shares, investment certificates, participation notes (Genussrechte) (market prices) 0 30,147
Other financial instruments (derivatives, face values) 54,200,517 44,234,383

PAGE 128
(50) Regulatory own funds
The RLB NÖ-Wien Group is a subgroup of the Raiffeisen-Holding NÖ-Wien Group. The calculation of regulatory own funds
in accordance with § 24 BWG in conjunction with § 30 BWG is geared to the superordinate institution in the credit institution
group (Kreditinstitutsgruppe). Consequently, regulatory own funds are reported in the consolidated financial statements of
the Raiffeisen-Holding NÖ-Wien Group. BWG does not govern the regulatory own funds of subsidiaries that make up a
subgroup. The following presentation of RLB NÖ-Wien’s own funds within the meaning of BWG on the basis of
consolidation within the credit institution group is therefore provided for informational purposes only. They were calculated
in accordance with the valid provisions of BWG 1993 as amended in 2006 (Basel II). The figures as at 31 December 2007
were based on Basel I and were, therefore, not calculated on a comparable basis:
€’000 2008
BASEL II 2007
BASEL I
Paid-in capital 290,743 198,920
Earned capital 937,666 614,436
Minorities 125 2,774
Hybrid capital 0 0
Intangible assets (5,958) (3,775)
Tier 1 capital 1,222,576 812,355
Deductions from Tier 1 capital (128,951) (111,984)
Eligible Tier 1 capital (after deductions) 1,093,625 700,371
Supplementary capital within the meaning of § 23 Abs. 1 Z 5 BWG 281,705 267,667 Hidden reserves 13,300 25,000
Supplement in respect of amounts guaranteed 0 0
Long-term subordinated debt capital 264,528 212,721
Additional own funds 559,533 505,388
Deductions from additional own funds (128,950) (111,984)
Additional own funds (after deductions) 430,583 393,404
Eligible own funds 1,524,208 1,093,775
Tier 2 capital available to be reclassified as Tier 3 capital 43,831 60,823
Total own funds 1,568,039 1,154,598
Surplus own funds 521,232 344,312 Surplus own funds ratio 49.79% 42.49%
Tier 1 ratio (credit risk) 9.10% 7.48%
Own funds ratio (credit risk) 12.69% 11.68%
Total own funds ratio 11.98% 11.40%
The Tier 1 ratio and own funds ratio are stated in relation to the risk-weighted basis of assessment pursuant to § 22 BWG.

PAGE 129
The total own funds requirement was made up as follows:
€’000 2008
BASEL II 2007
BASEL I
Own funds requirement
Credit risk pursuant to § 22 Abs. 2 BWG 960,983 749,463
Trading book pursuant to § 22o Abs. 2 BWG 43,831 60,823
Operational risk pursuant to § 22i BWG 41,993 0
“Qualified” equity investments pursuant to § 29 Abs. 4 BWG 0 0
Total own funds requirement 1,046,807 810,286
Basis of assessment (credit risk) pursuant to § 22 Abs. 2 BWG 12,012,288 9,368,285
Information required to be disclosed pursuant to § 26 und § 26a BWG and the Offenlegungsverordnung (Austrian
disclosures directive) is published by the superordinate institution, Raiffeisen-Holding NÖ-Wien, on its website at
www.rhnoew.at. The corresponding information pertaining to RLB NÖ-Wien is published on its website at www.rlbnoew.at.
(51) Average number of staff
The average number of staff employed during the financial year (full time equivalents) broke down as follows:
2008 2007
White collar 1,168 1,118 Blue collar 0 0
Total 1,168 1,118
(52) Events after the balance sheet date and approval of the Consolidated Financial Statements
No extraordinary events took place after the balance sheet
date that might necessitate additional disclosures.
The Consolidated Financial Statements were completed by
the Managing Board during the Managing Board meeting
on 23 March 2009, are being examined by the Supervisory
Board and will be presented for approval during the
Supervisory Board meeting on 14 April 2009.

PAGE 130
OVERVIEW OF EQUITY INVESTMENTS (PURSUANT TO § 265 ABS. 2 UGB)
The tables below present the RLB NÖ-Wien Group’s equity investments.
(53) Consolidated subsidiaries
Entity SUBSCRIBED CAPITAL CURRENCY
PERCENTAGE
HELD TYPE 1
“ARSIS” Beteiligungs GmbH, Vienna (A) 140,000.00 € 100.00% OT
“BARIBAL” Holding GmbH, Vienna (A) 105,000.00 € 100.00% OT
“EXEDRA” Holding GmbH, Vienna (A) 70,000.00 € 100.00% OT
“FIBULA” Beteiligungs GmbH, Vienna (A) 70,000.00 € 100.00% OT
Acceptia Holding GmbH, Vienna (A) 35,000.00 € 100.00% OT
Raiffeisen Centropa Invest Verwaltungs- und Beteiligungs AG, Vienna (A) 250,000.00 € 80.00% OT
RLB NÖ-Vienna (A) Holding GmbH, Vienna (A) 70,000.00 € 100.00% OT
RLB NÖ-Vienna (A) Sektorbeteiligungs GmbH, Vienna (A) 35,000.00 € 100.00% OT
RLB Ostbankenholding GmbH, Vienna (A) 37,000.00 € 100.00% OT
Tatra Holding GmbH, Vienna (A) 37,000.00 € 100.00% OT
VAKS - Veranstaltungskartenservice Ges.m.b.H., Vienna (A) 37,000.00 € 100.00% OT
(54) Entities accounted for in the Consolidated Financial Statements using the equity method
Entity SUBSCRIBED CAPITAL CURRENCY
PERCENTAGE
HELD TYPE 1
Raiffeisenbank a.s., Prague (CZ) 6,564,000,000.00 Kč 24.00% BA
Raiffeisen Bank Zrt., Budapest (H) 45,129,140,000.00 Ft 16.23% BA
Raiffeisen International Bank-Holding AG, Vienna (A) 471,735,875.00 € 0.61% FH
Raiffeisen Zentralbank Österreich Aktiengesellschaft, Vienna (A) 443,713,864.00 € 31.41% BA
Tatra banka a.s., Bratislava (SK) 1,154,373,200.00 Sk 12.28% BA
Stock market prices of entities accounted for using the equity method:
€ per share 31 DECEMBER 2008
Raiffeisen International Bank-Holding AG 19.30

PAGE 131
Summary of financial information about entities accounted for using the equity method:
€’000 2008 2007
Assets 271,023,540 137,401,999 Liabilities 253,940,203 128,979,627
Net interest income 7,927,626 2,942,219
Profit for the year 1,284,536 778,280
(55) Non-consolidated subsidiaries
Entity SUBSCRIBED
CAPITAL CURRENCY PERCENTAGE
HELD TYPE 1
“AKTUELL” Raiffeisen Versicherungs-Maklerdienst Gesellschaft m.b.H., Vienna (A) 73,000.00 € 100.00% OT
“PRONEPOS” Immobilienentwicklungs- und Beteiligungs GmbH, Vienna (A) 35,000.00 € 100.00% OT
“PRUBOS” Beteiligungs GmbH, Vienna (A) 35,000.00 € 100.00% OT
“TEMISTO” Beteiligungs GmbH, Vienna (A) 35,000.00 € 100.00% OT
“TOJON” Beteiligungs GmbH, Vienna (A) 70,000.00 € 100.00% OT
AKTUELL-VERITAS Versicherungsmakler Gesellschaft m.b.H., Vienna (A) 40,188.00 € 90.42% OT
Baureo Projektentwicklungs GmbH, Vienna (A) 35,000.00 € 100.00% OT
B&E Projektmanagement GmbH, Vienna (A) 41,176.00 € 85.00% OT
KREBEG Finanzierungsberatungs GmbH, Vienna (A) 35,000.00 € 95.00% OT
MODAL-Gesellschaft für betriebsorientierte Bildung und Management GmbH, Vienna (A) 400,000.00 € 75.00% OT
NÖ Raiffeisen Kommunalservice Holding GmbH, Vienna (A) 35,000.00 € 100.00% OT
Raiffeisen-Einlagensicherung Niederösterreich-Wien (A) registrierte Genossenschaft mit beschränkter Haftung, Vienna (A) 41,936.00 € 98.40% OT
Raiffeisen Versicherungs- und Bauspar-Agentur GmbH, Vienna (A) 70,000.00 € 100.00% OT
RALV Holding GmbH, Vienna (A) 37,000.00 € 100.00% OT
RLB Businessconsulting GmbH, Vienna (A) 35,000.00 € 100.00% OT
RLB NÖ-W Factoring Beteiligungs GmbH, Vienna (A) 70,000.00 € 100.00% OT
RLB NÖ-Vienna (A) Leasingbeteiligungs GmbH, Vienna (A) 35,000.00 € 100.00% OT
TIONE Altbau-Entwicklung GmbH, Vienna (A) 37,000.00 € 100.00% OT
TSC Telefon Info-Service Center GmbH, Vienna (A) 37,000.00 € 100.00% BR
Veritas Treuhandgesellschaft für Versicherungsüberprüfung und -vermittlung m.b.H., Graz (A) 50,000.00 € 100.00% OT

PAGE 132
(56) Other equity investments
Associates not accounted for using the equity method:
Entity SUBSCRIBED
CAPITAL CURRENCY PERCENTAGE
HELD TYPE 1
“SALUTANS” Holding GmbH, Vienna (A) 35,000.00 € 50.00% OT
Central Danube Region Marketing & Development GmbH, Vienna (A) 200,000.00 € 50.00% OT
ecoplus International GmbH, Vienna (A) 35,000.00 € 30.00% OT
Die Niederösterreichische Leasing Gesellschaft m.b.H., Vienna (A) 36,400.00 € 40.00% OT
Die Niederösterreichische Leasing Gesellschaft m.b.H. & CO KG, Vienna (A) 2 — — — FI
e-force Internet-Entwicklungen für e-business GmbH, Linz (A) 39,375.00 € 20.28% OT
NÖ Beteiligungsfinanzierungen GmbH, Vienna (A) 1,816,820.85 € 29.00% BA
NÖ Raiffeisen Kommunalprojekte Service Gesellschaft m.b.H., Vienna (A) 50,000.00 € 74.00% FI
Raiffeisen Factoring Holding GmbH, Vienna (A) 35,000.00 € 35.77% OT
Raiffeisen Informatik GmbH, Vienna (A) 1,460,000.00 € 47.75% OT
Raiffeisen Software Solution und Service GmbH, Vienna (A) 773,000.00 € 37.83% OT
RSC Raiffeisen Daten Service Center GmbH, Vienna (A) 2,000,000.00 € 25.01% OT
STRATEGIE TEAM Strategieberatung GmbH, Vienna (A) 35,000.00 € 39.71% OT
As a result of contractual agreements, NÖ Raiffeisen Kommunalprojekte Service Gesellschaft m.b.H. and Die Niederösterreichische Leasing Gesellschaft m.b.H. & Co. KG were not controlled.
KEY: 1 Enterprise type
BA Bank
BR Enterprise rendering banking-related ancillary services
FH Financial holding company
FI Other financial institution
OT Other
2 Partner with unlimited liability.

PAGE 133
(57) Enterprises related via parent Raiffeisen-Holding NÖ-Wien
Of which consolidated subsidiaries of Raiffeisen-Holding NÖ-Wien “ADELANTE” Holding GmbH, Vienna (A) “BALURA” Holding GmbH, Vienna (A) “BELLAGIO” Holding GmbH, Vienna (A) “BORTA” Holding GmbH, Vienna (A) “CRIOLLA” Beteiligungs GmbH, Vienna (A) “DICUNIA” Beteiligungs GmbH, Vienna (A) “DIMALO” Beteiligungs GmbH, Vienna (A) “EMERIA” Beteiligungs GmbH, Vienna (A) “ERCOM” Beteiligungs GmbH, Vienna (A) “FILIUS” Holding GmbH, Vienna (A) “KORMUS” Holding GmbH, Vienna (A) “Küche & Kantine” Betrieb GmbH, (LLI AG subgroup), Vienna (A) “LAREDO” Beteiligungs GmbH, Vienna (A) “LOMBA” Beteiligungs GmbH, Vienna (A) “MARMARIS” Holding GmbH, Vienna (A) “MORUS” Beteiligungs GmbH, Vienna (A) “Octavia” Holding GmbH, Vienna (A) “OLIGO” Holding GmbH, Vienna (A) “PROCAS” Holding GmbH, Vienna (A) “PROKAP” Beteiligungs GmbH, Vienna (A) “RASKIA” Beteiligungs GmbH, Vienna (A) “RUMOR” Holding GmbH, Vienna (A) “SEPTO” Beteiligungs GmbH, Vienna (A) “TALIS” Holding GmbH, Vienna (A) “TERRA NOE” LiegenschaftsverwaltungsgmbH, Vienna (A) “URUBU” Holding GmbH, Vienna (A) AMPA s.r.o., (LLI AG subgroup), Pardubice (CZ) AURORA MÜHLE HAMBURG GmbH, (LLI AG subgroup), Hamburg (D) AURORA MÜHLEN GMBH, (LLI AG subgroup), Hamburg (D) AURORA POLSKA Sp. z o.o., (LLI AG subgroup), Kutno (PL) BEATA, spol. s r.o., (LLI AG subgroup), Netolice (CZ) BLR-Baubeteiligungs GmbH., Vienna (A) Botrus Beteiligungs GmbH, Vienna (A) cafe+co International Holding GmbH, (LLI AG subgroup), Vienna (A) cafe+co ltal- és Ételautomata Kft., (LLI AG subgroup), Alsónémedi (H) Delikomat Betriebsverpflegung Gesellschaft m.b.H., (LLI AG subgroup), Vienna (A) Delikomat Deutschland Automaten Catering GmbH, (LLI AG subgroup), Regensburg (D) DELIKOMAT d.o.o., (LLI AG subgroup), Maribor (SLO) Delikomat Polska Sp. z o.o., (LLI AG subgroup), Bielsko-Biała (PL) Delikomat s.r.o., (LLI AG subgroup), Brno (CZ) Delikomat West Betriebsverpflegung Ges.m.b.H., (LLI AG subgroup), Zirl (A) DELTA MLYNY s.r.o., (LLI AG subgroup), Kyjov (CZ) DEVELOP Baudurchführungs- und Stadtentwicklungs-Gesellschaft m.b.H., St. Pölten (A) DEVON GRUNDSTÜCKSVERWALTUNGS-GESELLSCHAFT MBH & Co. Mühlenobjekte KG, (LLI AG subgroup), Eschborn (D) Diamant International Malom Kft., (LLI AG subgroup), Baja (H) Diamant International Polska Mlyny Stanislawa Grygiera Sp.z o.o., (LLI AG subgroup), Poznań (PL) DIAMANT STRADUNIA Sp.z o.o., (LLI AG subgroup), Stradunia (PL) DZR Immobilien und Beteiligungs GmbH, Vienna (A) Eidermühle GmbH, (LLI AG subgroup), Hamburg (D) Erste Vienna (A)er Walzmühle Vonwiller Gesellschaft m.b.H., (LLI AG subgroup), Schwechat (A) Estezet Beteiligungsgesellschaft m.b.H., Vienna (A) Eudamonia Projektentwicklungs GmbH, Vienna (A) FARINA Mühlen GmbH, (LLI AG subgroup), Raaba (A)

PAGE 134
Fetzermühle GmbH, (LLI AG subgroup), Sontheim a.d. Brenz (D) FIDEVENTURA Beteiligungs GmbH, Vienna (A) Frischlogistik und Handel GmbH, Baden bei Wien (A) Fritsch Mühlenbetriebsgesellschaft m.b.H., (LLI AG subgroup), Schwechat (A) Gloria Mühlenwerke GmbH, (LLI AG subgroup), Hamburg (D) HOLSATIAMÜHLE GmbH, (LLI AG subgroup), Hamburg (D) KAMPFFMEYER Food Innovation GmbH, (LLI AG subgroup), Hamburg (D) Kampffmeyer Mühlen GmbH, (LLI AG subgroup), Hamburg (D) Kremser Landstrasse Projektentwicklung GmbH, Vienna (A) LBD Lebensmittel Beratungsdienst GmbH, (LLI AG subgroup), Mannheim (D) LEIPNIK-LUNDENBURGER INVEST Beteiligungs Aktiengesellschaft, Vienna (A) LLI EUROMILLS GmbH., (LLI AG subgroup), Vienna (A) Marchfelder Zuckerfabriken Gesellschaft m.b.H., (LLI AG subgroup), Vienna (A) MAZ Beteiligungs GmbH, (LLI AG subgroup), Vienna (A) Mecklenburger Elde-Mühlen GmbH, (LLI AG subgroup), Parchim (D) Mona Hungary Kft., Budapest (H) Müller’s Mühle GmbH, (LLI AG subgroup), Gelsenkirchen (D) NBV Beteiligungs- und Vermögensverwaltungsgesellschaft m.b.H., Vienna (A) Niederösterreichische Milch Holding GmbH, Vienna (A) NOBE Grundstücksverwaltung GmbH, (LLI AG subgroup), Hamburg (D) NÖM AG, Baden bei Wien (A) NOM DAIRY UK LIMITED, London (GB) NÖM International AG, Baden bei Wien (A) Nordland Mühlen GmbH, (LLI AG subgroup), Jarmen (D) PANNONMILL Malomipari Zrt., (LLI AG subgroup), Komárom (H) PANNONMILL -TAKARMANY Takarmanyipari Kft., (LLI AG subgroup), Komárom (H) Raiffeisen Agrar Holding GmbH, (LLI AG subgroup), Vienna (A) Raiffeisen Agrar Invest GmbH, (LLI AG subgroup), Vienna (A) RAIFFEISEN-HOLDING NÖ-Vienna (A) Beteiligungs GmbH, Vienna (A) RAIFFEISENLANDESBANK NIEDERÖSTERREICH-Vienna (A) AG, Vienna (A) RARITAS Holding GmbH, Vienna (A) R-FMZ Immobilienholding GmbH, Vienna (A) RFT Beteiligungs GmbH, Vienna (A) RH Anteilsverwaltungs GmbH, Vienna (A) RH Büroimmobilien Holding GmbH, Vienna (A) RH Finanzberatung und Treuhandverwaltung Gesellschaft m.b.H., Vienna (A) RH Finanzbeteiligungs GmbH, Vienna (A) RH Versicherungsholding GmbH, Vienna (A) Rosenmühle GmbH, (LLI AG subgroup), Ergolding (D) Rossauer Lände 3 Immobilienprojektentwicklung GmbH, Vienna (A) Schmid-Mühle Betriebs GmbH, (LLI AG subgroup), Schwechat (A) Schüttmühle Berlin GmbH, (LLI AG subgroup), Berlin (D) Sofia Mel AD, (LLI AG subgroup), Sofia (BG) St. Leopold Liegenschaftsverwaltungs- und Beteiligungsgesellschaft m.b.H., Vienna (A) TITAN S.A., (LLI AG subgroup), Pantelimon (RO) TOP-CUP Office-Coffee-Service Vertriebsgesellschaft m.b.H., (LLI AG subgroup), Klagenfurt (A) TOV Regionprodukt, Gnidin (UA) UNIMILLS a.s., (LLI AG subgroup), Prague (CZ) UNIMILLS - MIX s.r.o., (LLI AG subgroup), Prague (CZ) UNIMILLS - TRANS s.r.o., (LLI AG subgroup), Prague (CZ) Vendare Warenhandelsgesellschaft m.b.H., (LLI AG subgroup), Vienna (A) VK “Polen” GmbH, (LLI AG subgroup), Hamburg (D) VK Mühlen Aktiengesellschaft, (LLI AG subgroup), Hamburg (D) VK MÜHLEN POLSKA Sp.z o.o., (LLI AG subgroup), Grodzisk Wielkopolski (PL) Zucker-Beteiligungsgesellschaft m.b.H., Vienna (A) Zucker Invest GmbH, Vienna (A) Zuckermarkt - Studiengesellschaft m.b.H., Vienna (A) Zucker Vermögensverwaltungs GmbH, Vienna (A)

PAGE 135
Of which non-consolidated entities in the Raiffeisen Holding NÖ-Wien Group: “ALDOS” Beteiligungs GmbH, Vienna (A) “ALMARA” Holding GmbH, Vienna (A) “ARAGOS” Beteiligungs GmbH, Vienna (A) “BANUS” Beteiligungs GmbH, (LLI AG subgroup), Vienna (A) “BASCO” Beteiligungs GmbH, Vienna (A) “BENEFICIO” Holding GmbH, Vienna (A) “BONADEA” Immobilien GmbH, Vienna (A) “CREMBS” Hotelbetriebsgesellschaft m.b.H., Krems (A) “ELIGIUS” Holding GmbH, Vienna (A) “ESTELEC” Beteiligunsg GmbH, Vienna (A) “EUSEBIO” Beteiligungs GmbH, Vienna (A) “GINAWE” Beteiligungs GmbH, Vienna (A) “HELANE” Beteiligungs GmbH, Vienna (A) “MAURA” Immobilien GmbH, Vienna (A) “NESSOS” Beteiligungs GmbH, Vienna (A) “PIANS” Beteiligungs GmbH, Vienna (A) “PINUS” Liegenschaftsverwaltungs GmbH, Vienna (A) “RUFUS” Beteiligungs GmbH, Vienna (A) “SANSARA” Holding GmbH, Vienna (A) “SERET” Beteiligungs GmbH, Vienna (A) “SEVERUS” Beteiligungs GmbH, Vienna (A) ABC Reiseservice GmbH, Vienna (A) Beteiligungsgesellschaft Diamant Mühle Hamburg mbH, (LLI AG subgroup), Hamburg (D) Big Push Vertrieb GmbH, (LLI AG subgroup), Vienna (A) Bioenergie Orth a. d. Donau GmbH, Vienna (A) Café+co Rus, ZAO, (LLI AG subgroup), Moscow (RU) CAFE+CO Timisoara S.R.L., (LLI AG subgroup), Timişoara (RO) C - Holding s.r.o., (LLI AG subgroup), Modřice (CZ) CEZAR Sp. z o.o., (LLI AG subgroup), Warsaw (PL) DELIKOMAT d.o.o., (LLI AG subgroup), Zagreb (HR) DELIKOMAT d.o.o., (LLI AG subgroup), Tomislavgrad (BiH) DELIKOMAT d.o.o., (LLI AG subgroup), Belgrade (RS) Delikomat Slovensko, spol. s r.o., (LLI AG subgroup), Bratislava (SK) Diana Slovakia, spol. s r.o., Bratislava (SK) Drück- und Trink-Verpflegungsautomaten Betriebsgesellschaft m.b.H. (in liquidation), (LLI AG subgroup), Vienna (A) Echion Projektentwicklungs GmbH, Vienna (A) EFS Espresso Full Service GmbH (in liquidation), (LLI AG subgroup), Munich (D) EOD - Obere Donaustrasse Immobilienprojektentwicklung GmbH & Co KG, Vienna (A) Epsilon Beteiligungsgesellschaft m.b.H., Vienna (A) Farina Marketing d.o.o., (LLI AG subgroup), Ljubljana (SLO) Gesundheitspark St. Pölten Errichtungs- und Betriebs GmbH, Vienna (A) Haldenhof Liegenschaftsverwaltungs- und -verwertungsges.m.b.H., Vienna (A) Holz- und Energiepark Vitis GmbH, Vienna (A) Intech Vertriebsgesellschaft mbH, (LLI AG subgroup), Hamburg (D) Internationales Reisebüro Primus-GmbH, Vienna (A) Kasernen Immobilienerrichtungsgesellschaft mbH, Vienna (A) KASERNEN Projektentwicklungs- und Beteiligungs AG, Vienna (A) LENTIA Immobilien- und Projektentwicklungs GmbH, Vienna (A) MARKANT-Gesellschaft für Werbung, Kommunikationsberatung, Handel und Veranstaltungen Gesellschaft m.b.H., Vienna (A) MID 5 Holding GmbH, Vienna (A) Müfa Mehl und Backbedarf Handelsgesellschaft mbH, (LLI AG subgroup), Hamburg (D) Neue Marktgasse Einkaufspassage Stockerau GmbH, Vienna (A) Neuss & Wilke GmbH, (LLI AG subgroup), Gelsenkirchen (D) Obere Donaustrasse Immobilienprojektentwicklung GmbH, Vienna (A) PBS Immobilienholding GmbH, Vienna (A) PBS Immobilienprojektentwicklungs GmbH, Vienna (A) Pegasus Incoming Gesellschaft m.b.H., Vienna (A) Raiffeisen Analytik GmbH, Vienna (A)

PAGE 136
Raiffeisen-Fachmarktzentrum SIEBEN GmbH, Vienna (A) Raiffeisen-Fachmarktzentrum VIER GmbH, Vienna (A) Raiffeisen-Fachmarktzentrum ZWEI GmbH, Vienna (A) RAIFFEISEN IMMOBILIEN VERMITTLUNG GES.M.B.H., Vienna (A) Raiffeisen MEDKF Projektentwicklungs GmbH, Vienna (A) Raiffeisen PPP Infrastruktur Beteiligungs GmbH, Vienna (A) Raiffeisen-Reisebüro Gesellschaft m.b.H., Vienna (A) Raiffeisen Vorsorgewohnungserrichtungs GmbH, Vienna (A) Raiffeisen Wohnbauprojektentwicklung GmbH, Vienna (A) RBZ Holding GmbH, Vienna (A) RENERGIE Carbex Trade GmbH, Vienna (A) RENERGIE Carbon GmbH, Vienna (A) RENERGIE Dorf Mecklenburg GmbH & Co. KG, Wetterzeube OT Trebnitz (D) RENERGIE green solutions GmbH, Wetterzeube OT Trebnitz (D) RENERGIE green solutions Management GmbH, Wetterzeube OT Trebnitz (D) RENERGIE Lübars GmbH & Co. KG, Wetterzeube OT Trebnitz (D) RENERGIE Raiffeisen Managementgesellschaft für erneuerbare Energie GmbH, Vienna (A) R-FMZ “MERCATUS” Holding GmbH, Vienna (A) RH WEL Beteiligungs GmbH, Vienna (A) ROLLEGG Liegenschaftsverwaltungs GmbH, Vienna (A) RomReal Immobilienprojektentwicklung GmbH (in liquidation), Vienna (A) Schöpferstrasse Projektentwicklung GmbH, Vienna (A) snack+co GmbH, (LLI AG subgroup), Vienna (A) St. Hippolyt Beteiligungs-GmbH, Vienna (A) Steinmetz-Mehl Vertriebsgesellschaft Süd GmbH, (LLI AG subgroup), Aalen (D) Ströh & Kottmann Steinmetzmehl Vertriebsgesellschaft mbH, (LLI AG subgroup), Grevenbroich (D) TECHBASE Science Park Vienna GmbH, Vienna (A) Techno-Park Tulln GmbH, Wiener Neudorf (A) THE AUTHENTIC ETHNIC FOOD COMPANY GmbH, (LLI AG subgroup), Gelsenkirchen (D) Theranda Entwicklungsgenossenschaft für den Kosovo registrierte Genossenschaft mit beschränkter Haftung, Vienna (A) TOP CUP Deutschland office-coffee Service GmbH, (LLI AG subgroup), Regensburg (D) WALDSANATORIUM PERCHTOLDSDORF GmbH, Salzburg (A) Waldviertel Immobilien-Vermittlung GmbH, Zwettl (A) wertCorn GmbH Getreidespezialitäten, (LLI AG subgroup), Hameln (D) Wirtschaftspark Eibesbrunn GmbH, Vienna (A) ZEG Immobilien- und Beteiligungs registrierte Genossenschaft mit beschränkter Haftung, Vienna (A)

PAGE 137
BOARDS AND OFFICERS
Managing Board:
Chairman:
Erwin HAMESEDER
Deputy Chairman:
Robert GRUBER
Members:
Georg KRAFT-KINZ
Michael RAB
Gerhard REHOR
Supervisory Board:
Chairman:
Christian KONRAD
Deputy Chairman:
Johann VIEGHOFER
Members:
Anton BODENSTEIN
Franz HUBINGER
Alfons NEUMAYER
Johann PLACHWITZ
Gerhard PREISS
Christian RESCH
Staff Council delegates:
Johann AMON
Anton HECHTL
Heinz PFEFFER
Sibylla WACHSLER
State commissioners:
Alfred LEJSEK
Silvia ZENDRON
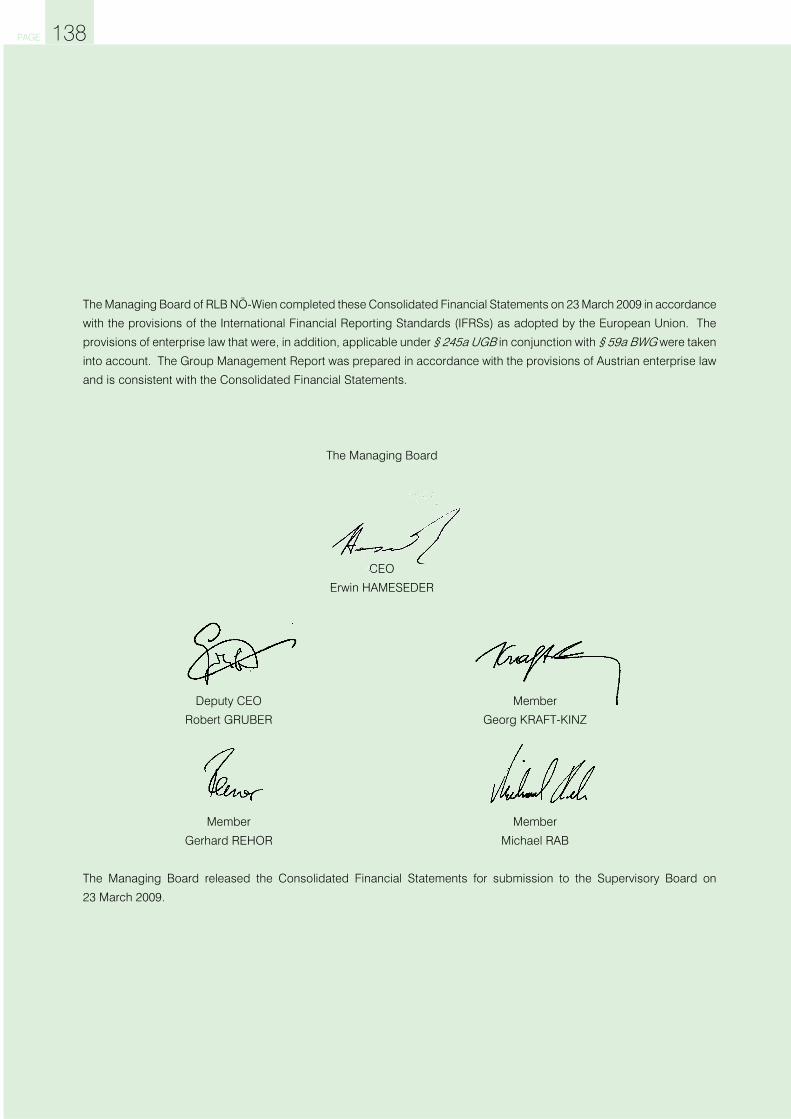
PAGE 138
The Managing Board of RLB NÖ-Wien completed these Consolidated Financial Statements on 23 March 2009 in accordance
with the provisions of the International Financial Reporting Standards (IFRSs) as adopted by the European Union. The
provisions of enterprise law that were, in addition, applicable under § 245a UGB in conjunction with § 59a BWG were taken
into account. The Group Management Report was prepared in accordance with the provisions of Austrian enterprise law
and is consistent with the Consolidated Financial Statements.
The Managing Board
CEO
Erwin HAMESEDER
Deputy CEO
Robert GRUBER
Member
Georg KRAFT-KINZ
Member
Gerhard REHOR
Member
Michael RAB
The Managing Board released the Consolidated Financial Statements for submission to the Supervisory Board on
23 March 2009.

PAGE 139
We declare that, to the best of our knowledge, the Consolidated Financial Statements prepared in accordance with the
applicable financial reporting standards present fairly, in all material respects, the assets, liabilities and financial position of
the RLB NÖ-Wien Group and its profit or loss, that the Group Management Report presents the business performance,
business results and position of the RLB NÖ-Wien Group in such a way that it presents fairly, in all material respects, the
assets, liabilities and financial position of the Group and its profit or loss, and that the Group Management Report describes
the material risks and uncertainties to which the Group is subject.
Vienna
23 March 2009
The Managing Board
CEO
Erwin HAMESEDER
Deputy CEO
Robert GRUBER
Member
Georg KRAFT-KINZ
Member
Gerhard REHOR
Member
Michael RAB
DECLARATION BY THE MANAGING BOARD

PAGE 140
Report on the Consolidated Financial Statements
We have audited the attached Consolidated Financial Statements of
RAIFFEISENLANDESBANK NIEDERÖSTERREICH-WIEN AG, Vienna, Austria,
for the financial year from 1 January to 31 December 2008. Those financial statements comprise the Consolidated Balance
Sheet as at 31 December 2008 and the Consolidated Income Statement, Consolidated Cash Flow Statement and
Consolidated Statement of Changes in Equity for the financial year ended 31 December 2008 and a summary of material
measurement and recognition policies and other explanatory notes.
Management’s Responsibility for the Financial Statements
Management is responsible for the preparation of these Consolidated Financial Statements and fair presentation, in all
material respects, of the Group’s assets and liabilities and financial position and its profit or loss in accordance with the
International Financial Reporting Standards (IFRSs) as adopted by the EU. This responsibility includes: designing,
implementing and maintaining an internal control system insofar as this is material to the preparation of consolidated
financial statements and the fair presentation, in all material respects, of the Group’s assets and liabilities and financial
position and its profit or loss so as to ensure that these consolidated financial statements are free from material
misstatement, whether due to fraud or error; selecting and applying appropriate accounting policies; and making accounting
estimates that are reasonable in the circumstances.
Auditor’s Responsibility
Our responsibility is to express an opinion on these Consolidated Financial Statements based on our audit. We conducted
our audit in accordance with the laws and regulations applicable in Austria and the International Standards on Auditing
(ISAs) issued by the International Auditing and Assurance Standards Board (IAASB) of the International Federation of
Accountants (IFAC). Those standards require that we comply with rules of professional conduct and plan and perform the
audit to obtain reasonable assurance as to whether the Consolidated Financial Statements are free from material
misstatement.
An audit involves performing procedures to obtain audit evidence regarding the amounts and other disclosures in the
Consolidated Financial Statements. The procedures selected depend on the auditor’s judgement, including his assessment
of the risks of material misstatement, whether due to fraud or error. In making those risk assessments, the auditor considers
the internal control system insofar as it is relevant to the preparation of consolidated financial statements and fair
presentation, in all material respects, of the Group’s assets and liabilities and financial position and its profit or loss in order
to design audit procedures that are appropriate in the circumstances, but not for the purpose of expressing an opinion on
the effectiveness of the group’s internal control system. An audit also includes evaluation of the appropriateness of the
accounting policies used and the reasonableness of material accounting estimates made by Management as well as
evaluating the overall presentation of the financial statements.
AUDITORS’ REPORT (REPORT BY THE INDEPENDENT AUDITORS) [TRANSLATION]

PAGE 141
We believe that the audit evidence we have obtained is sufficient and appropriate to provide a basis for our audit opinion.
Opinion
Our audit did not give rise to any objections. Based on the results of our audit, in our opinion, the Consolidated Financial
Statements satisfy the legislative requirements and present fairly, in all material respects, the assets and liabilities and
financial position of the group as of 31 December 2008 and its profit or loss and cash flows in the financial year from 1
January to 31 December 2008 in accordance with the International Financial Reporting Standards (IFRSs) as adopted by the
EU.
Report on Other Legal Requirements
Austrian legislative provisions require us to perform audit procedures to ascertain whether the Group Management Report is
consistent with the Consolidated Financial Statements and whether the other statements made in the Group Management
Report give rise to misconception of the position of the group.
In our opinion, the Group Management Report is consistent with the Consolidated Financial Statements.
Vienna
23 March 2009
Österreichischer Raiffeisenverband
KPMG Austria GmbH Wirtschaftsprüfungs- und Steuerberatungsgesellschaft
Christian Loicht Wirtschaftsprüfer
Wilhelm Kovsca Wirtschaftsprüfer
Franz Frauwallner Wirtschaftsprüfer
(Austrian Chartered Accountants)

PAGE 142
Backtesting — The backward comparison of computed
VaR figures with actual results to test the quality of
a model.
Banking book — All positions not assigned to the trading
book.
Basis of assessment — The risk-weighted basis of
assessment within the meaning of § 22 BWG (see
Risk-weighted assets); based on Basel II since
1 January 2008.
BWG — [Austrian] federal banking act
(Bankwesengesetz).
Cash flows — Inflows and outflows of cash and cash
equivalents.
Cash flow statement — Statement of cash flows during
the financial year from and used in operating
activities, investing activities and financing
activities and a reconciliation of cash and cash-
equivalents held at the beginning and the end of
the financial year.
Clean price — The price of an interest rate instrument
without accrued interest.
Consolidated return on equity — Consolidated profit for
the year in relation to average equity on the
Balance Sheet (without minority interests).
Tier 1 capital — Paid-in capital and reserves less intan-
gible assets and balance-sheet losses and
material losses during the current financial year;
based on Basel II since 1 January 2008.
Tier 1 ratio — This ratio’s numerator is Tier 1 capital and
its denominator is the basis of assessment for the
purposes of § 22 BWG; based on Basel II since
1 January 2008.
Cost:income ratio — Indicator of an enterprise’s cost
efficiency based on the ratio of its expenses to its
earnings. It is calculated by comparing general
administrative expenses (comprising staff costs
and other administrative expenses and
depreciation/amortization/write-offs of property,
equipment and intangible assets) with operating
income (net interest income, net fee and
commission income, net trading income, net
income from investments in entities accounted for
using the equity method and other operating
profit).
Credit derivatives — Instruments used to transfer to
another party the credit risks associated with
loans, bonds, other risk assets and market risk
positions.
Credit exposures — These comprises all on-balance-
sheet exposures (loans and advances, bonds)
and off-balance-sheet exposures (guarantees,
credit lines).
Currency risk — The risk that the value of a financial
instrument will change due to changes in foreign
exchange rates.
Default risk — The risk that a counterparty in a financial
transaction will not be able to fulfil an obligation,
causing the other party a financial loss.
Derivative — A contract whose value changes in
response to the change in a specified interest rate,
security price, commodity price, foreign exchange
rate, index of prices or rates, credit rating or credit
index or similar variable, that requires no initial net
GLOSSARY

PAGE 143
investment or little initial net investment and that is
settled at a future date.
Dirty price — Price of an interest rate instrument including
accrued interest.
Earnings per Share — Consolidated profit for the year
divided by the average number of ordinary shares
in issue.
Entities accounted for using the equity method — Entities
over whose operating or financial policies an
investor has a significant influence.
Fair value — The amount for which an asset could be
exchanged, or a liability settled, between
knowledgeable, willing parties in an arm’s length
transaction.
Financial asset/liability held for trading — Financial
asset/liability used to generate a profit from short-
term fluctuations in price or dealer’s margin.
Future — A standardized forward contract traded on an
exchange under which a commodity in the money,
capital, precious metal or currency markets is to
be delivered or accepted on a specified date and
at a previously agreed price.
Hedge — A transaction to protect existing or future
positions against the exposure to risks (e.g. price
or interest rate risks).
Held-to-maturity investments — Financial assets with
fixed or determinable payments and a fixed
maturity that an enterprise has the positive intent
and ability to hold to maturity.
IFRIC, SIC — International Financial Reporting
Interpretation Committee: Interpreter of the
International Financial Reporting Standards;
formerly also called SIC (Standing Interpretations
Committee).
IFRS, IAS — The International Financial Reporting
Standards and International Accounting Standards
are reporting standards published by the IASB
(International Accounting Standards Board) with
the goal of achieving transparent and comparable
accounting on an international basis.
Interest rate risk — The risk that the value of a financial
instrument will change due to fluctuations in
market interest rates.
Liquidity risk — The risk that an enterprise will be unable
to raise funds to meet commitments associated
with financial instruments. Liquidity risk may also
result from an inability to sell a financial asset
quickly and at any time at its fair value.
Market risk — The risk that the value of a financial
instrument will change as a result of fluctuations in
market prices, whether those fluctuations are
caused by factors specific to the individual
security or its issuer or by factors affecting all
securities traded in the market.
Operational risk — The risk of losses resulting from failed
systems or processes or caused by staff members
or outside parties.
Option — An instrument that gives the holder the right to
purchase the underlying from a contracting party
at a prearranged price and at an agreed time or
within an agreed period (call option) or to sell the
underlying to a contracting party at a prearranged
price and at an agreed time or within an agreed
period (put option).

PAGE 144
OTC instruments — Financial instruments that are neither
standardized nor traded on an exchange. They
are traded directly between market participants
over-the-counter.
Own funds ratio — This ratio’s numerator is eligible own
funds within the meaning of BWG and its
denominator is the basis of assessment pursuant
to § 22 BWG; based on Basel II since
1 January 2008.
Own funds within the meaning of BWG — These are
made up of Tier 1 capital, supplementary and sub-
ordinated debt capital (Tier 2) and short-term
subordinated debt capital and reclassified Tier 2
capital (Tier 3); based on Basel II since 1 January
2008.
Risk:earnings ratio — The charge for impairment losses
on loans and advances in relation to net interest
income.
Risk-weighted assets — The total of the assets, off-
balance-sheet items and special off-balance-sheet
items in the banking book weighted according to
business and/or counterparty risk, determined in
accordance with the Austrian Bankwesengesetz (banking act); based on Basel II since
1 January 2008.
ROE (return on equity) — Profit before tax or after tax in
relation to average equity on the Balance Sheet
(including minority interests).
Stress tests — Stress tests attempt to simulate extreme
fluctuations in market parameters. They are used
because such fluctuations are, as a rule,
inadequately taken account of by VaR models
(VaR figures forecast maximum losses under
normal market conditions).
Surplus own funds ratio — Surplus own funds in relation
to the total own funds requirement; based on
Basel II since 1 January 2008.
Swap — Exchange of fixed and/or variable interest
obligations (interest rate swap) and/or currency
positions (currency swap).
Trading book — Bank regulators’ term for positions held
by a bank for short-term resale to exploit
fluctuations in prices and interest rates.
UGB — Unternehmensgesetzbuch: Austrian enterprises
code.
Undiluted earnings per share — The amount of
consolidated profit for the period attributable to
ordinary shareholders divided by the weighted
average number of ordinary shares in issue during
the period.
VaR — Value at risk expresses the potential loss that will,
with a 99 per cent probability, not be exceeded in
the portfolio in question within the specified
holding period.

PAGE 145
INFORMATION IN THE INTERNET
Raiffeisenlandesbank Niederösterreich-Wien’s website
provides detailed, up-to-date information about Raiffeisen at www.raiffeisenbank.at.
PUBLICATION DETAILS
Published by:
Raiffeisenlandesbank Niederösterreich-Wien AG
Friedrich-Wilhelm-Raiffeisen-Platz 1, A-1020 Wien, Austria
Phone: +43-5-1700; Fax: +43-5-1700-901
www.raiffeisenbank.at, [email protected]
Publication Officer:
Peter Wesely
Phone: +43-5-1700-93004
Consolidated Financial Statements prepared in
accordance with IFRSs:
Editing and Coordination:
Accounts and Controlling at RLB NÖ-Wien
Reinhold Grossebner and his team
Typesetting:
Produced in-house using FIRE.sys , Michael Konrad GmbH, Frankfurt
Translated by Adrian Weisweiller BA (Oxon), MA (Oxon),
London
Orders:
Press Office,
Raiffeisenlandesbank Niederösterreich-Wien AG
Friedrich-Wilhelm-Raiffeisen-Platz 1, A-1020 Wien, Austria
Elfriede Duda: +43-1-21 136-2466
Copy deadline: 6 April 2009
Enquiries should be addressed to RLB NÖ-Wien’s Press
Department at the above address.

PAGE 146
Note and Disclaimer:
A few market participants tend to attempt to derive claims from statements regarding expected future developments and assert those claims in court. Because of the occasional but serious effects of such actions on the company concerned and on its equity holders, many companies keep statements about their expectations regarding future developments to the mandatory minimum required by legislation. However, the RLB NÖ-Wien Group does not see the publication of its financial reports merely as a duty. It would also like to use them as an opportunity for open communication. To ensure that this will continue to be possible, we stress the following: The forecasts, plans and forward-looking statements contained in this Report are based on the RLB NÖ-Wien Group’s state of knowledge and assessments at the time of its preparation. Like all forward-looking statements, they are subject to risks and uncertainties that could cause actual results to differ substantially from those being predicted. No guarantee can be given that forecasts, planned values and forward-looking statements will prove accurate. We prepared this Financial Report with the greatest possible care and checked the data. Nonetheless, we cannot rule out rounding, transmission, typesetting or printing errors. This Report was written in German. The English report is a translation of the German report. The German version is the only authentic version.