Embed Size (px)
Citation preview

Group analysesGroup analyses
Wellcome Dept. of Imaging Neuroscience
University College London
Will PennyWill Penny
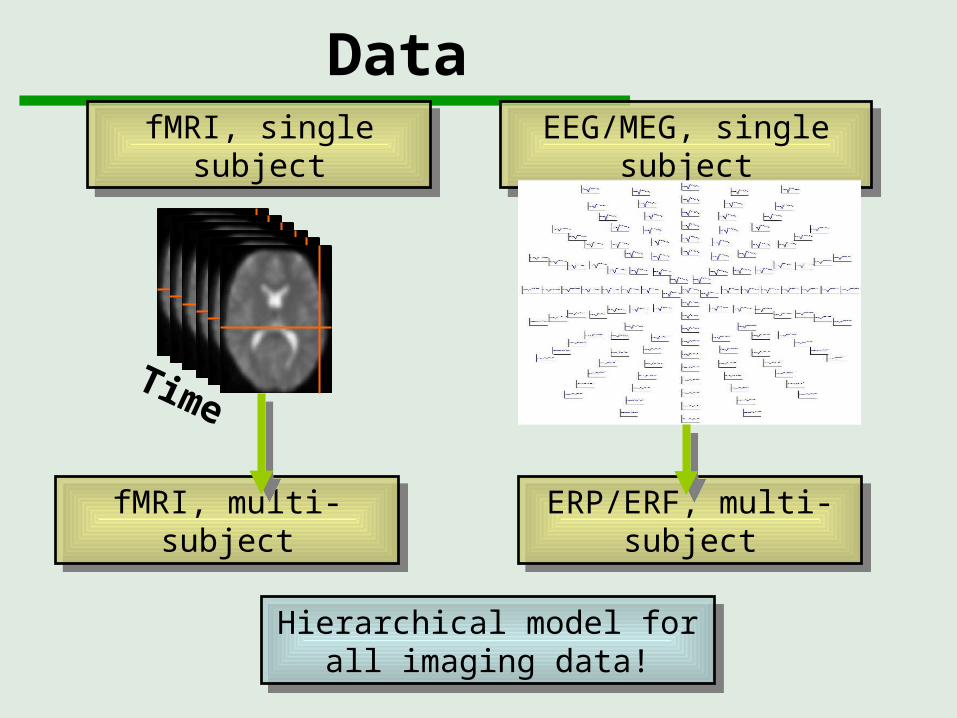
Data
fMRI, single subjectfMRI, single subject
fMRI, multi-subjectfMRI, multi-subject ERP/ERF, multi-subjectERP/ERF, multi-subject
EEG/MEG, single subjectEEG/MEG, single subject
Hierarchical model for all imaging data!
Hierarchical model for all imaging data!
Time

Time
Intensity
Tim
e
single voxeltime series
single voxeltime series
Reminder: voxel by voxel
modelspecification
modelspecification
parameterestimation
parameterestimation
hypothesishypothesis
statisticstatistic
SPMSPM

General Linear Model Xy
=
+X
N
1
N N
1 1p
p
Model is specified by1. Design matrix X2. Assumptions about
Model is specified by1. Design matrix X2. Assumptions about
N: number of scansp: number of regressors
N: number of scansp: number of regressors
y
k kk
QC Error Covariance

Estimation
1. ReML-algorithm1. ReML-algorithm
gJ
d
LdJ
d
dLg
1
2
2
Friston et al. 2002, Neuroimage
Friston et al. 2002, Neuroimage
kk
kQC Maximise L ln ) ln , )p(y | λ p(y | λ d
111
NppNN
Xy
L
g
2. Weighted Least Squares2. Weighted Least Squares
1 1( )T T Te eX C X X C y

)()()()1(
)2()2()2()1(
)1()1()1(
nnnn X
X
Xy
)()()( i
k
i
kk
i QC
Hierarchical model
Hierarchical modelHierarchical model Multiple variance components at each level
Multiple variance components at each level
At each level, distribution of parameters is given by level above.
At each level, distribution of parameters is given by level above.
What we don’t know: distribution of parameters and variance parameters.
What we don’t know: distribution of parameters and variance parameters.

=
Example: Two level model
2221
111
X
Xy
1
1+ 1 = 2X
2
+ 2y
)1(1X
)1(2X
)1(3X
Second levelSecond level
First levelFirst level

)()()()1(
)2()2()2()1(
)1()1()1(
nnnn X
X
Xy
Estimation
Hierarchicalmodel
Hierarchicalmodel
Single-levelmodel
Single-levelmodel
(1) (1) (2)
(1) ( 1) ( )
(1) ( ) ( )
...n n
n n
y X
X X
X X
X e

Group analysis in practice
Many 2-level models are just too big to compute.
Many 2-level models are just too big to compute.
And even if, it takes a long time! And even if, it takes a long time!
Is there a fast approximation?Is there a fast approximation?
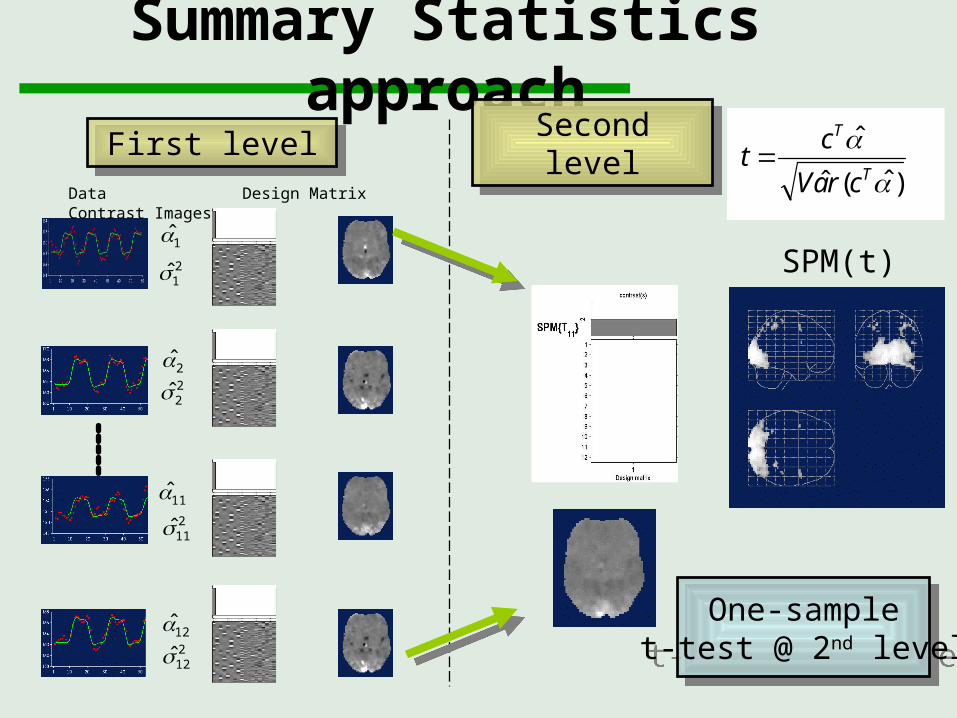
Data Design Matrix Contrast Images )ˆ(ˆ
ˆ
T
T
craV
ct
SPM(t)
Summary Statistics approach
1̂
2̂
11̂
12̂
21̂
22̂
211̂
212̂
Second levelSecond levelFirst levelFirst level
One-samplet-test @ 2nd level
One-samplet-test @ 2nd level
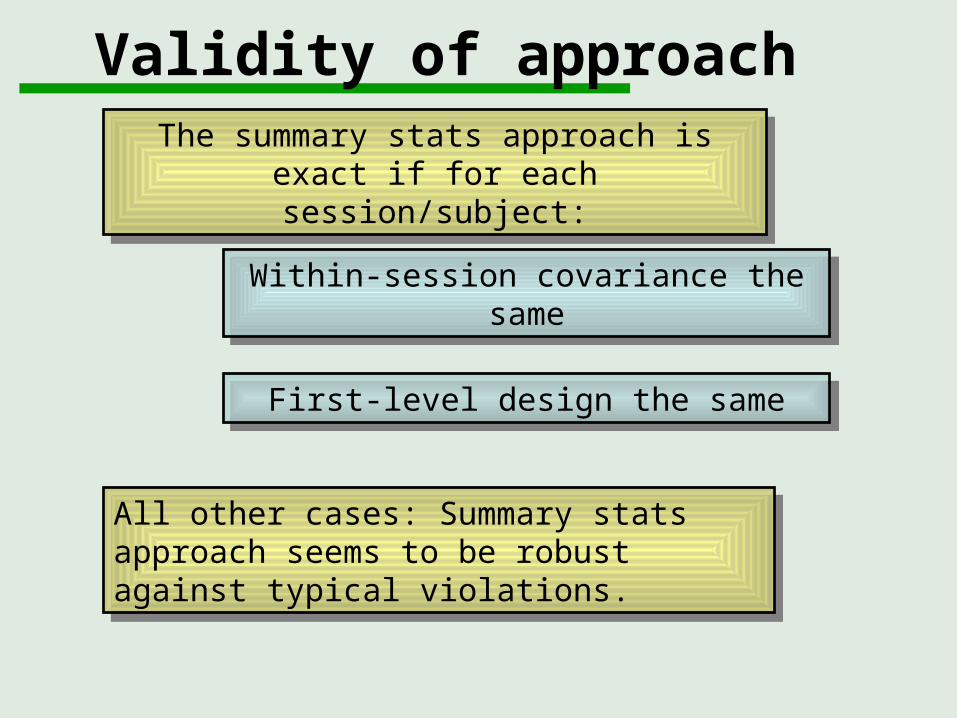
Validity of approach
The summary stats approach is exact if for each session/subject:
The summary stats approach is exact if for each session/subject:
All other cases: Summary stats approach seems to be robust against typical violations.
All other cases: Summary stats approach seems to be robust against typical violations.
Within-session covariance the sameWithin-session covariance the same
First-level design the sameFirst-level design the same

Friston et al. (2004) Mixed effects and fMRI studies, Neuroimage
Friston et al. (2004) Mixed effects and fMRI studies, Neuroimage
Summarystatistics
Summarystatistics
HierarchicalModel
HierarchicalModel
Auditory Data

Multiple contrasts per subject
Stimuli:Stimuli: Auditory Presentation (SOA = 4 secs) of words Auditory Presentation (SOA = 4 secs) of words
Subjects:Subjects:
fMRI, 250 scans persubject, block design
fMRI, 250 scans persubject, block designScanning:Scanning:
U. Noppeney et al.U. Noppeney et al.
(i) 12 control subjects(i) 12 control subjects
Motion Sound Visual Action
“jump” “click” “pink” “turn”
Question:Question:What regions are affectedby the semantic content ofthe words?
What regions are affectedby the semantic content ofthe words?

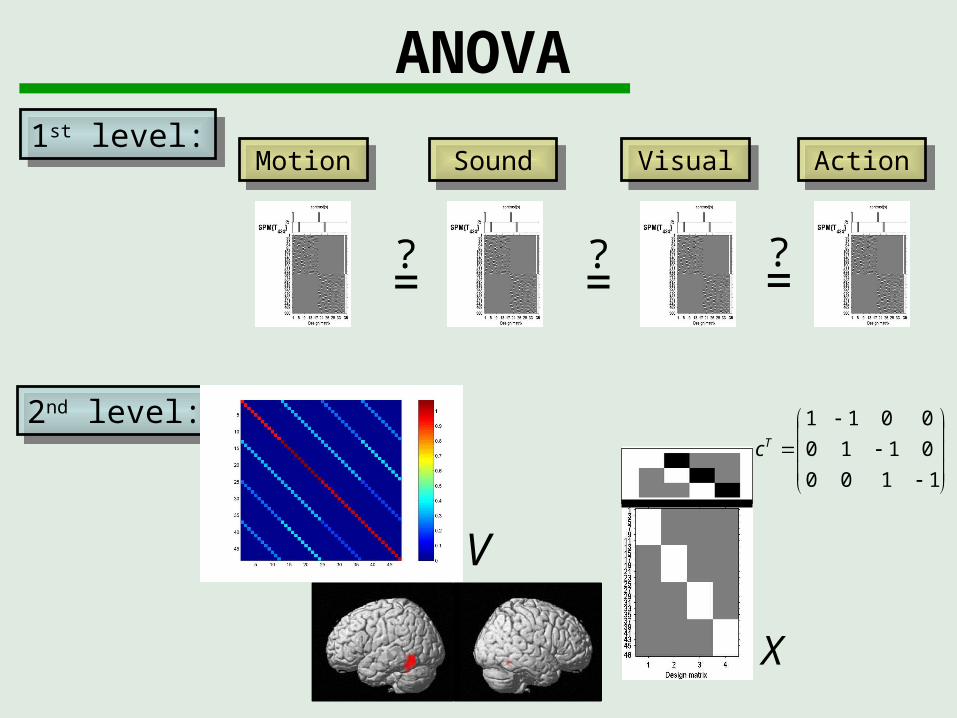
ANOVA
1st level:1st level:
2nd level:2nd level:
3.Visual3.Visual 4.Action4.Action
X
?=
?=
?=
1.Motion1.Motion 2.Sound2.Sound
1st level:1st level:
2nd level:2nd level:
VisualVisual ActionAction
X
1100
0110
0011Tc
?=
?=
?=
MotionMotion SoundSound
V
X
ANOVA

Summary
Linear hierarchical models are general enough for typical multi-subject imaging data (PET, fMRI, EEG/MEG).
Linear hierarchical models are general enough for typical multi-subject imaging data (PET, fMRI, EEG/MEG).
Summary statistics are robust approximation for group analysis.
Summary statistics are robust approximation for group analysis.
Also accomodates multiple contrasts per subject.Also accomodates multiple contrasts per subject.