Embed Size (px)
Citation preview

Groundwater Model of the Nahr Ibrahim Valley, Lebanon
by
Aimee Fitzpatrick
B.S., Civil and Environmental Engineering (2000)Worcester Polytechnic Institute
Submitted to the Department of Civil and Environmental Engineeringin Partial Fulfillment of the Requirements for the Degree of
Master of Engineering in Civil and Environmental Engineering
at the
Massachusetts Institute of Technology
June 2001
© 2001 Aimee FitzpatrickAll rights reserved
The author hereby grants to M.I.T. permission to reproduce and to distribute publiclypaper and electronic copies of this thesis document in whole and in part.
Signature of AuthorDeaigment of Civil and Environmental Engineering
May 11, 2001
Certified bydharles F. Harvey
Assistant Professor of Civil and Environmental EngineeringThesis Supervisor
Accepted byOral Buyukozturk
Chairman, Departmental Committee on Graduate StudiesMASSACHUSETTS INSTITUTE
OF TECHNOLOGY BARKER
JUN 0 4 2001
LIBRARIES

2
Groundwater Model of the Nahr Ibrahim Valley, Lebanon
by
Aimee Fitzpatrick
Submitted to the Department of Civil and Environmental Engineeringon May 11, 2001 in Partial Fulfillment of the
Requirements for the Degree of Master of Engineering inCivil and Environmental Engineering
ABSTRACT
The Nahr Ibrahim is one of Lebanon's most pristine rivers. The LebaneseMinistry of Environment wishes to maintain the natural grandeur of the region, evenduring the massive renewal that is occurring as a result of the end of their civil war. Inorder to understand the interconnectivity between the river and the groundwater agroundwater-surface water interaction study was completed. This study utilized agroundwater flow model and a mass balance analysis to determine where the river islosing and gaining. The analysis found that the river is both losing and gaining. Furtherstudy is recommended to determine which portions lose and gain.
Thesis Supervisor: Charles F. HarveyTitle: Assistant Professor of Civil and Environmental Engineering

+

Acknowledgements
This thesis is dedicated to the following great persons:
Manal Moussallem and the Lebanese Ministry of EnvironmentManal, you are great. Thanks for setting up this project and always making sure we had
fun stuff to do in Lebanon! You are a great social coordinator!
Dr. Eric AdamsThank you for taking such a strong interest in the M.Eng program.
It was fun having you in Lebanon!
Dr. Peter ShanahanYou are Superman!
Christian Saad, MIT Graduate StudentThank you for driving us around Lebanon while we drove you crazy!!
Professor Mutasem El-Fadel, Professor Basha, and everyone at the AmericanUniversity of Beirut:
Thanks so much for all your advice and guidance.Thank you for letting us use your labs.
Ara KadamianYou are an incredible person.
I wish you the best of luck with all your future endeavors.Have fun living as Robinson Crusoe!
MIT Lebanese ClubThank you for coordinating such a great project!
Lebanese MIT ClubIt was nice having dinner with you. Thanks for all your support.
5

6
Table of Contents
I Introduction 101.1 Significance of Nahr Ibrahim Basin 101.2 The Need for an Environmental Study 101.3 Objective of the Study 111.4 Challenges in Performing an Environmental Study in Lebanon 11
2 Historical Background 132.1 History of Lebanon 13
2.1.1 Causes of War 152.1.2 The 1975-1990 Civil War 16
2.2 Legend of Adonis and Astarte 163 Nahr Ibrahim Basin 19
3.1 Data Sources 193.1.1 Data From Literature 193.1.2 Geographic Information System Data 193.1.3 Field Measurements 20
3.2 Data Compilation 203.2.1 River Statistics 203.2.2 Watershed Description 213.2.3 Springs 223.2.4 Flow Data 243.2.5 Aquifer Description 273.2.6 Climate within the Basin 303.2.7 Industry in the Basin 313.2.8 Population 31
4 Groundwater-Surface Water Interaction 334.1 Objective 334.2 Groundwater Flow Model 33
4.2.1 Inputs 334.2.2 Output 41
4.3 Mass Balance 445 Conclusion 49
5.1 Results 495.2 Limitations 505.3 Further Studies 51
References 52Appendix A: Nahr Ibrahim Cross-Sections 53
7
List of Figures
Figure 1 - Nahr Ibrahim Basin 10
Figure 2 - Political Map of the Middle East 14Figure 3 - Map of Lebanon_ 20Figure 4 - Tributaries 21Figure 5 - Watershed 22
Figure 6 - Springs 24Figure 7 - Flow at Hydroelectric Plants 25Figure 8 - Sample Locations 27Figure 9 - General Geology: Plan View 28Figure 10 - General Geology: Cross Section 28
Figure 11 - Water Bearing Aquifers 30Figure 12 - 1994 Population Data 32Figure 13 - Watertable-Surface Elevation Relationship 34Figure 14 - Groundwater Model: Boundary Conditions, Layer 1 35
Figure 15 - Groundwater Model: Boundary Conditions, Layer 2 36
Figure 16 - Groundwater Flow Model Layers 37
Figure 17 - Hydraulic Conductivities from "Groundwater" by Freeze and Cherry 38Figure 18 - Groundwater Model: Hydraulic Conductivity 39Figure 19 - Groundwater Model: Elevation 40
Figure 20 - Groundwater Model: Head Contours, Layer 1 41
Figure 21 - Groundwater Model: Head Contours, Layer 2 42Figure 22 - Gaining and Losing Head Contours 43
Figure 23 - Groundwater Model: Losing and Gaining 43Figure 24 - Mass Balance: Losing and Gaining Points 46
Figure 25 - Sensitivity Analysis 48Figure 26 - Gaining and Losing River 49
8

List of Tables
Table 1 - Flow Recording at Gauging Station 25Table 2 - Flow Measured During Site Visit 26Table 3 - Nahr Ibrahim Characteristics 35Table 4 - Precipitation Allocation 39Table 5 - Gauging Station Groundwater Flow Mass Balance 45Table 6 - Site Visit Groundwater Flow Mass Balance 45Table 7 - Sensitivity Analysis: Losing or Gaining 48
9

1 Introduction
1.1 Significance of Nahr Ibrahim Basin
The Ibrahim River, known in Arabic as the Nahr Ibrahim, is one of the main
rivers running through Lebanon. Located in the Mount Lebanon Province, the Nahr
Ibrahim is well known for its natural grandeur and
provides an important water resource to the country. It is
a popular site for camping and picnicking, as well as
extreme adventure sports such as caving, among the
locals. With many scenic views, the Lebanese Ministry
of Environment has classified the valley as a Natural
Site. This region has great potential of being tapped for
the development of ecotourism (travel to a location to
enjoy its natural splendor).
Local residents primarily use the water from the
Nahr Ibrahim for irrigation, washing, and drinking. Since
a hydroelectric plant was built in the valley 50 years ago, Figure 1 - The Nahr Ibrahim
the river has been used to generate hydroelectric power
for the residents and factories in the area. In addition, there once were a small number of
industrial facilities and quarries in the lower course of the river that utilized the water
from the Nahr Ibrahim for its daily operations.
1.2 The Need for an Environmental Study
The Lebanese economy has been growing since the end of the recent civil war.
As a result, industry in the Nahr Ibrahim Basin increased. At the onset of this urban
renewal, environmental issues were not considered and polluting industries were allowed
to operate. The Lebanese Ministry of Environment is now attempting to correct for these
environmentally careless actions. Thus, in the past few years, the government has shut
down most industry in the region. However, with the increased population and the
absence of any wastewater treatment system, the integrity of the river is in danger of
being polluted. In order to maintain the Nahr Ibrahim as a useful resource for both
10

individual use (as a source of drinking water, recreation, and aesthetics) and for industrial
uses, present and future environmental assessments must be performed.
1.3 Objective of the Study
Groundwater currently accounts for 30 to 40 percent of the water used for
domestic, industrial, and agricultural use in Lebanon (Macksoud, 1998). In order to
develop an understanding of the interconnectivity of the Nahr Ibrahim Basin, and the
effects of current and future development, the groundwater-surface water interaction was
examined. If the river was found to be a losing river (river water flows through the
riverbed and into aquifers), contaminants discharged into the river could enter the
groundwater, polluting the groundwater aquifers in the watershed. If the Nahr Ibrahim
was found to be a gaining river (meaning water flows from the ground into the river), any
contaminants that infiltrate through the ground and into the watertable could seep into the
river. Such problems could affect the water quality and the aesthetic appeal of the river,
jeopardizing the ecotourism business.
1.4 Challenges in Performing an Environmental Study inLebanon
The major difficulty in performing an environmental study in Lebanon was the
availability of reliable data. During the fifteen years of civil war in Lebanon (1975-1990),
much of the historical data and statistics of the river were lost. The government in
Lebanon does not know the fate of the precipitation and flow gauging stations built
before the war and there are few records left from the pre-war period. In addition, little
information regarding the river region can be found outside the country.
Another challenge for performing this study is the general lack of environmental
awareness in the country. After the civil war, the country prioritized economic
development and little attention was given to environmental sustainability until recently.
For example, there are no sewage treatment plants in Lebanon to handle municipal waste.
The waste has been traditionally discharged directly into the Mediterranean Sea and other
surface waters.
11

The author also faced challenges, as she did not speak the predominant local
languages. Although the large majority of persons in urban areas, such as Beirut, speak
English, Arabic and French are the two most widely spoken languages of Lebanon. Most
people in rural villages, such as those found in the Nahr Ibrahim Basin, speak only
Arabic. Because many different dialects of Arabic exist and translation into English and
French is not always consistent, the authors found that the name of a single village could
have multiple different spellings. As a result, this report may make reference to Lebanese
regions using a variety of translations.
12

2 Historical BackgroundIn order to understand the environmental attitude in Lebanon, it is important to be
aware of the country's recent history. The civil war had far reaching environmental
consequences. During the civil war, the country could not prioritize environmental
issues. In the years since the war, the country has focused on renewal, again ignoring
environmental consequences.
It is duly important to appreciate the outlook of the Lebanese people. Lebanon has
a long and rich past, touched by many different civilizations, making it unique from other
countries in the Middle East. Furthermore, in order to recognize the value of that the
Lebanese place on the Nahr Ibrahim Basin, it is important to understand the history and
culture associated with this specific region, such as the Legend of Adonis and Astarte.
2.1 History of Lebanon'
The region that is now defined as Lebanon (see Figure 2) has been occupied by
over 17 different cultures. The first traces of costal settlement in Lebanon date back to
9000 BC. The first recorded history is from 3000 BC, when the Canaanite, a Semitic
people (called Phoenicians by the Greek) inhabited mainly costal cities, living and
trading on the sea. Assyrians conquered the Phoenicians (875-608 BC) taking away their
freedom, spurring many fruitless revolts. In 612 BC, Lebanon broke away from
Assyrian control, now ruled by Babylonian and the Persian Empire
(which was controlled for some time by Alexander the Great). In 64 BC, the region
became part of the Roman Empire, and Beirut grew to become a major city
(http://www.geocities.com/CapitolHill/Parliament/2587/hist.html, visited 5/4/2001).
This section was authored in coordination with Jessica Fox.
13

Figure 2 - Political Map of the Middle East
(El-Fadel, 2000)
In 35 AD disciples came to Lebanon to preach the word of Christ and conversion
to Christianity began. The Arabs first entered the region in 634, as followers of the
Prophet Muhammed, the founder of Islam, embarked on a movement to establish their
religious control. The Arab Conquest (634-36), a holy war against non-Muslims, was
followed by attack by the Umayyads (660-750), and by the Abbasids (750-1258). The
Crusades, a Christian holy war, lasted from 1095 to 1291. The Mamluks then ruled the
region from 1282 to 1516. Their rule was followed by the Ottoman Empire, which lasted
until 1916. Shortly thereafter (September 1, 1920), Lebanon's present boundaries were
defined as General Gouraud proclaimed the establishment of Greater Lebanon with
Beirut as its capital. (http://www.geocities.com/CapitolHill/Parliament/2587/hist.html,
visited 5/4/2001).
Since its creation in 1920, Lebanon has been repeatedly afflicted with political
instability, war, and economic devastation. The most recent war, between 1975 and
1990, ravaged the social, economic, and political fabric of this once prosperous nation.
In the 10 years since the end of the war, Lebanon has begun to rebuild and restore order.
14
CYP SyriaBeirut
Mediterranean Sea .Damascus Ia
Tel Aviv *. *Amfman
Cairo Jordan
EgyptSaudi Arabia
200 0 "a0 4W0 ilMlek

However, as the industries return, little is known about what effect the rapid growth of
the country will have on the environment. This project will attempt to characterize the
risks of this environmental danger through the study of the Ibrahim River (Nauphal,
1997).
2.1.1 Causes of WarDuring the Ottoman Empire (13th - 2th centuries), portions of what is now
Lebanon (Sildon, Tripoli, and Beirut) were under direct Ottoman rule. These areas were
inhabited by the dominant orthodox religions of the Byzantine and Islamic empires. The
rest of Lebanon, however, maintained only indirect Ottoman rule and became a haven for
the persecuted Christian and Muslim heterodox religions, including the Maronites,
Druzes, and Shi'a (Nauphal, 1997).
When the Ottoman Empire was dismantled during World War I, the League of
Nations gave France control of Syria and Lebanon. The Republic of Lebanon was
formally created in 1926, bringing together the small sects and the large orthodox
religions. Because the two groups had enjoyed separate histories and socio-economic
systems, this combination became the root cause of the subsequent civil wars (Nauphal,
1997).
There soon was a power struggle between the Lebanese nationalists (Christians),
the French supported groups (Maronites), and the Arab nationalists (Muslims). The
French helped the Maronites implement their national political program. The Lebanese
nationalists claimed an independent Lebanon. The Arab nationalists wanted Lebanon to
become part of a larger Arab-Islamic empire. This divide jeopardized the legitimacy of
the republic (Nauphal, 1997).
There are many probable causes of the 1975-1990 civil war in Lebanon. The
inequities in cultural group representation in the government, army, and eventually in
monetary wealth contributed to a general struggle within the country. Another
contributor is that Lebanon was used as a "surrogate battleground" for the foreign
conflicts between the Palestinians, Israelis, and Syrians. Palestinians displaced by the
creation of Israel became increasingly militarized and launched guerrilla operations from
Lebanon (Nauphal, 1997).
15
The intentions of the neighboring nations for the state of Lebanon also led to war.
Syria has never accepted the sovereignty given to Lebanon by France, believing it to be a
province of its country. Additionally, Israel desired to end the Palestinian terrorist groups
within Lebanon as well as expand its territory (Nauphal, 1997).
Internal and external tensions within the country reached a breaking point in
1975, inciting the civil war (Nauphal, 1997).
2.1.2 The 1975-1990 Civil WarThe war began in 1975 when the main Christian party accused the Palestinians of
violating the sovereignty of the State. The violence soon spread to the entire country,
generally between the militias of the pro-Palestinian groups and the Israeli supported
Christian group. In 1976, the Palestine Liberation Organization (PLO) joined the war on
the Palestinian side while Syria joined to oppose the Palestinians. Two years later,
following a bomb attack near Tel Aviv, Israel invaded Lebanon to eliminate the
Palestinian bases in the southern region of the country. The United Nations stepped in to
replace the Israeli army (Nauphal, 1997).
In July 1981, the United States stepped in to mediate a cease-fire agreement
between Israel and the PLO. However, in 1982 Israel invaded again, surrounding the
capital of Beirut and pushing the PLO into Syria (Nauphal, 1997).
The war continued until 1990, when Syria and Lebanon signed a Treaty of
Brotherhood, Cooperation, and Coordination and a Pact of Defense and Security, which
outlined peace between the two nations. However, despite these peace accords, Israel
occupied southern Lebanon until the year 2000 and approximately 40,000 Syrian soldiers
remain in the country (Nauphal, 1997).
In the years since the war, Lebanon has worked to rebuild its infrastructure and
economy. Although relations with Syria and Israel are still tense, there has been relative
peace since 1990 (Nauphal, 1997).
2.2 Legend of Adonis and Astarte
In addition to the current merits of the river, such as its natural beauty, the Nahr
Ibrahim has another a very special importance. Afqa is the setting for the famed legend of
Adonis and Astarte.
16

The prince Adonis was to be the most gorgeous baby ever born. As he approached
manhood, Adonis became known as the most handsome and most skilled hunter in the
land of Canaan (Lebanese Ministry of Tourism, 2001).
The beautiful Astarte heard of the attractive prince. She pined to make his
acquaintance, although she had many admirers. The young prince, however, was content
to hunt and dance with the nymphs and play the lyre (Lebanese Ministry of Tourism,
2001).
One day Astarte secretly followed Adonis. When she finally emerged from the
forest and came into his view, he immediately fell deeply in love. The two lovebirds
talked for hours about the beauty of Afqa, and swore they would never leave each other.
Days passed as they strolled together along the Nahr Ibrahim, followed by nymphs, birds
and butterflies (Lebanese Ministry of Tourism, 2001).
Now in love with Astarte, Adonis no longer felt a desire for hunting, much to her
delight. Astarte feared he would be lost or hurt, and made him promise not to go hunting
(Lebanese Ministry of Tourism, 2001).
Adonis promised, but soon his old passion returned. One day he decided to kill a
wild boar. They were the most difficult animals to kill because they are fast and have big,
sharp tusks. Adonis was not afraid, but enjoyed the challenge. He saw a boar and
skillfully stabbed it in the head. The animal did not die, but became furious. The angry
boar charged Adonis more than five times. Adonis and the beast battled extensively.
Adonis thought he had the upper hand and just as the boar started to collapse, the swine
quickly turned about face and thrust his sharp tusk into Adonis' thigh. The monstrous
boar charged Adonis again and jabbed the young hunter's stomach, and then his chest
(Lebanese Ministry of Tourism, 2001).
By the time Adonis' friends, the nymphs of the forest, came to rescue him, he was
lying in a pool of blood. This blood later turned into beautiful red anemones. The nymphs
gently lifted Adonis, and carefully carried him to Afqa Cave. Once safe inside the cave,
they tried to revive him, but alas they were too late. Astarte arrived soon thereafter. When
she found her beloved dead, she wept for hours. Roses grew on the land where her tears
fell (Lebanese Ministry of Tourism, 2001).
17

Alone on Earth, Astarte led the body of Adonis to the underworld. She was now
filled with great emptiness. To improve her spirits, the great God El declared that each
spring Adonis would return to visit Astarte in Afqa for a few weeks. During this time the
anemones would blossom and the Nahr Ibrahim again would turn red (Lebanese Ministry
of Tourism, 2001).
For many years after, the people of Canaan memorialize the death and
resurrection of Adonis with three-day-long festivities. As they watched the river turn red,
they believed it was the blood of Adonis being spilled again. The red color is actually
caused by a mineral carried in the water as the snow melts (Lebanese Ministry of
Tourism, 2001).
18
3 Nahr Ibrahim BasinThe major difficulty in performing this study was the difficulty in obtaining
reliable data. This chapter describes data sources, followed by a compilation of the data
currently available, relevant to this study.
3.1 Data Sources
The data used in this study came from three major sources: existing literature and
reports, geographic information system databases, and field measurements. Most of this
data was compiled when the author visited Lebanon in January 2001.
3.1.1 Data From LiteratureDuring the 15 year civil war, most scientific data in Lebanon was been lost or
destroyed. Minimal amounts research or data gathering was conducted during this time.
During the author's trip to the country, several reports were brought together. The most
beneficial reports included "A Hydrogeological Study of the Nahr Ibrahim Basin in the
Vicinity of the Paper Mill Project of Indevco in Lebanon" (Papazian, 1981), "Relance des
Projects Hydro-Agricoles: Barrage de Iaal dans le Liban Nord, Barrage de Yahchouch sur
le Nahr Ibrahim" (Electrowatt, 1981), and "Etude des Apports de Nahr Ibrahim" (Bureau
d'Etudes Hydrauliques, 1994).
Though far from being informatively exhaustive, these reports give rather detailed
data about the Nahr Ibrahim watershed. However, these reports often gave conflicting
information. For example the location of the Djinni gauging station varies from report to
report.
3.1.2 Geographic Information System DataThe Lebanese Ministry of Environment made a substantial amount of Geogrpahic
Information System (GIS) data available. GIS databases available included satellite maps,
population data, river location, watershed delineations, and more. It is unknown to the
Ministry of Environment officials how current most of this data is. Furthermore, it was
unclear who has gathered this information.
19

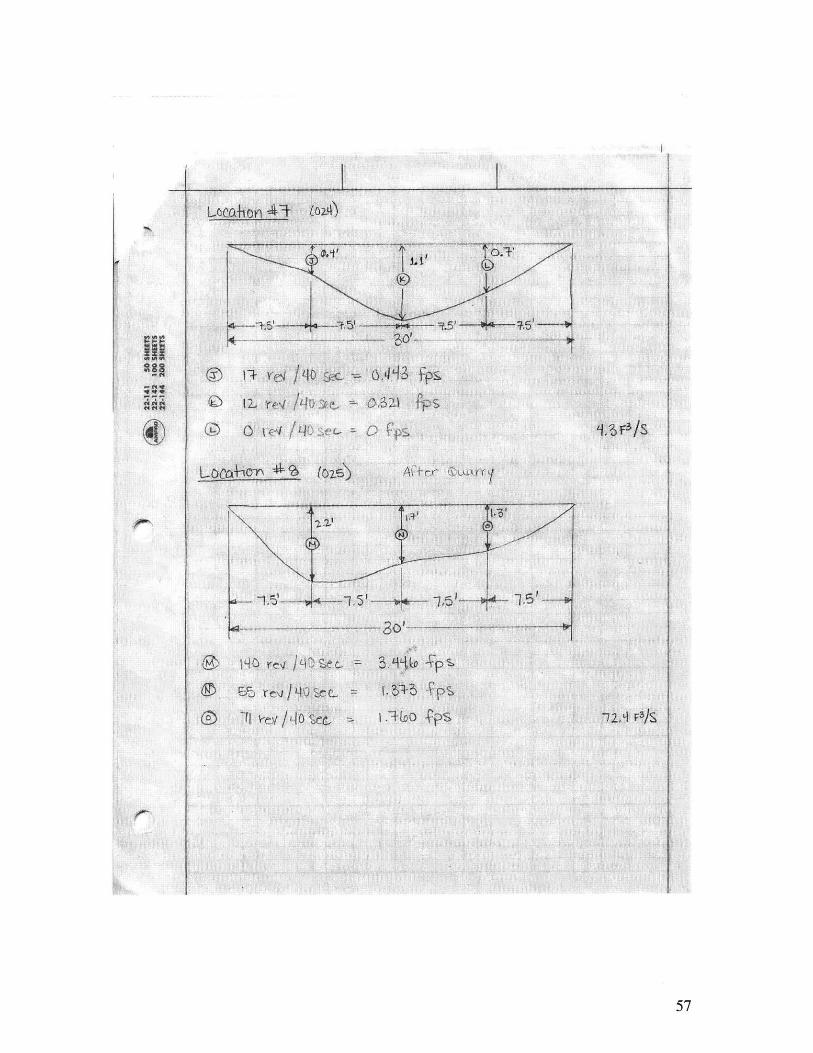
3.1.3 Field MeasurementsThe author traveled to the project site in January 2001 and performed field
measurements for the Nahr Ibrahim. At nine of locations, cross-sectional and flow
measurements were conducted to assess the hydrogeometric characteristics of the
channel. A Rickly Hydrolocigal Company pygmy flow meter was used to measure the
flow in the river. These measurements the cross-section approximations can be found in
the Appendix.
3.2 Data Compilation
The following section summarizes information pertaining to the Nahr Ibrahim
Basin, as collected from the sources described above.
3.2.1 River StatisticsThe Nahr Ibrahim, highlighted in Figure 3, is one of fifteen major rivers of
Lebanon. The river, which is 28 km long, is located 20 km north of Beirut. Beginning at
the crest of Mount Lebanon, the river flows westward, emptying into the Mediterranean
Sea (Papazian, 1981).
BEYRYRIE
A-ft
~ SYRIEt
Figure 3 Map of Lebanon
(http://www.ibiscus.fr/dsipays/lb-admi.html, visited 11/16/2000)
20
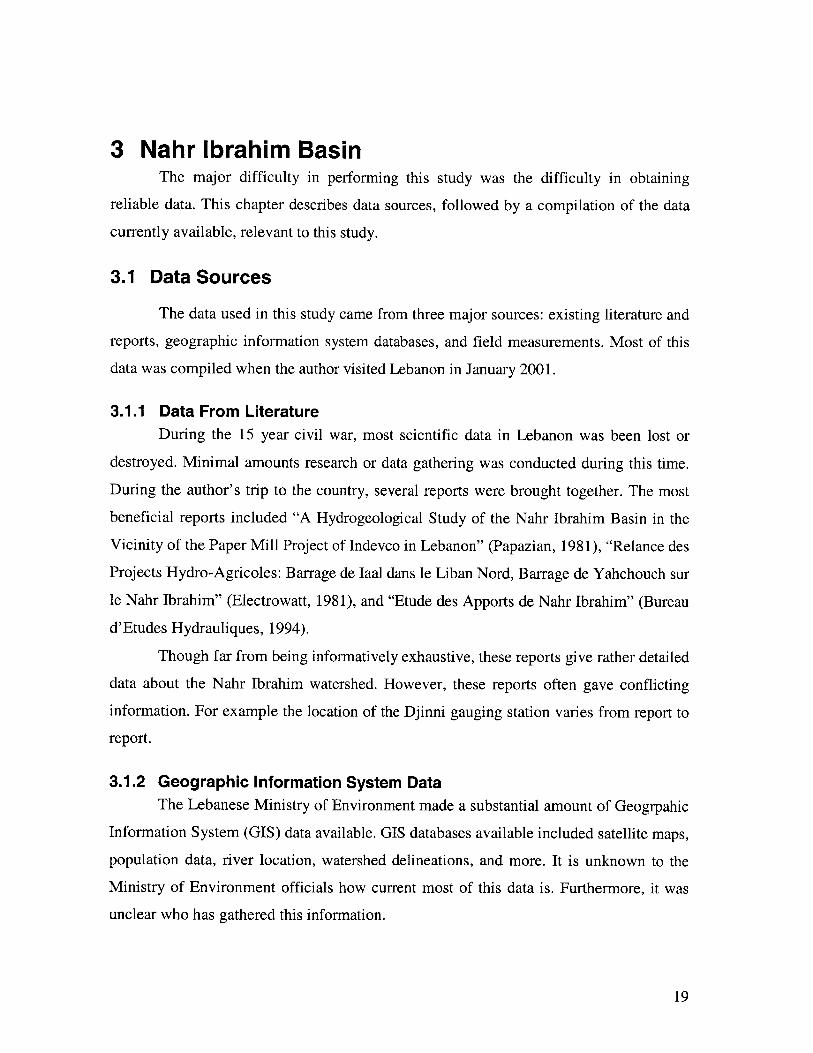
Nahr Rouiess is the major tributary feeding Nahr Ibrahim, joining the main river
in Kartaba. The Nahr Dibb and the Ouadi Ghabour are other major tributaries. Several
other small perennial tributaries also feed the main river, as seen in Figure 4 (Papazian,
1981).
Figure 4 - Tributaries
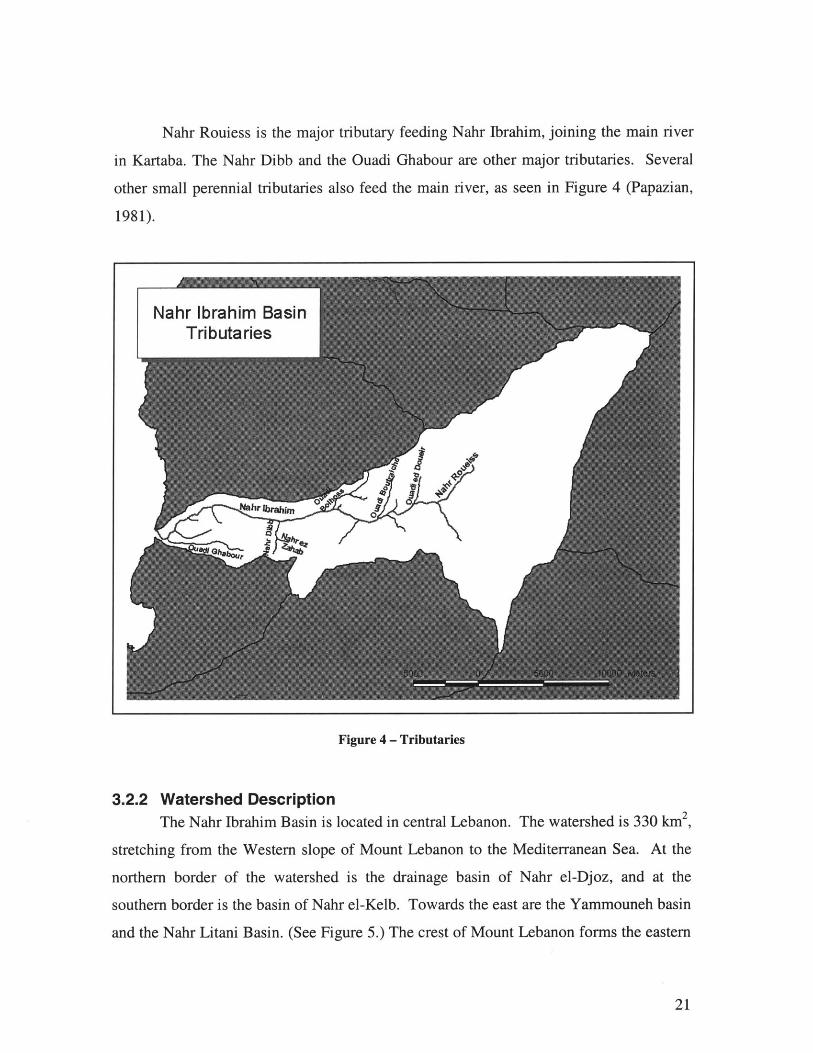
3.2.2 Watershed DescriptionThe Nahr Ibrahim Basin is located in central Lebanon. The watershed is 330 km2
stretching from the Western slope of Mount Lebanon to the Mediterranean Sea. At the
northern border of the watershed is the drainage basin of Nahr el-Djoz, and at the
southern border is the basin of Nahr el-Kelb. Towards the east are the Yammouneh basin
and the Nahr Litani Basin. (See Figure 5.) The crest of Mount Lebanon forms the eastern
21
Nahr Ibrahim BasinTributaries

border, which is 27 km long. The elevation of this rim decreases from the North to South,
from 2625 m to 1875 m (Papazian, 1981).
The majority of the drainage basin is comprised of steep-sided mountain ridges. A
large portion of the drainage basin lies on a high plateau, extending between the two
sources and the eastern rim of the basin. This high plateau, which forms Jebel Mneitri, is
rectangular, having a surface area of 200 km2 (Papazian, 1981). The elevation of the
plateau varies between 1200 and 2500 km and is covered by snow from December first
until the beginning of April (Bureau d'Etudes Hydrauliques, 1994).
Nahr Ibrahim BasinWatershed Abou All
Jaouz
Aassi-YammounehMediterranean Ibrahim
Sea
LitaniKalb
Beyrouth
10 0 10 20 30 40 Kilomet rs
Figure 5 - Watershed
3.2.3 SpringsThe major sources of the Nahr Ibrahim are the Afqa spring and the Nahr Roueiss,
a tributary. Afqa spring is located inside a cave, at an elevation of 1250 m. The Nahr
22
Roueiss, which is fed by the Roueiss Spring (elevation of 1170 m) and other tributaries,
meets Nahr Ibrahim below Kartaba (Papazian, 1981).
Afqa and Roueiss are both perennial springs, experiencing high flow in the winter
and spring season, and extremely low flow at the end of the summer and early fall
seasons. Afqa's summer flow is 0.75 m3/s and Roueiss has a summer flow of 0.4 m3/s. In
addition to the two source springs, the Nahr Ibrahim is fed by a group of approximately
30 springs of variable flow, scattered over the surface of the basin (Papazian, 1981).
Other major springs include:
Nabaa el Moudik
Nabaa Ser'aita
Nabaa Boutraiche
Nabaa el-Koudeira
Minor springs include:
Ain el-Mneitra
Ain el-Akoura
Ain el-Mejdel
Ain el-Bardi
Ain el-Ghabate
Ain Khalaff
0.6 m 3/s in the dry season
0.925 m3/s during the rainy season (Bureau d'Etude
Hydrauliques, 1994)
0.06 m3/s
0.025 m3/s
0.012 m3/s
0.006 m3/s
0.004 m3/s
0.002 m 3/s
0.00125 m3/s
0.001 m3I/s
0.0005 m3 /s (Papazian, 1981)
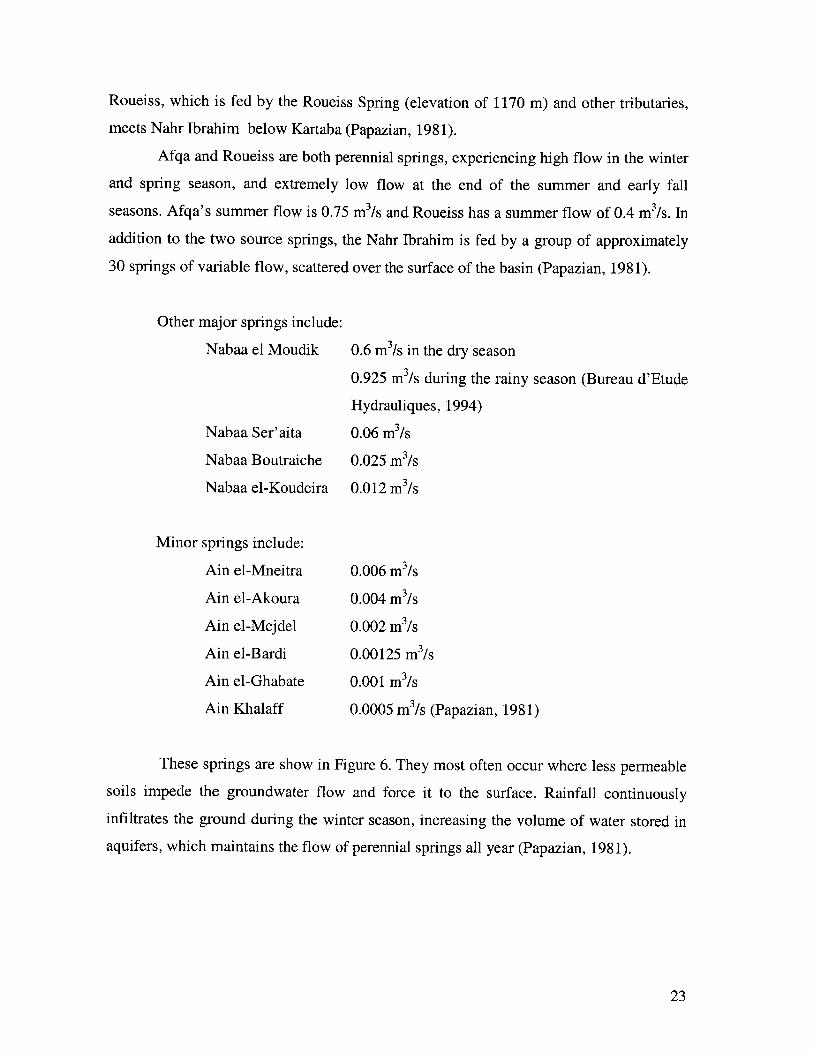
These springs are show in Figure 6. They most often occur where less permeable
soils impede the groundwater flow and force it to the surface. Rainfall continuously
infiltrates the ground during the winter season, increasing the volume of water stored in
aquifers, which maintains the flow of perennial springs all year (Papazian, 1981).
23

Figure 6 - Springs
3.2.4 Flow DataThe Ministry of Public Works installed three gauging stations along the Nahr
Ibrahim in July of 1939. One was installed near the Khoudeira bridge (at an elevation of
135 m), the second between the present hyrdoelectric power plants at Yahchouche
(elevation of 150 m), and the third at Khoudeira or Bezhel (elevation 86 m). During the
fall of 1951, the Ministry of Public Works put in a fourth gauging station, located just
downstream the village of Mougheire at Majdel (elevation of 1200 m), and a fifth station
located between the confluence of Nahr Roueiss and Nahr Afqa in Djinni (elevation of
775 m) (Papazian, 1981). Another station was built at the mouth of the river. These
gauging stations were not monitored during the civil war, and are no longer in operation.
Flow data at Majdel (Bureau d'Etudes Hydrauliques, 1994), Djinni, Khoudeira, and the
24
Nahr Ibrahim BasinSprings
* Ain Al Akouia
Al Rouis
Seraaita
in Ajir Ain bou Assairasse A
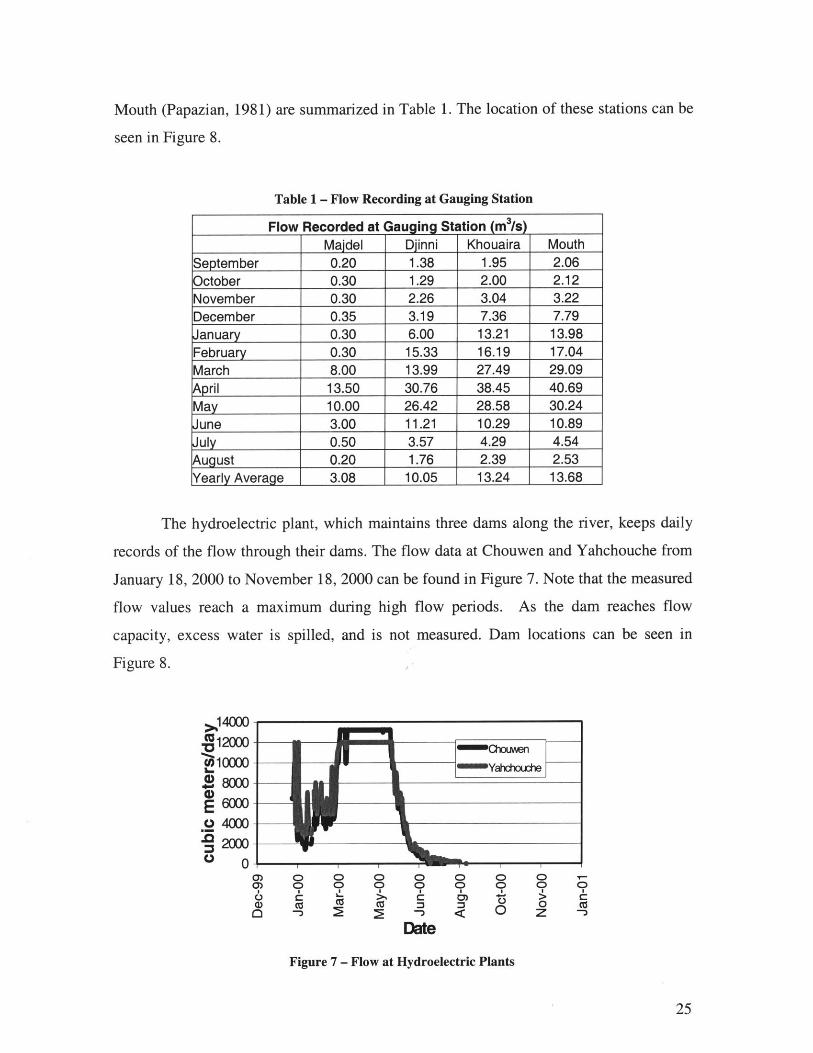
Mouth (Papazian, 1981) are summarized in Table 1. The location of these stations can be
seen in Figure 8.
Table 1 - Flow Recording at Gauging Station
Flow Recorded at auging Station (ms)
Majdel Djinni Khouaira MouthSeptember 0.20 1.38 1.95 2.06October 0.30 1.29 2.00 2.12November 0.30 2.26 3.04 3.22December 0.35 3.19 7.36 7.79January 0.30 6.00 13.21 13.98February 0.30 15.33 16.19 17.04March 8.00 13.99 27.49 29.09April 13.50 30.76 38.45 40.69May 10.00 26.42 28.58 30.24June 3.00 11.21 10.29 10.89July 0.50 3.57 4.29 4.54August 0.20 1.76 2.39 2.53Yearly Average 3.08 10.05 13.24 13.68
The hydroelectric plant, which maintains three dams along the river, keeps daily
records of the flow through their dams. The flow data at Chouwen and Yahchouche from
January 18, 2000 to November 18, 2000 can be found in Figure 7. Note that the measured
flow values reach a maximum during high flow periods. As the dam reaches flow
capacity, excess water is spilled, and is not measured. Dam locations can be seen in
Figure 8.
O14000
.012000(Rc10000. 8000
4).2 4000* 2000o 0
0)0)C.,
0
00ILso
00IL-
0-
.... yu -
i i ah, ouch,
000C
Date
00
00
0
00 CO
Figure 7 - Flow at Hydroelectric Plants
25

The authors collected flow data during a site visit in January 2001. Table 2 lists
the measured flow at the sample locations, shown in Figure 8. A Rickly Hydrological
Company Pygmy Flow Meter was used to measure the current at nine locations across the
river. The current, used in coordination with approximations of the cross section, is used
to estimate flow in the river. Although these measurements were collected at many
locations along the river, it must be noted that flows were measured on a single day at
various points throughout the day. Also, no flow was measured in the middle portion of
the river, as access is not possible by road.
Table 2 - Flow Measured During Site Visit
LOCATION River Flow
m/s
Site 1 0.08
Site 2 0.82
Site 4 0.61
Site 6 0.22
Site 7 0.12
Site 8 2.05
Site 9 4.05
Site 10 1.98
Site 11 3.54
26

Figure 8 - Sample Locations
3.2.5 Aquifer DescriptionGeological formations outcropping in the Nahr Ibrahim range from the Jurassic to
Cretaceous. The majority of the basin is permeable, but near impermeable terrain exists
(Electrowatt, 1981). (See Figure 9 and Figure 10.)
27
Nahr Ibrahim BasinSample Locations

.1
B I aat bas ~s*J i.vf (A)perLower
CAACEOWUS Uinire dhri.s, wart; udsate -- CApthCLCLC . 7hso L b'.S /,AeaeWtaa , ufaddiat, gaw-/,IssfaAfles Ck
- Idirly imashrne .kd /L11St i dfterneig hed - ca ~Imerv~Iws L LMstaas evitA steraigbtsfar.3JAba
0.saire 1i4gtsiate -W/h deifrndtmn W&u' taaify Reastenws - e4 {CMnesA30,14
wl9 tI light fraymArl - C 4 d { pPoo k0s0a1ianImpervious
A laie m
- --- 4 Stri"e. dlp + Harizvnlti dO
ai
PAPER N
Figure 9 - General Geology: Plan View
(Papazian, 1981)
Figure 10 - General Geology: Cross Section
(Papazian, 1981)
28
NAHR BRAHIM BASIN
GEERAL GEOLOGY
OW ns I I A I %
SECTION ALONG THE CONDENSED PROFILE OF NAHR IBRAHIM
- -sebouAung tm condosed profk of MARN JINAH4iJ --- --.. Jin arasshiu an Pirrte .
- use is 4A t J.,dshawr la a, whi - ,dI
IIIII oell fA) Aasarfa-tanbl - Flt
|
In the basin, as in the rest of Lebanon, the major subterranean water reservoirs are
located in the compact limestones having a karstic surface. The karst terrain involves a
group of pure limestones, the surface of which have been eroded by rainfall into a highly
characteristic type of landscape known as Lapiez. The Lapiez is formed by the attack of
carbonic acid dissolved in rainwater. When the rain trickles over the rock faces and into
cracks and bedding planes it carves channels, caverns and caves. The water in these
channels joins together forming torrents and rivers until it reaches the deep surface of
unaltered compact limestones. The continuous infiltration of rainfall during the winter
season increases the volume of stored water, and maintains the flow of perennial springs
all along the year. The majority of the rainfall in the Nahr Ibrahim Basin penetrates into
the rock, leaving little to land surface flow. All of the water that seeps into the limestone
ultimately reappears as springs flowing from the rock, creating large caves, such as Afqa
and Jeita (Papazian, 1981).
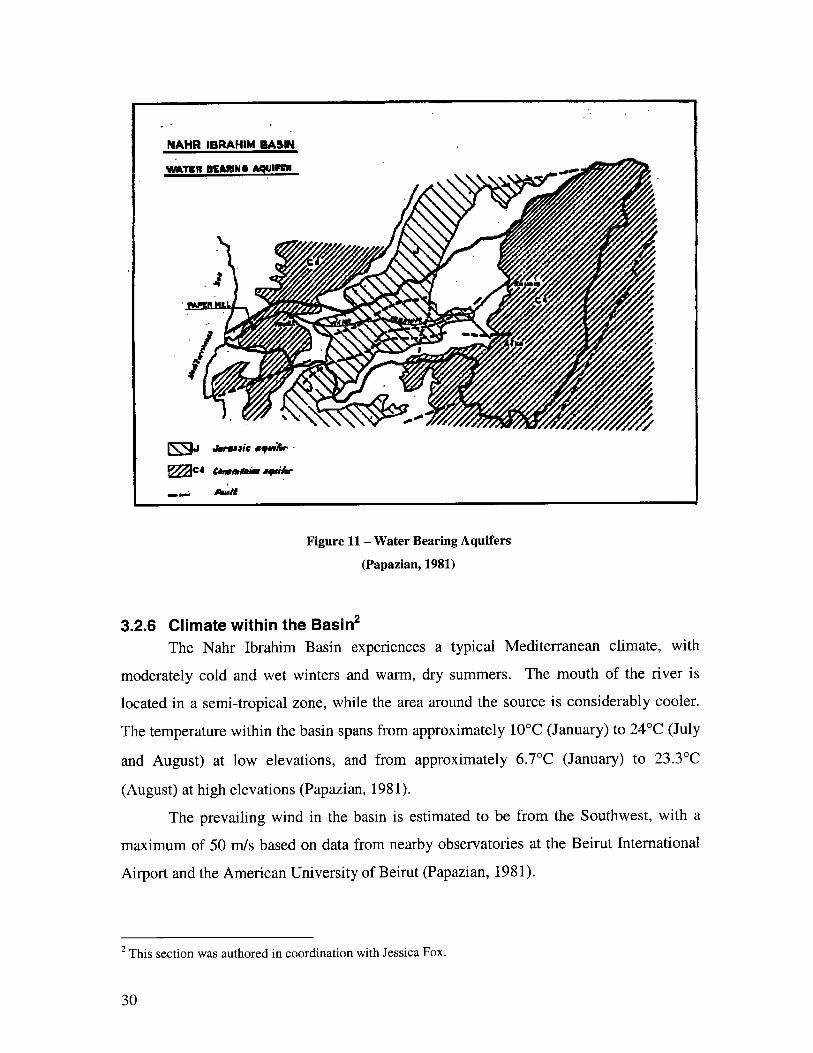
There are three major water-bearing aquifers in the Nahr Ibrahim watershed. One
Cenomanian aquifers is located at the easternmost portion of the basin. A second is
located in the west of the basin. These two aquifers are massive limestone formations
with alternating thin beds of marly limestone. Between them lies the Jurassic aquifer,
which is comprised of massive limestone and dolomite. Impermeable layers of
cretaceous, sandstone, marl, and limestone debris separate these aquifers. Along the
border of the basin shared with the Mediterranean Sea is another impervious layer
consisting of white to light gray marl. (See Figure 11.)
29
NAHR IBRAHIM BASIN
'MTER BEARING AIFEM
Figure 11 - Water Bearing Aquifers
(Papazian, 1981)
3.2.6 Climate within the Basin2
The Nahr Ibrahim Basin experiences a typical Mediterranean climate, with
moderately cold and wet winters and warm, dry summers. The mouth of the river is
located in a semi-tropical zone, while the area around the source is considerably cooler.
The temperature within the basin spans from approximately 10'C (January) to 24'C (July
and August) at low elevations, and from approximately 6.7'C (January) to 23.3'C
(August) at high elevations (Papazian, 1981).
The prevailing wind in the basin is estimated to be from the Southwest, with a
maximum of 50 m/s based on data from nearby observatories at the Beirut International
Airport and the American University of Beirut (Papazian, 1981).
2 This section was authored in coordination with Jessica Fox.
30
The humidity along the coast of Lebanon is relatively high throughout the year,
with a continuous influx of moist air from the Mediterranean. In the winter, the
Mediterranean cyclonic disturbances produce precipitation. In the summer, the hot,
humid air remains along the coast, maintaining high humidity. The precipitation in the
basin ranges from an average of 1000 mm at low elevations to 1400 mm at high
elevations. The average precipitation over the whole surface of the basin is estimated to
be 1300 mm (Papazian, 1981).
3.2.7 Industry in the BasinHistorically, there have been several industries along the river including a
tannery, a paper mill, two quarries, and three hydroelectric plants. However, efforts by
the Ministry of the Environment have closed down all the industries except for the
hydroelectric plants.
3.2.8 PopulationThere are many small villages inside the Nahr Ibrahim basin. The largest villages
are Kartaba (4500 persons in 1980) and Akoura (2000 persons in 1980). In the early
1980s the total population of the basin was roughly 15000 persons. The majority of these
people work in agriculture (Papazian, 1981).
Population data was also available from the Ministry of Environment in a GIS
database. (See Figure 11.) However, due to the racial tension and political implications,
the Lebanese government has failed to conduct any official census for the last few
decades. It is unknown to the Ministry of Environment officials how current are the data
or the manner with which this unofficial census was conducted. Furthermore, it was
unclear who has gathered this information.
31

Nahr Ibrahim Basin1994 Town Population .
S.Se. 6.06 , *
- ... ... .. 501.12400
500 0 00 10 500 200Mtr
Figure -.-. 0 o 0. .
*. 8-*.. * .. -.
0 e .%0020
A 12.0 . 45000-e
06 * 45 . *. ee0 - 000
O. 0 * 86001 - 387000
.6 . . 5000 0 0 5000 1000 15000 20000 Meters
Figure 12 - 1994 Population Data
32

4 Groundwater-Surface Water Interaction
4.1 Objective
To study the groundwater-surface water interaction, two forms of analysis were
used. Firstly, groundwater flow in the watershed was modeled using Groundwater Vistas.
Secondly, a mass balance model was created. The mass balance analysis uses flow
measurements and precipitation data to estimate the amount of groundwater flowing into
or out of the river. The combined results of these two analyses show where the river is
gaining and losing.
4.2 Groundwater Flow Model
The groundwater flow in the Nahr Ibrahim Basin was modeled using
Groundwater Vistas, which is the graphical user interface for the program
MODFLOW. MODFLOW is the USGS modular three-dimensional finite-difference
groundwater flow model created by Michael G. McDonald and Arlen W. Harbaugh.
The most widely used groundwater model in the world, MODFLOW is accepted
by courts, regulatory agencies, universities, consultants, and industry
(http://www.modflow.com/modflow/modflow.html, visited 3/14/2001).
4.2.1 InputsGroundwater Vistas requires the entry of units and grid settings, boundary
conditions, and aquifer properties. The settings utilized in the model of the Nahr Ibrahim
Basin are described below.
4.2.1.1 Units and GridGroundwater Vistas used consistent units in all computations. The Nahr Ibrahim
model uses the following:
Length Unit: MeterTime Unit: DayMass Unit: Kilogram
33

The plan view of this watershed area is divided into a series of columns and rows
using a finite difference grid. Only 50 columns are allowed in the student version, which
was employed for this project. Thus, in this model the squares are either 500 m high and
1000 m wide or 500 m high and 500 m wide. The more narrow columns were used
around the river, where a higher resolution was desired. The finite difference grid used
can be seen in Figure 14 and Figure 15.
The model uses two layers. The lower layer ranges from 500 m below sea level to
1300 m above sea level. The upper layer ranges from 1300 m tol900 m above sea level.
4.2.1.2 Boundary ConditionsA no flow boundary was set around the exterior of the watershed. This boundary
condition was based on the assumption that the groundwater flows in coordination with
the surface elevation, as seen in Figure 13. A watershed boundary is set based on peak
surface elevations, and groundwater table elevations can be assumed to mimic these
peaks. The no flow boundary conditions can be seen in surrounding the watershed in
Figure 14 and Figure 15.
Figure 13 - Watertable-Surface Elevation Relationship
A constant head boundary was used where the Nahr Ibrahim meets the
Mediterranean Sea. The sea was given a constant head value of zero meters. The constant
head boundary can be seen in leftmost side of Figure 15.
The river was modeled using MODFLOW's river package. River characteristics
were entered for the source and mouth of the river. The intermediate points were
interpolated from the end data. A summary of the input data is given in Table 3. Realistic
34
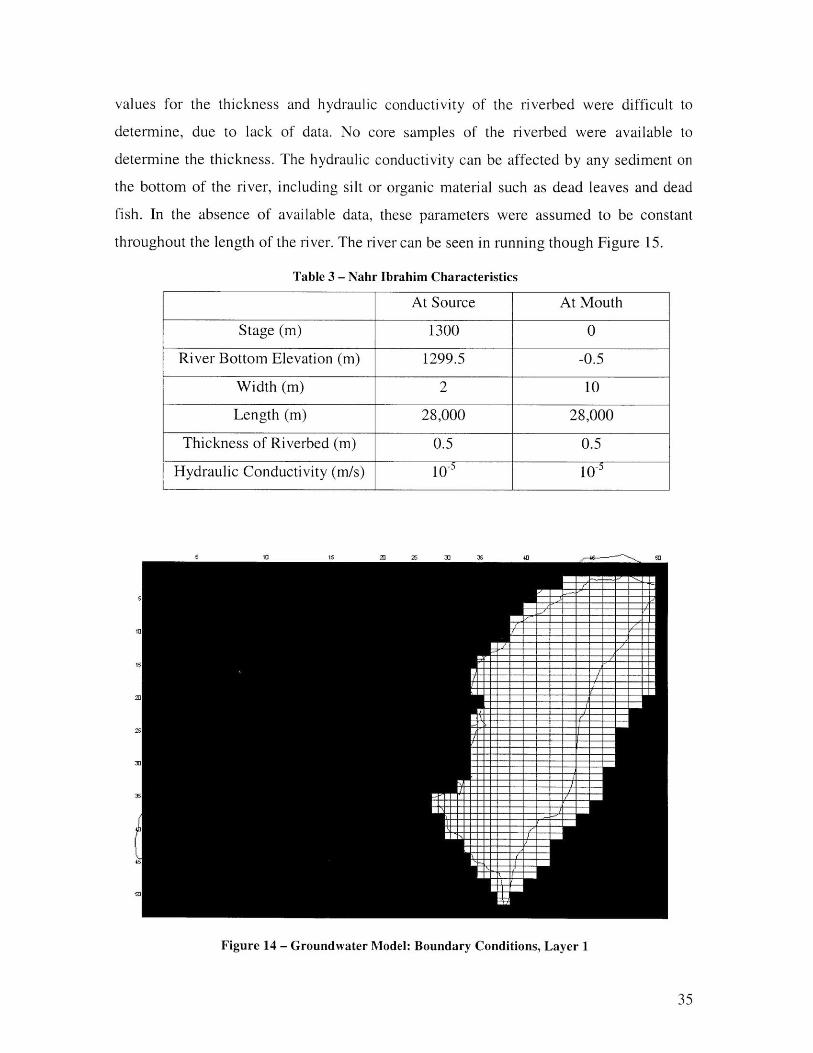
values for the thickness and hydraulic conductivity of the riverbed were difficult to
determine, due to lack of data. No core samples of the riverbed were available to
determine the thickness. The hydraulic conductivity can be affected by any sediment on
the bottom of the river, including silt or organic material such as dead leaves and dead
fish. In the absence of available data, these parameters were assumed to be constant
throughout the length of the river. The river can be seen in running though Figure 15.
Table 3 - Nahr Ibrahim Characteristics
At Source At Mouth
Stage (m) 1300 0
River Bottom Elevation (m) 1299.5 -0.5
Width (m) 2 10
Length (m) 28,000 28,000
Thickness of Riverbed (m) 0.5 0.5
Figure 14 - Groundwater Model: Boundary Conditions, Layer 1
35
Hydraulic Conductivity (m/s) 10-1

f
Figure 15 - Groundwater Model: Boundary Conditions, Layer 2
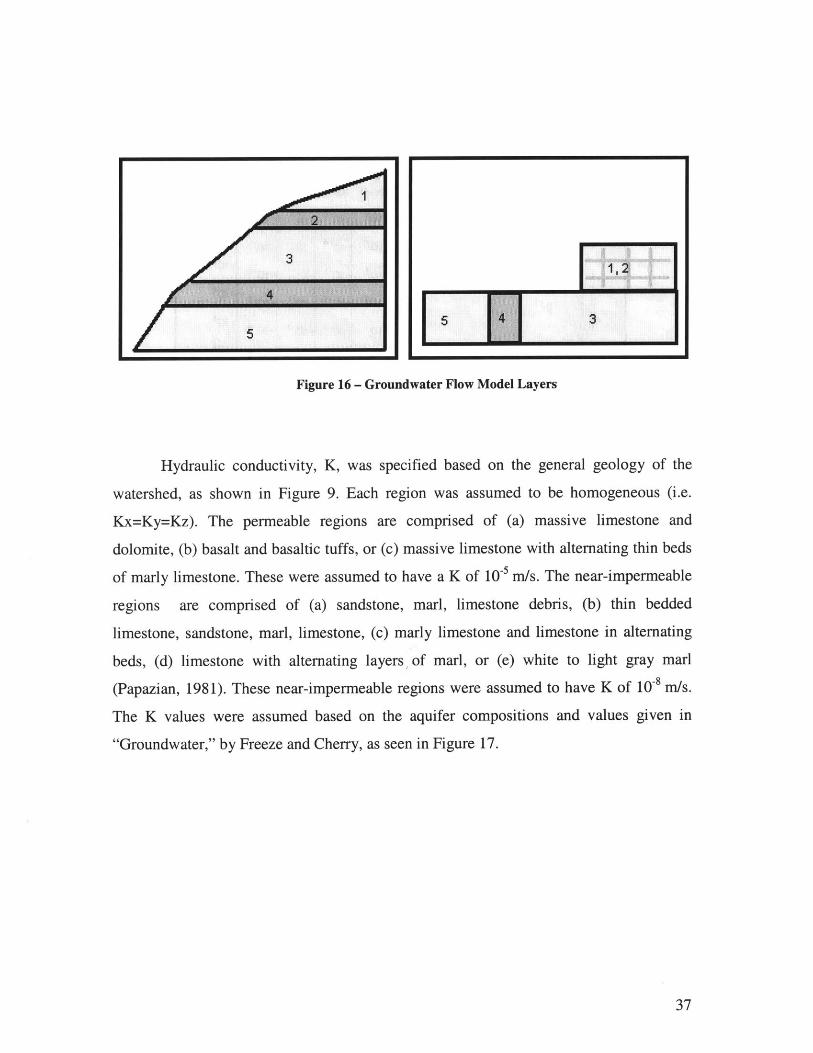
4.2.1.3 Aquifer PropertiesThe Nahr Ibrahim Basin contains a series of alternating permeable and nearly
impermeable stratums. A simplification can be seen on the left in Figure 16, where the
light colored stratum are permeable, and darker are near-impermeable. This system was
modeled in Groundwater Vistas using two layers, as shown on the right in Figure 16. The
upper layer of the model represents the first permeable stratum (1) and the first near-
impermeable stratum (2). Both strata were modeled in a single layer by a using high
hydraulic conductivity, K, values for the x and y directions to represent stratum (1), but a
low K value for the z direction, to represent stratum (2). The lower layer in the model
contains stratums (3), (4), and (5). Strata (3) and (5) were assigned high K values, while
stratum (4) was assigned a low K value.
36
I
11.2
5 4 3
Figure 16 - Groundwater Flow Model Layers
Hydraulic conductivity, K, was specified based on the general geology of the
watershed, as shown in Figure 9. Each region was assumed to be homogeneous (i.e.
Kx=Ky=Kz). The permeable regions are comprised of (a) massive limestone and
dolomite, (b) basalt and basaltic tuffs, or (c) massive limestone with alternating thin beds
of marly limestone. These were assumed to have a K of 10-5 m/s. The near-impermeable
regions are comprised of (a) sandstone, marl, limestone debris, (b) thin bedded
limestone, sandstone, marl, limestone, (c) marly limestone and limestone in alternating
beds, (d) limestone with alternating layers of marl, or (e) white to light gray marl
(Papazian, 1981). These near-impermeable regions were assumed to have K of 10~8 m/s.
The K values were assumed based on the aquifer compositions and values given in
"Groundwater," by Freeze and Cherry, as seen in Figure 17.
37
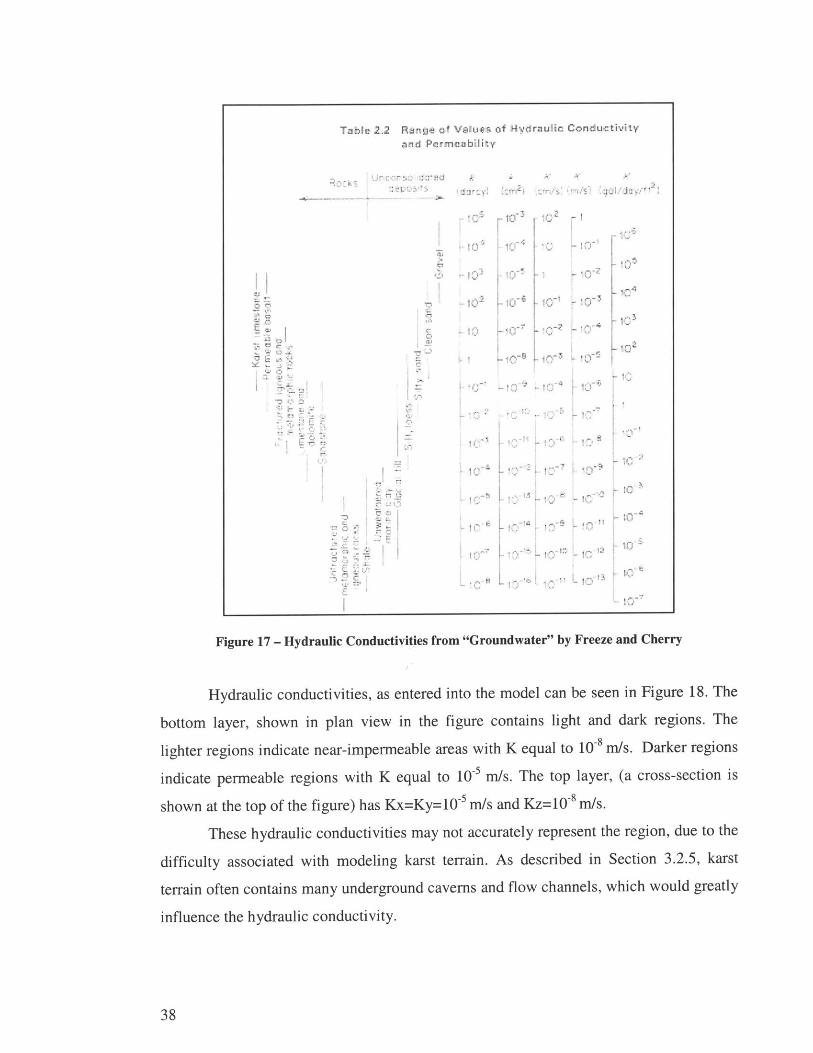
Figure 17 - Hydraulic Conductivities from "Groundwater" by Freeze and Cherry
Hydraulic conductivities, as entered into the model can be seen in Figure 18. The
bottom layer, shown in plan view in the figure contains light and dark regions. The
lighter regions indicate near-impermeable areas with K equal to 10-8 m/s. Darker regions
indicate permeable regions with K equal to 10 5 m/s. The top layer, (a cross-section is
shown at the top of the figure) has Kx=Ky=10-5 m/s and Kz=10-8 mIs.
These hydraulic conductivities may not accurately represent the region, due to the
difficulty associated with modeling karst terrain. As described in Section 3.2.5, karst
terrain often contains many underground caverns and flow channels, which would greatly
influence the hydraulic conductivity.
38
Table 2.2 Ranp of VA0eA Of Aydrauhc Conductiviy
,iri Perizarbility

Figure 18 - Groundwater Model: Hydraulic Conductivity
Recharge was assumed to be 0.002 m/day. Hydrogeological studies made on
various Lebanese watersheds showed that on an annual basis, 30 percent of precipitation
infiltrates into the ground, 13 percent goes to overland flow, and 57 percent is lost to
evapotranspiration, as seen in Table 4. The Nahr Ibrahim Basin is different from average
Lebanese watersheds, as the large majority of precipitation infiltrates into the ground,
most likely due to the karst terrain (Papazian, 1981). Based on these parameters, the Nahr
Ibrahim Basin was assumed to have 60 percent of precipitation infiltrate, 10 percent run
overland, and 30 percent evapotranspirate, as shown in the table below.
Table 4 - Precipitation Allocation
Average Lebanese Nahr IbrahimWatershed Basin
Infiltration 30 % 60 %Overland Flow 13 % 10 %
Evapotranspiration 57 % 30 %
39

Precipitation that goes to infiltration recharges the groundwater aquifers.
Recharge was calculated based on the percentage of rainfall. Average yearly rainfall is
1300 mm. Thus, recharge was calculated to be 0.002 m/day, as shown below.
(1300 mm/year)*(0.6) = 0.002 m/day
Top and bottom elevation for each layer were entered in coordinance with the
elevation of the river. Elevations were considered to be constant from north to south (i.e.
each column in the finite difference grid has a uniform elevation). Elevation does
decrease from east to west, with the profile of the river (i.e. the elevation of each column
decreases from right to left). The high mountain elevations (which would be on the north
and south of the river) were not entered directly into the model using elevation data.
However, they were accounted for with no flow boundaries around the watershed,
assuming that the water table follows the contour of the topography, as show in Figure
13. Elevation can be seen in Figure 19. The lower layer ranges from 500 m below sea
level to 1300 m above sea level. The upper layer ranges from 1300 m tol900 m above sea
level.
Figure 19 - Groundwater Model: Elevation
40

4.2.1.4 Unused ParametersGroundwater Vistas has several parameters that could be entered, but were not
used for this simulation, as they do not affect the groundwater flow. These parameters
include soil density, evapotranspiration, storage, leakance, porosity, dispersivity, and
sorption. These parameters would be useful to input if solute transport analysis was being
performed, and may be useful in the future.
4.2.2 OutputThe resulting model output shows approximations of the head values within the
Nahr Ibrahim watershed. The upper layer reaches heads of 1650 m and decreases to 1450
m, from east to west as water infiltrates into the bottom layer. In the lower layer, heads
decrease from east to west, from 1550 m to 0 m, as water flows into the Mediterranean
Sea. The head contours for layer 1 and layer 2 and be seen in Figure 20 and Figure 21.
Figure 20 - Groundwater Model: Head Contours, Layer 1
41

Figure 21 - Groundwater Model: Head Contours, Layer 2
Groundwater flows from high head to low head. The head contour lines around
the river can be used to determine if the river is gaining or losing. Head contours shown
on the left in Figure 22 are gaining, while contours shaped like those on the right are
losing, when the contours on the right have higher values than those on the left. Based on
this pattern, the Nahr Ibrahim is both losing and gaining.
42

Figure 22 - Gaining and Losing Head Contours
Mass balance was examined in each cell along the river in the computer model to
see if they were losing or gaining. Figure 23 shows gaining portions in blue, losing
portions in pink, and portions that alternate between gaining and losing in green.
Nahr Ibrahim BasinHydraulic Head Contours
5000 0 5000 10000 15000 20000 Meters
Losing or GainingBothGainingLosingHead ContourNah r Ibrahim Basin
Hydraulic Conductivityimpermeablepermeable
Figure 23 - Groundwater Model: Losing and Gaining
43
INI L ING
4.3 Mass Balance
In addition to the computer model, two mass balances were constructed using
flow data. The first used data from the January 2001 site visit performed by the authors
and the second used October data compiled from past reports. These two balances were
performed separately to account for three discrepancies in the data. (1) Different flow
measurement techniques were utilized, as the authors collected data the using a Rickly
Hydrolocigal Company pygmy flow meter, and by the past reports utilized data compiled
at gauging stations. (2) Pygmy flow meters report flow at a single time during a single
day, while the gauging station data is averaged over many days. (3) The authors collected
data for 2001, while the gauging station data is averaged from the 1930s to the 1970s.
Mass balances estimated groundwater flow reaches of the river between two
sampling points using the following equation:
GWF = RF(1) - RF(2) - OLF
where
GWF groundwater flow [L 3IT]
RF(1) river flow at end of reach [L 3IT]
RF(2) river flow at beginning of reach [L 3/T]
OLF overland flow [L 3IT]
River flow at the beginning and end of each reach were taken from the flow data.
Overland flow was calculated based using the following equation:
OLF =A * (P - E)
where
A area of the subasin which contains that reach [L2]
P precipitation [L/T]
E evapotranspiration [L/T]
Precipitation was based on average monthly precipitation values for January for
the site visit data, and October for the gauging station data. October was chosen, as it is a
44

month with relatively low precipitation and low river flow, so groundwater flow would
be more prominent. The results are shown in Table 5 and in Table 6. Sample location
(column 1), and flow (column 2) were estimated from report data or measured in the
field. Subasin area (column 3) was calculated in ArcView based on flow sample location
and elevation contours. Rainfall (column 4) was taken from Papazian (1981). The
percentage of evaporation (column 5) and the runoff coefficient (column 6) were based
on the values estimated in Table 4. Runoff (column 7) was calculated using the
previously described equation. Surface inflow (column 8) was taken from the river flow
in the previous reach. Groundwater flow (column 9) was calculated using the previously
described equation. Note that negative values indicate that the river is losing, while
positive values indicate the river is gaining. As seen in these tables, the Nahr Ibrahim is
both a losing and gaining river.
Table 5 - Gauging Station Groundwater Flow Mass Balance
1 2 3 4 5 6 7 8 9
River Runoff Surface GroundwaterLocation Flow Subasin Area Rainfall Evaporation Coefficient Runoff Inflow Flow
mA3/s mA2 mm/month mm/month mA3/s mA3/s mA3/s
Djinni 1.29 203,903,653 63.36 19.01 0.10 0.48 0 0.81
Khouaira 2.00 88,259,766 63.36 19.01 0.10 0.21 1.29 0.50
Mouth 1.70 24,725,762 63.36 19.01 0.10 0.06 2.00 -0.36
Table 6 - Site Visit Groundwater Flow Mass Balance
1 2 3 4 5 6 7 8 9
River Runoff Surface GroundwaterLocation Flow Subasin Area Rainfall Evaporation Coefficient Runoff Inflow Flow
mA3/s mA2 mm/month mm/month mA3/s mA3/s mA3/s
Site 1 0.08 51,174,437 320.00 96.00 0.10 0.43 0.00 -0.34
Site 2 0.82 108,954,895 320.00 96.00 0.10 0.91 0.00 -0.09
Site 4 0.61 125,858,894 320.00 96.00 0.10 1.05 0.91 -1.35
Site 6 0.22 4,533,950 320.00 96.00 0.10 0.04 0.61 -0.43
Site 7 0.12 2,235,473 320.00 96.00 0.10 0.02 0.22 -0.11
Site 8 2.05 7,701,086 320.00 96.00 0.10 0.06 0.12 1.86
Site 9 4.05 2,457,824 320.00 96.00 0.10 0.02 2.05 1.98
Site 10 1.98 13,028,516 320.00 96.00 0.10 0.11 4.05 -2.18
Site 11 3.54 584,860 320.00 96.00 0.10 0.00 1.98 1.55
45
4
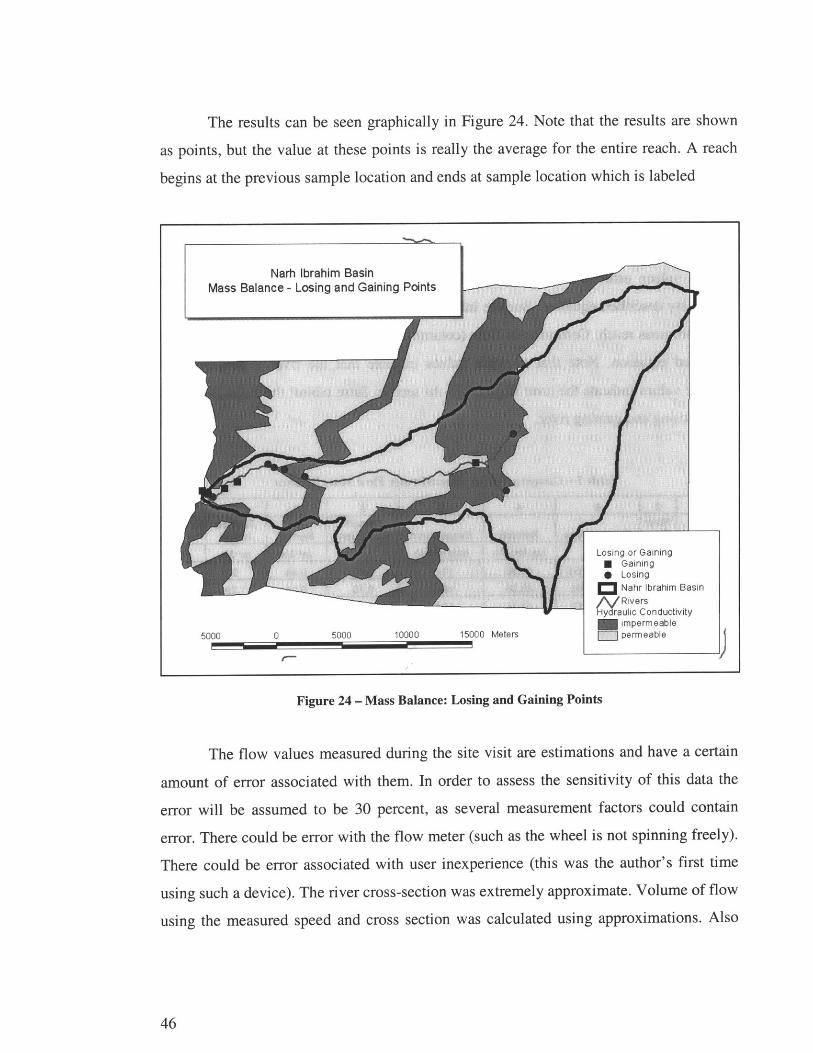
The results can be seen graphically in Figure 24. Note that the results are shown
as points, but the value at these points is really the average for the entire reach. A reach
begins at the previous sample location and ends at sample location which is labeled
Narh Ibrahim BasinMass Balance - Losing and Gaining Points
5000 0 5000 10000 15000 Meters
Los ng or Gaining* Gaining* Losing
Nahr Ibrahim BasinN Rivers
y raulic Conductivityimpermeable
I permeable
Figure 24 - Mass Balance: Losing and Gaining Points
The flow values measured during the site visit are estimations and have a certain
amount of error associated with them. In order to assess the sensitivity of this data the
error will be assumed to be 30 percent, as several measurement factors could contain
error. There could be error with the flow meter (such as the wheel is not spinning freely).
There could be error associated with user inexperience (this was the author's first time
using such a device). The river cross-section was extremely approximate. Volume of flow
using the measured speed and cross section was calculated using approximations. Also
46
I

note that while these flow values are specific values measured on a certain day, the
rainfall and evapotranspiration are estimated using average values.
Groundwater flow, GWF, was calculated based on the river flow (RF) at the
beginning and the end of a reach, as defined by the data collection points. These terms
could be 30 percent higher or lower than the actual value. A high groundwater flow value
was calculated assuming that the flow RF(1) was high, and RF(2) was low. A low GWF
value was calculated using the low estimate for RF(1) and a high estimate for RF(2), as
shown in the equations given below.
HIGH GWF = 1.3*RF(1) - 0.7*RF(2) - OLF
LOW GWF = 0.7*RF(1) - 1.3*RF(2) - OLF
The results of this sensitivity analysis are shown in Figure 25. Table 7 shows at
each location, for high, average, and low, whether the river is gaining or losing for that
reach. With the exception of Site 2 and Site 11, the high and low estimates are consistent
with the average value calculated. Based on this analysis, Site 2, which is located near the
Spring Roueiss, could be losing or gaining. The groundwater flow at this reach is
relatively small (near zero), and could easily be above or below, losing or gaining. At Site
11, the High GWF estimate, and the Average GWF estimate are well above zero, while
the Low GWF Estimate is just below zero. Most likely this reach is gaining. However,
note that the flow in this portion of the river alternates from gaining to losing, so if Site
11 is losing, it is consistent with the analysis.
47

5.00
4.00
3.00
2.00
1.00
0.00
C,-1.00
-2.00
-3.00
-4.00
-5.00
Figure 25 - Sensitivity Analysis
Table 7 - Sensitivity Analysis: Losing or Gaining
HIGH AVERAGE LOW
Site 1 L L L
Site 2 L G L
Site 4 L L LSite 6 L L LSite 7 L L L
Site 8 G G GSite 9 G G G
Site 10 L L L
Site 11 G G L
48

5 Conclusion
5.1 Results
The results from the groundwater flow model and the mass balance show that the
Nahr Ibrahim is both a losing and gaining river. Figure 26 shows the combined results
from the two types of analysis. Although both forms of analysis show that the river is
both losing and gaining, they are not completely consistent in identifying same portions
of the river as losing and gaining.
5000 0 5000 10000 15000
Mass Balance Model0 Gaining0 Losing
Groundwater Flow Model/\/Both
A GainingLosingHead ContourNahr Ibrahim Basin
Hydraulic Conductivityimpermeable
20000 Meters permeable
Figure 26 - Gaining and Losing River
Note that in Figure 26 each point from the mass balance model really indicates
that the reach up to that point is gaining or losing, not only at that certain point. Look at
the reach stretching from the source to where Nahr Ibrahim meets Nahr Roueiss. The
49
Narh Ibrahim BasinLosing and Gaining

groundwater flow model indicates that this portion is losing, while the mass balance
model indicates that it is gaining. For the next reach (through the permeable region in the
middle of the basin) the groundwater model indicates that the river is gaining, while the
mass balance indicates that it is losing. Through the following near-impermeable strata,
both models are consistent in indicating that the river is losing. From that point to the sea,
according to both models, the river alternates between losing and gaining.
5.2 Limitations
There are several limitations associated with this study. Due to these limitations,
the two types of analysis gave conflicting results. Improvement upon these limitations
would yield in more accurate analysis of the Nahr Ibrahim groundwater-surface water
interaction.
The major limitation of this study is the lack of reliable data, or any data at all.
There is no data relating the recent flow levels in the river. Gauging stations located at
more regular locations would be helpful, particularly along the portion of the river that is
inaccessible by road. The reliability of the existing data is questionable. It was often
difficult to determine the location of gauging stations, due to conflicting information
given in various reports. Furthermore, absolutely no well data was available, to measure
groundwater levels directly.
Note that since some flow sample locations are far apart, the resulting reaches are
quite long. The mass balance analysis indicates that the river is losing or gaining for the
entire reach, but it does not give specific information about the magnitude and location of
this loss or gain. A reach could be losing at a low rate for 90 percent and gaining at a high
rate for 10 percent, and the entire reach could be labeled as either losing or gaining. It
may be wise for this analysis to disregard the longer reaches in the mass balance analysis.
Other difficulties in modeling this basin are the same associated with any similar
basin. Karst terrain is extremely difficult to accurately model, due to the unknown nature
of the fracture system. Also, the hydraulic conductivity of the riverbed is difficult to
estimate, due to the debris that could be settled there.
A final issue is with the way that MODFLOW handles river information. River
elevation is entered for the source and mouth of the river. The intermediate points are
50

interpolated to be a straight line. This straight line is not consistent with the Nahr
Ibrahim. The groundwater flow model actually models the river as though it were in deep
into the ground for some portions and levitating in the air for other portions.
5.3 Further Studies
Although this study has determined that the Nahr Ibrahim is both losing and
gaining, further study is required to determine which portions are losing and which
portions are gaining. Such a study could build upon the groundwater flow model or the
mass balance analysis that were created for this study.
If the groundwater flow model is used, further enhancements of the model should
be made. The river elevation data should be entered in such a way that the river is at the
surface elevation, not above or below it. Spring location and flow data is available, and
could be incorporated into the model using MODFLOW's drain package.
Building upon the mass balance model requires more data than is currently
available. Flow measurements, taken at more regular locations using uniform sampling
methods, are essential. A greater number of sampling points will alleviant the uncertainty
associated with long reaches.
Furthermore, groundwater-surface water interaction studies, using any model,
could be performed at various times throughout the year to see if there is a seasonal
fluctuation.
51
References
http://www.modflow.com/modflow/modflow.html, visited 3/14/2001
Bureau d'Etudes Hydrauliques, 1994: Etude Des Apports De Nahr Ibrahim. Republique
Libanaise, Ministere Des Ressources Hydrauliques et Electriques. Lebanon.
Electrowatt, 1981: Relance Des Projects Hydro-Agricoles: Barrage De Iaal Dans Le
Liban Nord, Barrage De Yahchouch Sur Le Nahr Ibrahim. Ministere Des
Ressources Hydrauliques et Electriques. Lebanon.
El-Fadel, M. Zeinati, M., Jamali, D. 2000: Water Resources in Lebanon:
Characterization, Water Balance and Constraints. Water Resources Development,
16(4): 615-638.
Freeze, Allan R., and Cherry, John. A. 1979: Groundwater. Prentice-Hall, Inc. New
Jersey.
Macksoud, Salim W. 1998: Towards Sustainable Groundwater Development in Lebanon
http://www.oieau.fr/ciedd/contributions/atl/contribution/macksou.htmWater and Sustainable Development International Conference. Visited
12/15/2001.
Ministry of Tourism. "Legend of Adonis and Astarte." As per e-mail received 4/24/2001.
Nauphal, Naila. 1997: Post-war Lebanon: Women and other war-affected groups
http://www.ilo.org/public/english/employment/skills/training/publ/pub 9 .htm
International Labor Organization. Visited 2/20/2001.
Papazian, Hratch S. 1981: A Hydrogeological Study of the Nahr Ibrahim Basin in the
Vicinity of the Paper Mill Project of Indevco in Lebanon. Lebanon.
52

Appendix A: Nahr Ibrahim Cross-Sections
53

54

55

56
57

I
58
I