Embed Size (px)
Citation preview

Groundwater Chemistry of Post (2011) and Pre-Monsoon (2012) Season
In order to study the quality of groundwater (n=33) groundwater samples were
collected in post-monsoon season, 2011 from hand pump wells at shallow depth (18-
50ft) from Shah Bandar, KharoChann, K.T.Bandar, Ghora Bari and Mirpur Sakro. The
collected samples have been analyzed for different geochemical constituents using
standard method of analysis. The detail of the ionic constituents (Ca+2, Mg+2, Na+,
K+, Cl-, SO4-2) and non-ionic constituents (EC, pH,TDS) of the groundwater is
mentionin (Annex VII).
Classification of Groundwater Types in the Study Area
The quality of groundwater at any point below the surface reflects the
combined effects of many processes along the groundwater flow path. Chemical
reactions such as weathering, dissolution, precipitation, ion exchange and various
biological processes commonly take place below the surface. Hydrogeochemical
study is a useful tool to identify these processes that responsible for groundwater
chemistry (Jeevanadam et.al. 2007). Several authors have reported about the presence
of contaminants in soil (Muir & Baker, 1998; Wu, 1980) and water (Kolpin,
Barbash& Gillian, 1998) in various parts of the globe. In the management of the water
resources, quality of water is just as important as its quantity. In order to know the
quality and suitability of groundwater for domestic and irrigation purposes several
parameters based standard classification are available. Groundwater samples of the
study area have been discussed separately area wise according to the following
classification.
Classification of Groundwater Based on TDS
The total dissolved solids (TDS) estimated by residue on evaporation method.
Davis and De Wiest (2007) classified groundwater on the basis of TDS, If
groundwater have TDS value upto 500mg/l, it is considered desirable for drinking,
500-1000mg/l permissible for drinking and upto 3,000mg/l maximum permissible
limit and only useful for agriculture purpose (Table 21). While, according to WHO
(1984) TDS classification upto 500mg/l is highest and upto 1000 mg/l is permissible
desirable for drinking purpose (Table 21).
Table 21. Classification of groundwater based on TDS (Davis and De Wiest ,2007)
S.No TDSmg/l
Categories
1 500 desirable for drinking
2 500-1000 permissible for drinking

3 Upto 3,000 useful for agriculture
According to classification of groundwater based on TDS values, out of thirty three
water samples collected from Shah Bandar, Keti Bandar, Ghora Bari, Mirpur Sakro
and KharoChann Tehsil three groundwater samples found having TDS values upto
500mg/l, forteen samples shows TDS values within 500-1000mg/l and 16 water
samples found in the category of having TDS values more than 1000mg/l useful for
agriculture but not suitable for human consumption. The detail of water samples
Tehsil wise fall in different categories shown in (Table 22).
Table 22. Classification of groundwater based on TDS (Davis and De Wiest ,2007)
Categories Post-monsoon Pre-monsoon
Shah Bandar
Keti Bandar GhoraBari
Mirpur Sakro Kharo Chan Shah Bandar
Keti Bandar
desirable for drinking
Two samples(No. 1,4)
- - Two samples(No. 2,10)
-
permissible for drinking
- One sample (No.3) Three samples(No.2,4 6)
Eight samples (No. 1,4,7, 8,9,12,14,17 )
useful for agriculture
Three samples(No. 2,3,5)
Two samples(No. 1,2)
Three samples(No.1,3, 5)
Seven Samples (No. 3,4,6,11,13,16,17)
One sample (No.1)
Table.4 (a) Groundwater type in the study area based on TDS (post monsoon season, 2011)
S.No Categories Post-monsoon-2011 Total
Shah Bandar
Keti Bandar
1 desirable for drinking 2 -
2 permissible for drinking - 1
3 useful for agriculture 3 2
Table.4 (b) Groundwater type in the study area based on TDS (pre-monsoon, 2012)
S.No Categories Pre-monsoon-2012 Total

Shah Bandar
Keti Bandar GhoraBari
1 desirable for drinking 1 - -
2 permissible for drinking - - 2
3 useful for agriculture 1 1 5
Classification of Groundwater Based on EC and SAR
The quality of irrigation water in relation to the alkalinity hazard is expressed
by Sodium Adsorption Ratio (SAR). The agricultural yields are observed to be
generally low inlands irrigated with waters belonging to permissible to doubtful
category. This is probably due to the presence of sodium salts, which cause os-
moticeffects in soil plant system. While a high salt content (highEC)
inwaterleadstoformation ofsaline soil,highsodiumcontent (SAR)
leadstodevelopment of analkaline soil (N.JanardhanaRaju, 2007).
Thesodiumoralkalihazard inthe useofwater forirrigation isexpressed bydetermining
the
sodium adsorptionration (SAR) and it can be estimatedbytheformula
The groundwater facies classification based on EC and SAR (salinity categories) by
Gupta (1990) has been adopted in the present study to determine its suitability in term of
domestic agricultural purposes.The water from handpumpwells is of following type in the
study area (Table 22).
EcdS/m
Salinity Categories
< 2 Good water
> 2 Saline water
> 4 High saline water
Variable Alkali water
Table.4 (a) Groundwater type in the study area based on EC and SAR (post monsoon, 2011)
S.No Categories Post-monsoon-2011
Total
Shah Bandar
Keti Bandar GhoraBari
Mirpur Sakro

1 Good water 2 1 3 13
2 Saline water - - - 1
3 High saline water 2 - 2 3
4 Alkali water 1 2 1 1
Table.4 (b) Groundwater type in the study area based on EC and SAR (pre-monsoon, 2012)
S.No Categories Post-monsoon-2011 Total
Shah Bandar
Keti Bandar
1 Good water 1 -
2 Saline water 1
3 High saline water -
4 Alkali water 1 -
Classification of Groundwater Based on RSC
Residualsodium carbonate(RSC) has been calcu- latedto determinethe
hazardous effect ofcarbonate andbicarbonate onthequalityofwaterforagricultural
purpose(Eaton1950)andhasbeen determined bythe
formula:RSC=(CO3+HCO3)_(Ca+Mg). The US Salinity Laboratory Diagram
(1954) pro- posedthat waters containing more than 2.5 meq/l of RSC are not suited
forirrigation, whilethose having 1.25–2.5meq/l are marginally suitable and those
with less than 1.25meq/l are probably safe for irrigation. Following table is the
RSC based classification of the groundwater of the study (Table 24).
Table. RSC based Classification (The USSalinityLaboratory, 1954)S.No RSC Categories
1 < 1.25 Probably safe
2 1.25-2.5 Marginal Suitable
3 > 2.5 Un-suitable

Table.4 (a) Groundwater type in the study area based on RSC (post monsoon season, 2011)
S.No Categories Post-monsoon-2011 Total
Shah Bandar
Keti Bandar
1 Probably safe 1 2
2 Marginal Suitable 2 -
3 Un-suitable 2 1
Table.4 (b) Groundwater type in the study area based on RSC (pre-monsoon, 2012)
S.No Categories Pre-monsoon-2012
Shah Bandar
1 Probably safe 2 1
2 Marginal Suitable -
3 Un-suitable -
Classification of Groundwater Based on Na Content
Sodium concentration plays an important role in evaluating the groundwater
quality for irrigation because sodium causes an increase in the hardness of the soil as
well as reduction in its permeability (Tijani, 1994).Sodium content is usually
expressed in terms of percent sodium or soluble-sodium percentage (%Na). As per
the Indian standards, maximum of 60% sodium is permissible for irrigation water
(N.JanardhanaRaju 2007). (Wilcox 1955) classify groundwater on the basis of Na %
(Table 25).
Table 24. sodium percentage based Classification (Wilcox, 1955)

S.No Na% Categories
1 20 Excellent
2 21-40 Good
3 40-55 Poor
4 50-70 Very poor
Table 24. Classification of groundwater based on sodium percentage(Wilcox, 1955)
S.No Na% Categories Post-monsoon
Shah Bandar Keti Bandar Ghora Bari Mirpur Sakro
1 20 Excellent 4 1,3 2,5 1,2,5,6,8,14
2 21-40 Good 1,5 - 3,4,6 7,16
3 40-55 Poor 2,3 2 1 9,10,11,12,13,17,18
4 50-70 Very poor - - -
Table.4 (a) Groundwater type in the study area based on Na% (post monsoon season, 2011)
S.No Categories Post-monsoon-2011 Total
Shah Bandar
Keti Bandar
1 Excellent 1 2
2 Good 2 -
3 Poor 2 1
4 Very poor - -
Table.4 (b) Groundwater type in the study area based on Na% (pre-monsoon, 2012)
S.No Categories Pre-monsoon-2012
Shah Bandar
1 Excellent
2 Good
3 Poor
4 Very poor

In the light of the above classification, the chemical quality of groundwater (shallow
aquifers) has been discussed separately area wise and the groundwater facies has been
derived from piper triangular diagram.
Shah Bandar Tehsil Post Monsoon (2011)
Five groundwater samples were collected from Shah Bandar Tehsil in post
monsoon season, 2011. The pH of groundwater samples ranges from 7.05-7.78 (Table
….) with an average of 7.48. All samples have pH value more than 7 indicating
alkaline nature of the samples. According to WHO (1984) TDS specification, 40%
and 60% of groundwater samples belongs to highest desirable and maximum
permissible limits respectively. While, Davis and De Weist (2007) TDS based
classification, indicate that out of five groundwater samples one (no. 4) is desirable,
one (no. 1) is permissible and remaining three (no. 2, 3, 5) are only suitable for
agricultural purpose.
According to EC and SAR based classification by Gupta (1990), two of these
samples (1, 4) belong to good water category as their EC and SAR values are <2
(0.69, 0.86 dS/m) and <10 (2.0, 2.39) respectively. The Ca and Mg contents are more
than Na and Cl in these two samples, suggesting their fresh water facies. While, two
samples (3, 5) are in high saline water category as their EC and SAR values are 4.01,
4.06dS/m and 23.3, 30.38 respectively. In these two samples increased EC also leads
to increased concentration of Na and Cl, which indicates the impact of sea water
intrusion in the area. On the other hand remaining one sample (2) belongs to high
saline water category as its SAR and calcium plus magnesium values are same
(18.19). It indicates that fresh water is being replaced by salt water (Table 26).
Table 25.Physico-chemical analyses of groundwater samples (post monsoon, 2011)
from Shah Bandar
S. No
EC dS/m
TDS
pH Anions Meq/l
CationsMeq/l
Na/Cl
ratio
Ca/Mgrati
o
Cl/HCO3Ratio
SAR
RSC
CO3
HCO3
Cl SO4
Ca+Mg
Na K
1 0.857
548 7.51 Nil 3.2 2.1 1.62 4.805
3.69 0.81 10.86
0.65 2.39 -1.61 CaHCO3
2 3.630
232 7.78 Nil 11 20.1 4.17 18.19
30 0.512 0.41 1.8 18.19
-7.19 NaCl
3 4.01 2566
7.63 Nil 6.6 30.0 4.58 9.87 51.73
0.512 0.57 4.5 23.3 -3.27 NaCl
4 0.696
445 7.43 Nil 4.8 1.78 0.94 5.62 3.39 0.10 2.97 0.37 2.02 -0.82 CaHCO3
5 4.06 2598
7.05 Nil 7.4 28.6 6.04 5.502
50.43
1.282 0.62 3.8 30.38
2.38 NaCl
According to U.S salinity laboratory (1954) RSC based classification it is
observed that one sample (no. 4) is probably safe, two samples (no. 1, 5) are marginal
suitable while remaining two sample (no. 2, 3) have RSC value greater than 2.5 are
not suitable even for agriculture (Table classification wala). According to Wilcox
(1955) sodium content based classification, one sample (no. 4) belongs to excellent
water category indicate that it is probably safe for irrigation, two samples (no. 1, 5)
and two (no. 2, 3) belongs to good and poor water category respectively. Good water
category is safe for irrigation but poor is hazardous and indicating the saline water
intrusion. On the same content base Raju (2007), sodium content value of all samples
is less than 60% indicate the suitability of groundwater for irrigation.
Cat ion chemistry of Shah Bandar groundwater samples indicating the
increasing of parameters like Na>Ca>Mg>K. Sodium is showing good co-relation
with chloride (r = 1.0) indicating that these have been derived from same source. If
halite dissolution is responsible for sodium, Na/Cl ratio should be approximately
equal to 1, whereas ratio greater than 1 is typically interpreted as Na released from
silicate weathering reaction (Meyback, 1987). In present study, Na/Cl ratio of
groundwater samples generally varying from 1.49 - 1.1.98 (Fig. 3) suggesting silicate
weathering.
Calcium and magnesium concentration of Shah Bandar groundwater have low
co-relation and coefficient (0.023) indicating the absence of carbonatic source.
Further, Ca/Mg ratios of the most of the groundwater samples range from 0. 41 to
10.8 indicating the dolomite contribute solutes to the groundwater.
Fig.3 Na/Cl ratio suggests silicate weathering .
The concentration of chloride indicates that salt water intrusion and irrigation
return flow might be responsible ( Luscynski and Swarzenski 1996). This is also
supported by the Cl/HCO3. Generally a ratio more than 2.8 indicates severe
contamination with sea water (Ragunath, 1982). Ggroundwater samples collected
from Shah Bandar area reveal Cl/HCO3ratio of 0.37 – 4.5 indicating that some
groundwater samples are safe from sea water intrusion but some are affected.
Piper trilinear diagram (Fig.4) of Shah Bandar for geochemical classification
and hydrochemical processes of groundwater for post monsoon season indicates that
most of the waters are Na-Cl type. It suggesting the influence of sea water, ancient
saline groundwaters, or dissolution of halite (NaCl). Such water type create salinity
both in irrigation and domestic uses (Raju, 2007) For irrigation purpose it is very
high in salinity hazard and free from RSC but Mg hazard is 72.5 mg/l which is
another indicator of saline water intrusion. In this area most serious threat to the
groundwater is intrusion of saline water to fresh water. While, remaining samples are
Ca-HCO3type typical occurrence of this facie in aquifer is shallow, fresh groundwater
in recharge area. It is suggesting irrigation return flow and anthropogenic activities
(Jeevanandamet.al., 2007). Such water type have temporary hardness (Raju,2007).
Cations Anions
Fig. 4: Piper diagram for hydrochemicalfacies of groundwater (post monsoon, 2011)of Shah Bandar

Keti Bandar Tehsil Post Monsoon (2011)
Three groundwater samples were collected from Keti BandarTehsil in post
monsoon season, 2011. The pH of groundwater samples ranges from 6.01 - 7.58
(Table ….) with an average of 6.78. Almost samples have pH value 7 indicating
alkaline nature of the samples. According to WHO (1984) TDS specification, 33%
and 66% of groundwater samples belongs to highest desirable and maximum
permissible limits respectively. While, Davis and De Weist (2007) TDS based
classification, indicate that out of three groundwater samples one (no. 3) is desirable
and remaining two (no. 1, 2) have high TDS value and only suitable for agricultural
purpose.
According to EC and SAR based classification by Gupta (1990), two of these
groundwater samples (1, 2) are within alkali water category as their EC (3.55,
3.74dS/m and SAR (27.9, 15.48)values are variable. In these samples Na contents are
higher than the total contents of Ca plus Mg, which shows the impact of sea water
intrusion. The loss of Na and gain of Ca and Mg suggests a direct
cation exchange usually observed in similar situations when the
seawater is replacing fresh water (Appelo and Postma, 2005;
Cardona et al., 2004; De Montety et al., 2008; Yaouti et al., 2009).
While, the remaining sample (3) belongs to good water category, as its EC and
SAR values are <2 (1.009dS/m) and <10 (2.41) respectively. Further, its calcium plus
magnesium contents are also higher than Na and Cl (Table27). The good water quality
water of this hand pump well may be due to its location near canal or fresh water
pond in the area.
Table 26Physico-chemical analyses of groundwater samples (post monsoon, 2011)from K.T.Bandar
S. No.
EC dS/m
TDS
pH Anions Meq/l
CationsMeq/l
Na/Cl
ratio
Ca/Mgrati
o
Cl/HCO3Ratio
SAR
RSC
Water
Type
CO3
HCO3
Cl SO4
Ca+Mg
Na K
1 3.55 2272
7.58 Nil 6.8 26.8 2.92 6.05 48.69
1.03 1.8 2.0 3.9 27.9 0.75 NaCl
2 3.74 2394
6.75 Nil 9.4 24.4 4.16 15.49
43.04
0.512
1.8 1.1 2.5 15.48
-6.09 NaCl
3 1.009
646 6.01 Nil 5.5 3.6 1.54 6.02 4.17 0.15 1.2 2.7 0.6 2.41 -0.42 CaCl

According to U.S salinity laboratory (1954) RSC based classification it is
observed that two samples (no. 1,3) are probably safe and only one sample (no. 2)
have RSC value greater than 2.5 and not suitable even for agricultural purpose (Table
classification wala). According to Wilcox (1955) sodium content based classification,
two samples (no. 1,3) belongs to excellent water category indicate that it is probably
safe for irrigation. While, remaining one sample (no. 2) belong to poor water category
and it is hazardous and indicating the saline water intrusion. On the same content
base classification Raju (2007), sodium content value of all samples is less than 60%
indicate the suitability of groundwater for irrigation.
Cat ion chemistry of Keti Bandargroundwater samples indicating the
increasing of parameters like Na>Ca>Mg>K. Sodium is showing good co-relation
with chloride (r = 1.0) indicating that these have been derived from same source. If
halite dissolution is responsible for sodium, Na/Cl ratio should be approximately
equal to 1, whereas ratio greater than 1 is typically interpreted as Na released from
silicate weathering reaction (Meyback, 1987). In present study, Na/Cl ratio of
groundwater samples generally varying from 1.49 - 1.1.98 (Fig.5) suggesting silicate
weathering.
Fig.5 Na/Cl ratio suggests silicate weathering .
Calcium and magnesium concentration in groundwater of Keti Bandarvary
from 4.4 – 8.0 and 1.6 – 7.5 with an average of concentrations of 6.3 and 4.1 (Table
27). They have low co-relation and coefficient (0.55) among the major ions indicating
the absence of carbonatic source. Further, Ca/Mg ratios of the groundwater samples

range from 0. 6 to 3.9 indicating the dolomite contribute solutes to the groundwater
(Kannanet.al., 2007). Potassium concentarion in groundwater varies from 0.15 – 1.03
meq/l with an average of 0.56 meq/l (Table 26). Potassium present in the water might
have come from irrigation return flow.
The choloride- bicarbonate ratio is a good factor to identify saltwater
intrusion. Chloride is the dominant ion of sea water it is only available in small
quantities in groundwater (Ragunath, 1990). On the other hand, bicarbonate eis the
dominant ion in groundwater whereas, its concentration in saltwater is very small.
According to (Ragunath, 1990) Cl/HCO3ratio = 2.8 is a threshold value for saltwater
intrusion. So, one sample (no. 1) value exceeding from 2.8 indicating it is
contaminated by saltwater intrusion. While remaining two (no. 2,3) have low value
and safe from intrusion impact.
Piper trilinear diagram (Fig.6) of Shah Bandar for geochemical classification
and hydrochemical processes of groundwater for post monsoon season indicates that
most of the waters are Na-Cl type. It suggesting the influence of sea water, ancient
saline groundwaters, or dissolution of halite (NaCl). Such water type create salinity
both in irrigation and domestic uses (Raju, 2007) For irrigation purpose it is very
high in salinity hazard and free from RSC but Mg hazard is 72.5 mg/l which is
another indicator of saline water intrusion. In this area most serious threat to the
groundwater is intrusion of saline water to fresh water. While, remaining samples are
Ca-HCO3type typical occurrence of this facie in aquifer is shallow, fresh groundwater
in recharge area. It is suggesting irrigation return flow and anthropogenic activities
(Jeevanandamet.al., 2007). Such water type have temporary hardness (Raju,2007).
Cations Anions
Fig. 6: Piper diagram for hydrochemicalfacies of groundwater(post monsoon, 2011)of Keti Bandar
4.2.4Ghora Bari Tehsil Post Monsoon (2011)
Six groundwater samples were collected from Ghora Bari Tehsil in post
monsoon season, 2011. The pH of groundwater samples ranges from 6.69 - 7.66
(Table 28) with an average of 7.15. Almost samples have pH value 7 indicating
alkaline nature of the samples. According to WHO (1984) TDS specification, half of
groundwater samples belong to highest desirable and half to maximum permissible
limits. While, Davis and De Weist (2007) TDS based classification, indicate that out
of six groundwater samples three samples (no. 2,4,6) are desirable and remaining
three (no. 1, 3,5) are only suitable for agricultural purpose.
According to EC and SAR based classification by Gupta (1990), two
groundwater samples (2, 4,) from this area belong to good water category, as their EC
and SAR values are<2 (1.531, 1.063 dS/m) and <10 (5.76 to 2.05) respectively. While
one sample (3) belongs to saline water category (EC : 1.921 dS/m, SAR: 5.16). On the
other hand, two samples (1, 5) are highly saline, as their EC are >4 (10.05, 3.92 dS/m)
and SAR >10 (39.7, 25.17 ) respectively. In these samples, sodium, chloride and
sulphate contents are higher than total calcium plus magnesium contents. Only one
sample (6) belongs to alkali water type (EC 1.30 and SAR 34.0), which indicates
sever impact of sea water intrusion (Table 27).
Table 27.Physico-chemical analyses of groundwater samples (post monsoon, 2011)from Ghora Bari and Kharo Chan
S. No
EC dS/m
TDS
pH Anions Meq/l
CationsMeq/l
Na/Cl
ratio
Ca/Mgrati
o
Cl/HCO3rati
o
Na %
SAR
RSC
Water Type
CO3
HCO3
Cl SO4
Ca+Mg
Na K
1 10.05
6432
6.881
Nil 11.6
9.193
10 14.5
106.08
1.025
11.5
2.2 0.79
88 39.7
-2.92 NaH-SO4
2 1.531
980 7.66
Nil 8.6 6.79
1.66
7.45
11.130
1.179
1.63
0.46
0.78
62 5.76
1.15 NaH-CO3
3 1.921
1229
6.91
Nil 8 10.18
2.2 9.85
11.47
0.358
1.12
2.0 1.27
55 5.16
-1.85 NaCl
4 1.063
680 6.69
Nil 5.6 3.78
1.98
8.03
4.1 0.205
1.0 2.1 0.675
35 2.05
-2.43 CaH-CO3
5 3.920
2509
7.48
Nil 7.2 28.39
2.92
8.19
50.86
1.03
1.79
0.70
3.9 86 25.2
-0.99 NaCl
6 1.30
832 7.65
Nil 7.8 3.58
2.71
5.44
56.08
6.15
15.6
0.67
0.45
92 34.0
2.36 NaH-CO3
1 3.76
2406
6.81
Nil 7.2 26.99
3.33
16.1
37.39
0.76
1.3 3.7 13.2
-8.8

Only one groundwater sample was collected from KharoChann Tehsil. Its EC
and SAR values are 3.76 dS/m and 13.21 respectively. It belongs to alkali water
facies of the groundwater indicating the salt water intrusion in the area (Table 27).
According to U.S salinity laboratory (1954) RSC based classification, it is
observed that two samples (no. 2,5) are probably safe, three sample (no. 3,4,6) have
RSC value in limit (1.25 - 2.5) are marginal suitable and only one sample (no. 1) have
RSC value greater than 2.5 not suitable for agricultural purpose (Table classification
wala). According to Wilcox (1955) sodium content based classification, one samples
(no. 4) belongs to good water category indicate that it is safe for irrigation, one
sample (no. 3) belong to poor water category, While remaining samples (no. 1,2,5,6)
belong to very poor water category and it is hazardous and indicating the saline water
intrusion. On the same content base classification Raju (2007), sodium content value
of two samples (no. 2, 3) is less than 60% indicate the suitability of groundwater for
irrigation and remaining all have higher value.
Cat ion chemistry of Keti Bandargroundwater samples indicating the
increasing of parameters like Na>Ca>Mg>K. Sodium is showing good co-relation
with chloride (r = 0.195) indicating that these have been derived from different
source. In present study, Na/Cl ratio of groundwater samples generally varying from
1.0 – 15.6 (Fig.7) suggesting silicate weathering.

Fig. 7 Na/Cl ratio suggests silicate weathering .
Calcium and magnesium concentration in groundwater of Keti Bandarvary
from 2.2 – 6.6 and 2.43 – 9.92 with an average of concentrations of 4.7 and 4.6 (Table
28). They have low co-relation and coefficient (0.019) among the major ions
indicating the absence of carbonatic source. Further, Ca/Mg ratios of the groundwater
samples range from 0.46 – 2.2indicating the dolomite contribute solutes to the
groundwater (Kannanet.al., 2007). Potassium concentarion in groundwater varies
from 0.15 – 1.03 meq/l with an average of 0.56 meq/l (Table 28). Potassium present in
the water might have come from irrigation return flow.
The choloride- bicarbonate ratio is a good factor to identify saltwater
intrusion. Chloride is the dominant ion of sea water it is only available in small
quantities in groundwater (Ragunath, 1990). On the other hand, bicarbonate is the
dominant ion in groundwater whereas, its concentration in saltwater is very small.
According to (Ragunath, 1990) Cl/HCO3ratio = 2.8 is a threshold value for saltwater
intrusion. So, no sample have Cl/HCO3ratio greater than 2.8 indicating safe
groundwater from saline water intrusion.
Piper trilinear diagram (Fig.8) of Ghora Bari for geochemical classification
and hydrochemical processes of groundwater for post monsoon season indicates two
groundwater samples (no. 3, 5) are Na-Cl type. It suggesting the influence of sea
water, ancient saline groundwaters, or dissolution of halite (NaCl). Such water type
create salinity both in irrigation and domestic uses (Raju, 2007) For irrigation
purpose it is very high in salinity hazard . Two (no. 2, 6) are Na-HCO3 type have high
hazardous impact for irrigation, one sample is Ca-HCO3type typical occurrence of
this facie in aquifer is shallow, fresh groundwater in recharge area. It is suggesting
irrigation return flow and anthropogenic activities (Jeevanandamet.al., 2007). Such
water type has temporary hardness (Raju, 2007). While, remaining one (no. 1) is Na-
SO4this is rare type, can result from mixing of ancient Na-rich groundwaters with
pyritr oxidation waters, also formed by intensive evaporation of waters which
havepreviously lost their Ca and HCO3.

Cations Anions
Fig. 8: Piper diagram for hydrochemicalfacies of groundwater (post monsoon, 2011)of Ghora Bari
4.2.5MirpurSakro Tehsil Post Monsoon (2011)
Eighteen groundwater samples were collected from Mirpur SakroTehsil in
post monsoon season, 2011. The pH of groundwater samples ranges from 6.77 - 7.58
(Table 29) with an average of 7.18. Mostly samples have pH value more than 7
indicating alkaline nature of the samples. According to WHO (1984) TDS
specification, 61% and 38% of groundwater samples belongs to highest desirable and
maximum permissible limits respectively. While, Davis and De Weist (2007) TDS
based classification, indicate that out of eighteen groundwater samples two (no. 2, 15)
are desirable, eight (no. 1, 5, 7, 8, 9, 12, 14, 18) are permissible and remaining are not
suitable for agricultural purpose.
SAR based classification by Gupta (1990), twelve
(1,2,3,5,7,8,9,10,11,12,14,15) samples belong to good water category, as their EC and
SAR values are <2 dS/m and <10 respectively. While, four samples (6, 13, 17, 18)
having variable EC and SAR fall in alkali water category. On the other hand, sample
(16) is saline water, as its EC is >2 ( 2.17dS/m) and SAR is <10 (8.0 ) and the
remaining sample (4) is high saline water with its EC (>4) 4.19 dS/m and SAR (>10)
21.36 respectively.
Most of the groundwater samples from this area are non – saline, only four
water samples are moderately to severe saline, as their EC and SAR are relatively
higher as compared to other samples. In all these samples sodium, chloride and
sulphate ions show positive correlation. It indicates the presence of sodium chloride
salt along with sodium sulphate salt in these four samples. High concentration of
sodium and chloride in these samples indicates saltwater intrusion. The increased

concentration and positive correlation of chloride and sulphate also suggests sea
water intrusion in the area (Table 29).
According to U.S salinity laboratory (1954) RSC based classification it is
observed that six samples (no. 1,2,5,6,8,14) are probably safe, two samples (no. 7,16)
are marginal suitable while, remaining sample (no. 9,10,11,12,13,17,18) have RSC
value greater than 2.5and they are not suitable even for agriculture (Table
classification wala). According to Wilcox (1955) sodium content based classification,
six samples (no. 1,2,5,6,8,14) belongs to excellent water category indicate that it is
probably safe for irrigation, two samples (no. 7,16)) ) belongs to good and
remaining (no. 9,10,11,12,13,17,18) belongs to poor water category. Good water
category is safe for irrigation but poor is hazardous and indicating the saline water
intrusion. On the same content base Raju (2007), sodium content value of all samples
is less than 60% indicate the suitability of groundwater for irrigation.
Cat ion chemistry of Mirpur Sakrogroundwater samples indicating the
increasing trend of parameters like Na>Ca>Mg>K. The sodium concentration in the
area ranges from 2.13 – 67.82 meq/l with an average concentration of 15.18 meq/l
(Table 29). Sodium is not showing good co-relation with chloride (r = 0.097)
indicating that these have been derived from different source. In present study, Na/Cl
ratio of groundwater samples generally varying from 0.13 – 10.8, while only one
sample have very high Na/Cl ratio (374.6) (Fig.9). Na/Cl ratio of five groundwater
samples is equal to 1, indicating the dissolution of halite, While remaining all samples
have ratio greater than 1 indicating sililcateweathering suggesting silicate weathering
(Meyback, 1987). It is also well supported by high values of HCO3than sodium
(Kannana, 2007). In some samples HCO3have low value than sodium so, sodium
might have come from irrigation return flow and anthropogenic activity.

Fig.9 Na/Cl ratio suggests silicate weathering .
Calcium and magnesium concentration of Mirpur Sakrogroundwater vary
from 2.4 – 9.6 and 1.0 – 8.3 meq/l with an average concentration of 4.45 and 2.9
meq/l respectively(Table 29).They have low co-relation and coefficient (0.115)
among the major ions indicating the absence of ubiquitous source of Ca and Mg
(Kannana,2007). Further, Ca/Mg ratios of the most of the groundwater samples range
from 0. 7 to 4.15 indicating the dolomite contribute solutes to the groundwater.
Potassium concentration in groundwater varies from 0.15 – 1.03 meq/l with an
average of 0.56 meq/l (Table 29). According to (Ragunath, 1990), Cl/HCO3ratio of all
groundwater samplea is less than threshold value (2.8) indiv=cating this area is safe
from seawater intrusion. Only two samples (no. 4, 7) have high Cl/HCO3ratio
indicating saline water intrusion and in same both samples Cl value is also high. The
concentration of Clinidicate that saltwater iintrusion and irrigation return flow might
be responsible (Luscznski&Swarzenski, 1996).
Table 28Physico-chemical analyses of groundwater samples(post monsoon, 2011)from Mirpur Sakro
S.
EC
TD
pH
An
CationsMeq/l Na/Clratio
Ca/Mgrati
o
Cl/HCO3
ratio
SAR
RSC
Water Typ
eCO
HCO3 Cl SO4
Ca+Mg
Na K
1 0.
59
7.
Ni
6 1.19 2.514
6.23
3.86
0.102
3.23
0.94
0.19
2.19
-0.23
NaH-CO3
2 0.
43
7.
Ni
4.6 1.58 1.041
3.614
3.52
0.20
2.2 1.98
0.34
2.63
0.986
NaH-CO3
3 1.
10
6.
Ni
5.6 8.35 3.58
12.63
8.869
0.20
1.0 3.16
1.49
3.53
-7.03
CaCl
4 4.
26
7.
Ni
8.2 26.98 8.54
15.1
58.69
1.282
2.1 0.819
3.2 21.36
-6.9 NaCl
5 0.
58
7.
Ni
5.8 2.48 1.812
6.02
3.78
0.179
1.5 2.30
0.42
2.18
-0.22
CaH-CO3
6 1.
11
7.
Ni
7.6 0.18 4.08
6.64
67.82
0.153
3746
0.72
0.02
37.26
0.96
NaH-CO3
7 0.
58
7.
Ni
6 35.46 1.416
4.01
4.95
0.102
0.13
2.88
5.91
3.49
1.99
NaCl
8 0.
52
7.
Ni
4.2 2.40 1.75
5.212
3.347
0.102
1.3 4.15
0.57
1.28
-1.01
CaH-CO3
9 0.
60
6.
Ni
4.2 3.89 1.604
7.03
3.869
0.128
0.99
1.67
0.92
2.06
-2.82
CaCl

10
0.
54
7.
Ni
4 2.68 1.916
23.44
3.43
0.102
1.2 2.4 0.66
1.0 -19.44
CaH-CO3
11
1.
10
7.
Ni
8.6 7.78 0.666
5.43
12.34
0.7 1.5 1.23
0.90
7.52
-3.17
NaH-CO3
12
1.
72
7.
Ni
5.6 0.39 2.229
9.027
4.26
0.128
10.8
3.05
0.07
2 -3.427
NaCl
13
2.
17
7.
Ni
9.6 12.4 5.937
5.02
35.69
0.384
2.8 1.25
1.29
22.56
4.58
NaCl
14
1.
89
6.
Ni
6.6 4.88 3.166
7.63
9.30
0.153
1.9 1.90
0.73
4.77
-1.03
NaH-CO3
15
0.
43
7.
Ni
4 1.9 1.2 5.42
2.13
0.102
1.12
2.8 0.47
1.29
-1.42
CaH-CO3
16
2.
13
7.
Ni
9.2 8.48 3.58
7.83
15.91
0.30
1.8 2.2 0.92
8 1.37
NaH-CO3
17
3.
20
7.
Ni
8.4 17.39 5.83
12.47
37.82
1.03
2.1 0.66
2.0 15.18
-4.07
NaCl
18
1.
79
7.
Ni
5 4.88 2 7.65
5.13
0.15
1.0 0.98
0.97
10.05
-2.65
NaCl
Piper trilinear diagram (Fig.10) of Mirpur Sakrofor geochemical classification
and hydrochemical processes of groundwater for post monsoon season indicates that
six groundwater samples are waters are Na-HCO3 type. It is hazardous for irrigation.
Five groundwater samples are Na-Cl type. It suggesting the influence of sea water,
ancient saline groundwaters, or dissolution of halite (NaCl). Such water type creates
salinity both in irrigation and domestic uses (Raju, 2007). For irrigation purpose it is
very high in salinity hazard. In this area most serious threat to the groundwater is
intrusion of saline water to fresh water. While, four samples are Ca-HCO3type typical
occurrence of this facie in aquifer is shallow, fresh groundwater in recharge area. It is
suggesting irrigation return flow and anthropogenic activities
(Jeevanandamet.al.,2007). Such water type have temporary hardness (Raju,2007) and
three samples are Ca-Cl type. It is associated with the invasion of shallow, fresh
aquifers by sea water, less commonly form by dissolution of the very rare evaporate
mineral tachydrite (Cacl2). Its also have high salinity hazardous for irrigation.

Cations Anions
Fig. 9: Piper diagram for hydrochemicalfacies of groundwater (post monsoon, 2011) of Mirpur Sakro
Ground Water Chemistry of Pre-Monsoon Season
The quality of 28 groundwater samples collected from hand pump wells at
shallow depth (18- 50ft) from Shah Bandar, KharoChann, K.T.Bandar, Ghora Bari
and Mirpur Sakro have been analysed for various physico-chemical parameters
(Table 13). Classified as above based on EC and SAR (Gupta, 1994).
Shah Bandar and Keti Bandar Tehsil Pre Monsoon (2012)
Two groundwater samples were collected from Shah Bandar Tehsil in pre
monsoon season of 2011. The EC, TDS and pH values of groundwater samples are
(2.79 and 0.671), (1786 and 427) and (7.12 and 7.13) respectively (Table 30).
According to WHO (1984), TDS specification one sample belong to poor water
category while one is excellent. On the basis of EC and SAR classification, one
sample belong to alkali water category, while remaining one fall in good water
category.
Table 30.Physico-chemical analyses of groundwater samples from Shah Bandar and Keti Bandar
S. No
EC dS/m
TDS pH Anions Meq/l
CationsMeq
/l
Na/Cl
ratio
Ca/Mgrati
o
Cl/HCO3
Ratio
SAR
RSC
Water Typ
e
CO3
HCO3
Cl SO4 Ca+Mg
Na K
1 2.79 1786
7.12 - 7.2 26.0 2.5 3.3 42.1 0.35 1.619
0.65 3.61 23.17
0.6 NaCl
2 0.671
427 7.13 - 4.2 2.2 1.52 2.125
3.69 0.164
1.68 2.4 0.52 2.53 0.5 NaHCO3
1 2.5 1600
6.96 - 7.8 20.58
1.770
6.73 19.0 0.38 0.92 0.75 2.6 7.32 5.66

Ghora Bari Tehsil Pre Monsoon (2012)
Seven groundwater samples were collected from Ghora Bari Tehsil in pre-
monsoon season, 2011. The pH of groundwater samples ranges from 6.63 - 7.79
(Table 31) with an average of 7.38. Almost samples have pH value 7 indicating
alkaline nature of the samples. According to WHO (1984) TDS specification, three
groundwater samples (no. 2,4,6) belong to highest desirable and remaining all belong
to maximum permissible limits. While, Davis and De Weist (2007) TDS based
classification, indicate that out of six groundwater samples three samples (no. 2,4,6)
are desirable and remaining four (no. 1, 3,5) are only suitable for agricultural
purpose.
According to EC and SAR based classification by Gupta (1990), two
groundwater samples (2, 4,) from this area belong to good water category, as their EC
and SAR values are<2 (1.531, 1.063 dS/m) and <10 (5.76 to 2.05) respectively. While
one sample (3) belongs to saline water category (EC : 1.921 dS/m, SAR: 5.16). On the
other hand, two samples (1, 5) are highly saline, as their EC are >4 (10.05, 3.92 dS/m)
and SAR >10 (39.7, 25.17) respectively. In these samples, sodium, chloride and
sulphate contents are higher than total calcium plus magnesium contents. Only one
sample (6) belongs to alkali water type (EC 1.30 and SAR 34.0), which indicates
sever impact of sea water intrusion (Table 31).
Table 31Physico-chemical analyses of groundwater samples (pre monsoon, 2012)from Ghora Bari
S. No
EC dS/m
TDS
pH Anions Meq/l
CationsMeq/l
Na/Cl
ratio
Ca/Mgrati
o
Cl/HCO3rati
o
Na %
SAR
RSC
Water Type
CO3 HCO3
Cl SO4
Ca+Mg
Na K
1 5.14
3290
7.63
- 12.0
76.98
4.08
5.15
94 1.24
1.22
0.87
6.42
95 40.8
3.12 Nacl
2 1.152
737 7.40
- 8.4 5.69
0.958
2.705
95 0.63
16.70
0.59
0.68
75 4.65
2.99 NaH-CO3
3 1.598
1022
7.03
- 9.4 9.39
1.16
4.93
64 0.312
6.82
1.12
1.0 64 3.91
0.46 Nacl
4 0.882
564 7.0 - 4.6 3.18
1.45
2.905
61 0.212
19.18
1.41
0.69
61 7.0 1.21 NaH-CO3
5 2.73
1747
7.79
- 7.0 49.2
1.68
3.0 93 0.53
1.89
0.5 7.02
93 7.79
1 Nacl
6 1.182
756 7.70
- 8.6 3.49
1.54
1.6 85 0.57
24.35
0.6 0.41
85 7.70
5.4 NaH-CO3
1 1.677
1073
7.15
- 6.8 10.88
2.125
3.505
78 0.52
7.169
0.590
1.6 78 7.15
0.21 H-Cl
According to U.S salinity laboratory (1954) RSC based classification, it is
observed that two samples (no. 2,5) are probably safe, three sample (no. 3,4,6) have
RSC value in limit (1.25 - 2.5) are marginal suitable and only one sample (no. 1) have
RSC value greater than 2.5 not suitable for agricultural purpose (Table classification

wala). According to Wilcox (1955) sodium content based classification, one samples
(no. 4) belongs to good water category indicate that it is safe for irrigation, one
sample (no. 3) belong to poor water category, While remaining samples (no. 1,2,5,6)
belong to very poor water category and it is hazardous and indicating the saline water
intrusion. On the same content base classification Raju (2007), sodium content value
of two samples (no. 2, 3) is less than 60% indicate the suitability of groundwater for
irrigation and remaining all have higher value.
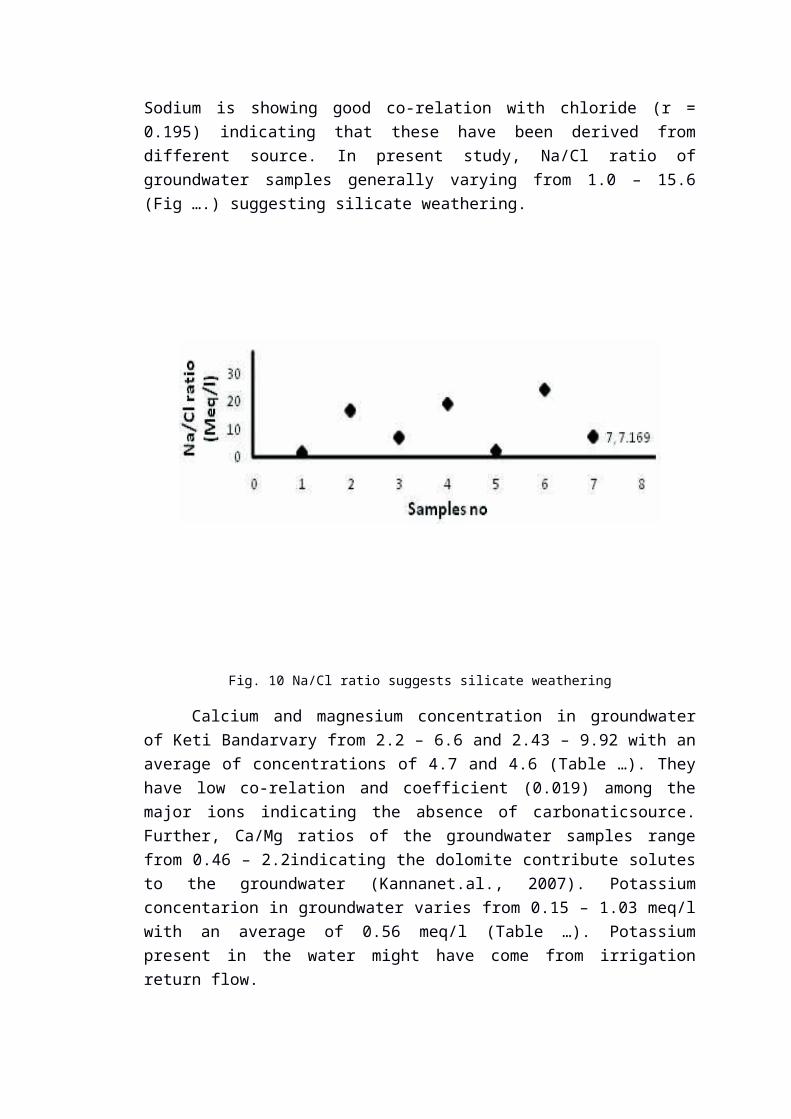
Cat ion chemistry of Keti Bandargroundwater samples indicating the
increasing of parameters like Na>Ca>Mg>K. Sodium is showing good co-relation
with chloride (r = 0.195) indicating that these have been derived from different
source. In present study, Na/Cl ratio of groundwater samples generally varying from
1.0 – 15.6 (Fig ….) suggesting silicate weathering.
Fig. 10 Na/Cl ratio suggests silicate weathering
Calcium and magnesium concentration in groundwater of Keti Bandarvary
from 2.2 – 6.6 and 2.43 – 9.92 with an average of concentrations of 4.7 and 4.6 (Table
…). They have low co-relation and coefficient (0.019) among the major ions
indicating the absence of carbonaticsource. Further, Ca/Mg ratios of the groundwater
samples range from 0.46 – 2.2indicating the dolomite contribute solutes to the
groundwater (Kannanet.al., 2007). Potassium concentarion in groundwater varies

from 0.15 – 1.03 meq/l with an average of 0.56 meq/l (Table …). Potassium present in
the water might have come from irrigation return flow.
The choloride- bicarbonate ratio is a good factor to identify saltwater
intrusion. Chloride is the dominant ion of sea water it is only available in small
quantities in groundwater (Ragunath, 1990). On the other hand, bicarbonate is the
dominant ion in groundwater whereas, its concentration in saltwater is very small.
According to (Ragunath, 1990) Cl/HCO3ratio = 2.8 is a threshold value for saltwater
intrusion. So, no sample have Cl/HCO3ratio greater than 2.8 indicating safe
groundwater from saline water intrusion.
Piper trilinear diagram (Fig.1) of Ghora Bari for geochemical classification
and hydrochemical processes of groundwater for post monsoon season indicates two
groundwater samples (no. 3, 5) are Na-Cl type. It suggesting the influence of sea
water, ancient saline groundwaters, or dissolution of halite (NaCl). Such water type
create salinity both in irrigation and domestic uses (Raju, 2007) For irrigation
purpose it is very high in salinity hazard . Two (no. 2, 6) are Na-HCO3 type have high
hazardous impact for irrigation, one sample is Ca-HCO3type typical occurrence of
this facie in aquifer is shallow, fresh groundwater in recharge area. It is suggesting
irrigation return flow and anthropogenic activities (Jeevanandamet.al., 2007). Such
water type have temporary hardness (Raju,2007). While, remaining one (no. 1) is Na-
SO4this is rare type, can result from mixing of ancient Na-rich groundwaters with
pyritr oxidation waters, also formed by intensive evaporation of waters which
havepreviously lost their Ca and HCO3.
Cations Anions

Fig. 11: Piper diagram for hydrochemicalfacies of groundwater of Ghora Bari (pre-monsoon)
MirpurSakro Tehsil Pre Monsoon (2012)
Eighteen groundwater samples were collected from Mirpur SakroTehsil in
post monsoon season, 2011. The pH of groundwater samples ranges from 6.77 - 7.58
(Table ….) with an average of 7.18. Mostly samples have pH value more than 7
indicating alkaline nature of the samples. According to WHO (1984) TDS
specification, 61% and 38% of groundwater samples belongs to highest desirable and
maximum permissible limits respectively. While, Davis and De Weist (2007) TDS
based classification, indicate that out of eighteen groundwater samples two (no. 2, 15)
are desirable, eight (no. 1, 5, 7, 8, 9, 12, 14, 18) are permissible and remaining are not
suitable for agricultural purpose.
SAR based classification by Gupta (1990), twelve
(1,2,3,5,7,8,9,10,11,12,14,15) samples belong to good water category, as their EC and
SAR values are <2 dS/m and <10 respectively. While, four samples (6, 13, 17, 18)
having variable EC and SAR fall in alkali water category. On the other hand, sample
(16) is saline water, as its EC is >2 ( 2.17dS/m) and SAR is <10 (8.0 ) and the
remaining sample (4) is high saline water with its EC (>4) 4.19 dS/m and SAR (>10)
21.36 respectively.
Most of the groundwater samples from this area are non – saline, only four
water samples are moderately to severe saline, as their EC and SAR are relatively
higher as compared to other samples. In all these samples sodium, chloride and
sulphate ions show positive correlation. It indicates the presence of sodium chloride
salt along with sodium sulphate salt in these four samples. High concentration of
sodium and chloride in these samples indicates saltwater intrusion. The increased
concentration and positive correlation of chloride and sulphate also suggests sea
water intrusion in the area (Table 18).
According to U.S salinity laboratory (1954) RSC based classification it is
observed that six samples (no. 1,2,5,6,8,14) are probably safe, two samples (no. 7,16)
are marginal suitable while, remaining sample (no. 9,10,11,12,13,17,18) have RSC
value greater than 2.5and they are not suitable even for agriculture (Table
classification wala).
According to Wilcox (1955) sodium content based classification, six samples
(no. 1,2,5,6,8,14) belongs to excellent water category indicate that it is probably safe
for irrigation, two samples (no. 7,16)) ) belongs to good and remaining (no.
9,10,11,12,13,17,18) belongs to poor water category. Good water category is safe for
irrigation but poor is hazardous and indicating the saline water intrusion. On the same
content base Raju (2007), sodium content value of all samples is less than 60%
indicate the suitability of groundwater for irrigation.
Cat ion chemistry of Mirpur Sakrogroundwater samples indicating the
increasing trend of parameters like Na>Ca>Mg>K. The sodium concentration in the
area ranges from 2.13 – 67.82 meq/l with an average concentration of 15.18 meq/l
(Table…). Sodium is not showing good co-relation with chloride (r = 0.097)
indicating that these have been derived from different source. In present study, Na/Cl
ratio of groundwater samples generally varying from 0.13 – 10.8, while only one
sample have very high Na/Cl ratio (374.6) (Fig ….). Na/Cl ratio of five groundwater
samples is equal to 1, indicating the dissolution of halite, While remaining all samples
have ratio greater than 1 indicating sililcateweathering suggesting silicate weathering
(Meyback, 1987). It is also well supported by high values of HCO3than sodium
(Kannana, 2007). In some samples HCO3have low value than sodium so, sodium
might have come from irrigation return flow and anthropogenic activity.
Fig. 12 Na/Cl ratio suggests silicate weathering .

Calcium and magnesium concentration of Mirpur Sakrogroundwater vary
from 2.4 – 9.6 and 1.0 – 8.3 meq/l with an average concentration of 4.45 and 2.9
meq/l respectively(Table 32).They have low co-relation and coefficient (0.115)
among the major ions indicating the absence of ubiquitous source of Ca and Mg
(Kannana,2007). Further, Ca/Mg ratios of the most of the groundwater samples range
from 0. 7 to 4.15 indicating the dolomite contribute solutes to the groundwater.
Potassium concentration in groundwater varies from 0.15 – 1.03 meq/l with an
average of 0.56 meq/l (Table 32). Potassium present in the water might have come
from irrigation return flow.
According to (Ragunath, 1990), Cl/HCO3ratio of all groundwater samplea is
less than threshold value (2.8) indiv=cating this area is safe from seawater intrusion.
Only two samples (no. 4, 7) have high Cl/HCO3ratio indicating saline water intrusion
and in same both samples Cl value is also high. The concentration of Clinidicate that
saltwater iintrusion and irrigation return flow might be responsible
(Luscznski&Swarzenski, 1996).
Table32Physico-chemical analyses of groundwater samples from Mirpur Sakro (pre monsoon, 2012)
S. No
EC dS/m
TD pH Anions Meq/l
CationsMeq/l
Na/Cl
ratio
Ca/Mgrati
o
Cl/HCO3rati
o
SAR
RSC
Water Typ
e
CO3
HCO3
Cl SO4
Ca+M
g
Na K
1 0.923
485 6.69
Nil 6.2 1.41
0.104
3.98
3.52
0.20
2.5 1.52
0.23
2.49
2.22
NaH-CO3
2 0.681
740
7.10
Nil 6.6 4.59
1.91
6.8 6.39
0.15
1.4 1.43
0.70
1.87
-0.2 NaH-CO3
3 1.70
1026
6.81
Nil 7.2 8.68
2.16
12.2
6.86
0.2 0.79
1.44
1.21
2.77
-5 Ca-Cl
4 4.19
1766
7.16
Nil 8.0 1.80
3.75
11.2
32.6
0.52
18.1
0.6 0.23
13.7
-3.2 NaH-CO3
5 0.911
570 7.24
Nil 7.8 3.186
1.43
5.83
4.34
0.23
1.36
1.75
0.41
1.0 1.97
NaH-CO3
6 1.745
972
7.58
Nil 9.8 5.38
2.13
5.03
14.6
0.148
2.71
1.65
0.55
9.20
4.77
NaH-CO3
7 0.907
497
7.19
Nil 6.4 2.11
0.91
4.18
4.69
0.133
2.22
1.64
0.33
3.2 2.22
NaH-CO3
8 0.814
451
7.30
Nil 4.0 2.19
1.16
4.83
3.60
0.12
1.64
0.94
0.55
2.31
-0.83
NaH-CO3
9 0.946
571
7.10
Nil 8.8 2.0 0.79
6.6 4.13
0.13
2.07
1.0 0.227
2.27
2.2 NaH-CO

310 0.8
442054
6.95
Nil 7.0 26.0
6.14
10.7
60.4
0.27
2.32
1.0 3.71
26.11
-3.7 Na-Cl
11 1.607
888
7.32
Nil 9.0 18.61
2.33
9.8 18.86
0.28
1.01
1.04
2.07
8.52
-0.8 Na-Cl
12 1.132
1465
7.11
Nil 5.6 18.61
2.3 9.8 18.8
0.28
1.01
1.04
3.32
8.4 -4.2 Na-Cl
13 2.670
1388
7.31
Nil 10.8
11.19
3.20
4.41
5.86
0.10
0.52
0.83
1.04
3.27
1.19
Na-Cl
14 1.4 708
6.97
Nil 7.6 3.60
1.58
6.41
5.86
0.10
1.63
1.66
0.47
3.27
1.19
NaH-CO3
15 0.686
440
7.16
Nil 5.4 18.8
0.66
5.38
2.91
0.135
0.16
2.41
3.48
1.77
0.02
Ca-Cl
16 2.17
1155
7.14
Nil 11.0
0.99
1.958
5.8 16.17
0.266
16.33
0.93
0.09
9.49
5.2 NaH-CO3
17 3.130
1542
6.92
Nil 10.0
16.18
3.25
10.85
19.0
0.51
1.17
0.74
1.62
8.15
-0.85
Na-Cl
18 1.242
1027
6.92
Nil 11.8
8.0 1.18
8.51
9.47
0.246
1.18
1.18
0.68
4.59
3.29
NaH-CO3
Piper trilinear diagram (Fig.1) of Mirpur Sakrofor geochemical classification
and hydrochemical processes of groundwater for post monsoon season indicates that
six groundwater samples are waters are Na-HCO3 type. It is hazardous for irrigation.
Five groundwater samples are Na-Cl type. It suggesting the influence of sea water,
ancient saline groundwaters, or dissolution of halite (NaCl). Such water type creates
salinity both in irrigation and domestic uses (Raju, 2007). For irrigation purpose it is
very high in salinity hazard. In this area most serious threat to the groundwater is
intrusion of saline water to fresh water. While, four samples are Ca-HCO3type typical
occurrence of this facie in aquifer is shallow, fresh groundwater in recharge area. It is
suggesting irrigation return flow and anthropogenic activities (Jeevanandamet.al.,
2007). Such water type have temporary hardness (Raju,2007) and three samples are
Ca-Cl type. It is associated with the invasion of shallow, fresh aquifers by sea water,
less commonly form by dissolution of the very rare evaporate mineral tachydrite
(Cacl2). Its also have high salinity hazardous for irrigation.
Cations Anions
Fig. 13: Piper diagram for hydrochemicalfacies of groundwater of Mirpur Sakro
PROBLEMS IDENTIFIED

Excessive amount of sodium were found in irrigation which promote soil
dispersion and structural breakdown.
Due to excessive sodium water supply to the crop is difficult and production is
reducing.
Excess soil salinity in the stud area causes poor and spotty stands of crops,
uneven and stunted growth and poor yields, the extent depending on the
degree of salinity.
Same nala’s were identified in the study area, mixed with flood water and
somewhere with sea water which increasing soil salinity.
Irrigation water is available only for four months due to which area is
suffering from shortage of irrigation water.
Land was affected by flood water because water was kept staying for four
months, which lead caused waterlogging and leaching of subsurface salt to the
surface.
Because of poor drainage system flood water remains stagnant and precipitate
both black and white salts on the soil surface by evaporation.
Because of fuderal system canal water is being stolen by power full people.
When they fulfill water requirement to their fields then leave it.
In some fields water evaporated naturally, because owner of the adjacent
agricultural fields did not allow water to drain same nala.
Some areas were also affected by tidal waves.
To mitigate the menace of rising groundwater and the associated problem of
waterlogging and salinity, a network of drainage canal was constructed with in
the Indus Basin to drain groundwater directly to the Arabian sea. The drainage
system has been less effective dur to low gradient of flat topography and has
in fact resulted in the intrusion of seawater to about 80 km upstream (Panhwar,
1999).
The increase in salinity due to depleting of fresh water contribution by the
Indus River has reduced the suitability of the delta for the cultivation of red
rice, the production of the exoctic fruit, and raising of livestock (Inam.et.al.,
2007).
The mangrove ecosystem is being degraded, and the mangroves are now
virtually monospecific and comparatively stunted with losses of about 2% year
-1 (Inam.et.al. 2007).Comparison Between Post (2011) and Pre-Monsoon (2012) Groundwater Water
Samples of Shah Bandar Tehsil
Five groundwater samples were collected from Shah Bandar Tehsil in post
monsoon and two in pre-monsoon, Based on analytical results, the chemical indices

derived from hydro geochemical parameters of post and pre monsoon groundwater
samples of shah Bandar are presented in (Table 17). Piper rectangular diagram for
geochemical classification and hydro chemical processes of groundwater for both
seasons indicates that most of water is Na-Cl type.
Total dissolved solids of Shah Bandar groundwater ranges from 445mg/l to
2598mg/l with a mean of 1576 mg/l and from 429 to 1786 mg/l with a mean of 1107
mg/l for post monsoon and pre monsoon respectively. From the analytical results, post
monsoon groundwater has higher TDS value as compare to pre monsoon. The
increase of TDS in post monsoon seasons is on the higher side than the pre monsoon
season due to mixing of surface pollutants during the infiltration and percolation of
rainwater (N. Janardhana 2007). Davis and De Wiest (1966) TDS based classification,
it is observed that out of 5 groundwater samples of post monsoon 1 is desirable for
drinking, 2 are permissible for drinking. While, remaining 2 samples and 2 samples of
pre monsoon are not desirable and permissible for drinking but suitable for
agricultural purpose. The salinity (with respect to total dissolved solids) of
groundwater affects the growth of plants directly and also affects soil structure,
permeability and aeration, which indirectly affect plant growth (Mohan, Singh,
Tripathi and Choudhary, 2000).
The Electrical Conductivity (EC) ranges from 0.696 to 4.06dS/m with a mean
of 2.650 dS/m and 0.671 to 2.79 dS/m with a mean of 1.730 dS/m for post monsoon
and pre monsoon respectively. Gupta (1990) classified ground waters on the basis of
EC and SAR. According to this classification, sample no 1, 4 and 2 are belong to good
water category, sample no. 2 and 1 are belong alkali water category, sample no 3 and
5 belong to high saline water category for post monsoon and pre monsoon
respectively.
Table 33.Physico-chemical analyses of groundwater samples from Shah Bandar in post and pre monsoon
SNo.
Grid
N
E
l
e
T
o
t
p
H
P
e
r
S
o
d
R
e
sPo
Pr
Po
Pr
Po
Pr
Po
Pr
Po
Pr
Po
Pr
Po
Pr
1 (5
-0.
54
7.48
2. -2 (5
-3.
23 7.
63 18 -3 (
5(5 4. 2.
25 7. 7.
84 93 23 23 - 0.4 (
5(5 0. 0.
44 7. 7.
38 64 2. 2. - -5 (
5-
4.25 7.
90 30 2.
SNo.
Water
H
C
C
l
S
O
C
a
N
a
K
Po
Pr
Po
Pr
Po
Pr
Po
Pr
Po
Pr
Po
Pr
Po
Pr
1 C
-3. 2. 1. 4. 48 3.

2Na
-11 20 4. 18 63 303
Na 6. 7. 30 26 4. 2. 9. 3. 84 93 51 0.4Ca 4. 4. 1. 2. 0. 1. 5. 2. 38 64 3. 0.5Na 7. 28 6. 5. 90 50
Sodium concentration is important in classifying irrigation water because
sodium reacts with soil to reduce its permeability. Sodium content is usually
expressed in terms of percent sodium or soluble- sodium percent Na%. As per the
Indian standards, max.of 60% sodium is permissible for irrigation water. Sample no 1
and 4 of post monsoon have sodium content less than 60% while, remaining all
samples of post monsoon have high sodium content. Two groundwater samples from
same grid (56, 55) have high sodium content in pre monsoon as compare to post
monsoon season.
As per the Richards (1954) SAR based classification, two samples (1,4) and
1(2) of post monsoon and pre monsoon respectively are in excellent category, because
none of the sample exceed the value SAR=10 (Table ). While, three samples (2, 3, 5)
and 1(1) of post and pre monsoon respectively are in poor condition. From the
residual sodium carbonate (RSC) values of the Shah Bandar area, it is observed that
out of 5 post-monsoon water samples, 1 is safe, 2 are marginal and 2 are not suitable
for irrigation. But out of 2 pre-monsoon water samples, both are safe for irrigation.
From these analyses, it is found that sample no 3 in post monsoon season was rich in
carbonate and not suitable for irrigation but in pre-monsoon it is suitable irrigation.
Comparison Between Post (2011) and Pre-Monsoon (2012) Groundwater Water Samples of K.T.Bandar Tehsil
Three groundwater samples were collected from K.T Bandar Tehsil in post
monsoon and only one in pre-monsoon from same grid 49, Based on analytical
results, the chemical indices derived from hydro geochemical parameters of post and
pre monsoon groundwater samples of K.T Bandarare presented in (Table 18). Piper
rectangular diagram for geochemical classification and hydro chemical processes of
groundwater for both seasons indicates that most of water is Na-Cl type. It is
hazardous for irrigation purpose. While, one sample of 49 grid was Ca-SO4 type in
post monsoon and in pre monsoon it is converted into Na-Cl water type. It indicates
saline water intrusion.
Total dissolved solids (TDS) of K.T Bandargroundwater ranges from 646mg/l
to 2394mg/l with a mean of 1770 mg/l and 1600 for post and pre-mon soon
respectively. From the analytical results, post monsoon groundwater has higher TDS
value. Pre monsoonal groundwater has higher TDS values (1600 mg/l) as compare to
its post monsoon samples value (646 mg/l). Davis and De Wiest (1966), TDS based

groundwater classification it is observed that out of 3 groundwater samples of post
monsoon one (3) is permissible for drinking, while remaining two samples (1, 2 and
one samples of pre-monsoon are suitable for agriculture purpose.
Table 34.Physico-chemical analyses of groundwater samples from K.T.Bandarin post and pre monsoon
SNo.
Grid
N
E
l
e
T
o
t
p
H
P
e
r
S
o
d
R
e
sPo
Pr
Po
Pr
Po
Pr
Po
Pr
Po
Pr
Po
Pr
Po
Pr
1 (5
-0.
54
7.48
2. -2 (5
-3.
23 7.
63 18 -3 (
4(4 4. 2.
25 7. 7.
84 93 23 23 - 0.
SNo.
Water
H
C
C
l
S
O
C
a
N
a
K
Po
Pr
Po
Pr
Po
Pr
Po
Pr
Po
Pr
Po
Pr
Po
Pr
1 Na
-3. 2. 1. 4. 89 3.2 N
a-
11 20 4. 18 74 303 Ca 6. 7. 30 26 4. 2. 9. 3. 42 74 51 0.
The Electrical Conductivity (EC) ranges from 1.009 to 3.74 dS/m with a
mean of 2.77 dS/m and only one sample having EC value 2.5 dS/m of post monsoon
and pre-monsoon respectively. According to Gupta (1990) EC and SAR based
classification, sample no 3 of post monsoon belong to good water category and
sample no 1 and 2 belong to variable category it shows that it is alkali water. While,
one sample of pre-moonsoon belong to saline water category.According to Wilcox
(1955) sodium content based classification, it is observed that only one sample of post
monsoon groundwater is poor while remaining 2 sample and one of pre monsoon are very
poor because their sodium content is higher than 60% and as well as higher than 50-70%
limit range.
As per the Richards (1954) SAR based classification, one each sample (3) of
post monsoon and pre monsoon belong to excellent groundwater category because
their SAR values are <10 and it is safe for agricultural. While sample no 1 and 2 of
post monsoon have SAR >10 this limit is not suitable for agriculture. From the US
salinity laboratory (1954) the residual sodium carbonate (RSC) based classification, it
is observed that out 3 post-monsoon water samples, 2 samples (1,3) are probably safe
and 1 sample (2) is unsuitable for irrigation. While remaining 1 sample (2) and one
sample of pre-monsoon are unsuitable for irrigation.
Comparison Between Post (2011) and Pre-Monsoon (2012) Groundwater Water Samples of Ghora Bari Tehsil

Six and seven groundwater samples were collected from Ghora BariTehsil
during post and pre-monsoon respectively.Based on analytical results, the chemical
indices derived from hydro geochemical parameters of post and pre monsoon
groundwater samples of Ghora Bariare presented in (Table 35). Piper rectangular
diagram for geochemical classification and hydro chemical processes of groundwater
for both seasons indicates that most of water samples are NaH-CO3type.
Total dissolved solids of Ghora Barigroundwater ranges from 680mg/l to
6432mg/l with a mean of 2110 mg/l and from 564 to 3290 mg/l with a mean of
1326mg/l for post monsoon and pre monsoon respectively. From the analytical
results, post monsoon groundwater has higher TDS value as compare to pre monsoon.
The increase of TDS in post monsoon seasons is on the higher side than the pre
monsoon season due to mixing of surface pollutants during the infiltration and
percolation of rainwater (N. Janardhana 2007). According to Davis and De Wiest
(1966), it is observed that out of 6 groundwater samples of post monsoon 3 (2,4,6) are
permissible for drinking and remaining 3 (1,3,5 ) are suitable for agriculture purpose.
While, on the other hand out of 7 groundwater samples of pre-monsoon 3 (2,4,6) are
permissible for drinking and remaining 4 (1,3,5,7) are suitable for agriculture.
The Electrical Conductivity (EC) ranges from 1.063 to 10.05 dS/m with a
mean of 3.3 dS/m and 0.882 to 5.14 dS/m with a mean of 2.05 dS/m for post monsoon
and pre monsoon respectively. Gupta (1990) classified ground waters on the basis of
EC and SAR. According to this classification, three samples (2,3,4) and five
(2,3,4,6,7) belongs to good water category, two samples (1,5) and (1), while one each
sample (6) and (5) belongs to alkali water category for post monsoon and pre
monsoon respectively.
Table 35.Physico-chemical analyses of groundwater samples from Ghora Bariin post and pre monsoon
SNo.
Grid
N
E
l
e
T
o
t
p
H
P
e
r
S
o
d
R
e
sPo
Pr
Po
Pr
Po
Pr
Po
Pr
Po
Pr
Po
Pr
Po
Pr
1 (3
(3
10 5.54
6. 7.48
39 40 - 3.2 (3
(3 1. 1.
23 7. 7.
63 5. 4. 1. 2.3 (
3(3 1. 1.
25 6. 7.
84 93 5. 3. - -4 (
4(4 1. 0.
44 6. 7.
38 64 2. 7. - -5 (
4(4 3. 2.
25 7. 7.
90 25 7. - 16 (
4(4 1. 1. 7. 7. 34 7. 2. 5.7 (4 1. 7. 7. -
SNo.
Water
H
C
C
l
S
O
C
a
N
a
K
Po
Pr
Po
Pr
Po
Pr
Po
Pr
Po
Pr
Po
Pr
Po
Pr
1Na N 11 12 9. 76 10 4. 14 5. 88 94 1. 1.2Na Na 8. 8. 6. 5. 1. 0. 7. 2. 62 95 1. 0.

3Na N 8 9. 10 9. 2. 1. 9. 4. 55 64 0. 0.4Ca Na 5. 4. 3. 3. 1. 1. 8. 2. 35 61 0. 0.5Na N 7. 7. 28 49 2. 1. 8. 3. 86 93 1. 0.6Na Na 7. 8. 3. 3. 2. 1. 5. 1. 92 85 6. 0.7
H- 6. 10 2. 3. 78 0.
On the basis of sodium content of the groundwater, one each sample (4) and
(3) of post-monsoon belongs to good and poor water category respectively, While
remaining all samples of both seasons are very poor because, their sodium content
values are exceeding to 60% which is hazardous for agriculture. As per US salinity
laboratory (1954), the residual sodium carbonate (RSC) based classification, it is
observed that out 3 post-monsoon water samples, 2 samples (1,3) are probably safe
and 1 sample (2) is unsuitable for irrigation. While remaining 1 sample (2) and one
sample of pre-monsoon are unsuitable for irrigation.
Comparison Between Post (2011) and Pre-Monsoon (2012) Groundwater Water Samples of MirpurSakro Tehsil
Eighteen of each groundwater samples were collected from Mirpur
SakroTehsil in post monsoon and two in pre-monsoon season, Based on analytical
results, the chemical indices derived from hydro geochemical parameters of post and
pre monsoon groundwater samples of Mirpur Sakro are presented in (Table 20). Piper
rectangular diagram for geochemical classification and hydro chemical processes of
groundwater for both seasons indicates that most of water are of post monsoon are
Na-HCO3 and Na-Cl type and few are Ca-HCO3 and Ca-Cl type. When we compare
this water type to the pre monsoon groundwater sample type it indicate most of the
groundwater sample (11) are Na-HCO3 in nature and same in quantity (5) are Na-Cl
in nature while , two are Ca-Cl type. It indicates the replacement of Cl ions by HCO3
ions and Na ions by Ca ions.
Total dissolved solids of Mirpur Sakrogroundwater ranges from 436mg/l to
2003mg/l with a mean of ----mg/l and from 451 to 1766 mg/l with a mean of …… for
post monsoon and pre monsoon respectively. From the analytical results, post
monsoon groundwater has higher TDS value as compare to pre monsoon. The
increase of TDS in post monsoon seasons is on the higher side than the pre monsoon
season due to mixing of surface pollutants during the infiltration and percolation of
rainwater (N. Janardhana 2007). Davis and De Wiest (1966) TDS based classification,
it is observed that out of 18 groundwater samples of post monsoon 2 (1,15) are
desirable for drinking, 7 (1,4,7,8,9,14,18) are permissible for drinking. While,
remaining are suitable for agriculture. On the other hand out of 18 groundwater

sample of pre monsoon 4 (1,7,8,15) are desirable for drinking, 6 (2,5,6,9,11,14,) are
permissible for drinking purpose while remaining are good for irrigation.
The Electrical Conductivity (EC) ranges from 0.696 to 4.06dS/m with a mean
of 2.650 dS/m and 0.671 to 2.79 dS/m with a mean of 1.730 dS/m for post monsoon
and pre monsoon respectively. Gupta (1990) classified ground waters on the basis of
EC and SAR. According to this classification, sample no 1, 4 and 2 are belong to good
water category, sample no. 2 and 1 are belong alkali water category, sample no 3 and
5 belong to high saline water category for post monsoon and pre monsoon
respectively.
Table 36.Physico-chemical analyses of groundwater samples from MirpurSakroin post and pre monsoon
SNo.
Grid
N
E
l
e
T
o
t
p
H
P
e
r
S
o
d
R
e
sPo
Pr
Po
Pr
Po
Pr
Po
Pr
Po
Pr
Po
Pr
Po
Pr
114 14 0. 0.6
59
48 7. 6.6
39
48 2. 2.4 - 2.22
13 13 0. 1.143
74 7. 7.1
50
49 2. 1.8 0. -3
11 11 1. 1.610
10 6. 6.8
41 36 3. 2.7 - -54
3 3 4. 2.726
17 7. 7.1
79 60 21 13. - -5
4 4 0. 0.858
57 7. 7.2
40
44 2. 1.0 - 1.96
20 20 1. 1.511
97 7. 7.5
91
75 37 9.2 0. 4.77
19 19 0. 0.758
49 7. 7.1
55
54 3. 3.2 1. 2.28
17 17 0. 0.752
45 7. 7.3
40
43 1. 2.3 - -9
24 24 0. 0.860
57 6. 7.1
36
39 2. 2.2 - 2.21
0 26 26 0. 3.254
20 7. 6.9
13
85 1. 26. - -1
1 27 27 1. 1.310
88 7. 7.3
71
66 7. 8.5 - -1
2 35 35 1. 2.272
14 7. 7.1
32
66 2 8.4 - -1
3 34 34 2. 2.117
13 7. 7.3
88
57 22 3.2 4. 1.11
4 33 33 1. 1.189
70 6. 6.9
55
48 4. 3.2 - 1.11
5 39 39 0. 0.643
44 7. 7.1
29
36 1. 1.7 - 0.01
6 28 28 2. 1.813
11 7. 7.1
67
74 8 9.4 1. 5.21
7 38 38 3. 2.420
15 7. 6.9
75
64 15 8.1 - -1
8 40 40 1. 1.679
1027 7. 6.9
40
53 10 4.5 - 3.2
S. No.
Water
H
C
C
l
S
O
C
a
N
a
K
Po
Pr
Po
Pr
Po
Pr
Po
Pr
Po
Pr
Po
Pr
Po
Pr
1Na Na 6 6. 1. 1. 2. 0. 6. 3. 3. 3. 0. 0.
2Na Na 4. 6. 1. 4. 1. 1. 3. 6. 3. 6. 0. 0.3Ca Ca 5. 7. 8. 8. 3. 2. 12 12 8. 6. 0. 0.4Na Na 8. 8. 26 1. 8. 3. 15 11 58 32 1. 0.5Ca Na 5. 7. 2. 3. 1. 1. 6. 5. 3. 4. 0. 0.6Na Na 7. 9. 0. 5. 4. 2. 6. 5. 67 14 0. 0.7Na Na 6 6. 35 2. 1. 0. 4. 4. 4. 4. 0. 0.8Ca Na 4. 4. 2. 2. 1. 1. 5. 4. 3. 3. 0. 0.9Ca Na 4. 8. 3. 2. 1. 0. 7. 6. 3. 4. 0. 0.1
0 Ca N 4 7. 2. 26 1. 6. 23 10 3. 60 0. 0.11 Na N 8. 9. 7. 18 0. 2. 5. 9. 12 18 0. 0.12 Na N 5. 5. 0. 18 2. 2. 9. 9. 4. 18 0. 0.13 Na N 9. 10 12 11 5. 3. 5. 4. 35 5. 0. 0.14 Na Na 6. 7. 4. 3. 3. 1. 7. 6. 9. 5. 0. 0.15 Ca Ca 4 5. 1. 18 1. 0. 5. 5. 2. 2. 0. 0.16 Na Na 9. 11 8. 0. 3. 1. 7. 5. 15 16 0. 0.17 Na N 8. 10 17 16 5. 3. 12 10 37 19 1. 0.18 Na
Na 5 11 4. 8. 2 1. 7. 8. 5. 9. 0. 0.

Sodium concentration is important in classifying irrigation water because
sodium reacts with soil to reduce its permeability. Sodium content is usually
expressed in terms of percent sodium or soluble- sodium percent Na%. As per the
Indian standards, max.of 60% sodium is permissible for irrigation water. Sample no 1
and 4 of post monsoon have sodium content less than 60% while, remaining all
samples of post monsoon have high sodium content. Two groundwater samples from
same grid (56, 55) have high sodium content in pre monsoon as compare to post
monsoon season.
Cations Anions
Fig. 14: Piper diagram for hydrochemicalfacies of groundwater of Mir purSakro


![Seasonal Diversity and Status of Butterfly Fauna in …...pre-monsoon season and 44 species 32 genera during -monsoon season respectively [10,11]. But little work did in the district](https://img.dokumen.tips/doc/110x75/5e9528eb7694ba7fb657487f/seasonal-diversity-and-status-of-butterfly-fauna-in-pre-monsoon-season-and-44.jpg)


