Embed Size (px)
Citation preview
13th World Conference on Earthquake Engineering Vancouver, B.C., Canada
August 1-6, 2004 Paper No. 1510
GROUND DEFORMATIONS IN ADAPAZARI DURING 1999 KOCAELI EARTHQUAKE
Ayfer ERKEN1, Zulkuf KAYA2 and Ahmet ERDEM 3
SUMMARY The 17 August 1999 Kocaeli earthquake caused great destruction to buildings, bridges and other facilities. One of the most interesting sites by the ground fissures as a result of liquefaction and bearing capacity failure was the city of Adapazari. The liquefaction phenomenon in the forms of sand boils, lateral spreads, tilted and settlements of buildings and ground settlement were observed in the city. Shortly after the earthquake, an extensive field investigation in the site, including bore holes, in situ tests and laboratory tests was conducted. The in situ and laboratory tests along with the ground performance form the basis of the present study. In this paper 6 cases of ground performance in Adapazari are studied. The analysis of the potential of liquefaction is performed using SPT data. The results of analyses indicate that the great part of field observations of ground performance in the city can be related to both soil conditions and the location of the faults.
INTRODUCTION The last strong earthquake, namely Kocaeli, has been occurred on Aug 17, 1999 in the west part of Turkey. The magnitude of The Kocaeli earthquake was Mw=7.4 and occurred at a depth of about 15 km on North Anatolian Fault zone discovered by Ketin [1]. Right lateral strike slip fault produced an extensive surface rupture over a distance of 126 km, accompanied by the earthquake. The produced Sakarya fault segment, approximately 26 km in length, transferred the Sakarya Basin from Sapanca lake to the west of the town of Akyazi. The right-lateral slip of rupture reached 5.0 m near Arifiye and 4.5 m at a gas station located on the motorway. It gradually decreased less than 1.0 m to the east of the segment [2]. The motion produced secondary normal faults on the hilly side of the Sakarya basin extending from the village of Meseli to the Serdivan district [3]. Another surface rupture, as a secondary normal fault with vertical offset up to 40 cm, was produced in the city of Adapazari [4]. The most affected city from the earthquake was Adapazari that was located on the alluvial soil layers in the Sakarya basin. Soil layers lying in the basin have been deposited by Sakarya River and Cark Stream. The thickness of the alluvial deposits reaches around 1100 m below the center of the city of Adapazari [5]. Excessive ground deformation has been developed in the region due to local soil condition. Earthquakes 1 Assoc.Prof., Istanbul Technical University, 34469 Maslak, Istanbul, Turkey. E-mail:[email protected] 2 Graduate Student, Istanbul Technical University, 34469 Maslak, Istanbul, Turkey. E-mail:[email protected] 3 Civil Engineer, Adapazari, Turkey
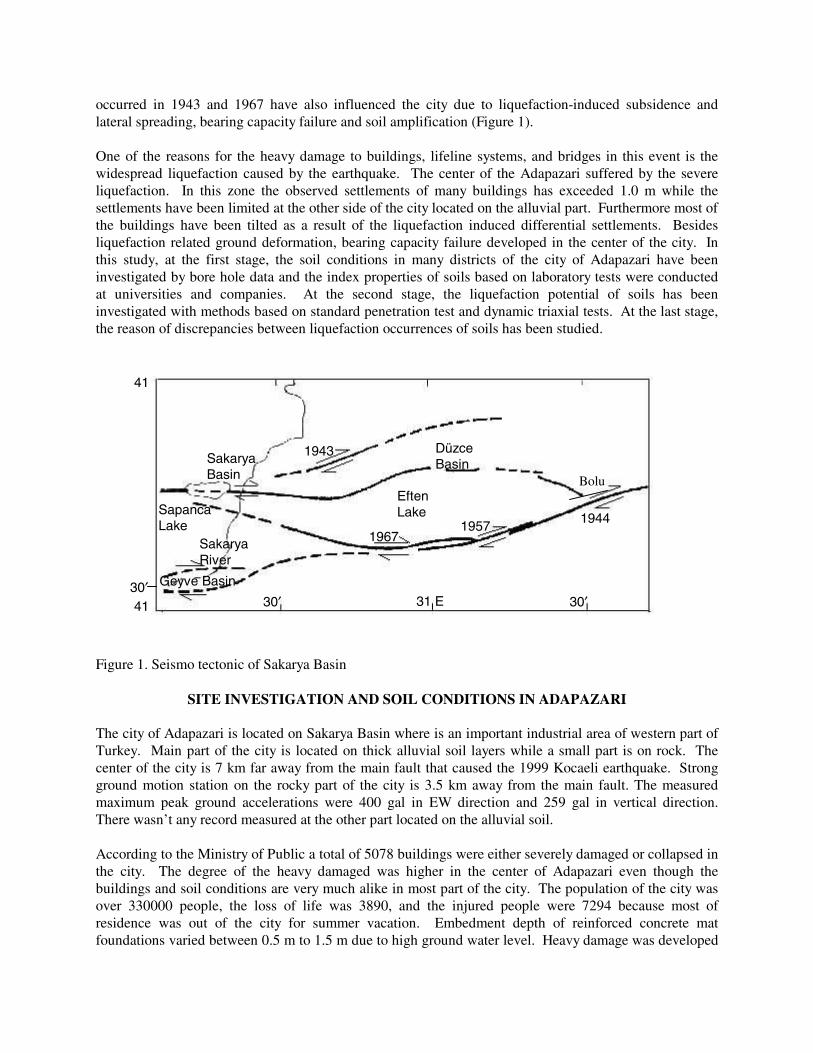
occurred in 1943 and 1967 have also influenced the city due to liquefaction-induced subsidence and lateral spreading, bearing capacity failure and soil amplification (Figure 1). One of the reasons for the heavy damage to buildings, lifeline systems, and bridges in this event is the widespread liquefaction caused by the earthquake. The center of the Adapazari suffered by the severe liquefaction. In this zone the observed settlements of many buildings has exceeded 1.0 m while the settlements have been limited at the other side of the city located on the alluvial part. Furthermore most of the buildings have been tilted as a result of the liquefaction induced differential settlements. Besides liquefaction related ground deformation, bearing capacity failure developed in the center of the city. In this study, at the first stage, the soil conditions in many districts of the city of Adapazari have been investigated by bore hole data and the index properties of soils based on laboratory tests were conducted at universities and companies. At the second stage, the liquefaction potential of soils has been investigated with methods based on standard penetration test and dynamic triaxial tests. At the last stage, the reason of discrepancies between liquefaction occurrences of soils has been studied.
Figure 1. Seismo tectonic of Sakarya Basin
SITE INVESTIGATION AND SOIL CONDITIONS IN ADAPAZARI The city of Adapazari is located on Sakarya Basin where is an important industrial area of western part of Turkey. Main part of the city is located on thick alluvial soil layers while a small part is on rock. The center of the city is 7 km far away from the main fault that caused the 1999 Kocaeli earthquake. Strong ground motion station on the rocky part of the city is 3.5 km away from the main fault. The measured maximum peak ground accelerations were 400 gal in EW direction and 259 gal in vertical direction. There wasn’t any record measured at the other part located on the alluvial soil. According to the Ministry of Public a total of 5078 buildings were either severely damaged or collapsed in the city. The degree of the heavy damaged was higher in the center of Adapazari even though the buildings and soil conditions are very much alike in most part of the city. The population of the city was over 330000 people, the loss of life was 3890, and the injured people were 7294 because most of residence was out of the city for summer vacation. Embedment depth of reinforced concrete mat foundations varied between 0.5 m to 1.5 m due to high ground water level. Heavy damage was developed
1943
Eften Lake
Bolu
Sapanca Lake
Sakarya River
Geyve Basin
1957 1967
30′ 31 E 30′ 30′ 41
41
Düzce Basin Sakarya
Basin
1944

on 3 to 5 story reinforced concrete buildings in the densely populated downtown area. Poor quality 1 to 2 timber/brick buildings, located on the same area, were suffered from deep shear wall cracks. In the frame of this study, 14 soil borings to the depth of 30.0 m and a total of 10 Cone Penetration tests were completed in Adapazari to study the soil condition and to obtain undisturbed soil samples. In addition, more than 1000 bore hole data which were drilled in site after the earthquake, extending from the residential area to the main fault, were collected with the laboratory test results. At the second step, liquefaction induced ground deformations and bearing capacity failure due to the softening of clayey and plastic silt soils were determined at almost each bore hole location. According to the outcomes of the investigation in-situ and bore holes, the most of the city is located on alluvial soils carried by Sakarya River and Cark Stream, and were redistributed by flood. The surficial soil deposit has a heterogeneous structure of loose sandy silt-silty sand, dense gravel-sand and clay with wide range of plasticity. The thickness of the upper transported soil layers is over 20.0 m in depth [6].
GROUND FAILURE DUE TO LIQUEFACTION Adapazari is the mostly affected city from liquefaction induced ground failure during 1999 Kocaeli earthquake. Following the earthquake, deep cracks, excessive settlement and lateral displacement from liquefaction and bearing capacity failure from softening of soils have been observed in the city. Some buildings sank, settled and tilted due to liquefaction while some of them collapsed. Cracks on pavement in the city and highway, limited sand volcanoes and ground cracks have been observed. Dimensions of liquefaction are found very dependent on site characteristics. In this paper, detailed subsurface soil conditions at selected sites are presented together with the ground performance either with or without ground failure. Figure 2 presents the locations of selected sites. Six different sites have been considered to compare liquefaction potential of soil strata. Tigcilar Tigcilar district located at the downtown of the city was the mostly affected area from severe liquefaction and bearing capacity failure. In this area, the thickness of alluvial soil deposit is around 1100 m [2]. Borehole SK4 is located on the foundation area of a fell down building in Tigcilar district. In this location, the 4 story reinforced concrete frame building was fallen down and the surrounded buildings were tilted settled and laterally moved around 1.0 m (Figure 3). Soil profile is consisted of mainly loose sandy silts with more than 55% fines and silty sands with less than 40% fines (Fig.4) which can be a taken as a characteristic soil cross section in Tigcilar. Figure 4 presents corrected standard penetration blow counts (N1)60 with dark circles and uncorrected SPT values (N30) with open circles. SPT blow counts (N1)60 is around 10. The surficial silty soil layer is non plastic. Soils from 4.0 m to10.0 m have liquid limit, LL in the range of 27 to 36 and natural water content, w, in excess of 0.9LL. Figure 5 illustrates the shear wave velocity along the soil cross section. Shear wave velocity has been calculated by three methods developed by Ohta et al. [7], Seed et al. [8] and Iyisan [9]. The results obtained from the methods are consistent with each other and also illustrate the existence of very heterogeneous soil stratification with alternating layers of silts and sands.

Figure 2. The map of Adapazari
Organize
Hanlılar
Toyota
Serdivan
Tiğcılar
Cumhuriyet
Maltepe
Istiklal Şeker
Semerciler
Yenidoğan Yenigün
N
Istanbul
Ankara
: Borehole
Istanbul
Ankara
Scale : 1/ 50 000
Main Fault
Ozanlar
Tekeler
Sakarya
Yağcılar Orta
Karaosman
Erenler
Güneşler
Sakarya River
Adapazari Segment
+ _

Figure 3. Tilted building in Tigcilar
Figure 4. Soil condition of the tilted building
4
8
12
16
20
24
28
32
0 10 20 30 40 50 N, SPT Value SK4
Dep
th (
m)
Silt
Silty Sand
Silty Sand
Clay
Sandy Silt
Silt
Clay
Silt
GWL0
4
8
12
16
20
24
28
32
0 20 40 60 80 100
Dep
th (
m)
PLLLwFC

Figure 5. Shear wave velocity distribution at SK4-Tigcilar Cumhuriyet The district of Cumhuriyet is also located at the center of the city. Liquefaction related ground failure and bearing capacity failure were also developed at the some parts of district overlying silt, sand and clay layers. Figure 6 illustrates the foundation-soil cross section of a tilted reinforced concrete frame building as a result of liquefaction and bearing capacity failure. The surficial soil layer is a soft silty clay overlying plastic silt and silty sand layers. Plasticity index of top layer is 20. Soils from 1.5 m to 9.5 m have liquid limits, LL, in the range of 45 to 65 and natural water content, w, in excess of 0.9LL. Sandy soils from 9.5 to 13.0 m have fines in the range of 6% to 12%. Erenler Some parts of Erenler are located on the loose low plastic silt layers. During the main shock dimension of liquefaction, based on the site characteristics, was limited compared to that observed in Tigcilar. Figure 7 presents the typical soil cross section from the silty site of the Erenler. Surficial soil layer consists of loose silts a depth of 10.0 m. The location of the bore hole is on the secondary normal fault zone ruptured during 1999 Kocaeli earthquake [4]. During the earthquake liquefaction occurred at this site. Plasticity index varied from 4 to 10. Soils from 4.0 m to7.0 m have liquid limit, LL in the range of 41 to 51. Hanlilar Liquefaction related ground failure and structural damage weren’t observed in Hanlilar. Generally, 1 to 3 story reinforced concrete structures was build in Hanlilar. Typical soil condition is shown in Figure 8. Low plastic dense silts containing sand particles with different percentage are lying in this part of the region. Plasticity index is between 4 to 10. Soils from 4.0 m to 8.0 m have liquid limit, LL, in the range of 26 to 37 and natural water content, w, in excess of 0.9LL.
0
4
8
12
16
20
24
28
32
0 100 200 300 400 500
Shear Wave Velocity (m/s)D
epth
, m
Ohta et al. 1978
Seed et al. 1982
Iyisan. 1996
Average Value

Figure 6. Typical soil condition in Cumhuriyet district
Figure 7. Typical soil condition in Erenler district
4
8
12
16
20
24
0 10 20 30 40 50 N, SPT Value SK6
Dep
th (
m)
Silty Sand
Silty Clay
Clayey Silt
Silt
GWL0
4
8
12
16
20
24
0 20 40 60 80 100
Dep
th (
m)
PLLLwFC
4
8
12
16
20
24
28
32
0 10 20 30 40 50 N, SPT Value SK61
Dep
th (
m)
Plastic Silt
Silty Sand
Clay
Clayey Silt
Silt
GWL0
4
8
12
16
20
24
28
32
0 20 40 60 80 100
Dep
th (
m)
PLLLwFC

Figure 8. Typical soil condition in Hanlilar district Industrial Center As shown in Figure 2 Industrial center site is at approximately 500 m distance from the main fault. Any evidence related to liquefaction was not observed at the site. The soil stratification consists of alternating layers of silty sands, silts and clays to the depth of 8.0 m from ground surface (Figure 9). Plasticity index of soils varied from 10 to 19. Soils from 1.5 m to 8.0 m have liquid limit, LL, in the range of 34 to 43 and natural water content, w, in excess of 0.9LL. Toyota Main fault crossed the factory site of Toyota. Figure 10 presents the typical soil profile of the site. During the earthquake no liquefaction related ground deformation occurred in the site even tough loose silty sand and altered clay-silt layers are dominant as a surficial soil. Plasticity index of soils to the depth of 10.0 m varied from 11 to 16. Soils from 4.0 m to10.0 m have liquid limit, LL, in the range of 36 to 43 and natural water content, w in excess of 0.9LL. Before the Kocaeli earthquake foundation soils underlying structures at the factory site were improved against ground deformations from earthquakes. But there was no soil improvement at the other part of the site.
4
8
12
16
0 10 20 30 40 50 N, SPT Value SK3
Dep
th (
m)
Silt
Silty Sand
GWL0
4
8
12
16
0 20 40 60 80 100
Dep
th (
m)
PLLLwFC

Figure 9. Typical soil condition in Industrial Center
Figure 10. Typical soil condition in factory of Toyota
4
8
12
16
20
24
0 10 20 30 40 50 N, SPT Value B6
Dep
th (
m)
Clay-Silt
Silty Sand
Clay
Silty Sand
Clay
GWL
0
4
8
12
16
20
24
0 20 40 60 80 100
Dep
th (
m)
PLLLwFC
4
8
12
16
20
24
28
0 10 20 30 40 50 N, SPT Value SK1
Dep
th (
m)
Clayey Sand
Silt
Silty Sand
Silty Clay
Clay
GWL
0
4
8
12
16
20
24
28
0 20 40 60 80 100
Dep
th (
m)
PLLLwFC

CYCLIC BEHAVIOUR OF UNDISTURBED SOILS To determine the cyclic behaviour of silts and clays, stress controlled cyclic triaxial test has been conducted on undisturbed soil samples obtained from surficial layers, within a length of 10.0 m at bore holes in different locations of Adapazari. Samples have been consolidated to a pressure of 100 kPa. Cyclic axial loads in a wide range have been applied to silty, sandy and clayey samples at 0.01 Hz frequency. Figure 11 presents the cyclic behaviours of a sandy silt undisturbed sample obtained from a bore hole (Fig.4) in Tigcilar. The applied cyclic axial stress ratio was σd/2σc=±0.32. As the pore water pressure, PWP increased with the repetition of cyclic loading non-plastic soil with a 56 % of fines collapsed at 20th cycle due to liquefaction. The axial deformation was ε=±2.5%. Figure 12 presents the cyclic behaviours of undisturbed clays under cyclic axial loads. The plasticity index, liquid limit and natural water content were 23, 48 and 31 respectively. The cyclic axial stress ratio of σd/2σc=±0.32, as the same cyclic stress level applied to the non plastic sandy silt, was conducted to the clay sample. As can be observed in the figure, pore water pressure increased gradually with the repetition of cyclic loads. Pore pressure ratio was 0.63 at 20th cycle while axial deformation was ε=±0.6%. Even though cyclic deformations are limited in the clay sample the induced pore pressure is enough to trigger bearing capacity failure due to softening.
Figure 11. Cyclic behaviour of undisturbed sandy non plastic silt sample
-0.4-0.20.00.20.4
0 2 4 6 8 10 12 14 16 18 20 22Number of Cycles, N
Str
ess
Rat
io
-4.0-2.00.02.04.0
0 2 4 6 8 10 12 14 16 18 20 22Number of Cycles, N
Axi
al S
trai
n (%
)
-0.40.00.40.81.2
0 2 4 6 8 10 12 14 16 18 20 22Number of Cycles, N
PW
P
BH4 Depth=3.0-3.5 m FC=56% IP=NP σc=100 kPa

EVALUATION LIQUEFACTION Standard penetration blow count is affected by many factors such as: type of hammer release equipment, hammer type, size of cathead, diameter of rope, expertise of the operator, borehole diameter, rod length. To analyse liquefaction potential of soils, measured standard blow counts have been corrected according to energy, rod length, and sampler and bore hole diameter. (N1)60=N30*Cn*n1*n2*n3*n4 (1) where Cn is effective overburden pressure correction as 1/√σeff in kg/cm2, n1 is energy correction, n2 is rod correction, n3 is sampler correction, and n4 is bore hole diameter correction. n1, energy correction in Turkey is 0.75. The distribution of corrected and uncorrected SPT blow counts is given in Figure 4. Corrected SPT blow counts are around 10 for sandy silts and silty sands.
Figure 12. Cyclic behaviour of undisturbed clay sample Maximum horizontal peak acceleration in the rocky part of the city of Adapazari was 407 gal and the duration of the motion was around 45 sec. There was no record of the main shock in the alluvial part of the city Adapazari. Peak horizontal acceleration was estimated to be 374 gal by using an attenuation relationship [10]. To analyse the probability of liquefaction, the following method, developed by Seed et. al [11, 12], has been used.
-4.0-2.00.02.04.0
0 2 4 6 8 10 12 14 16 18 20 22Number of Cycles, N
Axi
al S
trai
n (%
)
-0.4
0.0
0.4
0.8
0 2 4 6 8 10 12 14 16 18 20 22Number of Cycles, N
PW
P
-0.4
-0.2
0.0
0.2
0.4
0 2 4 6 8 10 12 14 16 18 20 22Number of Cycles, N
Str
ess
Rat
io
BH9 Depth=9.5-10.0 m FC=100% IP=23 LL=48 σc=100 kPa

dvo
vo
vo
av rg
aCSR ))((65.0)(
'max
' σσ
στ
== (2)
where amax is peak horizontal acceleration at the ground surface generated by the earthquake, g is acceleration of gravity, σvo and σ’vo are total and effective vertical overburden stresses, respectively. Rd is stress reduction coefficient Figure 13 illustrates the relationships between cyclic shear stress ratio and SPT penetration for soils obtained from different sites of Adapazari. The free field cyclic shear stress ratio is within liquefaction zone and between 0.26 to 0.54. According to this method, all soils from different sites can liquefy.
Figure 13. Relationship between (N1)60 versus CSSR
CONCLUSIONS An extensive ground failure in Adapazari severely impacted building performance during the 1999 Kocaeli earthquake. Many structures settled, tilted and slid as a result of liquefaction. Besides liquefaction related ground displacements, bearing capacity failures were also developed due to the softening of plastic silts and clays. Main part of the city is located on a thick alluvium that was deposited and redistributed into Sakarya basin by Sakarya River and Cark Stream. Surficial soil layers consist of transported soils. For this reason, these silty sand and sandy silts are more collapsible against earthquake loads.
0
0.1
0.2
0.3
0.4
0.5
0.6
0 20 40 60 80
Corrected Blow Count, (N1)60
Cyc
lic S
tres
s R
atio
FC=35%
FC=5%
Tigcilar
Cumhuriyet
Hanlilar
Organize
Toyota
Erenler
The city is extended through the main fault, which is 7 km away from the center of the city. During the main shock, a secondary normal fault segment also ruptured in the city. Six sites were chosen to study soil conditions, ground performance and the effects of faults on liquefaction. Two of the sites were located on the hanging wall of the secondary fault. At these locations, heavy structural damage was developed because the soils on the hanging wall part of the fault were more compressible as a result of the large mass movement. The location of the borehole in Erenler was on the secondary fault zone. Limited liquefaction was observed at this site compared to that in the center of the city. Because active earth pressures developed in soil when the secondary normal fault ruptured. Soil conditions are much better in Hanlilar, which is a district located between the main fault and normal fault. Even though the districts is located on the deep alluvial soil strata [2], no liquefaction evidence was observed at the site. Soil conditions of Toyota and Industrial Center are around the right lateral strike-slip main fault. Except the levees of Sakarya River, no liquefaction phenomenon was observed at these sites, even though silty sands and sandy silts are dominant in the site. According to the results, one of the main factors affecting the liquefaction behaviour soils in Adapazari is the condition of soil layers against fault. If the soil layers are lying on hanging wall liquefaction potential will increase due to fault induced compressive stresses within the soil stratum. Fault related liquefaction phenomenon has been also observed during 1979 Imperial earthquake and the 1983 Borah Peak earthquake [13, 14]. Liquefaction occurred at the end of fault segments during 1979 the Imperial earthquake and at the hanging wall of the Lost River fault. In addition Vallejo [15] claimed that seismic zonation with respect to earthquake induced liquefaction should consider the fault end induced stresses, that one type is compressive stress and the other is tensile stress.
ACKNOWLEDGEMENTS The research reported herein has been supported by the Turkish Earthquake Foundation under Grant 00-AP-113. The study was supported by 10 boreholes drilled at the city of Adapazari, which has been financially supported by Japan International Cooperation Agency after the 1999 Kocaeli earthquake. More than 1000 boreholes data obtained from geotechnical reports and soil samples from some boreholes drilled in Adapazari were provided by the Adapazari Section of the Chamber of Civil Engineers. These supports are strongly appreciated.
REFERENCES 1. Ketin, I. “Uber die tektonisch-mechanischen Flgerungen aus den grossen Anatolischen Erdbeden des
Letzten Dezenniums.” Geol. Rundscheu; 1948; 36:66-83 2. Barka A. Akyuz S., Altunel E., Sunal G., Cakir Z., Dikbas A., Yerli B., Rockwell T., Dolan J.,
Hartleb R., Dawson T., Fumal T., Langridge R., Stenner H., Christofferson S., Tucker A., Armijo R., Meyer B., Chabalier J.B., Lettis W., Page W. & Bachhuber J., “The august 17, 1999 Izmit earthquake, M=7.4, Eastern Marmara region, Turkey: study of surface rupture and slip distribution.” The 1999 Izmit and Duzce Earthquakes: preliminary results. Istanbul Technical University. 2000:15-30.
3. Tubitak METU and Mine Department, “Aug 17. 1999. The report of the study of new settlement areas of Sakarya region following 1999 Golcuk-Arifiye (NE Marmara) earthquake” 1999:148, (in Turkish).
4. Erken, A. “The effect of secondary normal fault on ground deformation in Adapazari during 1999 Kocaeli earthquake.” Engineering Geology (in revue)
5. Komazawa,M. Morikawa,H., Nakamura, K., Akamatsu, J., Nishimura, K., Sawada, S., Erken, A., and Onalp, A., “Bedrock structure in Adapazari, Turkey- A possible cause of severe damage by the 1999 Kocaeli earthquake.” Soil Dynamics and Earthquake Engineering 2002; 22:829-836.

6. Erken, A. “The role geotechnical factors on observed damage in Adapazari.” XV ICSMGE Satellite Conference on Lessons Learned from Recent Strong Earthquakes, 2001:29-32.
7. Ohta Y. and Goto, N. “emprical shear wave velocity equations in terms of characteristics soil indexxes.” Earthquake Engineering and Structural Dynamics, 1978;6:167-187.
8. Seed, H.B., and Idriss, I.M., “Evaluation of liquefaction potential of sand deposits based on observations of performance in previous earthquakes.” Proceeding the Conference on In-situ Testing to Evaluate Liquefaction Susceptibility, ASCE, 1981:81-544, St.Louis, MO,26.
9. Iyisan R. “Correlations between shear wave velocity and in-situ penetration tests” Turkish Chamber of Civil Engineers, Digest 96, 1996:7:371-374.
10. Joyner, W.B. and Boore, D.M “Peak horizontal acceleration and velocity from strong-motion records including records from the 1979 Imperial Valley, California, Earthquake.”, Bull. Seism. Soc.Am., 1981:71:2011-2038.
11. Seed, H.B., and Idriss, I.M., “Simplified procedure for evaluating soil liquefaction potential”, Journal of the Soil Mechanics and Foundations Division, ASCE, 1971;97;SM9:1249-1273.
12. Seed, H. B., Tokimatsu, K, Harder, L. F. and Chung, R. M., “Influence of SPT procedures in soil liquefaction resistance evaluations.”, Journal of Geotechnical Engineering, 1985;111-12:1425-1445.
13. Youd T.G. Wieczorek G., “Liquefaction and secondary ground failure.” U.S.G.S Prof. Paper, 1982, 1254:223-246.
14. Youd T.L. Harb E.L. Keefer D.K. Wilson R.C.,, “Liquefaction generated by the 1983 Borah Peak, Idaho earthquake.” U.S.G.S Open File Report. 1985:85-295.
15. Vallejo L.E., “Liquefaction zones predicted by the type of stresses induced by the ends of fault segments.” Earthquake Engineering, Tenth World Conference, 1992:1355-1359.


![untitled [] · Web viewBURHAN KİBAR ALİ SERVET Öğretmen SAKARYA ADAPAZARI 24067../09/1971 BÜLENT KILINÇ IIASAN Öğretmen SAKARYA ADAPAZARI 24068.709/1978 BÜLENT YUMAZ HAŞAN](https://img.dokumen.tips/doc/110x75/5cc8394b88c993db3e8d02e5/untitled-web-viewburhan-kibar-ali-servet-oegretmen-sakarya-adapazari.jpg)