Embed Size (px)
Citation preview
Grocery retail loyalty programGrocery retail loyalty program effects: Self-selection or purchase behavior change?behavior change?
Lars Meyer-WaardenEM-Strasbourg Business School, Humans & Management in Society g g yInstitute, University Strasbourg
1
T i Di dTopics Discussed Context & Definition Loyalty program (LP) Context & Definition Loyalty program (LP) Empirical evidence about LP efficiency Conceptual Framework about Efficiency of Loyalty Programsp y y y g 1st Investigation and data Results about Efficiency of Loyalty Programs Conceptual Framework about how to improve Loyalty Programs 2nd investigation and data Results about how to improve Loyalty Programs Results about how to improve Loyalty Programs
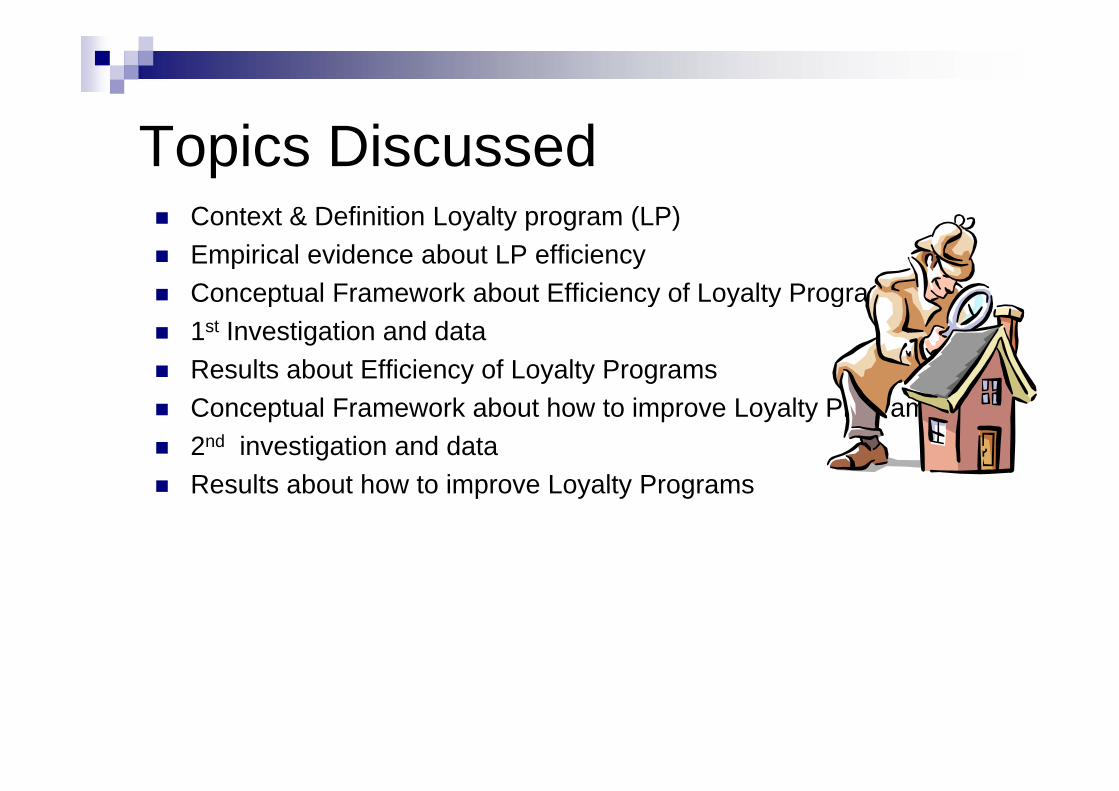
L lt P (LP)Loyalty Program (LP) Integrated CRM system of individualized marketing actions that aims
at: increasing customers’ attitudinal & behavioral loyalty through rewards & increasing customers attitudinal & behavioral loyalty through rewards &
personalized relationships.
Many American &European grocery retailers established LP’s Since creation AAdvantage in 1981, every sector is concerned (Retailing,
Airlines, Car rental, Hotels, ….) In France every grocery has one imitation, less innovation
More than 90% of European consumers belonged to at least one loyalty program in 2010 (+11% growth rate/year ACNielsen 2010).
Based on the believe that 20% of store’s clients realize 75% of its Based on the believe that 20% of store s clients realize 75% of its turnover (Reichheld 1996)
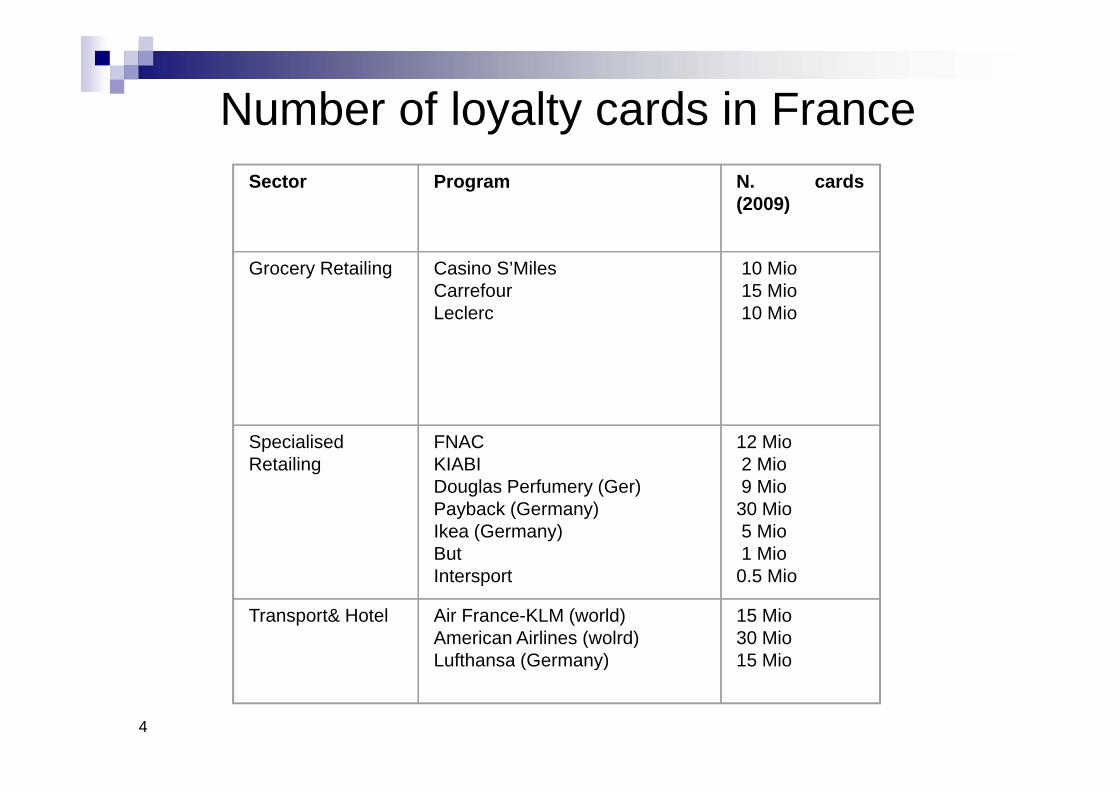
Number of loyalty cards in Francey ySector Program N. cards
(2009)
Grocery Retailing Casino S’MilesCarrefour
10 Mio15 Mio10Leclerc 10 Mio
SpecialisedRetailing
FNACKIABIDouglas Perfumery (Ger)
12 Mio2 Mio9 MioDouglas Perfumery (Ger)
Payback (Germany)Ikea (Germany)ButIntersport
9 Mio30 Mio5 Mio1 Mio0 5 MioIntersport 0.5 Mio
Transport& Hotel Air France-KLM (world)American Airlines (wolrd)Lufthansa (Germany)
15 Mio30 Mio15 Mio
4
Lufthansa (Germany) 15 Mio
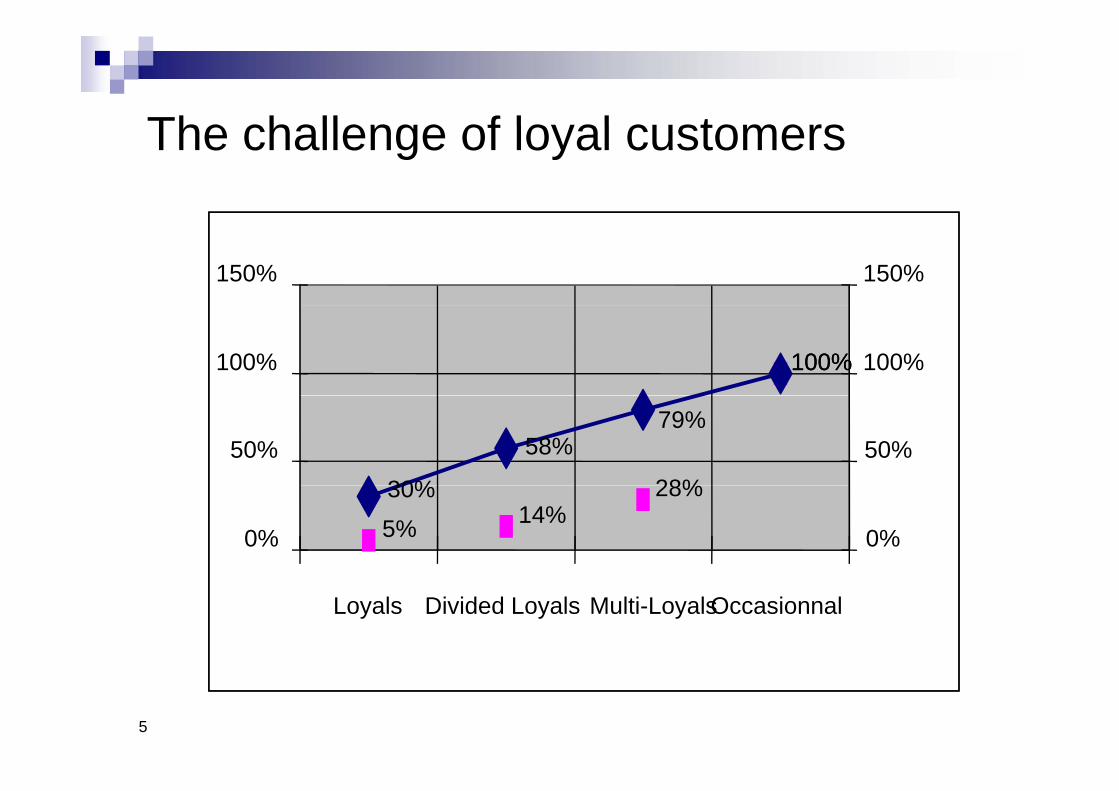
The challenge of loyal customersThe challenge of loyal customers
150% 150%
100%100%100% 100%
28%
79%
30%
58%50% 50%
5% 14%28%30%
0% 0%
Loyals Divided Loyals Multi-LoyalsOccasionnal
5
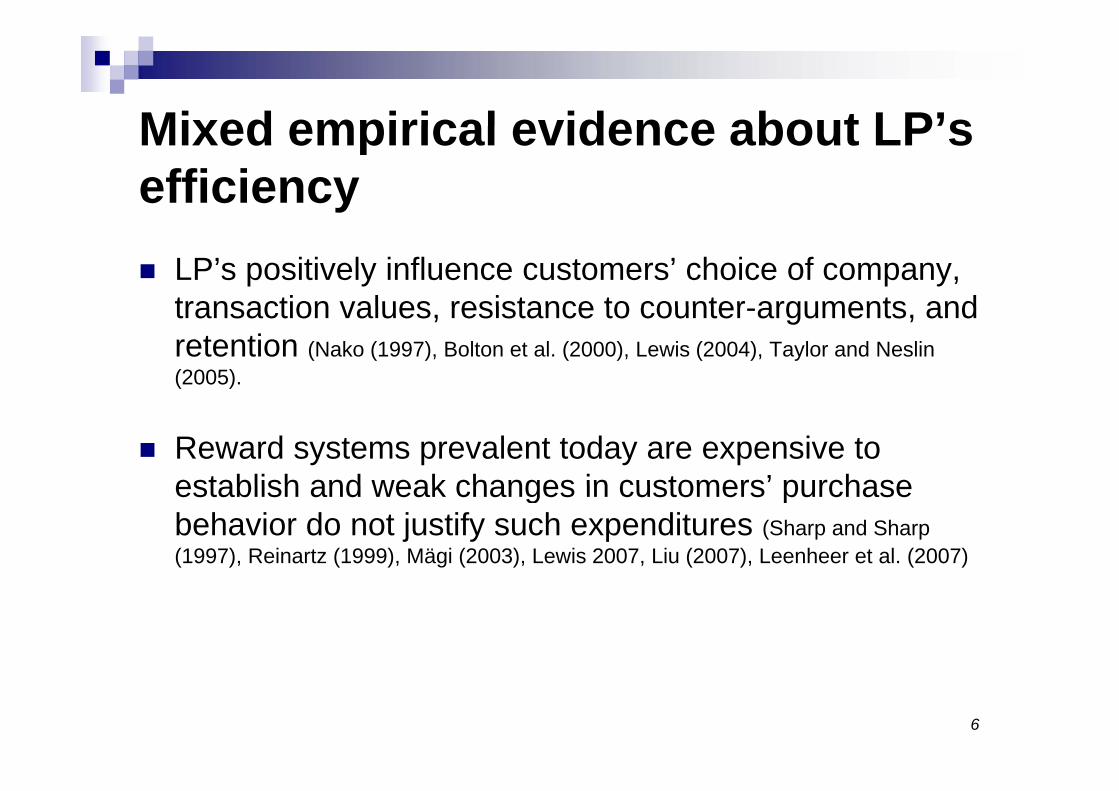
Mixed empirical evidence about LP’sMixed empirical evidence about LP s efficiency LP’s positively influence customers’ choice of company,
transaction values resistance to counter arguments andtransaction values, resistance to counter-arguments, and retention (Nako (1997), Bolton et al. (2000), Lewis (2004), Taylor and Neslin(2005).
Reward systems prevalent today are expensive to establish and weak changes in customers’ purchaseestablish and weak changes in customers purchase behavior do not justify such expenditures (Sharp and Sharp (1997), Reinartz (1999), Mägi (2003), Lewis 2007, Liu (2007), Leenheer et al. (2007)
6
Ambiguous results derive from limitationsAmbiguous results derive from limitations that hinder proper assessments of the ff t f l lteffects of loyalty programs.
N f th i ti ti h d t l lt None of these investigations had access to loyalty program enrollment dates
Some studies only compare the impact on the short term (maximum: 1 year)(maximum: 1 year)
7
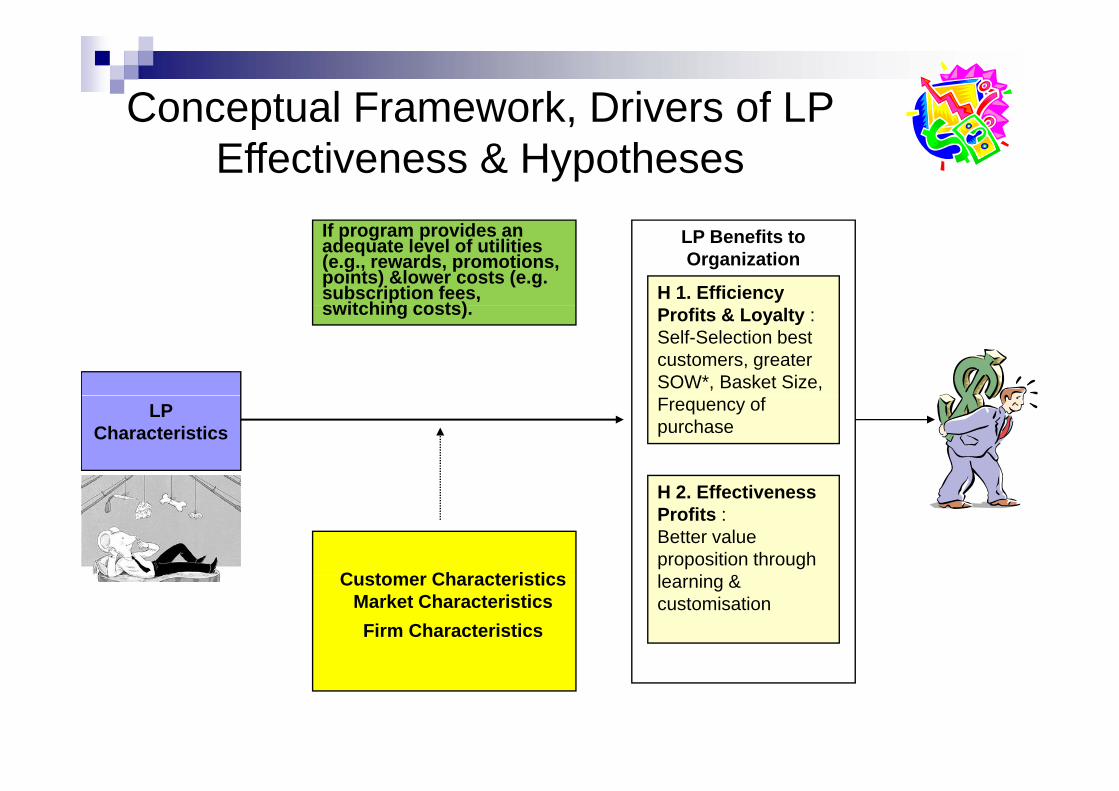
Conceptual Framework, Drivers of LP p ,Effectiveness & Hypotheses
LP Benefits to Organization
H 1. Efficiency
If program provides an adequate level of utilities (e.g., rewards, promotions, points) &lower costs (e.g. subscription fees, switching costs) Profits & Loyalty :
Self-Selection best customers, greater SOW*, Basket Size,
switching costs).
H 2 Eff ti
LP Characteristics
Frequency of purchase
H 2. Effectiveness Profits : Better value proposition through l i &C t Ch t i ti learning & customisation
Customer Characteristics Market CharacteristicsFirm Characteristics
M th d l Th lMethodology – The sample
Match of BehaviorScan single source panel data (7 Match of BehaviorScan single source panel data (7 stores, covering 95% FMCG sales) with grocery retailer Casino (S1) store data (Angers, France): (2.500 consumers 1 Mio purchasing acts over 3 years)consumers,1 Mio. purchasing acts over 3 years).
546 S1 loyalty program members over a 156-week period y y p g p(week 2/1998 - week 2/2001); 266 adoptors during 1998-2001.
Use of individual weekly data to test the effect of the following behavioral variables: e.g. frequency of purchase, share of allet (SOW) total & mean basket in the storeshare-of-wallet (SOW), total & mean basket in the store, interpurchase time, consecutive store switchings, N of stores visited.
9 6/7 stores offer the same type of LP (cumulated points are
exchanged against gifts)
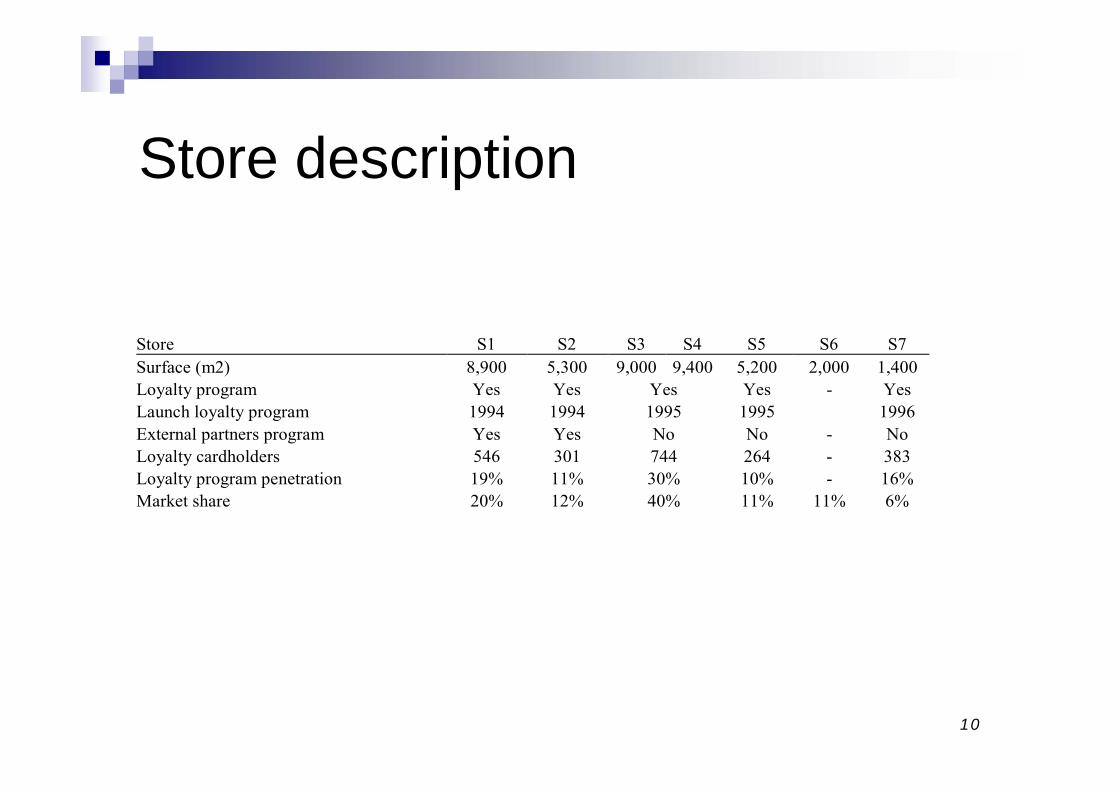
Store description
Store S1 S2 S3 S4 S5 S6 S7 Surface (m2) 8,900 5,300 9,000 9,400 5,200 2,000 1,400 Loyalty program Yes Yes Yes Yes - Yesy y p gLaunch loyalty program 1994 1994 1995 1995 1996 External partners program Yes Yes No No - No Loyalty cardholders 546 301 744 264 - 383 Loyalty program penetration 19% 11% 30% 10% - 16%y y p g pMarket share 20% 12% 40% 11% 11% 6%
10
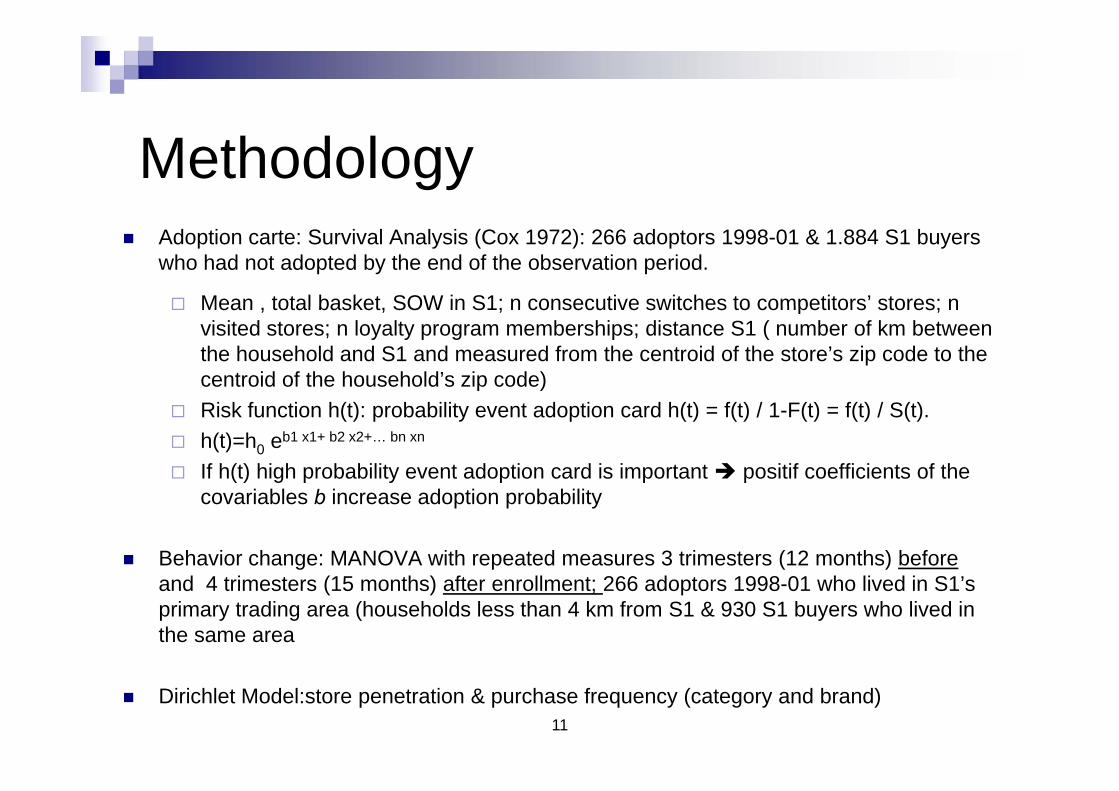
Methodology Adoption carte: Survival Analysis (Cox 1972): 266 adoptors 1998-01 & 1.884 S1 buyers
who had not adopted by the end of the observation period.
Mean total basket SOW in S1; n consecutive switches to competitors’ stores; n Mean , total basket, SOW in S1; n consecutive switches to competitors stores; n visited stores; n loyalty program memberships; distance S1 ( number of km between the household and S1 and measured from the centroid of the store’s zip code to the centroid of the household’s zip code)
Risk function h(t): probability event adoption card h(t) = f(t) / 1-F(t) = f(t) / S(t). h(t)=h0 eb1 x1+ b2 x2+… bn xn
If h(t) high probability event adoption card is important positif coefficients of the covariables b increase adoption probability
Behavior change: MANOVA with repeated measures 3 trimesters (12 months) beforeand 4 trimesters (15 months) after enrollment; 266 adoptors 1998-01 who lived in S1’s primary trading area (households less than 4 km from S1 & 930 S1 buyers who lived in the same area
11
Dirichlet Model:store penetration & purchase frequency (category and brand)
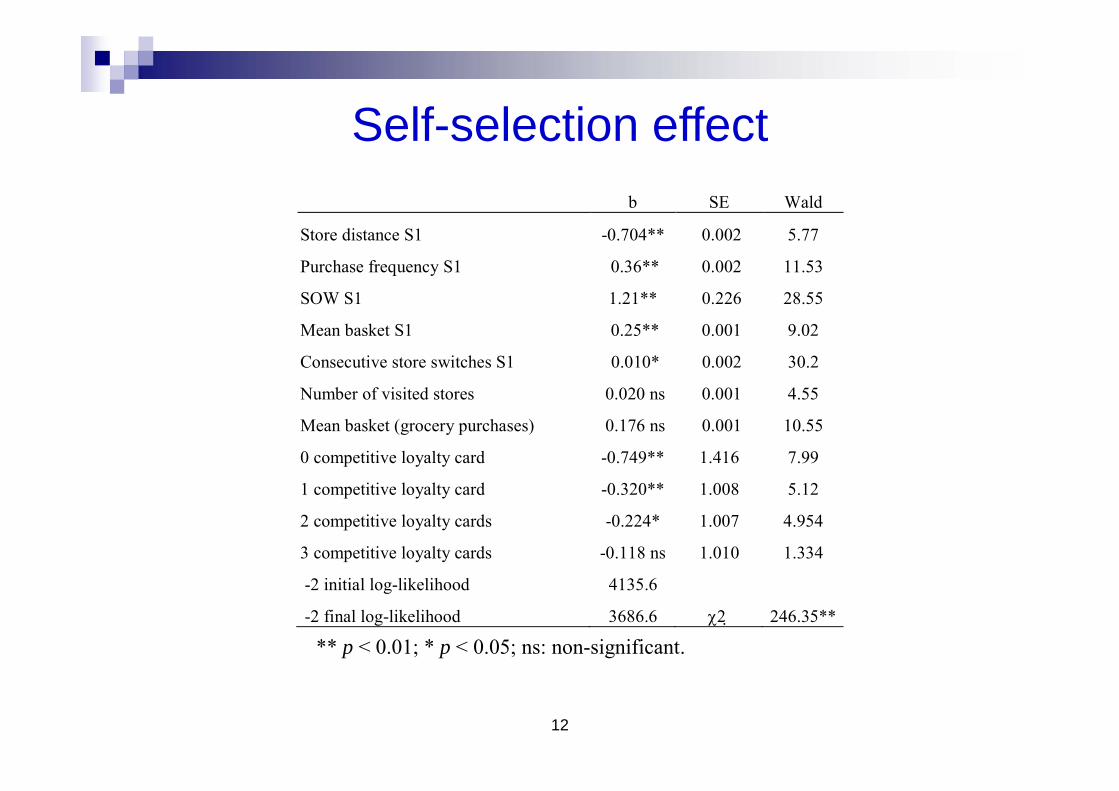
Self selection effectSelf-selection effect b SE Wald
Store distance S1 -0.704** 0.002 5.77
Purchase frequency S1 0.36** 0.002 11.53
SOW S1 1.21** 0.226 28.55
Mean basket S1 0.25** 0.001 9.02
Consecutive store switches S1 0.010* 0.002 30.2
Number of visited stores 0 020 ns 0 001 4 55Number of visited stores 0.020 ns 0.001 4.55
Mean basket (grocery purchases) 0.176 ns 0.001 10.55
0 competitive loyalty card -0.749** 1.416 7.99
1 titi l lt d 0 320** 1 008 5 121 competitive loyalty card -0.320** 1.008 5.12
2 competitive loyalty cards -0.224* 1.007 4.954
3 competitive loyalty cards -0.118 ns 1.010 1.334
-2 initial log-likelihood 4135.6
-2 final log-likelihood 3686.6 246.35**
** p < 0.01; * p < 0.05; ns: non-significant.
12
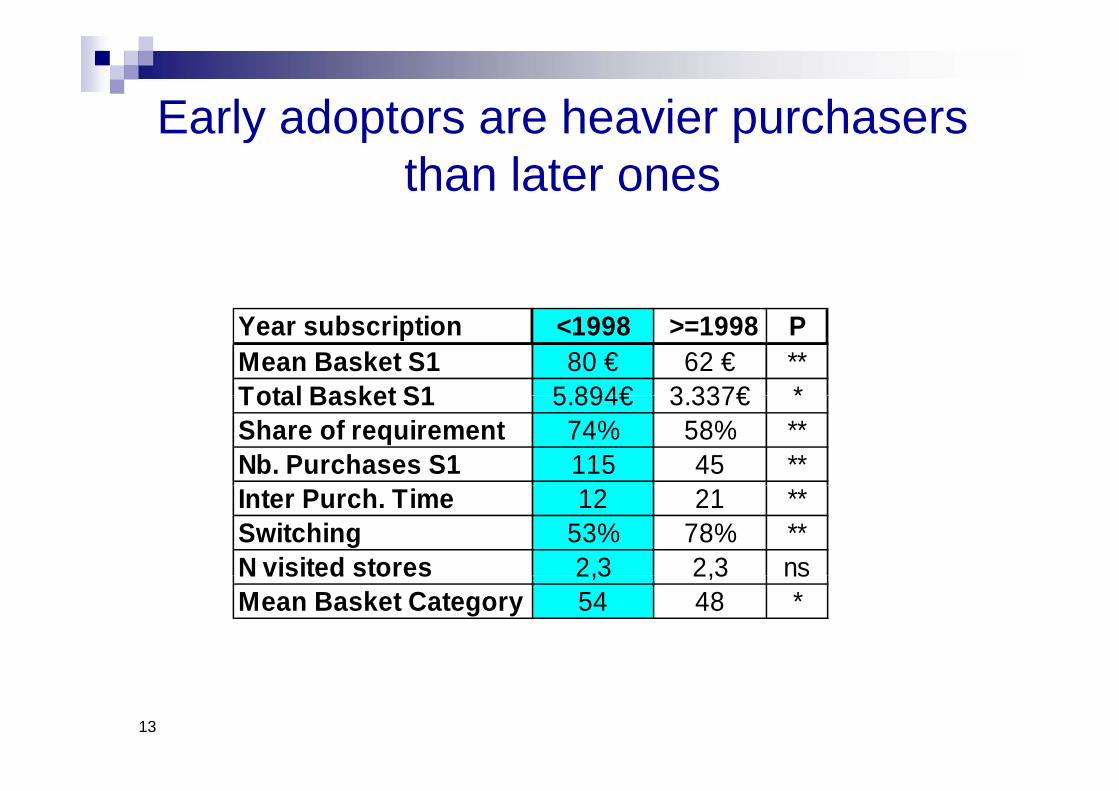
Early adoptors are heavier purchasersEarly adoptors are heavier purchasersthan later ones
Year subscription <1998 >=1998 PMean Basket S1 80 € 62 € **Total Basket S1 5 894€ 3 337€ *Total Basket S1 5.894€ 3.337€Share of requirement 74% 58% **Nb. Purchases S1 115 45 **Inter Purch. Time 12 21 **Switching 53% 78% **N visited stores 2,3 2,3 nsN visited stores 2,3 2,3 nsMean Basket Category 54 48 *
13

A massif card distribution leads toA massif card distribution leads to deficits
400500600
n
Penetrationrate: 25%
100200300400
Mar
gin
Penetrationrate: 2,5%
0100
0
000
000
000
000
000
000
000
000
000
000
, %
100
200
300
400
500
600
700
800
9001000
Num be r of Cards
Selective distribution (consumers whose behaviours are likely to b difi d b th f th d)
14
be modified by the use of the card)
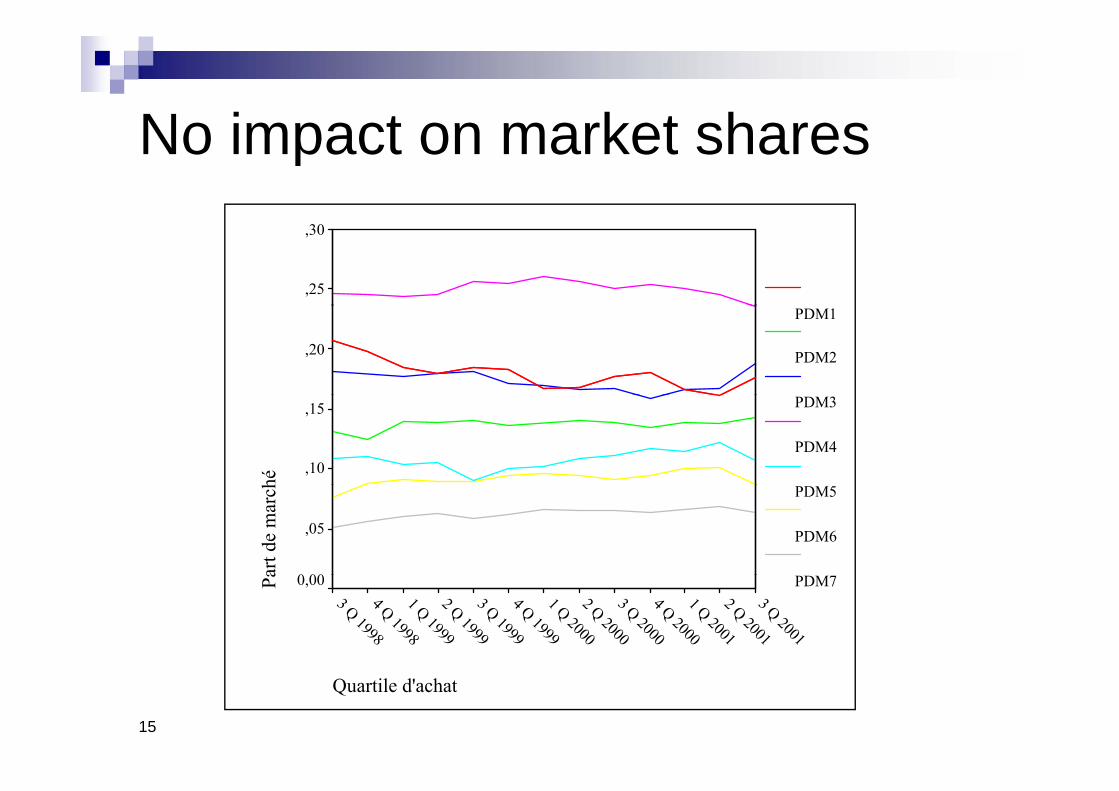
No impact on market sharesNo impact on market shares,30
,25
,20
PDM1
PDM2
hé
,15
,10
PDM3
PDM4
art d
e m
arch
,05
0 00
PDM5
PDM6
3 Q 2001
2 Q 2001
1 Q 2001
4 Q 2000
3 Q 2000
2 Q 2000
1 Q 2000
4 Q 1999
3 Q 1999
2 Q 1999
1 Q 1999
4 Q 1998
3 Q 1998
Pa 0,00 PDM7
15
Quartile d'achat
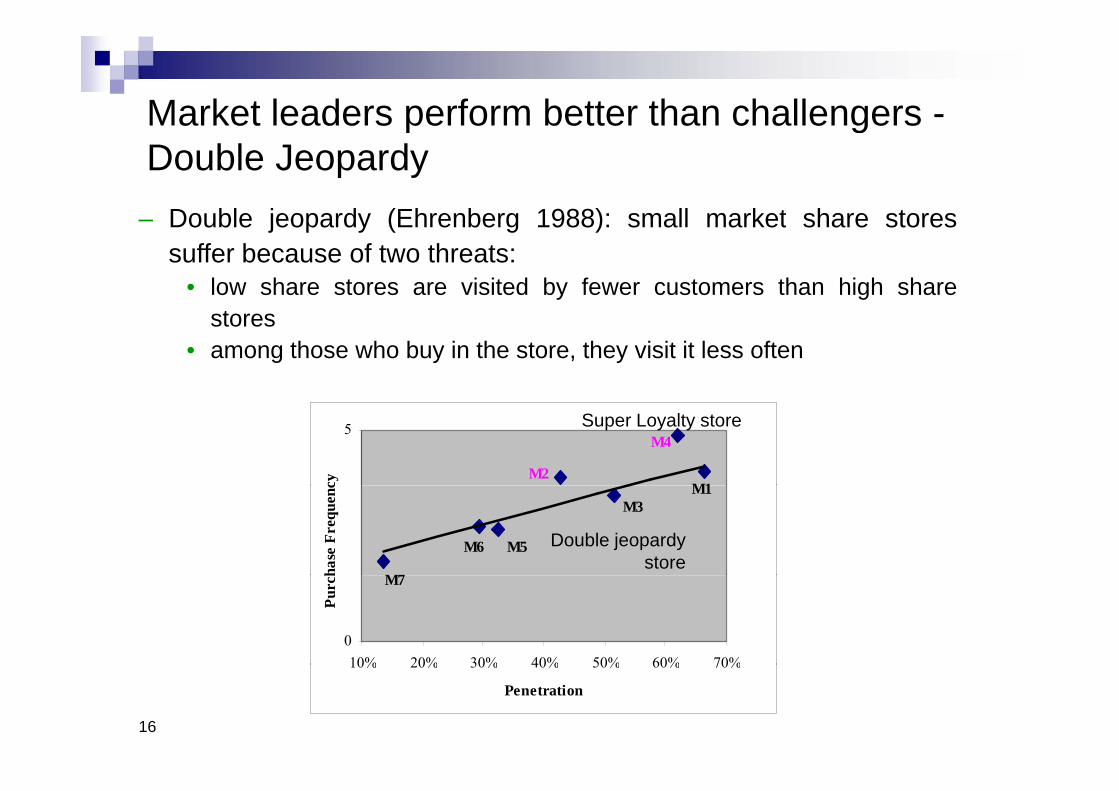
Market leaders perform better than challengers -p gDouble Jeopardy
Double jeopardy (Ehrenberg 1988): small market share stores– Double jeopardy (Ehrenberg 1988): small market share storessuffer because of two threats:
• low share stores are visited by fewer customers than high sharestores
• among those who buy in the store, they visit it less often
Niche store5
cy M1
M4
M2
Super Loyalty store
hase
Fre
quen
c M1
M7
M6 M5
M3
Double jeopardystore
010% 20% 30% 40% 50% 60% 70%
Purc
h M7
16
10% 20% 30% 40% 50% 60% 70%
Penetration
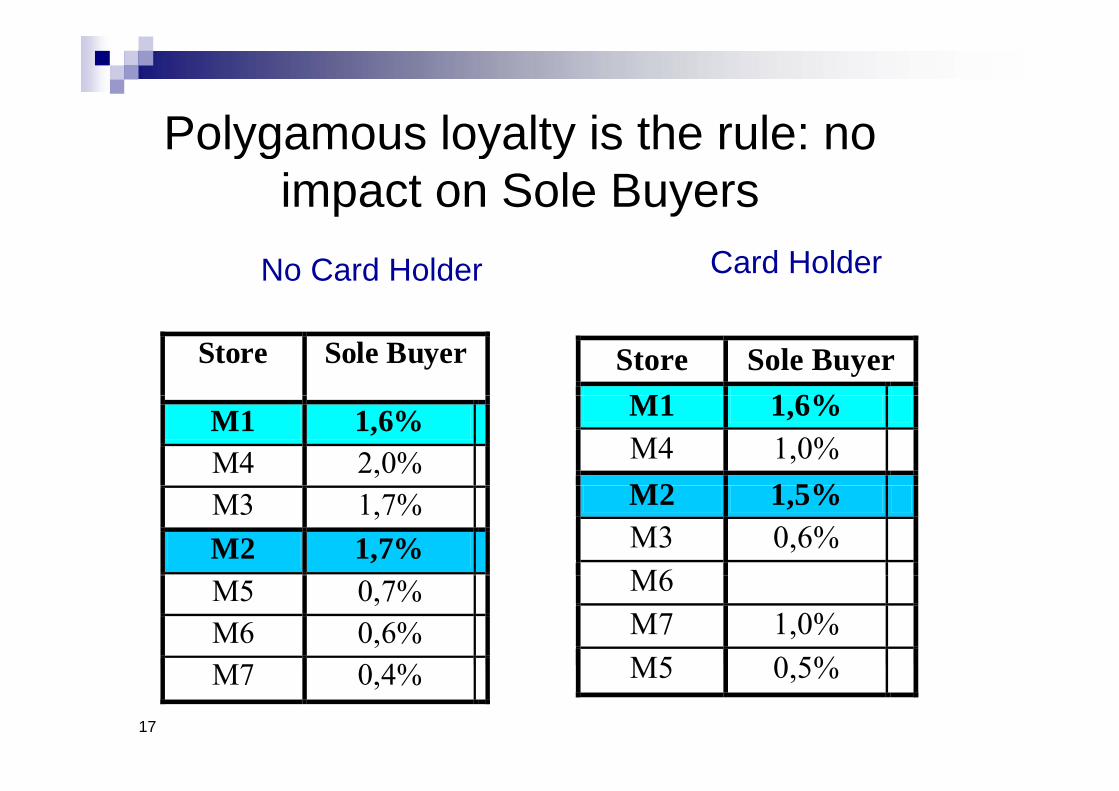
Polygamous loyalty is the rule: noPolygamous loyalty is the rule: no impact on Sole Buyersp y
No Card Holder Card Holder
Store Sole Buyer M1 1 6%
Store Sole Buyer
M1 1,6%M4 1,0% M2 1 5%
M1 1,6% M4 2,0%
M2 1,5%M3 0,6% M6
M3 1,7% M2 1,7%
M6M7 1,0% M5 0 5%
M5 0,7%M6 0,6% M7 0 4%
17
M5 0,5%
M7 0,4%

Mean Basket
Before After
Mean Basket
600
Before After
500
400
r Moy
en 300 porteur de carte
AvantMea
nB
aske
t CardHolder
Before
Ordre d'achat avant/après
20,0010,00,00-10,00-20,00
Pan
ier
200
Avant
Après
B
Purchase Order
Before
AfterF= 1.2 , p= 0.35
18
Ordre d achat avant/aprèsPurchase Order

Purchase frequency & Inter Purchase TimePurchase frequency & Inter-Purchase TimeBefore After Before After
,6 30
,5
25
F= 1.1 , p= 0.17 F= 1.5 , p= 0.27
t at
20
yue
nce
d'ac
hat
,4
ée In
ter-
Ach
a
15
eque
cny
T20,0010,00,00-10,00-20,00
Fréq
u
,3
O d d'A h t
20,0010,00,00-10,00-20,00D
uré
10Fre
IPT
P h O d P h O d
19
Ordre d'achat Ordre d'AchatPurchase Order Purchase Order
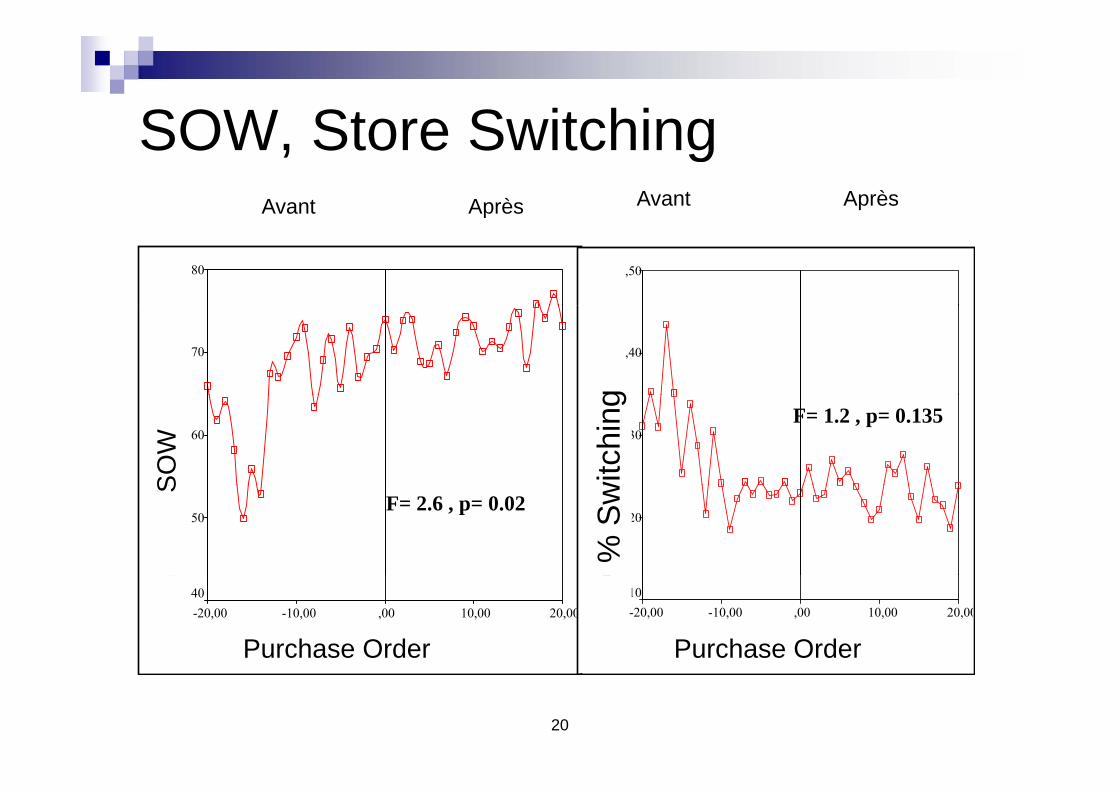
SOW Store SwitchingSOW, Store SwitchingAvant Après Avant Après
80 ,50
p
70 ,40
g
re
60
men
t
,30
SO
W
witc
hing F= 1.2 , p= 0.135
ux d
e no
urrit
ur
50
ux d
e ch
ange
m
,20
S
% S
wF= 2.6 , p= 0.02
Ordre d'achat
20,0010,00,00-10,00-20,00
Tau
40
Ordre d'achat Avant/Après
20,0010,00,00-10,00-20,00Ta
u,10
Purchase Order Purchase Order
20
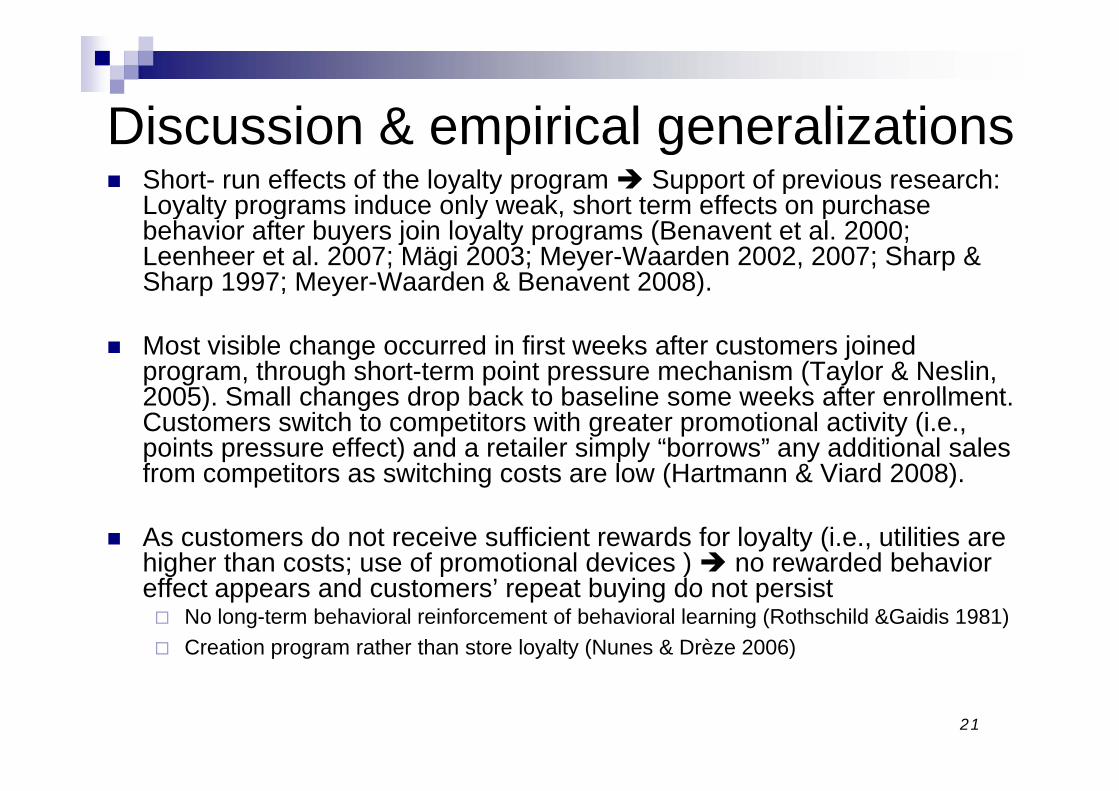
Discussion & empirical generalizationsDiscussion & empirical generalizations Short- run effects of the loyalty program Support of previous research:
Loyalty programs induce only weak, short term effects on purchase y y p g y , pbehavior after buyers join loyalty programs (Benavent et al. 2000; Leenheer et al. 2007; Mägi 2003; Meyer-Waarden 2002, 2007; Sharp & Sharp 1997; Meyer-Waarden & Benavent 2008).
Most visible change occurred in first weeks after customers joined program, through short-term point pressure mechanism (Taylor & Neslin, 2005) Small changes drop back to baseline some weeks after enrollment2005). Small changes drop back to baseline some weeks after enrollment. Customers switch to competitors with greater promotional activity (i.e., points pressure effect) and a retailer simply “borrows” any additional sales from competitors as switching costs are low (Hartmann & Viard 2008). p g ( )
As customers do not receive sufficient rewards for loyalty (i.e., utilities are higher than costs; use of promotional devices ) no rewarded behavior g ; p )effect appears and customers’ repeat buying do not persist No long-term behavioral reinforcement of behavioral learning (Rothschild &Gaidis 1981) Creation program rather than store loyalty (Nunes & Drèze 2006)
21
What do customersand loyalty program managers think ?managers think ?
Investigations: 3.000 French customers in all sectors (2007) 30 LP managers in all sectors (2007) g ( )

Effectiveness LP topic of debate High costs program management:
Estimated loyalty program expenditures grocery retailers > 100 Mio €/year€/year
Available customer data is proliferating for better customer segmentation & targeting improved satisfaction & loyaltysegmentation & targeting improved satisfaction & loyalty (H 2. Effectiveness Profits) 14 % of retailers “always” use customer loyalty data (A.C. Nielsen y y y (
2005; Meyer-Waarden 2007) 46% LP managers consider their LP’s as efficient (Meyer-Waarden
2007): weak added value weak differenciation weak usage of data2007): weak added value, weak differenciation, weak usage of data
Isomorphism (Powell & Di Maggio 1982) destroyed differentiation (Meyer-Waarden & Benavent, 2006).differentiation (Meyer Waarden & Benavent, 2006).
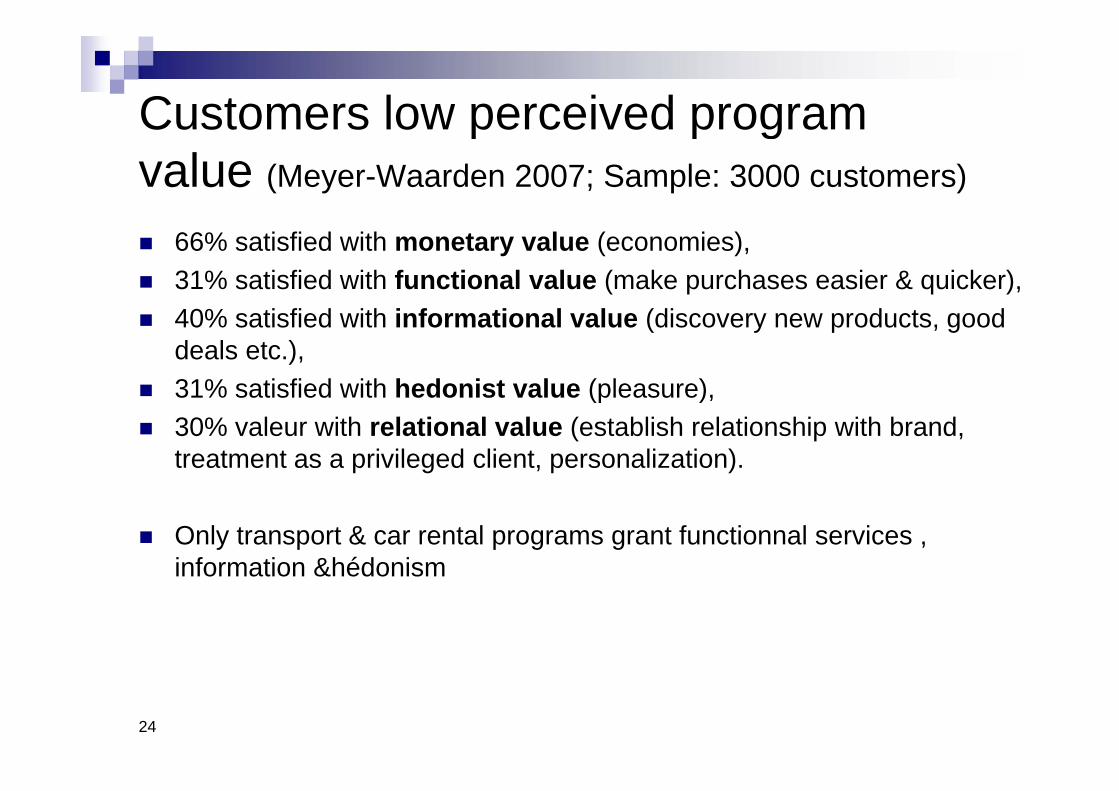
Customers low perceived programCustomers low perceived program value (Meyer-Waarden 2007; Sample: 3000 customers)
66% satisfied with monetary value (economies), 31% satisfied with functional value (make purchases easier & quicker), 40% satisfied with informational value (discovery new products, good
deals etc.), 31% satisfied with hedonist value (pleasure), 31% satisfied with hedonist value (pleasure), 30% valeur with relational value (establish relationship with brand,
treatment as a privileged client, personalization).
Only transport & car rental programs grant functionnal services , information &hédonisminformation &hédonism
24

Reward StructureReward StructureCar Airline Telephone Grocery Petrol Hotel Book Store PerfumeryCar
RentalAirline Telephone Grocery
Retailing Petrol Station
Hotel Book Store Perfumery
Type Reward Free WE Car Rental
Flights, Hotels, WE Car Rental
Free Units, Equipment
Catalogproducts
Catalogproducts
Free WE rooms
Vouchers Service
Car Rental
Value Reward 100€ 230€ 25€ 7€ 6€ 100€ 10€ 50€
Points/Purchase Amount
1p/0.5€ 1p/0.4€ 1p/0.15€ 1p/0.8€ 1p/8€ 1p/0.16€ 1p/0.1€ 1p/1€
Necessary Points for Reward
3.000 20.000 15 1. 000 600 10.000 4000 150
Necessary Purchases for Reward
450€ 4600€ 670€ 760€ 4600€ 1.600€ 400€ 150€
Mean Basket in sector 70€ 230€ 30€ 76€ 46€ 150€ 15€ 80€
Nnumber necessary Repeat Purchases
7 20 22 10 100 11 27 2
% V l R d /V l 22% 5% 3% 1 0% 0 13% 6% 2 5% 33%
100 car petrol fills (1-2 years) &
% Value Reward /Value Purchase
22% 5% 3% 1,0% 0.13% 6% 2.5% 33%
25
100 car petrol fills (1 2 years) & 4600€ for a Mug (value 6€).
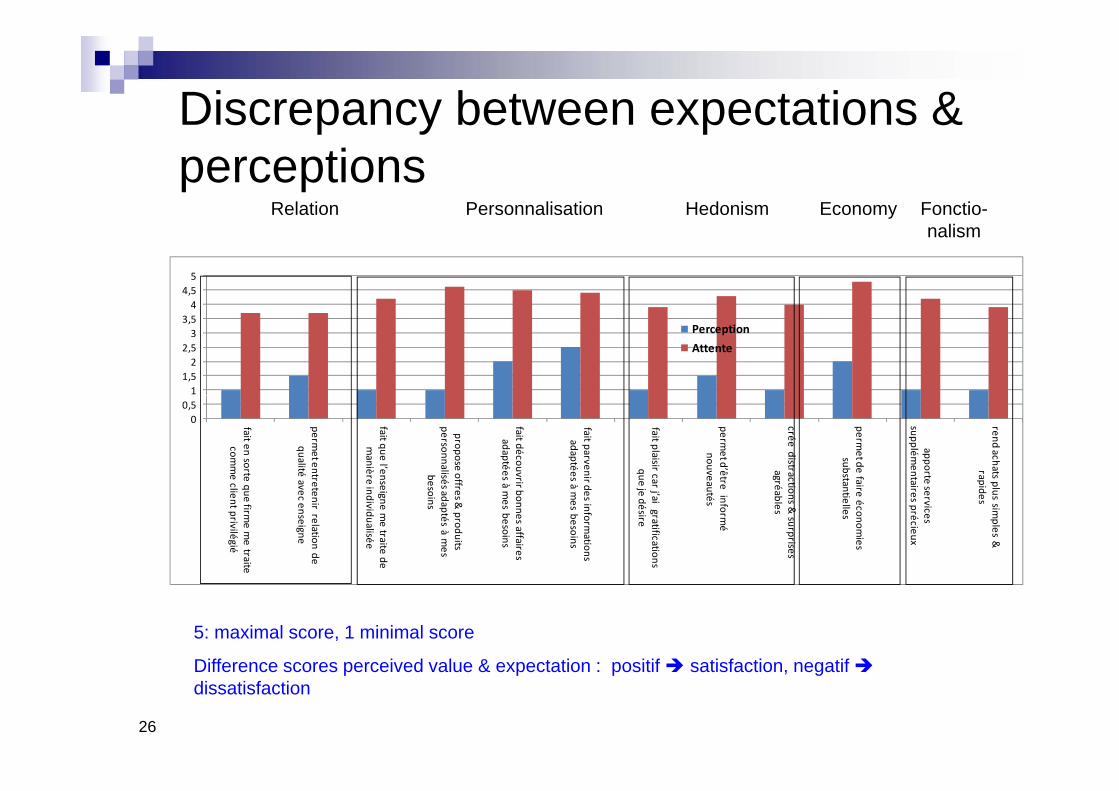
Discrepancy between expectations & p y pperceptions
Relation Personnalisation Hedonism Economy Fonctio-ynalism
44,55
11,52
2,53
3,54
Perception
Attente
00,5
fait en sorte qcom
me c
permet entrequalité av
fait que l’ensmanière
propose of fpersonnalisés
be
fait découvriradaptées à
fait parvenir dadaptées à
fait plaisir carque
permet d’êtrenouvea
crée distractagré
permet de faisubsta
apporte supplém
enta
rend achats prapque firm
e me traite
client privilégié
etenir relation de vec enseigne
eigne me traite de
individualisée
fres & produits
s adaptés à mes
esoins
r bonnes affaires à m
es besoins
des informations
à mes besoins
r j’ai gratifications e je désire
e informé
autés
tions & surprises
éables
ire économies
antielles
services ires précieux
plus simples &
ides
5: maximal score, 1 minimal score
Difference scores perceived value & expectation : positif satisfaction negatif
26
Difference scores perceived value & expectation : positif satisfaction, negatifdissatisfaction

The best means to acheiveThe best means to acheivegood deals,…g ,
94% 86%100%72% 70% 65% 62%
50%
100%
0% Com
Utilr
Achmd Am
dist
Chaense Uprofi dm
parer prix
liser bons dréduction
heter dans m
agasins iscount
Acheter
marques de
tributeur/1eprix
anger eigne
Utiliser
gramm
e dedélisationx de
er
e
27
H2 Effectiveness Profits (Better value proposition(Better value proposition through learning & customisation)

Conceptual Framework, Drivers of LP p ,Effectiveness & Hypotheses
LP Benefits to Organization
H 1. Efficiency
If program provides an adequate level of utilities (e.g., rewards, promotions, points) &lower costs (e.g. subscription fees, switching costs) Profits & Loyalty :
Self-Selection best customers, greater SOW*, Basket Size,
switching costs).
H 2 Eff ti
LP Characteristics
Frequency of purchase
H 2. Effectiveness Profits : Better value proposition through l i &C t Ch t i ti learning & customisation
Customer Characteristics Market CharacteristicsFirm Characteristics
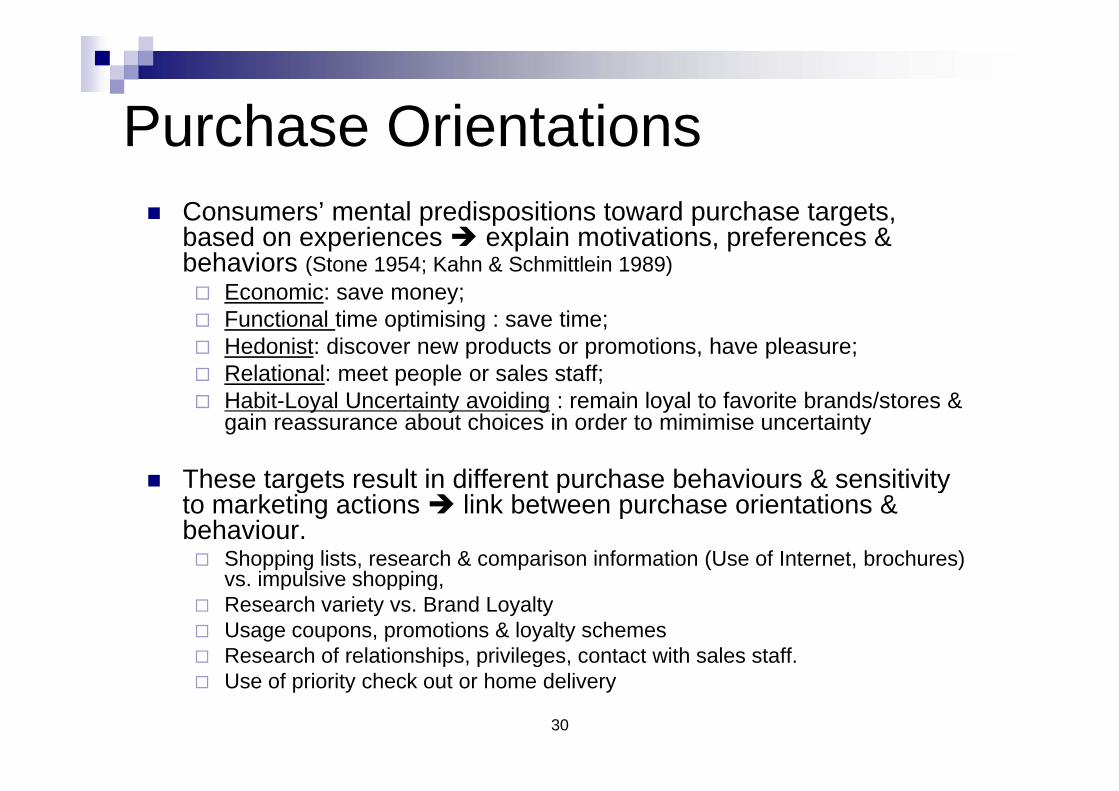
Purchase OrientationsPurchase Orientations Consumers’ mental predispositions toward purchase targets Consumers mental predispositions toward purchase targets,
based on experiences explain motivations, preferences & behaviors (Stone 1954; Kahn & Schmittlein 1989) Economic: save money; Functional time optimising : save time; Hedonist: discover new products or promotions, have pleasure; Relational: meet people or sales staff; H bit L l U t i t idi i l l t f it b d / t & Habit-Loyal Uncertainty avoiding : remain loyal to favorite brands/stores &
gain reassurance about choices in order to mimimise uncertainty
These targets result in different purchase behaviours & sensitivity These targets result in different purchase behaviours & sensitivity to marketing actions link between purchase orientations & behaviour. Shopping lists, research & comparison information (Use of Internet, brochures)
vs impulsive shoppingvs. impulsive shopping, Research variety vs. Brand Loyalty Usage coupons, promotions & loyalty schemes Research of relationships, privileges, contact with sales staff.
30
p , p g , Use of priority check out or home delivery
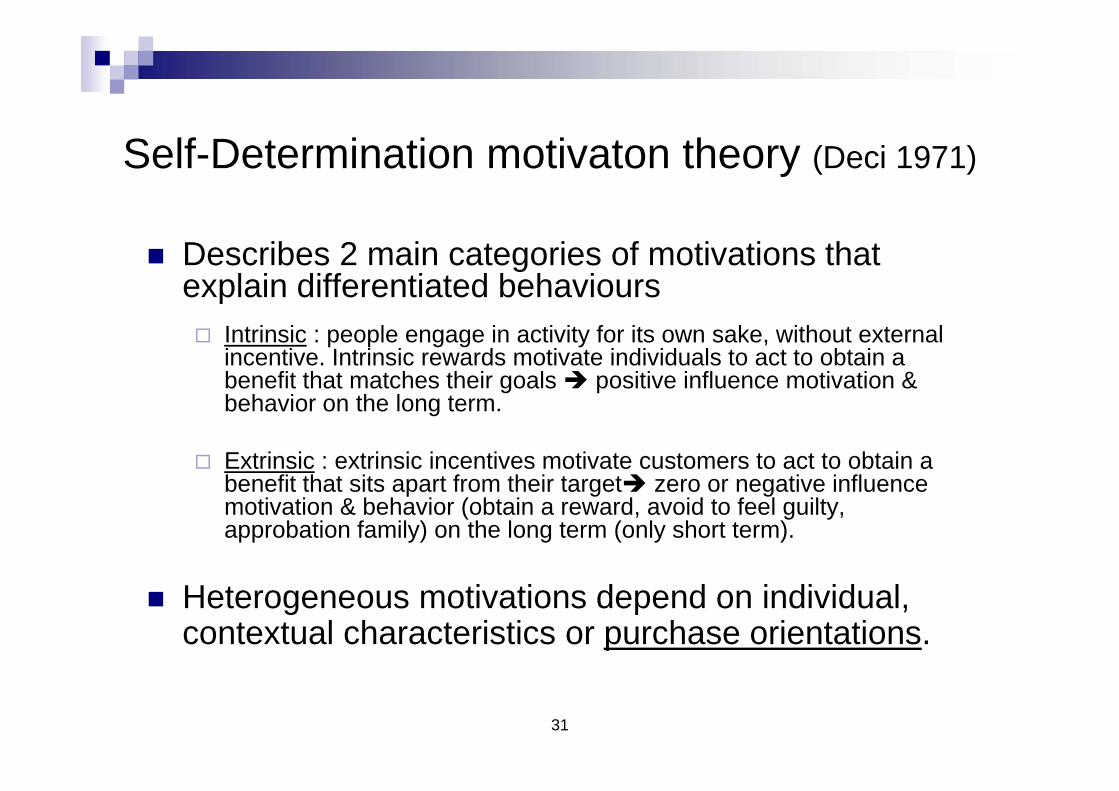
Self-Determination motivaton theory (Deci 1971)
Describes 2 main categories of motivations that explain differentiated behaviours Intrinsic : people engage in activity for its own sake, without external
incentive. Intrinsic rewards motivate individuals to act to obtain a benefit that matches their goals positive influence motivation & b h i th l tbehavior on the long term.
Extrinsic : extrinsic incentives motivate customers to act to obtain a benefit that sits apart from their target zero or negative influencebenefit that sits apart from their target zero or negative influence motivation & behavior (obtain a reward, avoid to feel guilty, approbation family) on the long term (only short term).
Heterogeneous motivations depend on individual, contextual characteristics or purchase orientations.
31
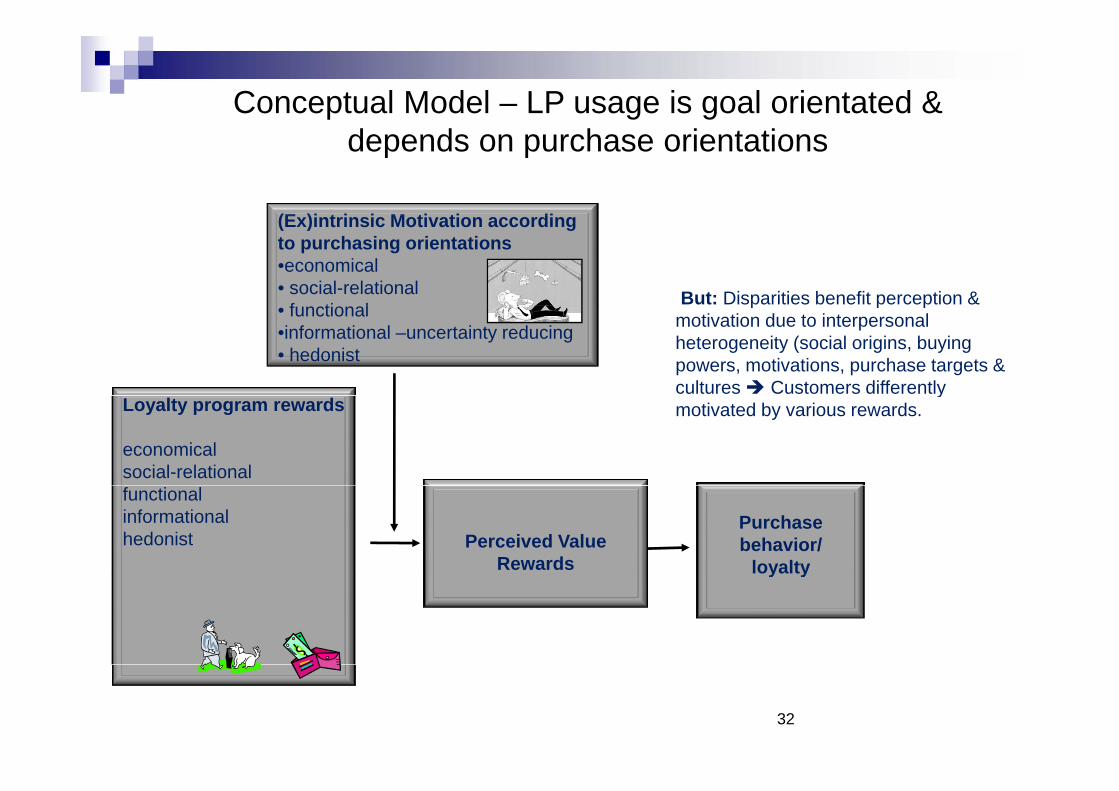
Conceptual Model – LP usage is goal orientated & depends on purchase orientations
(E )i t i i M ti ti di
But: Disparities benefit perception &
(Ex)intrinsic Motivation according to purchasing orientations•economical• social-relational
f ti l p p pmotivation due to interpersonal heterogeneity (social origins, buying powers, motivations, purchase targets & cultures Customers differently
• functional•informational –uncertainty reducing• hedonist
ymotivated by various rewards.Loyalty program rewards
economical social-relational
Purchase behavior/
loyaltyPerceived Value
Rewards
functionalinformationalhedonist
y y
32
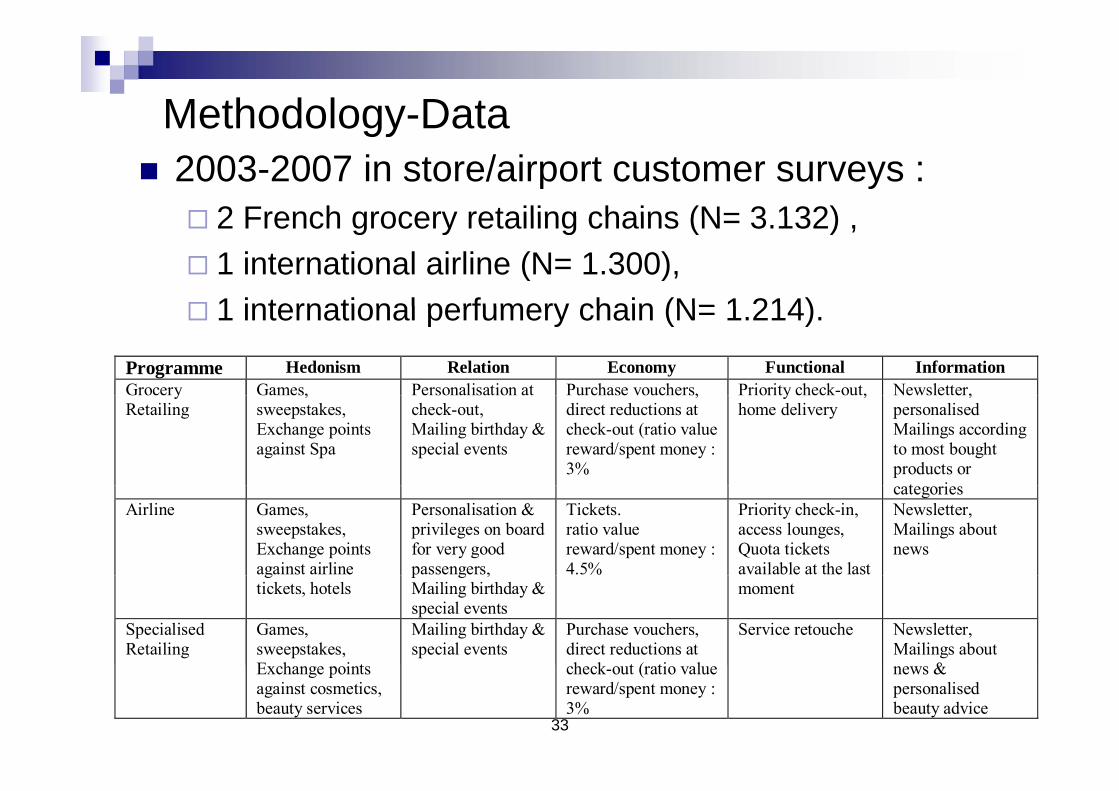
Methodology-DataMethodology Data 2003-2007 in store/airport customer surveys :
2 French grocery retailing chains (N= 3 132) 2 French grocery retailing chains (N= 3.132) , 1 international airline (N= 1.300), 1 international perfumery chain (N= 1 214) 1 international perfumery chain (N= 1.214).
Programme Hedonism Relation Economy Functional Information Grocery Games, Personalisation at Purchase vouchers, Priority check-out, Newsletter, yRetailing
,sweepstakes, Exchange points against Spa
check-out, Mailing birthday & special events
,direct reductions at check-out (ratio value reward/spent money : 3%
y ,home delivery
,personalised Mailings according to most bought products or
t icategoriesAirline Games,
sweepstakes, Exchange points against airline
Personalisation & privileges on board for very good passengers,
Tickets. ratio value reward/spent money : 4.5%
Priority check-in, access lounges, Quota tickets available at the last
Newsletter, Mailings about news
gtickets, hotels
p g ,Mailing birthday & special events
moment
Specialised Retailing
Games, sweepstakes, E h i t
Mailing birthday & special events
Purchase vouchers, direct reductions at h k t ( ti l
Service retouche
Newsletter, Mailings about
&
33
Exchange points against cosmetics, beauty services
check-out (ratio value reward/spent money : 3%
news & personalised beauty advice
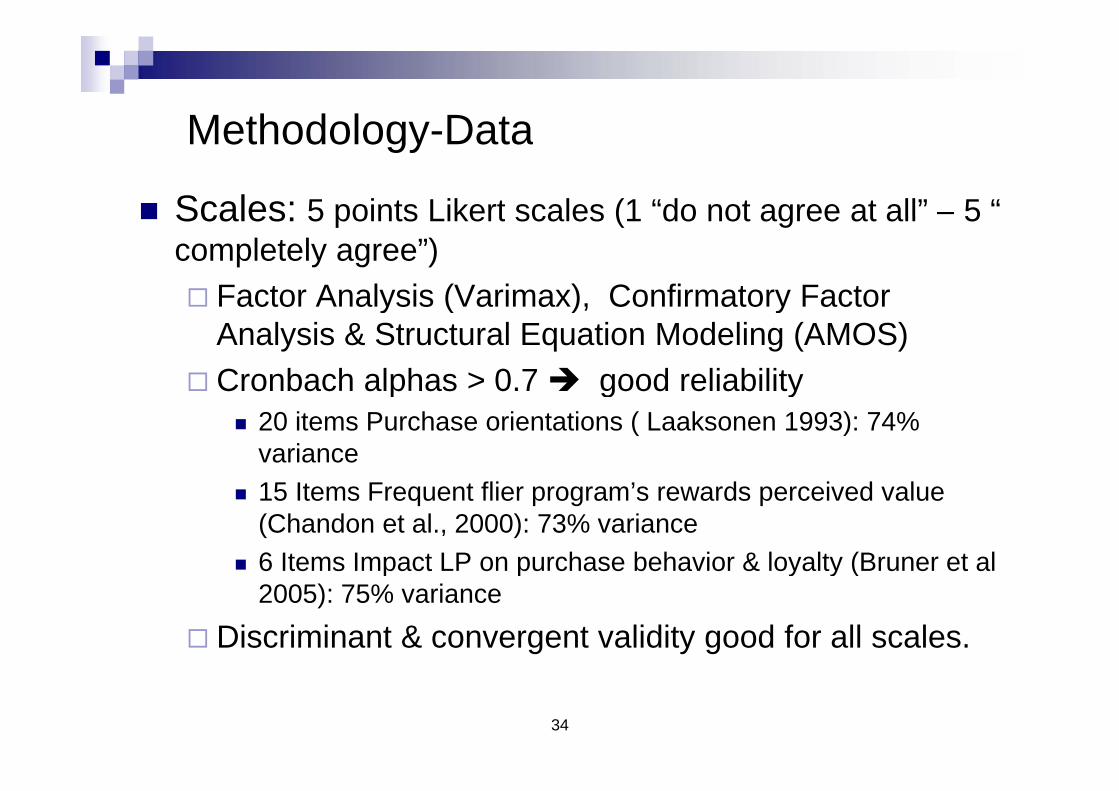
Methodology DataMethodology-Data
Scales: 5 points Likert scales (1 “do not agree at all” – 5 “ Scales: 5 points Likert scales (1 do not agree at all 5 completely agree”) Factor Analysis (Varimax), Confirmatory Factor Factor Analysis (Varimax), Confirmatory Factor
Analysis & Structural Equation Modeling (AMOS) Cronbach alphas > 0.7 good reliability p g y
20 items Purchase orientations ( Laaksonen 1993): 74% variance15 It F t fli ’ d i d l 15 Items Frequent flier program’s rewards perceived value (Chandon et al., 2000): 73% variance
6 Items Impact LP on purchase behavior & loyalty (Bruner et al p p y y (2005): 75% variance
Discriminant & convergent validity good for all scales.
34
Methodology – Estimation (1)
1. Estimation a base model (without purchase ( porientations or restrictions)
2. Estimation by taking different purchase orientations into account, fit by sector for the validation sample.
3. Estimation extended model to fit the holdout sample.
35

Methodology– Estimation (2)
In all sectors &both extended models, indexes of adjustment are better than those for the base model.
• The GFI and AGFI >.9, RMSEA <.05., Chi 2 (CMIN) decreases from the base model to the extended modelsdecreases from the base model to the extended models, indicating a better fit of the more complex models that include purchase orientations.A Chi 2 diff t t l diff (CMIN 1)• A Chi 2 difference test reveals no difference (CMIN, p >.1) between the validation and holdout samples; thus, the model displays measurement invariance.
36
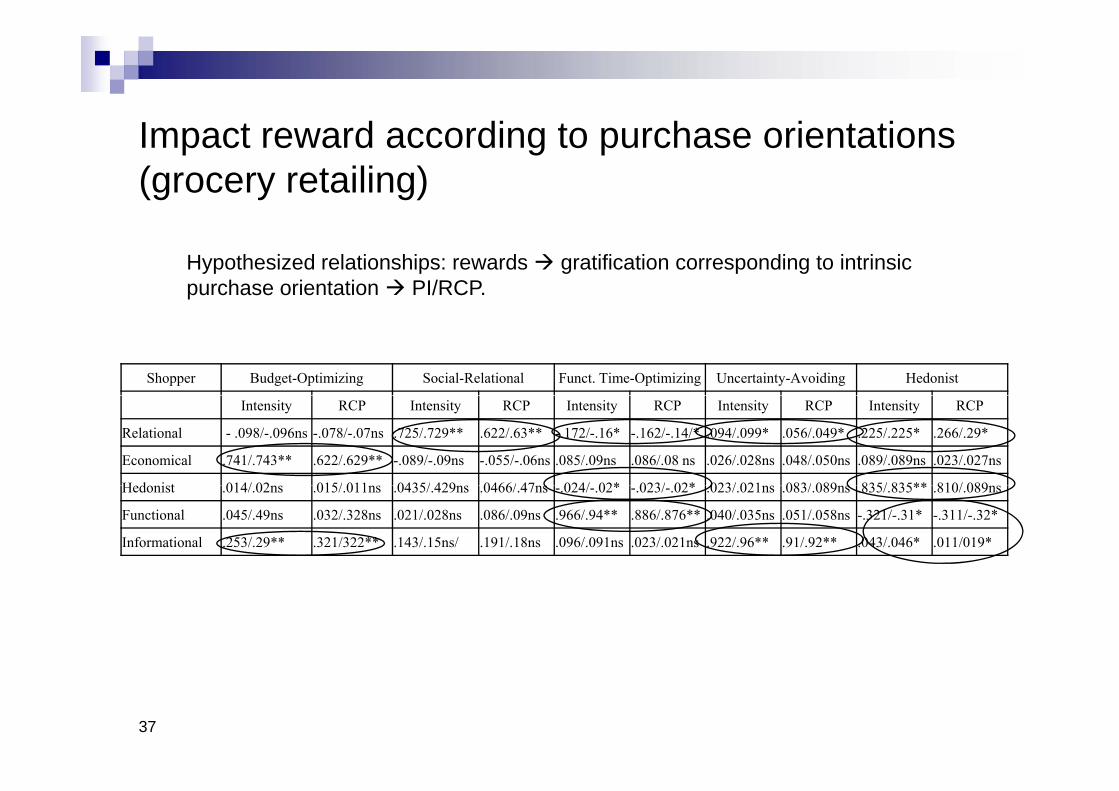
I t d di t h i t tiImpact reward according to purchase orientations (grocery retailing)
Hypothesized relationships: rewards gratification corresponding to intrinsic purchase orientation PI/RCP.
Shopper Budget-Optimizing Social-Relational Funct. Time-Optimizing Uncertainty-Avoiding Hedonist
Intensity RCP Intensity RCP Intensity RCP Intensity RCP Intensity RCP
Relational - .098/-.096ns -.078/-.07ns .725/.729** .622/.63** -.172/-.16* -.162/-.14/* .094/.099* .056/.049* .225/.225* .266/.29*
Economical .741/.743** .622/.629** -.089/-.09ns -.055/-.06ns .085/.09ns .086/.08 ns .026/.028ns .048/.050ns .089/.089ns .023/.027ns
H d i t 014/ 02 015/ 011 0435/ 429 0466/ 47 024/ 02* 023/ 02* 023/ 021 083/ 089 835/ 835** 810/ 089Hedonist .014/.02ns .015/.011ns .0435/.429ns .0466/.47ns -.024/-.02* -.023/-.02* .023/.021ns .083/.089ns .835/.835** .810/.089ns
Functional .045/.49ns .032/.328ns .021/.028ns .086/.09ns .966/.94** .886/.876** .040/.035ns .051/.058ns -.321/-.31* -.311/-.32*
Informational .253/.29** .321/322** .143/.15ns/ .191/.18ns .096/.091ns .023/.021ns .922/.96** .91/.92** .043/.046* .011/019*
37
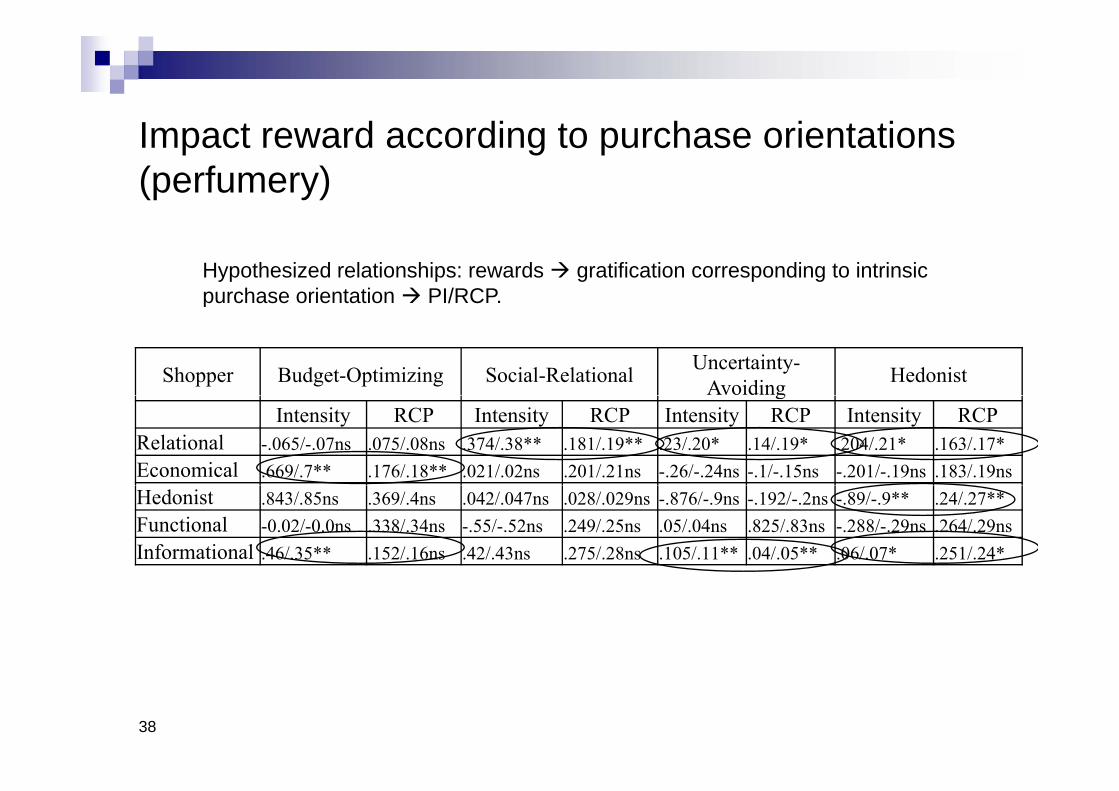
I t d di t h i t tiImpact reward according to purchase orientations (perfumery)
Hypothesized relationships: rewards gratification corresponding to intrinsic purchase orientation PI/RCP.
Shopper Budget-Optimizing Social-Relational Uncertainty-Avoiding Hedonist
p
gIntensity RCP Intensity RCP Intensity RCP Intensity RCP
Relational -.065/-.07ns .075/.08ns .374/.38** .181/.19** .23/.20* .14/.19* .204/.21* .163/.17*Economical .669/.7** .176/.18** .021/.02ns .201/.21ns -.26/-.24ns -.1/-.15ns -.201/-.19ns .183/.19nsHedonist .843/.85ns .369/.4ns .042/.047ns .028/.029ns -.876/-.9ns -.192/-.2ns -.89/-.9** .24/.27**Functional -0.02/-0.0ns .338/.34ns -.55/-.52ns .249/.25ns .05/.04ns .825/.83ns -.288/-.29ns .264/.29nsInformational .46/.35** .152/.16ns .42/.43ns .275/.28ns .105/.11** .04/.05** .06/.07* .251/.24*
38

I t d di t h i t tiImpact reward according to purchase orientations (airline)
Hypothesized relationships: rewards gratification corresponding to intrinsic purchase orientation PI/RCP.
Shopper Budget Optimizing
Social-Relational
Uncertainty avoiding Hedonist
Reward PI RCP PI RCP PI RCP PI RCP Relational .08 .2ns .52** .62** .3* .36* .08* .09* Budg Optim 56** 34** 15ns 18ns 11ns 23ns 18ns 29nsBudg.-Optim. .56** .34** .15ns .18ns .11ns .23ns .18ns .29ns Hedonist .10ns .21ns .15* .16* .346ns .23ns .41** .52** Functional .05ns .07ns .21ns .23ns .041** .1** -.03ns -.01ns Informational .06ns .05ns .11ns .13ns .12** .17** .42* .36*
** p < .01,* p < .05, ns: not significant. Purchase intensity (PI), resistance against counter-persuasion (RCP)
39
persuasion (RCP)

Impact personalised rewards on purchase pac pe so a sed e a ds o pu c asebehaviour according to purchase orientations 1 If reward corresponds to intrinsic motivation (related to 1. If reward corresponds to intrinsic motivation (related to
purchase orientation) positive impact on behaviour. 2. If reward corresponds to extrinsic motivation (not 2. If reward corresponds to extrinsic motivation (not
related to purchase orientation) zero/negative impact on behaviour.
Purchase Orientation Econo Relatio Fonctio Habit Hedo Econo-mical
Relatio-nal
Fonctio-nal
Habit-Loyal
Hedo-nistic
Ident. Relational 0 ++ - 0 +Economical ++ 0 0 0 0
Rew
ard Hedonical 0 + - 0 ++
Fonctional 0 0 ++ 0 0
Distr -Inform + 0 + ++ 0
40
R Distr. Inform. + 0 + ++ 0
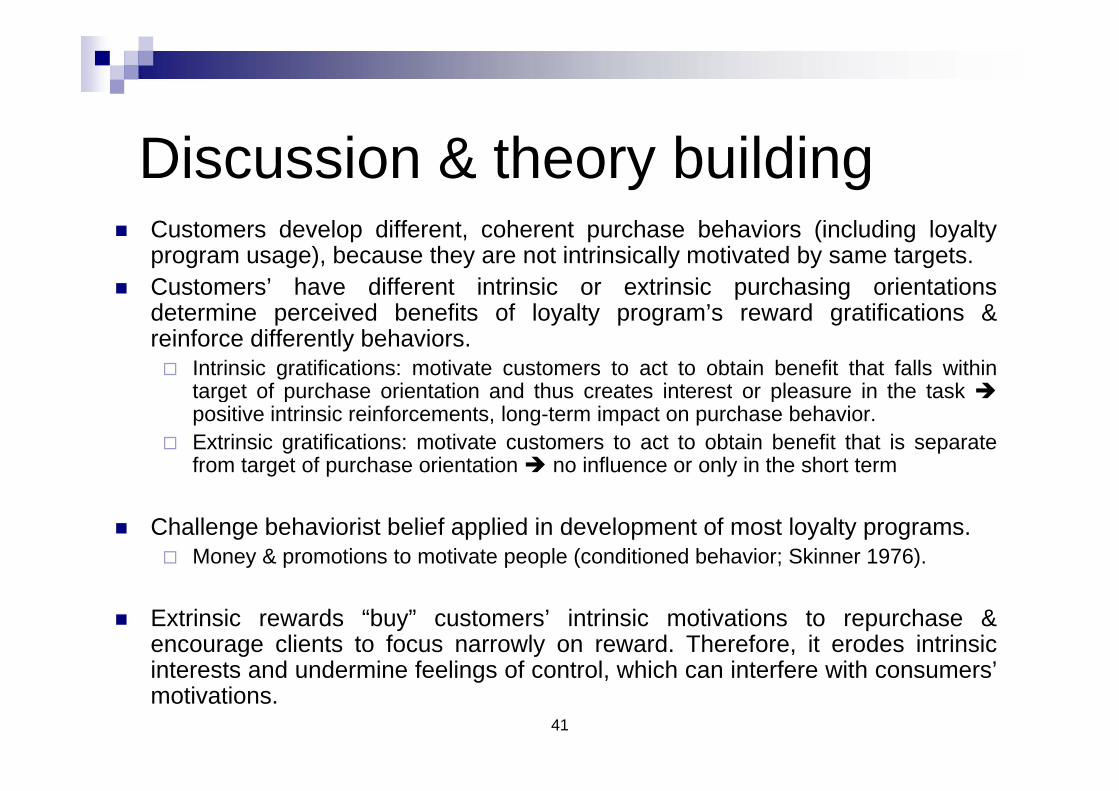
Discussion & theory building Customers develop different, coherent purchase behaviors (including loyalty
program usage), because they are not intrinsically motivated by same targets. Customers’ have different intrinsic or extrinsic purchasing orientations
d t i i d b fit f l lt ’ d tifi ti &determine perceived benefits of loyalty program’s reward gratifications &reinforce differently behaviors. Intrinsic gratifications: motivate customers to act to obtain benefit that falls within
target of purchase orientation and thus creates interest or pleasure in the task target of purchase orientation and thus creates interest or pleasure in the task positive intrinsic reinforcements, long-term impact on purchase behavior.
Extrinsic gratifications: motivate customers to act to obtain benefit that is separatefrom target of purchase orientation no influence or only in the short term
Challenge behaviorist belief applied in development of most loyalty programs. Money & promotions to motivate people (conditioned behavior; Skinner 1976).
Extrinsic rewards “buy” customers’ intrinsic motivations to repurchase &encourage clients to focus narrowly on reward. Therefore, it erodes intrinsici t t d d i f li f t l hi h i t f ith ’
41
interests and undermine feelings of control, which can interfere with consumers’motivations.

Managerial Implications Strong customer heterogeneity & absence of segmentation
in existing loyalty schemes causes inefficiencyP i i l l f l lt id tif & t Principal role of loyalty programs : identify & segmentcustomers to improve resource allocations.
Segmentation according to consumers’ purchase Segmentation according to consumers purchaseorientations. Thorough analysis of loyalty schemes’ effects, at individual level, Thorough analysis of loyalty schemes effects, at individual level,
because consumer characteristics (e.g., shopping orientations)influence strength and direction of their impact on loyalty.
With such information firms can undertake tailored strategies & With such information, firms can undertake tailored strategies &incentives (e.g., promotions, rewards, communication, pricediscrimination) to appeal to different segments and retain their
42
patronage.
Limitations & further researchLimitations & further research (1st investigation) ( g ) The effectiveness of loyalty programs likely depends on the
product category or sector. Our results are specific to retail d b bl b li d hgrocers and probably cannot be generalized to other sectors
(e.g., baby products, airlines, clothing).
Convex reward systems & multitier programs might be more efficient in such contexts (Nunes & Dreze 2006).
Further research in other areas should test how these and other factors influence program effectiveness, though such efforts might be difficult in industries that lack marketwideefforts might be difficult in industries that lack marketwidescanner-panel data on competitive purchasing.
43
Limitations & further researchLimitations & further research (2nd investigation) ( g ) Over-simplification classification purchasing motivations & rewards:
Difficulty to classify rewards exactly & uniquely to one category of tifi ti b th i ht ti f l h t t t thgratification, because they might satisfy several purchase targets at the
same time. Exact hypotheses about intrinsic/extrinsic nature of a reward are difficult to
formulate as purchase orientations are multidimensional and not hermetical segment overlaps (i.e., hedonist-relational, hedonist-economical).
Theory intrinsic motivation has been established for creative tasks. Thus the more an activity is complex, the more negative the impact of extrinsic rewards is Intrinsic interest declines when rewardingextrinsic rewards is. Intrinsic interest declines when rewarding somebody by extrinsic rewards (studies in pedagogies seem to confirm this hypothesis)
44
Behaviorism still works in restrictive contexts for uninteresting, unpleasant tasks, as grocery shopping (McGraw & McCullers 1979)
Loyalty Programs: Shackle orLoyalty Programs: Shackle or Reward
Grocery loyalty programs as they exist today fall short in terms of creating loyalty
Loyalty programs focusing on incentives, deals, and promotions are often a tl iti f th fivery costly proposition for the firm
“LPs that are most likely to provide sustainable competitive advantage are LPs that are most likely to provide sustainable competitive advantage are those that leverage data obtained from consumers into more effective marketing decisions and thus result in true value creation for customers. Loyalty is likely to follow”
Thank you for yourThank you for your attentionattention
meyerwaarden@em-strasbourg eustrasbourg.eu
46
Vector autoregressive (VAR) persistence modeling to test thepersistence modeling to test the long term effects of marketing actions – The case of a loyaltyactions The case of a loyalty program
47
M th d l Th lMethodology – The sample
Match of BehaviorScan single source panel data with Match of BehaviorScan single source panel data with grocery retailer store data (Angers, France)
546 loyalty program members over a 156-week period (week 2/1999 - week 2/2002)
Use of weekly data to test the effect of the following behavioral variables: e.g. frequency of purchase, share-of wallet (SOW) mean basket in the storeof-wallet (SOW), mean basket in the store
To integrate the effect of the loyalty program, weTo integrate the effect of the loyalty program, we considered the number of new loyalty cards distributed, which regularly increased over time.
48
Methodology - Persistence modeling to model long term impact of LP’s (Dekimpe & Hanssens 1995)
Unit-root tests: to investigate presence of evolutiong pvs stability for purchasing behavior indicators
VAR (Vector Auto Regressive) models, causality tests & Impulse response functions: To assess potential long-term impact of N loyalty cards distributed at each
i d d P ti f l lt d d d iperiod and Proportion of loyalty cards used during future periods on behavioral variables (i.e. SOW, frequency of purchase mean basket)frequency of purchase, mean basket)
VAR model estimation: JMulti [http://www.jmulti.de] (Lütkepohl & Krätzig 2008)
49
( p g )
1. Unit Root Tests Rejection of unit-root null hypothesis as data is stationary
(as overwhelming majority of demand patterns; Dekimpe et al. 2001).Th l lt i di t fl t t d fi d l l The loyalty indicators fluctuate around a fixed mean level no long-run evolving effects in data impact of past shocks is temporary, diminishes & loyalty indicators
return to their preshock mean levels (i e stability)return to their preshock mean levels (i.e., stability).
But problem of unit-root tests:p
Indicate only potential for long-run marketing effectivenessB h i l i bl & LP b hi d Behavioral variables & LP membership are endogenous(i.e., explained by own past level & past levels of otherendogenous variables).
50
g )
2 VAR models to trace over time impact of2. VAR models to trace over-time impact of unexpected shock movements (1)
To assess potential l/t impact of marketing actions (i.e. LP)
Estimation vector-autoregressive (VAR) model thatcaptures evolution & interdependencies of multiple time
i (“SOW F f h M b k t N fseries (“SOW, Frequency of purchase, Mean basket, N ofloyalty cards distributed at each period, Proportion ofloyalty cards used during future periods”).y y g p )
VAR models measure direct (immediate & lagged)responses to marketing actions and capture performanceresponses to marketing actions and capture performanceimplications of complex feedback loops.
51

2. VAR models to trace over-time impact2. VAR models to trace over time impact of unexpected shock movements (2)
VAR models estimate baseline of eachendogenous variable & forecast future valuesaccording to dynamic interactions of all jointlyendogenous variables.
Criteria for optimal number of lags : Akaike information, Hannan-Quinn, Schwarz criteria, Final prediction error.
52
2 VAR models (3) -Causality tests2. VAR models (3) -Causality tests
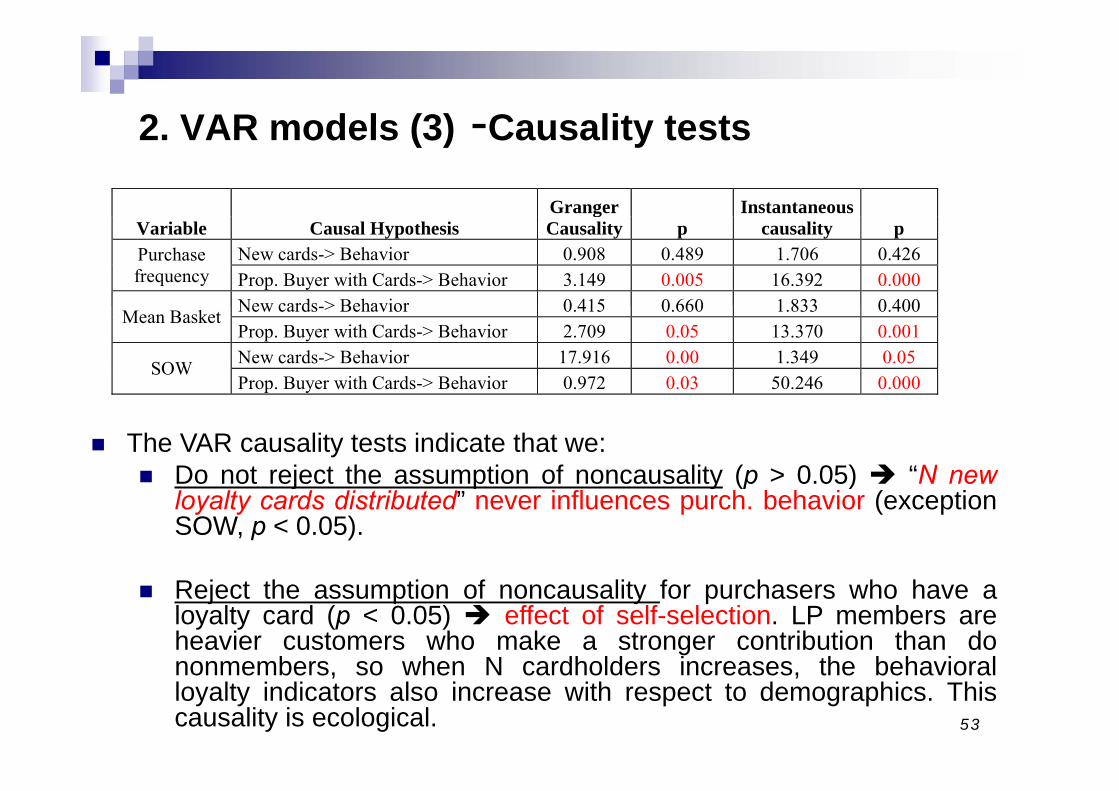
Granger Instantaneous Variable Causal Hypothesis
gCausality p causality p
Purchase frequency
New cards-> Behavior 0.908 0.489 1.706 0.426 Prop. Buyer with Cards-> Behavior 3.149 0.005 16.392 0.000 New cards > Behavior 0 415 0 660 1 833 0 400Mean Basket New cards-> Behavior 0.415 0.660 1.833 0.400Prop. Buyer with Cards-> Behavior 2.709 0.05 13.370 0.001
SOW New cards-> Behavior 17.916 0.00 1.349 0.05 Prop. Buyer with Cards-> Behavior 0.972 0.03 50.246 0.000
The VAR causality tests indicate that we: Do not reject the assumption of noncausality (p > 0.05) “N new
j p y (p )loyalty cards distributed” never influences purch. behavior (exceptionSOW, p < 0.05).
Reject the assumption of noncausality for purchasers who have aloyalty card (p < 0.05) effect of self-selection. LP members areheavier customers who make a stronger contribution than dononmembers so when N cardholders increases the behavioral
53
nonmembers, so when N cardholders increases, the behavioralloyalty indicators also increase with respect to demographics. Thiscausality is ecological.
2. VAR forecast error variance decomposition (1)
Th t t i l th t i ht li i t th N f The tests imply that we might eliminate the N of new cards distributed from the VAR models (However, use of the variable as an exploratory target to obtain impulse p y g presponse functions and to examine their shapes.
We calculated VAR forecast error variance decomposition for purchase frequency, SOW, and mean basket, as well as the impact of the introduction of the loyalty card on theas the impact of the introduction of the loyalty card on the same purchasing behavior variables.
54
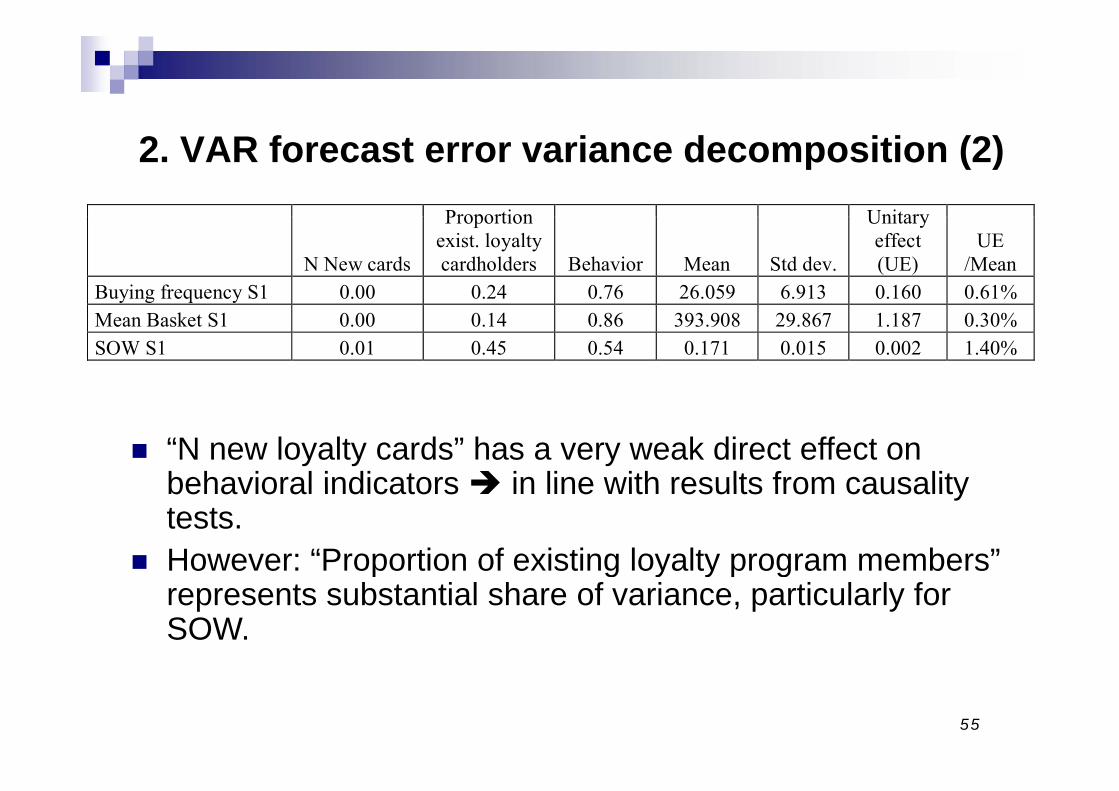
2. VAR forecast error variance decomposition (2)Proportion Unitary
N New cards
Proportion exist. loyalty cardholders Behavior Mean Std dev.
Unitary effect (UE)
UE /Mean
Buying frequency S1 0.00 0.24 0.76 26.059 6.913 0.160 0.61% Mean Basket S1 0.00 0.14 0.86 393.908 29.867 1.187 0.30% SOW S1 0.01 0.45 0.54 0.171 0.015 0.002 1.40%
“N new loyalty cards” has a very weak direct effect on behavioral indicators in line with results from causalitybehavioral indicators in line with results from causality tests.
However: “Proportion of existing loyalty program members” p g y y p grepresents substantial share of variance, particularly for SOW.
55
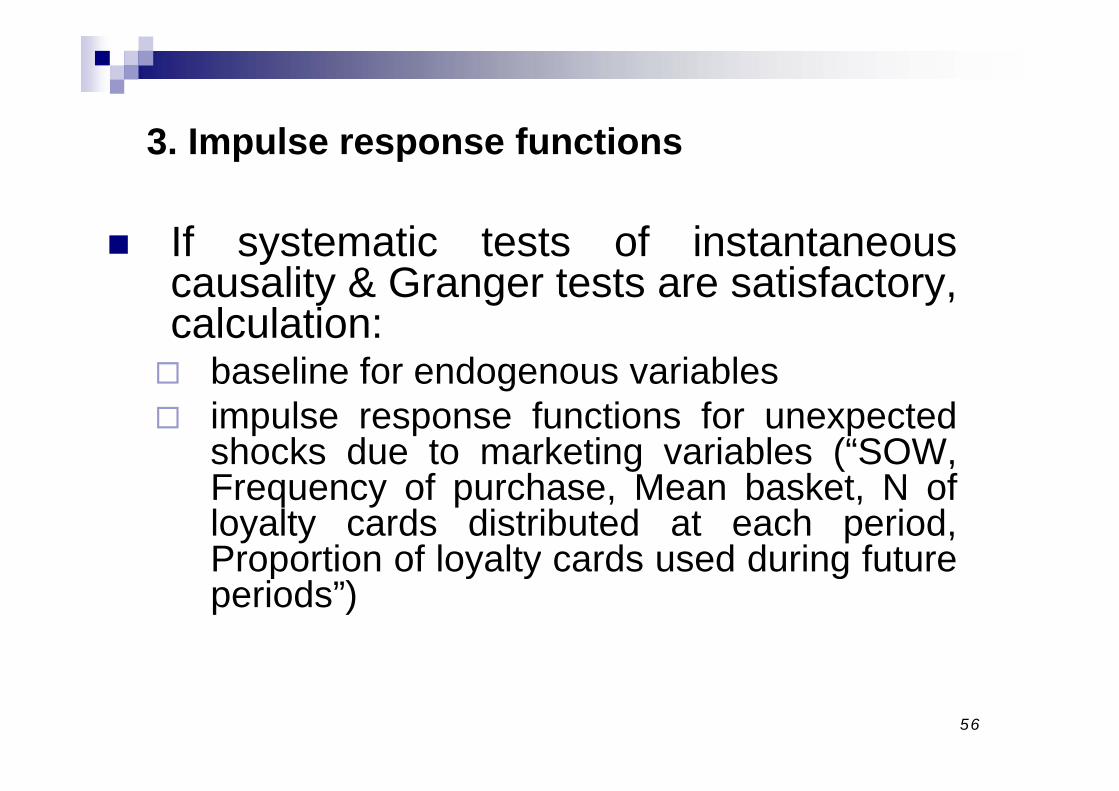
3. Impulse response functions
If systematic tests of instantaneouscausality & Granger tests are satisfactory,y g ycalculation: baseline for endogenous variables impulse response functions for unexpected
shocks due to marketing variables (“SOW,Frequency of purchase Mean basket N ofFrequency of purchase, Mean basket, N ofloyalty cards distributed at each period,Proportion of loyalty cards used during futurep y y gperiods”)
56
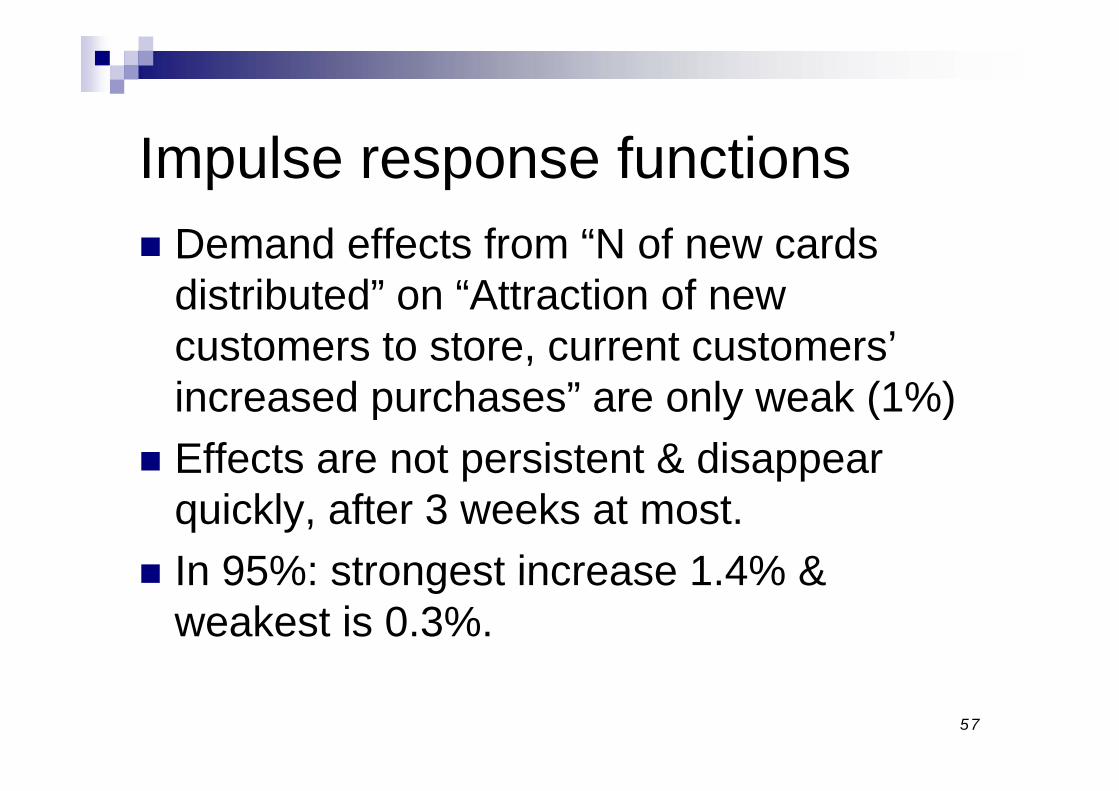
Impulse response functions Demand effects from “N of new cards
distributed” on “Attraction of newdistributed on Attraction of new customers to store, current customers’ increased purchases” are only weak (1%)increased purchases are only weak (1%)
Effects are not persistent & disappear quickly, after 3 weeks at most.
In 95%: strongest increase 1 4% & In 95%: strongest increase 1.4% & weakest is 0.3%.
57
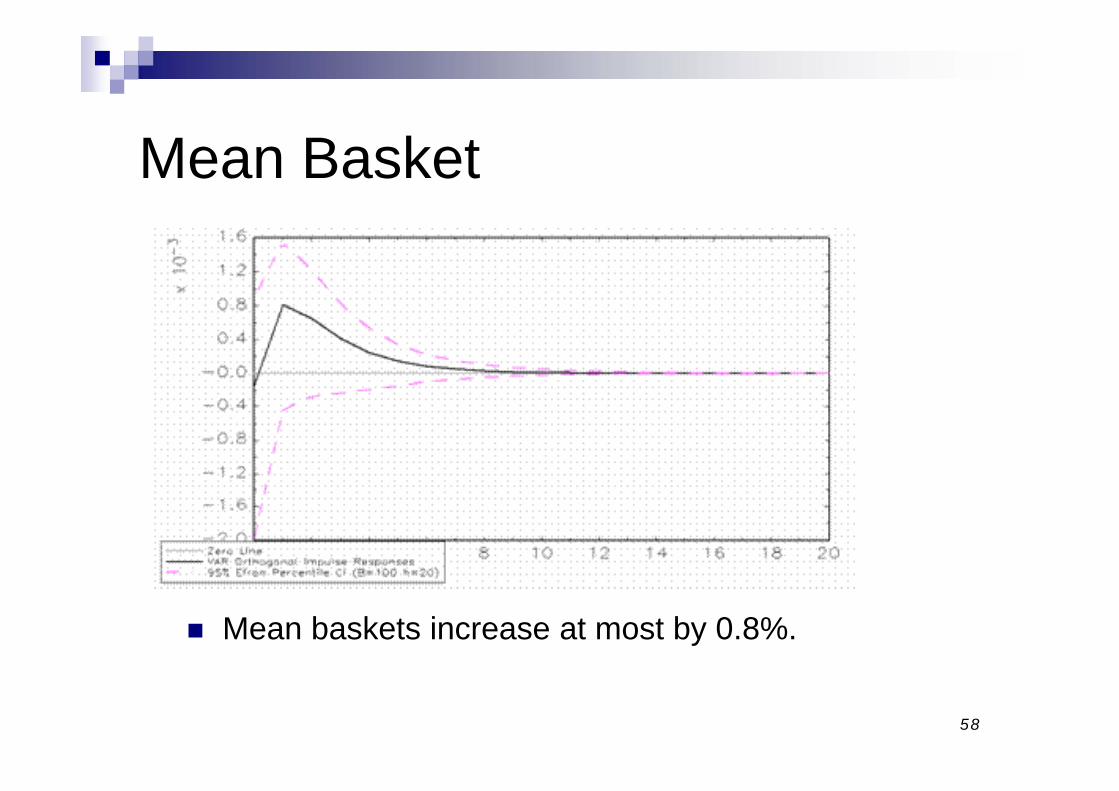
Mean Basket
Mean baskets increase at most by 0.8%.
58
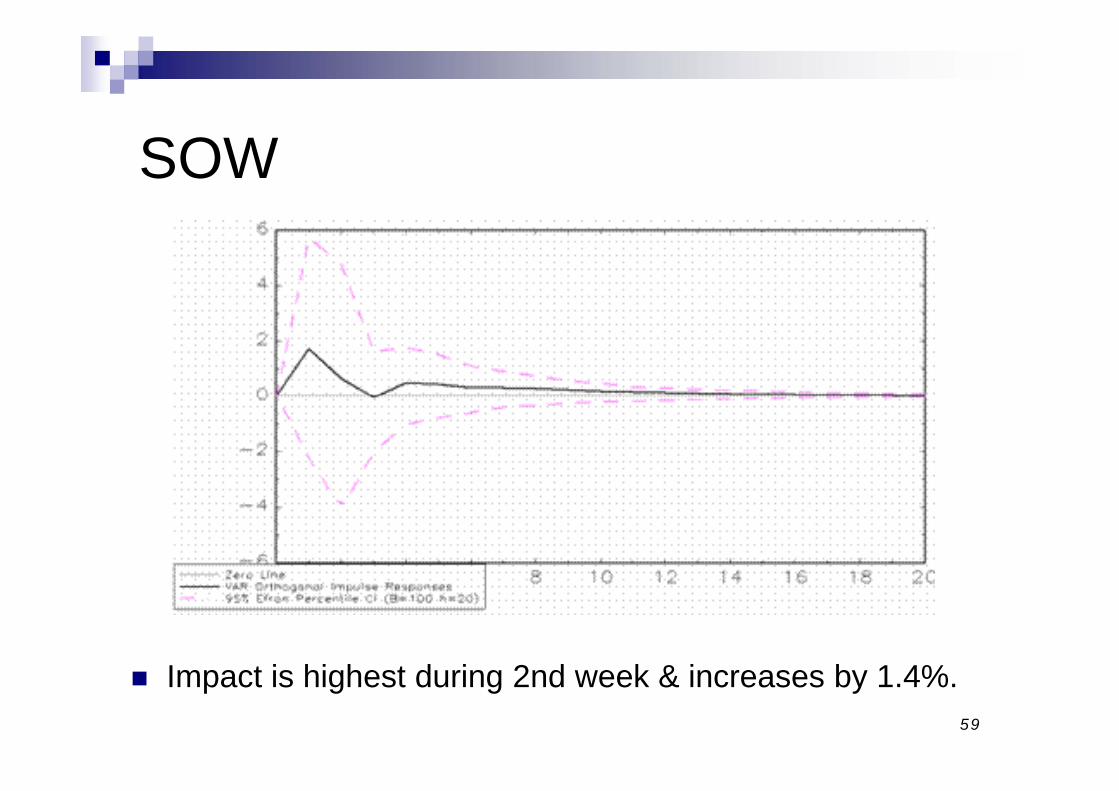
SOW
I t i hi h t d i 2 d k & i b 1 4%59
Impact is highest during 2nd week & increases by 1.4%.
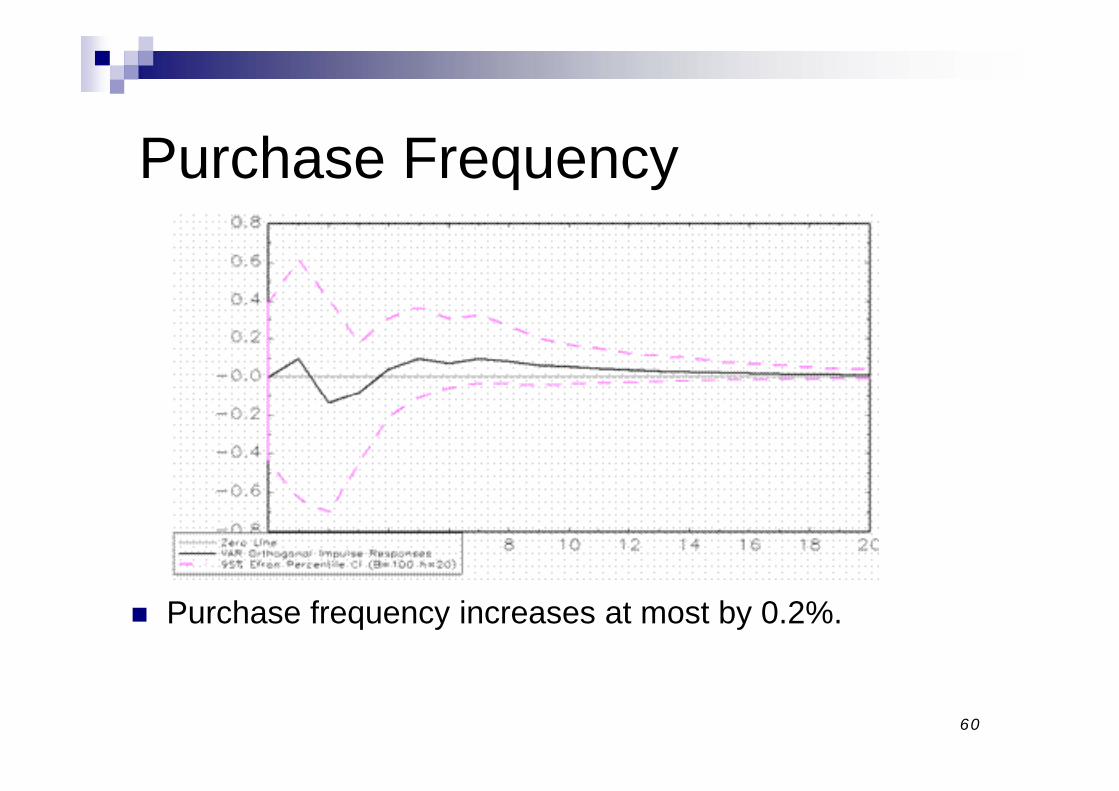
Purchase Frequency
Purchase frequency increases at most by 0.2%.
60
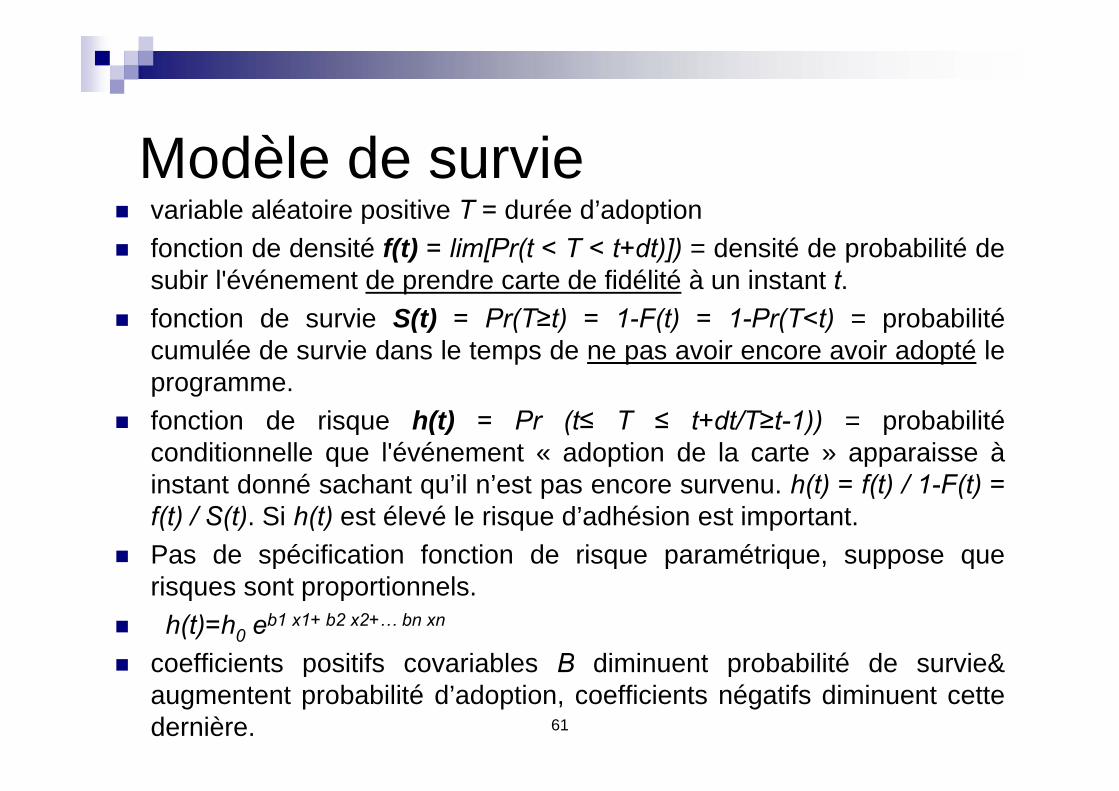
Modèle de survie variable aléatoire positive T = durée d’adoption variable aléatoire positive T durée d adoption fonction de densité f(t) = lim[Pr(t < T < t+dt)]) = densité de probabilité de
subir l'événement de prendre carte de fidélité à un instant t. fonction de survie S(t) = Pr(T≥t) = 1-F(t) = 1-Pr(T<t) = probabilité
cumulée de survie dans le temps de ne pas avoir encore avoir adopté leprogramme.p g
fonction de risque h(t) = Pr (t≤ T ≤ t+dt/T≥t-1)) = probabilitéconditionnelle que l'événement « adoption de la carte » apparaisse àinstant donné sachant qu’il n’est pas encore survenu h(t) = f(t) / 1-F(t) =instant donné sachant qu il n est pas encore survenu. h(t) = f(t) / 1-F(t) =f(t) / S(t). Si h(t) est élevé le risque d’adhésion est important.
Pas de spécification fonction de risque paramétrique, suppose querisques sont proportionnels.
h(t)=h0 eb1 x1+ b2 x2+… bn xn
coefficients positifs covariables B diminuent probabilité de survie&
61
coefficients positifs covariables B diminuent probabilité de survie&augmentent probabilité d’adoption, coefficients négatifs diminuent cettedernière.

Intensity before/after subscriptionIntensity before/after subscription
N t ti ti l i ifi t i t h i t itTrimester -3 -2 -1 0 1 2 3 Mean Basket Card Holder 76€ 74€ 75€ 80€ 83€ 79€ 76€
No statistical significant impact on purchase intensity.
Mean Basket No Card Holder 59€ 62€ 60€ 60€ 61€ 59€ 61€ p Time ns ns ns ns ns ns p Time*Card * ** ns ns ** * P h F C d H ld 12 12 12 14 14 13 12Purchse Frequency Card Holder 12 12 12 14 14 13 12Purchse Frequency No Card Holder
6 6 6 6 6 6 7
p Time ** ** ns ns ns ** p Time*Card ** ** ns ns ns **Interpurchase Time Card Holder 13 16 18 18 17 19 11 Interpurchase Time No Card Holder
24 42 47 51 53 61 71
p Time ** ** ns ns ns ns p Time*Card ** ns ns ns ns **
62
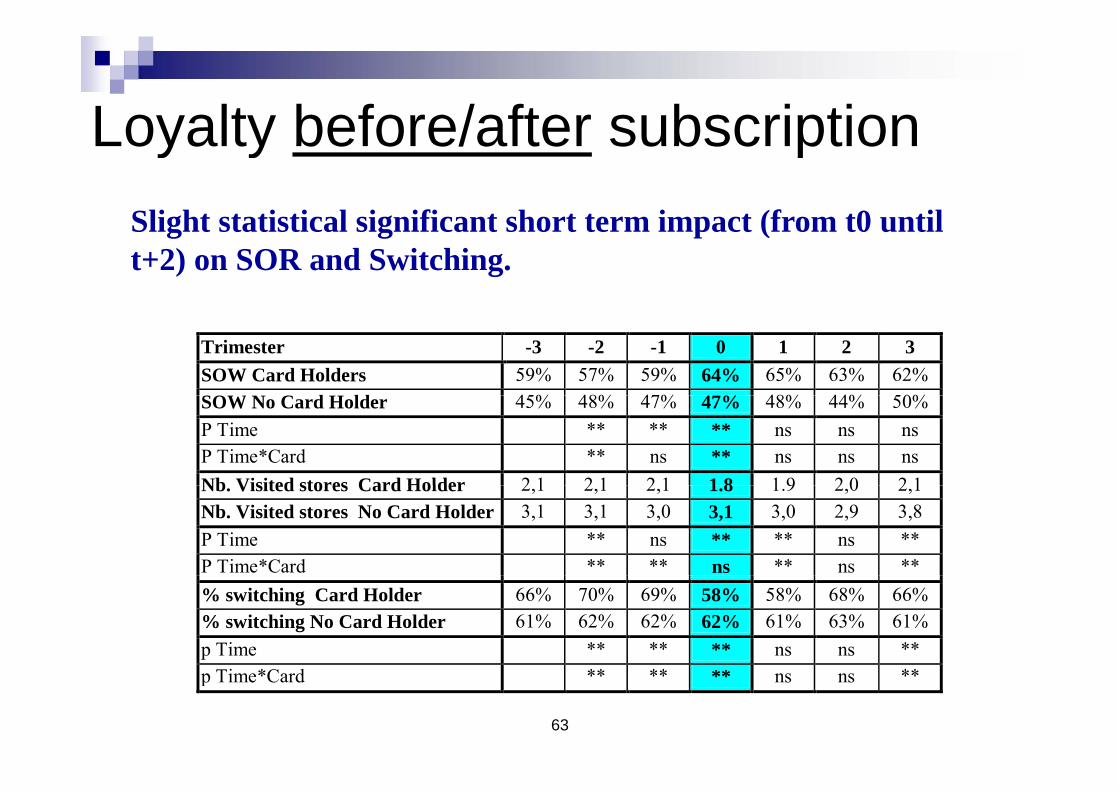
Loyalty before/after subscriptionLoyalty before/after subscriptionSli ht t ti ti l i ifi t h t t i t (f t0 tilSlight statistical significant short term impact (from t0 untilt+2) on SOR and Switching.
Trimester -3 -2 -1 0 1 2 3 SOW Card Holders 59% 57% 59% 64% 65% 63% 62% SOW N C d H ld 45% 48% 47% 47% 48% 44% 50%SOW No Card Holder 45% 48% 47% 47% 48% 44% 50%P Time ** ** ** ns ns ns P Time*Card ** ns ** ns ns ns Nb Visited stores Card Holder 2 1 2 1 2 1 1 8 1 9 2 0 2 1Nb. Visited stores Card Holder 2,1 2,1 2,1 1.8 1.9 2,0 2,1Nb. Visited stores No Card Holder 3,1 3,1 3,0 3,1 3,0 2,9 3,8 P Time ** ns ** ** ns ** P Time*Card ** ** ns ** ns **% switching Card Holder 66% 70% 69% 58% 58% 68% 66% % switching No Card Holder 61% 62% 62% 62% 61% 63% 61% p Time ** ** ** ns ns **
63
p Time*Card ** ** ** ns ns **
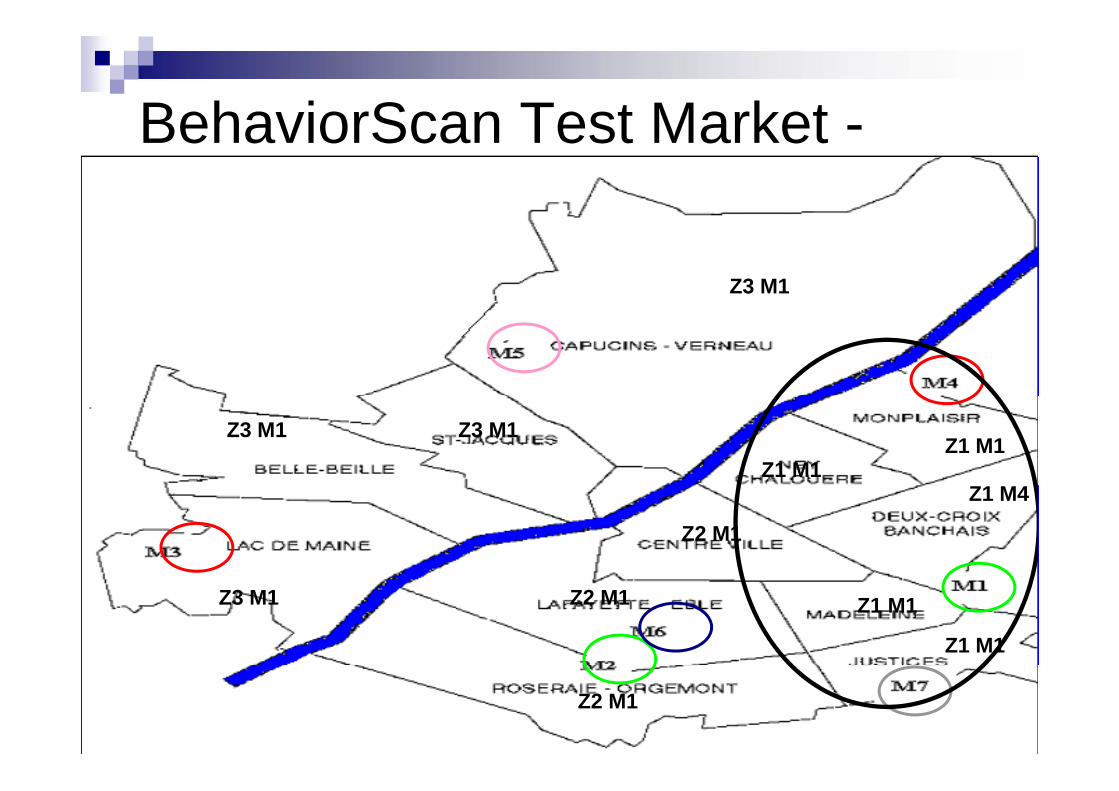
BehaviorScan Test Market -BehaviorScan Test Market -Angersg
Z3 M1
Z1 M1Z3 M1
Z1 M1
Z3 M1
Z1 M4
Z2 M1
Z1 M1
Z1 M1Z3 M1 Z2 M1
64Z2 M1