Embed Size (px)
Citation preview
Greystone Wealth Management
Quarterly Report
October 2017
Third quarter 2017
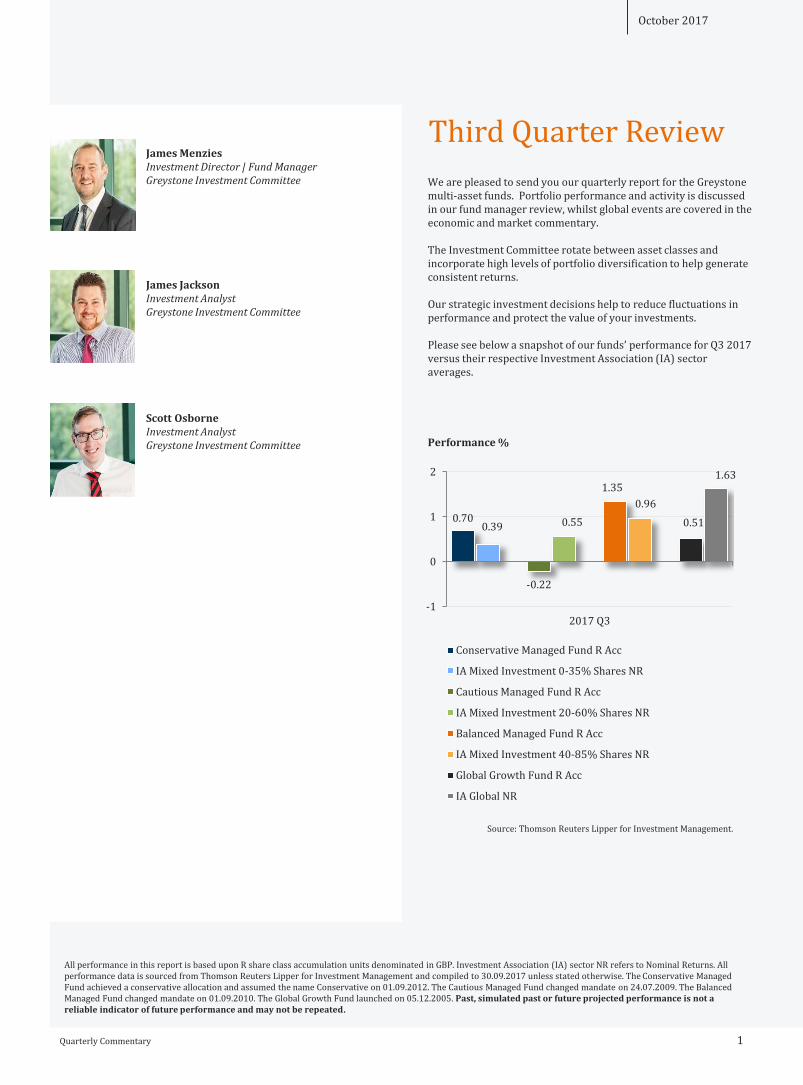
Conservative Managed Fund R Acc
IA Mixed Investment 0-35% Shares NR
Cautious Managed Fund R Acc
IA Mixed Investment 20-60% Shares NR
Balanced Managed Fund R Acc
IA Mixed Investment 40-85% Shares NR
Global Growth Fund R Acc
IA Global NR
0.700.39
-0.22
0.55
1.35
0.96
0.51
1.63
-1
0
1
2
2017 Q3
All performance in this report is based upon R share class accumulation units denominated in GBP. Investment Association (IA) sector NR refers to Nominal Returns. All performance data is sourced from Thomson Reuters Lipper for Investment Management and compiled to 30.09.2017 unless stated otherwise. The Conservative Managed Fund achieved a conservative allocation and assumed the name Conservative on 01.09.2012. The Cautious Managed Fund changed mandate on 24.07.2009. The Balanced Managed Fund changed mandate on 01.09.2010. The Global Growth Fund launched on 05.12.2005. Past, simulated past or future projected performance is not a reliable indicator of future performance and may not be repeated.
Quarterly Commentary 1
Third Quarter Review
Performance %
We are pleased to send you our quarterly report for the Greystone multi-asset funds. Portfolio performance and activity is discussed in our fund manager review, whilst global events are covered in the economic and market commentary.
The Investment Committee rotate between asset classes and incorporate high levels of portfolio diversification to help generate consistent returns.
Our strategic investment decisions help to reduce fluctuations in performance and protect the value of your investments.
Please see below a snapshot of our funds’ performance for Q3 2017 versus their respective Investment Association (IA) sector averages.
October 2017
Source: Thomson Reuters Lipper for Investment Management.
James MenziesInvestment Director | Fund ManagerGreystone Investment Committee
James JacksonInvestment AnalystGreystone Investment Committee
Scott OsborneInvestment AnalystGreystone Investment Committee

0
6
12
18
24
30
Sep/12 Sep/13 Sep/14 Sep/15 Sep/16 Sep/17
All performance in this report is based upon R share class accumulation units denominated in GBP. All performance data is sourced from Thomson Reuters Lipper for Investment Management and compiled to 30.09.2017. All Investment Association (IA) sector performance is Nominal Return (NR). The Conservative Managed Fund achieved a conservative allocation and assumed the name Conservative on 01.09.2012. *Data for 2012 shown for period 01.09.2012 to 31.12.2012 . The above are the views and opinions of the Greystone Investment Committee and are correct at the time of writing. Past, simulated past or future projected performance is not a reliable indicator of future performance and may not be repeated.
Fund Manager Commentary
Conservative Managed Fund
October 2017
Multi-asset Portfolios
Performance Summary
The fund rose 0.70% over the third quarter versus the Investment Association (IA) Mixed Investment 0-35% Shares sector average0.39% and the IA Money Market 0.03%.
Since the fund’s re-launch on 1st September 2012 it has delivered 27.18% versus the IA sector average 25.60% and IA Money Market 1.26%. The fund’s share price as at 30th September 2017 was; 122.88p (R share class accumulation units).
The fund continues to offer investors low risk access to investment markets and provides the opportunity to outperform inflation and cash rates over the course of an economic cycle.
Quarterly Commentary 2
Fund Review & Outlook
The fund’s objective is to deliver long-term capital growth and outperform both the IA sector average and cash whilst maintaining limited equity exposure and low levels of risk. A key theme for the Investment Committee is maximising returns whilst minimising risks.
Performance %
Cash 10%Fixed Interest 41%GAM Star Credit OpportunitiesiShares FTSE UK GiltsMuzinich Global Tactical CreditRogge Short Duration Global Real Estate BondRubrics Global Credit UCITSVanguard Global Bond Index USDVanguard Global Short-Term Bond GBP
Equity 21%Majedie UK IncomeTB Evenlode IncomeCFP SDL UK BuffettologyPolar Capital UK Absolute EquityMarlborough European Multi-CapOld Mutual North American EquityHermes Asia ex Japan Equity
Alternatives 28%Old Mutual Global Equity Absolute ReturnLazard Global Listed InfrastructureVT UK Infrastructure IncomeAberdeen UK Property TrustAviva Investors UK Property TrustLegal & General UK PropertyStandard Life UK PropertyThreadneedle UK Property Trust
Holdings
0
3
6
9
2017 YTD 2016 2015 2014 2013 2012
Conservative Managed Fund R Acc
IA Mixed Investment 0-35% Shares NR
The fund performed well in absolute terms and outperformed sector average peers in Q3. UK mid caps drove performance. Fixed interest and commercial property had another solid quarter. Overseas equity also contributed.
Source: Thomson Reuters Lipper for Investment Management.(Key applies to both charts).
Calendar Year Performance %
*

Underweight
Fund Manager Commentary
Conservative Managed Fund
October 2017
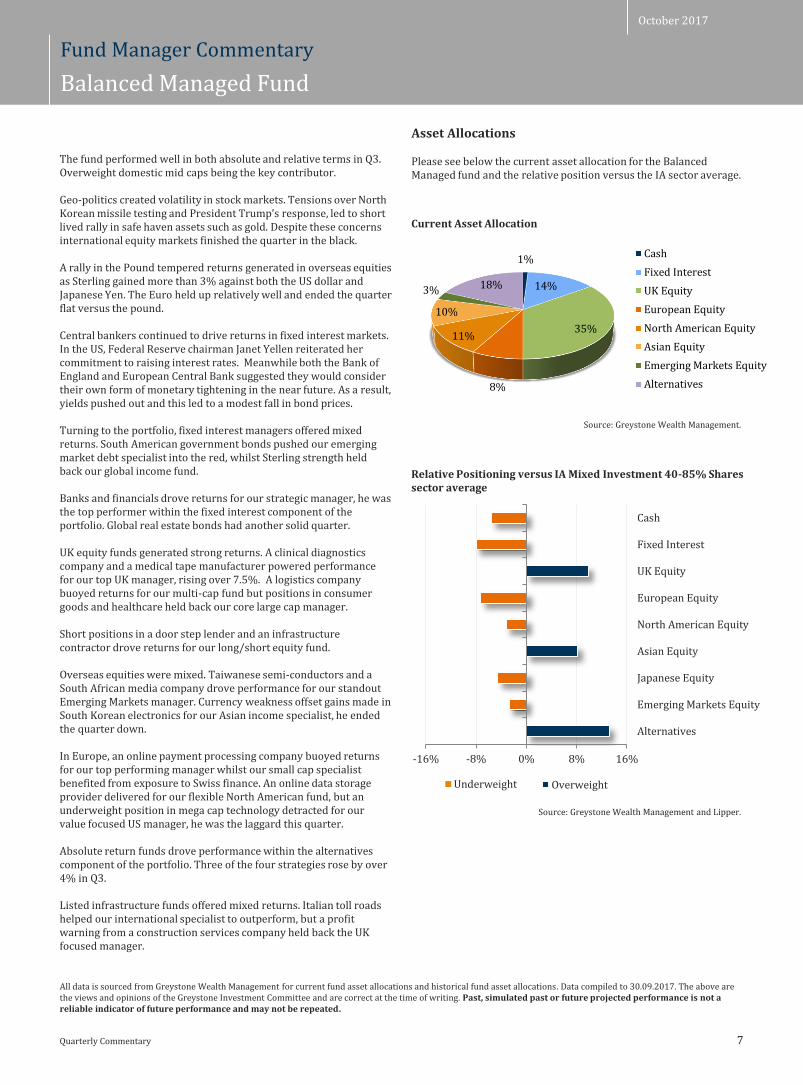
10%
41%
12%
3%
3%
3%
28%Cash
Fixed Interest
UK Equity
European Equity
North American Equity
Asian Equity
Alternatives
Asset Allocations
Please see below the current asset allocation for the Conservative Managed fund and the relative position versus the IA sector average.
Current Asset Allocation
Source: Greystone Wealth Management.
Quarterly Commentary 3
All data is sourced from Greystone Wealth Management for current fund asset allocations and historical fund asset allocations. Data compiled to 30.09.2017. The above are the views and opinions of the Greystone Investment Committee and are correct at the time of writing. Past, simulated past or future projected performance is not a reliable indicator of future performance and may not be repeated.
Relative Positioning versus IA Mixed Investment 0-35% Shares sector average
Source: Greystone Wealth Management and Lipper.
Central Banks once again dominated headlines. The US Federal Reserve looked past the short term economic impact of hurricanes Harvey and Irma and confirmed they will start to reduce their $4.5 trillion dollar balance sheet in October. The Fed’s own predictions suggest one more rate rise in the US this year, followed by three more in 2018.
In the UK, Bank of England Governor Mark Carney maintained UK rates at their record low in September but hawkish comments increased market expectations of a November rate rise. ECB president Mario Draghi also hinted that quantitative easing could soon be tapered, if the Eurozone continues to recover.
Although withdrawal of central bank stimulus is expected to be gradual, small changes in market expectations can have a large impact on yields and thus prices. Bonds with a longer time to maturity are particularly sensitive to these kinds of movements.
Despite increased volatility in fixed income markets all but two of our fixed interest managers delivered positive returns. Short dated UK government bonds outperformed the sector average but ended the quarter down, whilst currency weakness pushed our dollar denominated sovereign debt fund into the red.
Low interest rate sensitivity helped our corporate bond manager outperform, whilst the tactical specialist benefitted from positions in US high yield. Banks and financials drove returns for our strategic manager, he was the top performer within the fixed interest component of the portfolio. Global real estate bonds had another solid quarter.
All our UK equity funds were positive over the period. A clinical diagnostics company drove returns for the standout manager whilst exposure to consumer goods and healthcare held back the laggard.
Short positions in a door step lender and an infrastructure contractor powered performance for the newly purchased long/short equity manager.
International equity funds delivered solid growth. Overweight China and South Korea helped our Asian equity manager deliver strong returns whilst the European small cap specialist benefitted from positions in Swedish consumer goods. Despite dollar weakness, our North American manager had another solid quarter, mega-cap technology stocks the key reason.
Within the alternatives component of the portfolio our equity market neutral strategy was the top performer, European positions helping the manager rise by over 5%.
Listed infrastructure funds offered mixed returns. Italian toll roads helped our international specialist outperform, but a profit warning from a construction services company held back the UK focused manager.
Industrial warehouses in the Midlands and an out of town shopping centre in West Yorkshire, powered returns for our top real estate fund, whilst London offices and a South East shopping centre, held back the laggard.
-25% -15% -5% 5% 15% 25%
Alternatives
Emerging Markets Equity
Japanese Equity
Asian Equity
North American Equity
European Equity
UK Equity
Fixed Interest
Cash
Overweight

Cash 2%Fixed Interest 28%Capital International Global High Income OpportunitiesGAM Star Credit OpportunitiesMan GLG Global Emerging Markets DebtMuzinich Global Tactical CreditRogge Short Duration Global Real Estate BondRoyal London Short Duration Global High Yield BondRubrics Global Credit UCITS
Equity 49%CF Miton UK Multi Cap IncomeEden Tree Higher IncomeFidelity Enhanced IncomeMajedie UK IncomeMan GLG UK IncomeMI Chelverton UK Equity IncomeSchroder Income MaximiserTB Evenlode Income Trojan IncomeMontanaro European IncomePrusik Asian Equity IncomeArtemis US Extended AlphaArtemis Global IncomeSarasin Global Higher Dividend
Alternatives 21%CF Ruffer Total ReturnLazard Global Listed InfrastructureVT UK Infrastructure IncomeAberdeen UK Property TrustAviva Investors UK Property TrustLegal & General UK PropertyStandard Life UK PropertyThreadneedle UK Property Trust
All performance in this report is based upon R share class accumulation units denominated in GBP. All performance data is sourced from Thomson Reuters Lipper for Investment Management and compiled to 30.09.2017. All Investment Association (IA) sector performance is Nominal Return (NR). Cautious Managed Fund changed mandate on 24.07.2009. Natural yield data sourced from Thomson Reuters Lipper for Investment Management and compiled to 30.06.2017. The above are the views and opinions of the Greystone Investment Committee and are correct at the time of writing. Past, simulated past or future projected performance is not a reliable indicator of future performance and may not be repeated.
Fund Manager Commentary
Cautious Managed Fund
October 2017
Quarterly Commentary 4
Fund Review & Outlook
The fund’s objective is to deliver high income with the potential for capital growth whilst outperforming the sector average and cash over a rolling three year period. We look to achieve this with less than half the volatility of equities. The fund has met all three objectives over the last six calendar years and remains well-diversified across the three core asset classes; fixed interest, equities and alternatives.
Performance %
Holdings
-6
0
6
12
2017 YTD 2016 2015 2014 2013 2012
Cautious Managed Fund R Acc
IA Mixed Investment 20-60% Shares NR
Multi-asset Portfolios
Performance Summary
The fund fell -0.22% over the third quarter versus the Investment Association (IA) Mixed Investment 20-60% Shares sector average 0.55% and the IA Money Market 0.03%.
Since the fund’s mandate change on 24th July 2009 it has delivered 78.65%, versus the IA sector average 74.30% and IA Money Market 3.57%. The fund’s share price as at 30th September 2017 was; 156.41p (R share class accumulation units) and 114.69p (R share class income units).
The fund’s natural yield of 3.09% (IA sector average 2.06%) is generated from equities, fixed income and alternative investments.
Source: Thomson Reuters Lipper for Investment Management.(Key applies to both charts).
Calendar Year Performance %
0
25
50
75
Jul/09 Jul/11 Jul/13 Jul/15 Jul/17

-18% -9% 0% 9% 18%
Alternatives
Emerging Markets Equity
Japanese Equity
Asian Equity
North American Equity
European Equity
UK Equity
Fixed Interest
Cash
Overweight
2%
28%
30%
6%
5%
8%
21%
Cash
Fixed Interest
UK Equity
European Equity
North American Equity
Asian Equity
Alternatives
Underweight
Fund Manager Commentary
Cautious Managed Fund
October 2017
The fund fell in value and underperformed sector peers in Q3. UK equities with overseas earnings and a US dollar denominated Asian fund were the key detractors. The fund remains ahead of its benchmark year to date.
Bond markets struggled as the US Federal Reserve reiterated its commitment to raising interest rates. Fed Chairman Janet Yellen also confirmed details of how she will reduce the Bank’s $4.5 trillion dollar balance sheet, beginning in October.
Europe and the UK remain behind the US in normalising monetary policy but both ECB President Mario Draghi and Bank of England Governor Mark Carney have suggested they will begin to tighten policy in the near future, leading to volatility in bond prices.
Speculation over interest rate rises also led to foreign exchange volatility over the quarter. Sterling rallied against most major currencies and this led to falls for UK companies with overseas earnings and reversed some of the gains made in international equities.
Turning to the portfolio, all but two of our fixed interest managers offered positive returns. South American government bonds pushed our emerging market debt specialist into the red, whilst Sterling strength held back our global income fund.
Telecoms and consumer services buoyed performance for our core high yield fund, the strategy also benefitted from low interest rate sensitivity. Banks and financials drove returns for our strategic manager, he was the top performer within the fixed interest component of the portfolio. Global real estate bonds had another solid quarter.
Turning to the UK, a logistics company boosted returns for our multi-cap income fund, whilst a food and drug retailer powered performance for the newly purchased mid cap manager. A profit warning from a sub-prime consumer loan company was the key detractor for our large cap income specialist, he was the laggard this quarter.
All but one of our international equity funds was positive over the period. An online data storage provider delivered for our flexible North American manager, whilst our European small cap fund benefitted from exposure to Swiss finance. Currency weakness offset gains made in South Korean electronics for our Asian income specialist, he ended the quarter down.
Listed infrastructure funds offered mixed returns. Italian toll roads helped our international specialist to outperform, but a profit warning from a construction services company held back the UK focused manager.
Industrial warehouses in the Midlands and an out of town shopping centre in West Yorkshire, powered returns for our top real estate fund, whilst London offices and a South East shopping centre, held back the laggard.
Asset Allocations
Please see below the current asset allocation for the Cautious Managed fund and the relative position versus the IA sector average.
Current Asset Allocation
Source: Greystone Wealth Management.
Quarterly Commentary 5
All data is sourced from Greystone Wealth Management for current fund asset allocations and historical fund asset allocations. Data compiled to 30.09.2017. The above are the views and opinions of the Greystone Investment Committee and are correct at the time of writing. Past, simulated past or future projected performance is not a reliable indicator of future performance and may not be repeated.
Relative Positioning versus IA Mixed Investment 20-60% Shares sector average
Source: Greystone Wealth Management and Lipper.

-10
15
40
65
90
Sep/10 Sep/12 Sep/14 Sep/16
All performance in this report is based upon R share class accumulation units denominated in GBP. All performance data is sourced from Thomson Reuters Lipper for Investment Management and compiled to 30.09.2017. All Investment Association (IA) sector performance is Nominal Return (NR). Balanced Managed Fund changed mandate on 01.09.2010. The above are the views and opinions of the Greystone Investment Committee and are correct at the time of writing. Past, simulated past or future projected performance is not a reliable indicator of future performance and may not be repeated.
Fund Manager Commentary
Balanced Managed Fund
October 2017
Quarterly Commentary 6
Fund Review & Outlook
The fund’s objective is to deliver positive returns over the course of an economic cycle from a diversified portfolio whilst maintaining a balanced approach to risk.
There is flexibility to rotate between asset classes which helps smooth returns and protects against volatility.
Performance %
Cash 1%Fixed Interest 14%Capital International Global High Income OpportunitiesGAM Star Credit OpportunitiesMan GLG Global Emerging Markets DebtRogge Short Duration Global Real Estate Bond
Equity 67%CF Miton UK Multi Cap IncomeMajedie UK IncomeSchroder Income MaximiserTB Evenlode IncomeCFP SDL UK BuffettologyCity Financial Absolute EquityMI Chelverton UK Equity GrowthOld Mutual UK Dynamic EquityPolar Capital UK Absolute EquityThreadneedle UK Extended AlphaJupiter EuropeanMarlborough European Multi-CapMontanaro European IncomeArtemis US Extended AlphaFidelity American Special SituationsMajedie US EquityOld Mutual North American EquityHermes Asia ex Japan EquityPrusik Asian Equity IncomeHermes Global Emerging Markets
Alternatives 18%F&C Global Equity Market NeutralF&C Real Estate Equity Long / ShortOld Mutual Global Equity Absolute ReturnOld Mutual UK Specialist EquityLazard Global Listed InfrastructureVT UK Infrastructure IncomePolar Capital Global Insurance
Holdings
-6
0
6
12
2017 YTD 2016 2015 2014 2013 2012
Balanced Managed Fund R Acc
IA Mixed Investment 40-85% Shares NR
Multi-asset Portfolios
Performance Summary
The fund rose 1.35% over the third quarter versus the Investment Association (IA) Mixed Investment 40-85% Shares sector average 0.96% and the IA Money Market 0.03%.
Since the fund’s mandate change on 1st September 2010 it has delivered 89.04% outperforming the IA sector average 72.23% and IA Money Market 2.16%. The fund’s share price as at 30th September 2017 was; 208.25p (R share class accumulation units) and 183.36p (R share class income units).
The fund continues to offer investors the ability to maximise capital growth whilst managing risk through a combination of bond, equity and alternative investments.
Source: Thomson Reuters Lipper for Investment Management.(Key applies to both charts).
Calendar Year Performance %
Underweight
The fund performed well in both absolute and relative terms in Q3. Overweight domestic mid caps being the key contributor.
Geo-politics created volatility in stock markets. Tensions over North Korean missile testing and President Trump’s response, led to short lived rally in safe haven assets such as gold. Despite these concerns international equity markets finished the quarter in the black.
A rally in the Pound tempered returns generated in overseas equities as Sterling gained more than 3% against both the US dollar and Japanese Yen. The Euro held up relatively well and ended the quarter flat versus the pound.
Central bankers continued to drive returns in fixed interest markets. In the US, Federal Reserve chairman Janet Yellen reiterated her commitment to raising interest rates. Meanwhile both the Bank of England and European Central Bank suggested they would consider their own form of monetary tightening in the near future. As a result, yields pushed out and this led to a modest fall in bond prices.
Turning to the portfolio, fixed interest managers offered mixed returns. South American government bonds pushed our emerging market debt specialist into the red, whilst Sterling strength held back our global income fund.
Banks and financials drove returns for our strategic manager, he was the top performer within the fixed interest component of the portfolio. Global real estate bonds had another solid quarter.
UK equity funds generated strong returns. A clinical diagnostics company and a medical tape manufacturer powered performance for our top UK manager, rising over 7.5%. A logistics company buoyed returns for our multi-cap fund but positions in consumer goods and healthcare held back our core large cap manager.
Short positions in a door step lender and an infrastructure contractor drove returns for our long/short equity fund.
Overseas equities were mixed. Taiwanese semi-conductors and a South African media company drove performance for our standout Emerging Markets manager. Currency weakness offset gains made in South Korean electronics for our Asian income specialist, he ended the quarter down.
In Europe, an online payment processing company buoyed returns for our top performing manager whilst our small cap specialist benefited from exposure to Swiss finance. An online data storage provider delivered for our flexible North American fund, but an underweight position in mega cap technology detracted for our value focused US manager, he was the laggard this quarter.
Absolute return funds drove performance within the alternatives component of the portfolio. Three of the four strategies rose by over 4% in Q3.
Listed infrastructure funds offered mixed returns. Italian toll roads helped our international specialist to outperform, but a profit warning from a construction services company held back the UK focused manager.
Asset Allocations
Please see below the current asset allocation for the Balanced Managed fund and the relative position versus the IA sector average.
Fund Manager Commentary
Balanced Managed Fund
October 2017
1%
14%
35%
8%
11%
10%
3% 18%
Cash
Fixed Interest
UK Equity
European Equity
North American Equity
Asian Equity
Emerging Markets Equity
Alternatives
Current Asset Allocation
Source: Greystone Wealth Management.
Quarterly Commentary 7
All data is sourced from Greystone Wealth Management for current fund asset allocations and historical fund asset allocations. Data compiled to 30.09.2017. The above are the views and opinions of the Greystone Investment Committee and are correct at the time of writing. Past, simulated past or future projected performance is not a reliable indicator of future performance and may not be repeated.
Relative Positioning versus IA Mixed Investment 40-85% Shares sector average
Source: Greystone Wealth Management and Lipper.
-16% -8% 0% 8% 16%
Alternatives
Emerging Markets Equity
Japanese Equity
Asian Equity
North American Equity
European Equity
UK Equity
Fixed Interest
Cash
Overweight
-50
0
50
100
150
200
Dec/05 Dec/07 Dec/09 Dec/11 Dec/13 Dec/15
All performance in this report is based upon R share class accumulation units denominated in GBP. All performance data is sourced from Thomson Reuters Lipper for Investment Management and compiled to 30.09.2017. All Investment Association (IA) sector performance is Nominal Return (NR). Global Growth Fund launched on 05.12.2005. The above are the views and opinions of the Greystone Investment Committee and are correct at the time of writing. Past, simulated past or future projected performance is not a reliable indicator of future performance and may not be repeated.
Fund Manager Commentary
Global Growth Fund
October 2017
Quarterly Commentary 8
Fund Review & Outlook
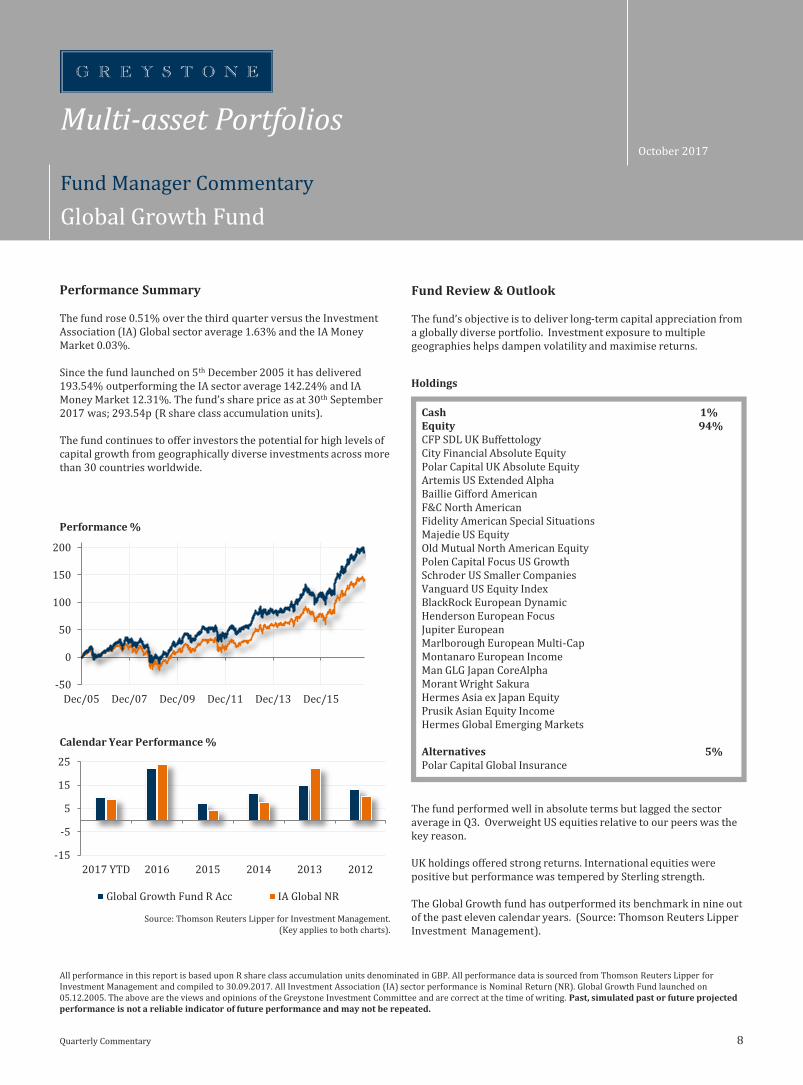
The fund’s objective is to deliver long-term capital appreciation from a globally diverse portfolio. Investment exposure to multiple geographies helps dampen volatility and maximise returns.
Performance %
Cash 1%Equity 94%CFP SDL UK BuffettologyCity Financial Absolute EquityPolar Capital UK Absolute EquityArtemis US Extended AlphaBaillie Gifford AmericanF&C North AmericanFidelity American Special SituationsMajedie US EquityOld Mutual North American EquityPolen Capital Focus US GrowthSchroder US Smaller CompaniesVanguard US Equity IndexBlackRock European DynamicHenderson European FocusJupiter EuropeanMarlborough European Multi-CapMontanaro European IncomeMan GLG Japan CoreAlphaMorant Wright SakuraHermes Asia ex Japan EquityPrusik Asian Equity IncomeHermes Global Emerging Markets
Alternatives 5%Polar Capital Global Insurance
Holdings
The fund performed well in absolute terms but lagged the sector average in Q3. Overweight US equities relative to our peers was the key reason.
UK holdings offered strong returns. International equities were positive but performance was tempered by Sterling strength.
The Global Growth fund has outperformed its benchmark in nine out of the past eleven calendar years. (Source: Thomson Reuters Lipper Investment Management).
-15
-5
5
15
25
2017 YTD 2016 2015 2014 2013 2012
Global Growth Fund R Acc IA Global NR
Source: Thomson Reuters Lipper for Investment Management.(Key applies to both charts).
Multi-asset Portfolios
Performance Summary
The fund rose 0.51% over the third quarter versus the Investment Association (IA) Global sector average 1.63% and the IA Money Market 0.03%.
Since the fund launched on 5th December 2005 it has delivered 193.54% outperforming the IA sector average 142.24% and IA Money Market 12.31%. The fund’s share price as at 30th September 2017 was; 293.54p (R share class accumulation units).
The fund continues to offer investors the potential for high levels of capital growth from geographically diverse investments across more than 30 countries worldwide.
Calendar Year Performance %

Underweight
Fund Manager Commentary
Global Growth Fund
October 2017
1% 9%
43%17%
8%
11%
6%5%
Cash
UK Equity
North American Equity
European Equity
Japanese Equity
Asian Equity
Emerging Markets Equity
Alternatives
Asset Allocations
Please see below the current asset allocation for the Global Growth fund and the relative position versus the IA sector average.
Current Asset Allocation
Source: Greystone Wealth Management.
Quarterly Commentary 9
All data is sourced from Greystone Wealth Management for current fund asset allocations and historical fund asset allocations. Data compiled to 30.09.2017. The above are the views and opinions of the Greystone Investment Committee and are correct at the time of writing. Past, simulated past or future projected performance is not a reliable indicator of future performance and may not be repeated.
Relative Positioning versus IA Global sector average
Source: Greystone Wealth Management and Lipper.
Geo-politics created volatility in stock markets. Tensions over North Korean missile testing and President Trump’s response, led to a short lived rally in safe haven assets such as gold.
Hurricanes Harvey and Irma also caused some concern, particularly in insurance markets, but the subsequent emergency spending plan agreed by Congress pushed back US debt ceiling negotiations and reduced the risk of a government shutdown.
Interest rate speculation increased volatility in foreign exchange markets. Sterling gained more than 3% against both the US dollar and Japanese Yen and this tempered returns made in overseas equities. The Euro held up relatively well and ended the quarter flat versus the pound.
In the UK, large cap companies with a greater proportion of overseas earnings relatively underperformed their mid and small cap peers. Brexit negotiations continue to create uncertainty but Theresa May’s proposed 2 year transition period could help smooth the UK’s exit.
Turning to the portfolio, UK mid caps led the way up followed by Emerging Markets, Europe, Asia, Japan and North America. Global insurance was flat.
A clinical diagnostics company and a medical tape manufacturer powered performance for the standout UK manager. Short positions in a door step lender and an infrastructure contractor drove returns for one of our long/short equity managers whilst long positions in industrials and short positions in financials held back the other, he was the laggard within the UK equity component.
Scandinavian financials buoyed performance for our top European manager whilst our large cap fund benefitted from exposure to a German electronic payments company.
Despite dollar weakness, all but one of our North American managers delivered positive returns. I.T. and finance contributed for our top performing quantitative strategy but an underweight position in mega cap technology detracted for our value focused US manager, he was the laggard this quarter.
Television and media stocks were the key drivers for our Japanese mid-cap specialist whilst the large cap value manager benefitted from exposure to banks.
In Asia and emerging markets, our income specialist ended the quarter down as currency weakness offset gains made in Hong Kong infrastructure.
Overweight positions in China and South Korea helped our Asian growth fund outperform, whilst Taiwanese semi-conductors and a South African media company drove performance for our standout Emerging Markets manager.
Within the alternatives component of the portfolio our global insurance manager ended the quarter flat. Hurricanes in the Gulf of Mexico led to some price volatility but the low exposure to catastrophe insurance helped dampen the effects on the fund.
-12% -6% 0% 6% 12%
Alternatives
Emerging Markets Equity
Japanese Equity
Asian Equity
European Equity
North American Equity
UK Equity
Fixed Interest
Cash
Overweight

Those of you who watch the popular HBO series “A Game of Thrones” (or have read the books) will be familiar with the motto of house Stark “Winter is Coming”, a reminder to stand ready for hardship and a warning to always be prepared for leaner times ahead. A similar, perhaps less pessimistic idiom is “hope for the best, but prepare for the worst”, although that would not sound half so fearsome below a growling direwolf on the Stark family crest. The sentiment is similar though and both statements sum up how we feel about markets at the moment and how we are positioning the portfolios.
Our investment philosophy focuses on providing the best possible risk-adjusted returns, and while we maintain a healthy suspicion about high valuations at the moment, the discipline and risk controls embedded in our process ensure we don’t get too carried away. At Greystone we aim to grow in line with rising asset prices and defend capital when markets fall. Our primary aim will always be to consistently deliver on our stated fund objectives so our clients and their advisers can effectively plan for the future, be that wintery or otherwise.
If winter is coming, it is after an unusually long summer. The current Bull-run in the FTSE-All Share index is 103 months old, which is the longest sustained period of growth in over 50 years. The average annual return on the FTSE-All Share index over this period is around 10% after inflation, significantly above the long term average (the 50 year average is estimated to be more like 5.3% real return1). Despite this above average annual growth rate the total return since the end of the financial crisis, around 115%, is still well behind that of the last two longest bull markets which reached 200% (1990-1998 ending as the tech bubble burst) and over 450% (1979-1987 ending on Black Monday) at which times the annualised growth rates were 15% and 20% respectively1. A similar scenario is apparent in the US where the post-crisis gains have reached 270%, surpassing the 266% rise during the bull market of 1949-56 making this the second-longest bull market in modern US history2.
It has to be said that the generous returns over this period have been driven more by rising valuations as opposed to rising profits. In fact in the US, companies in the S&P 500 have returned more money to shareholders via share buybacks and dividends in the last 10 years than they actually generated through profits2. This kind of financial engineering, basically borrowing against your future earnings in order to pay dividends now, has certainly helped buoy stock valuations but has also helped to generate an $8.6 trillion pile of US corporate debt (30% more than the previous peak in September 2008)2. The corporate equivalent of adding to your mortgage while interest rates are low so you can get that bigger house you have always wanted.
Financial engineering aside, why are investors willing to pay so much more for similar or lower earnings versus previous economic cycles? The answer to that lies in the multi-trillion dollar money printing programs undertaken by the world’s central banks.
The above are the views and opinions of the Greystone Investment Committee and are correct at the time of writing. All performance data compiled from Thomson Reuters Lipper for Investment Management, data correct to 30.09.2017. Sources: 1 – Fidelity Perspectives, Fidelity International, 2 – Artemis Fund Managers, 3 – Deutsche Bank, 4 –The Financial Times
Past, simulated past or future projected performance is not a reliable indicator of future performance and may not be repeated.
Quarterly Commentary 10
“The Long Unwinding Road”
In the years since the financial crisis the four major central banks (the US Federal Reserve, Bank of Japan, European Central Bank and Bank of England) have purchased over $10 trillion of assets and the share of government debt markets owned by each central bank is now 23% in the US, 21% in the Eurozone, 22% in the UK and a staggering 44% in Japan3. Those numbers are a little bit mind-boggling but, to provide context, imagine a trillionaire turns up at your local food market and buys 20% of everything using her unlimited credit card. A couple of things are likely to happen. Firstly, unless you’re being forced to shop there, you are probably going to go find a different market (the high yield hypermarket or out of town equity supermarket perhaps?) and secondly, prices are going to go up, which in the bond market means yields go down.
In that context we probably shouldn’t be surprised that governments, businesses and consumers are making the most of this cheap money while it lasts. In September Austria issued a 100 year “Century” bond with a yield of 2.112%. The government raised €3.5bn in total but there were €11.4bn of bids. Argentina, a country which spent 15 of the last 17 years in default and which has failed to pay its sovereign debts on no less than eight occasions since independence in 1816 also issued a century bond (raising $2.75bn paying an annual coupon of 7.2%)4. Corporates are also in on the action. Tesla, on its very first entry into the debt markets, raised $1.8bn selling an 8 year bond at 5.3%. Amazon’s $16bn August bond issue was almost 3 times oversubscribed, attracting orders equivalent to the GDP of Belarus3.
So what happens next? There is no doubt that central bank intervention has inflated asset prices, the question is whether this represents a bubble which will burst or a balloon that can be slowly deflated. The Fed has been ahead of the curve since the financial crisis but the relative success of their program now means they are also the first to start tightening. In other words they need to let a little air out of the balloon. The preferred tool for this is interest rates and, barring a disaster greater than hurricanes Harvey & Irma, Fed Chairman Janet Yellen looks set to deliver three interest rates rises in 2017, as previously suggested. The focus this year however has been on how the Fed will unwind its $4.5 trillion balance sheet. Starting in October, when the Fed’s investments in US government bonds mature they will no longer immediately re-invest the whole amount. So, hypothetically speaking, if $100bn in bonds mature the Fed will only re-invest $90bn and the total debt they own will decrease by $10bn.
A drop in the ocean you might say, but the amount they hold back each month will increase by $10bn to a cap of $50bn and that means over $2 trillion could roll off the books by 2021, assuming they stay the course. What happens to the $2 trillion they don’t reinvest? *poof* it’s gone, disappeared, a deleted line in a spread sheet. Central banks giveth and central banks taketh away.
Investment Committee
Economic & Market Commentary
October 2017
Investment Committee
Economic & Market Commentary
October 2017
Quarterly Commentary 11
Elsewhere in the world the strategy remains very much one of giving. While US rates are already 1% above the post crisis low, the BoE and ECB are still languishing at record lows and only hinting at stopping QE. To provide some context to just how accommodative they have been we looked back at Mark Carney’s first UK inflation report. On 7 August 2013 the newly installed Governor of the Bank of England introduced the UK to the idea of “forward guidance” by issuing the following (somewhat shortened) statement as part of the BoE’s quarterly report: “The Committee intends at a minimum to maintain the current highly stimulative stance of monetary policy until economic slack has been substantially reduced… …in particular, the MPC intends not to raise Bank Rate from its current level of 0.5% at least until the Labour Force Survey headline measure of the unemployment rate has fallen to a threshold of 7%...”5.
At that time UK unemployment stood at 7.8% and the base rate of interest set was 0.5%. Fast forward to the August 2017 inflation report and unemployment is now at a record low of 4.3% and interest rates are 0.25%6. Although the hawkish comments following the September Monetary Policy Committee meeting have increased the likelihood of a November rate hike, not to mention the rebound in Sterling, that initial piece of forward guidance is a sobering reminder of just how accommodative the BoE has been and for how long.
It also demonstrates the susceptibility of forecasting to changes in previously reliable relationships. Falling unemployment has traditionally been a good indicator of future inflation increases (a link described by the so-called Phillips curve) but this has manifestly failed in the post financial crisis era. The reasons for this are still hotly debated (the subject of 13 different MPC speeches in the last 3 years alone5) with productivity and structural changes to the labour market (the “gig economy”) typically blamed. What is clear however is that real wage growth (wages less inflation) since the financial crisis has been the worst of any post war recovery, and the UK in particular stands out as the worst of any major developed economy (excluding Greece that is) with real wages still well behind where they were in 20083. Theresa’s Mays easing of the public sector pay cap may be one factor influencing the MPCs hawkish view but with around 20% of workers employed by the state, the government’s magic money tree would have to receive a pretty rigorous shake to make up the difference between wage growth at 2.1% and inflation of 2.9% (although a pay increase in line with the 10% MPs handed themselves in 2015 might just about plug the gap).
Politics has proven to be a consistent source of uncertainty around the globe and the supposedly quiet summer months proved no different. Donald Trump, of course led the way. First by sacking some high profile figures from his administration and then by starting a war of words (so far) with North Korea. The reshuffling of his administration has seen some of the key figures from his election campaign replaced, in many cases by serving or former generals. Any hope that these changes would lead to a more disciplined and considered approach from the President quickly evaporated however when Donald Trump began prodding the hornets’ nest that is North Korea. Threats of absolute destruction from the “rogue state” are nothing new but the reciprocation from Trump was unsettling for markets and in the President’s own words “We can't let a madman with nuclear weapons on the loose like that”.
In Europe the negotiations over the terms of the UK’s exit from the Union continue. There are obviously a lot of moving parts to these discussions, be they metaphorical pieces of the future relationship or physical pieces of cars and machinery moving across borders. Theresa May’s Florence address indicated a more pragmatic approach towards a transitional arrangement but the EU still refuses to discuss future trade arrangements until the key issues around the the Irish border, the financial settlement (a.k.a. divorce bill) and the rights of EU citizens are resolved.
It was hoped that Angela Merkel’s re-election in Germany would provide some impetus and a more pragmatic approach to negotiations, but that has been complicated by the eventual result. Although Merkel’s CDU won a 4th term the centre-left Social Democrats have categorically ruled out participation in yet another grand coalition and Merkel will likely form an uncomfortable alliance with the right of centre FDP (who came fourth) and the left of centre Greens (who polled sixth). She will also face a much more aggressive opposition, particularly from the far right-wing Alternative für Deutschland (AfD) which made its parliamentary debut as the country’s third-largest party.
Europe may instead turn to Emmanuel Macron for leadership. Although the euphoria of his election landslide may have faded the French President has quietly passed labour reforms which literally caused riots when proposed by his predecessor. Macron’s recent speeches suggest he has a bold vision for a reformed Europe but with Spain currently arresting Catalan secessionists and the strong populist vote in Germany once again creating doubts about the 2018 Italian elections, the European project remains just that.
In summary, the fundamental drivers of the post-crisis market rally are now slowing or reversing but underlying economic activity remains robust. The big question remains can the bond balloon be deflated in a controlled manner? Is global growth robust enough to replace the air released when QE ends? Even in a goldilocks scenario of moderate growth and stable inflation it’s likely that market returns will “normalise” to historic levels and that means slimmer pickings than we have perhaps become used to in recent years. A benign, low growth scenario is vulnerable to corrections however and there remains a panoply of political risks, any one of which could send investors running for cover. All in all this puts us in mind of a famous quote attributed to semi-conductor pioneer and Intel co-founder Andy Grove, “Success breeds complacency and complacency breeds failure. Only the paranoid survive”. We maintain a cautious approach to the known unknowns (Trump, N.Korea, Brexit etc) and a healthy paranoia about the unknown unknowns.
We intend to enjoy autumn while it lasts but if winter is coming we will be prepared when it arrives. This means adequate diversification across asset classes and experienced expert managers who know the safest paths to walk in treacherous conditions. Our in-depth research processes and disciplined risk controls help to guide us and ensure we continue deliver performance in line with our client’s investment objectives, as we have done for over a decade.
Thank you for your continued support.
As always, please contact your usual adviser for further information or for access to our monthly updates.
The above are the views and opinions of the Greystone Investment Committee and are correct at the time of writing. All performance data compiled from Thomson Reuters Lipper for Investment Management, data correct to 30.09.2017. Sources: 3 – Deutsche Bank , 5 – Bank of England, 6 – Office of National Statistics
Past, simulated past or future projected performance is not a reliable indicator of future performance and may not be repeated.

-1%
0%
1%
2%
3%
4%
5%
6%
Sep/07 Sep/09 Sep/11 Sep/13 Sep/15 Sep/17
UK US Europe
6x
10x
14x
18x
Jan/07 Jan/09 Jan/11 Jan/13 Jan/15 Jan/17
UK UK 10yr average
US US 10yr average
Europe Europe 10yr average
Government Bond Yields
Yie
ld (
%)
UK – 10yr Gilts, US – 10yr Treasuries, Europe – 10yr German Bunds.Source: GAM.
Quarterly Commentary 12
Key Charts
Final Thoughts
October 2017
The above are the views and opinions of the Greystone Investment Committee and are correct at the time of writing unless otherwise stated. Data for price-to-earnings ratios sourced from EdenTree. Data for Government Bond yields sourced from GAM. Data correct as at 30.09.2017.
Past, simulated past or future projected performance is not a reliable indicator of future performance and may not be repeated.
“ Where is the Value? ”
The price-to-earnings ratio (P/E) is the formula for valuing a company by measuring its current share price relative to its earnings per share. A forward looking P/E uses forecasted earnings. In simple terms, the higher the P/E ratio, the more expensive the company.
The average 10 year P/E ratio in the UK (FTSE 100) is 12x, the US (S&P 500) is 14.3x and Europe (FTSE World Europe ex UK) is 12.7x.
At the peak of the Global Financial Crisis in 2008, UK, US and European P/E ratios fell to lows of 6.5x, 9.6x and 7.3x respectively. During the crisis the FTSE 100 lost 45% of its value, the S&P 500 lost 50%.
Markets have recovered since 2008 and P/E ratios are now significantly above their 10 year averages. The FTSE 100 stands at 14.5x.
We remain positive on equity markets over the long-term, however company valuations look stretched versus history.
It is through our rigorous investment process that we look to maintain equity exposure in quality companies where valuations are below the broader market.
Figures source: Thomson Reuters Lipper for Investment Management & EdenTree.
UK – FTSE 100, US – S&P 500, Europe – FTSE World Europe (ex UK).Source: EdenTree.
Pri
ce-t
o-E
arn
ings
Mu
ltip
le
“ Not so rewarding ”
A 10-year government bond is a debt obligation paying a fixed rate of interest. Governments issue bonds in order to borrow money. Investors buy them to earn a return.
Bond prices and yields move in opposite directions. When prices move up, yields fall, and visa versa.
After the Global Financial Crisis, central banks started making heavy purchases using newly-printed money under their quantitative easing programmes, to support and stimulate faltering economies. This boosted demand for bonds significantly. Prices rose and yields fell.
In June 2016, the unthinkable happened when German Bund yields went negative for the first time ever amid fears of the UK’s referendum on its European Union membership.
Over the last 10 years, bond yields have trended downwards. In September 2007, UK 10-year Gilts yielded almost 5%, now they yield 1.06%.
Bond yields are at historic lows. An upward move would negatively impact bond prices.
Price-to-Earnings Ratio (12month forward looking)

IMPORTANT INFORMATIONThis document is for professional investors, advisors and retail clients. It does not constitute a form of financial advice and should not be relied upon. This is provided for information only. At Greystone we seek to guide you with your investment strategies by assessing and continually checking the levels of investment risk you are willing and able to take, thus ensuring suitable investments are made on your behalf. Past, simulated past or future projected performance is not a reliable indicator of future performance and may not be repeated. Investment markets and conditions can change rapidly and as such any views expressed herein should not be relied upon when making investment decisions. Neither the payment of dividends or return of capital is implied or guaranteed. There is a risk of loss of capital. Rates of exchange may cause the value of investments to go up or down. The information and any opinions expressed herein may change at any time and therefore this document does not constitute investment, tax, legal or other advice or recommendation or an offer to sell or an invitation to apply for any product or service. Investors should consider carefully whether an investment in this fund or portfolio is suitable in light of circumstances and resources.
Greystone Wealth Management is a trading name of Foundation Investment Management Limited who are authorised and regulated by the Financial Conduct Authority. Financial Services Register Number 612117.
Q3 17-October
Visit www.greystonefs.co.uk for additional information