Embed Size (px)
Citation preview

GREET BIOFUEL LIFE-CYCLE ANALYSIS AND RESULTS
MICHAEL WANG 王全录Systems Assessment GroupEnergy Systems DivisionArgonne National Laboratory
The IEA Bioenergy Forum: Commercialising Conventional and Advanced Liquid Biofuels from Biomass Beijing, China, April 7-8, 2018

2
Transportation life-cycle analysis models
The GREET model in the U.S since 1994 The EU WTW study since 2003 The Canadian GHGenius since 2001 MIT LCA of jet fuels since 2008

3
The GREET® (Greenhouse gases, Regulated Emissions, and Energy use in Transportation) model
GREET 1 model: Fuel-cycle (or well-to-wheels, WTW) modeling of
vehicle/fuel systems
Stochastic Simulation Tool
Carbon Calculator for Land Use Change from Biofuels (CCLUB)
GR
EET 2 model:
Vehicle cycle modeling for vehicles
• Available at www.greet.es.anl.gov• Update and release annually• Supported by three DOE EERE transportation
R&D offices

Energy use – transportation energy diversification Total energy: fossil energy and renewable energy
• Fossil energy: petroleum, natural gas, and coal (they are estimated separately)• Renewable energy: biomass, nuclear energy, hydro-power, wind power, and solar
energy
Greenhouse gases (GHGs) – climate changes CO2, CH4, N2O, black carbon, and albedo CO2e of the five (with their global warming potentials)
Air pollutants – urban air pollution VOC, CO, NOx, PM10, PM2.5, and SOx They are estimated separately for
• Total (emissions everywhere)• Urban (a subset of the total)
Water consumption – water sustainability GREET LCA functional units Per service unit (e.g., mile driven, ton-mi) Per unit of output (e.g., million Btu, MJ, gasoline gallon equivalent) Per units of resource (e.g., per ton of biomass)
GREET outputs include energy use, greenhouse gases, criteria pollutants and water consumption for vehicle and energy systems
4

GREET includes all transportation subsectors
•5
• Desire to control air pollution in ports globally• Interest by EPA, local governments, IMO• GREET includes Ocean and inland water transportation Baseline diesel and alternative marine fuels
• Globally, a fast growing sector with GHG reduction pressure
• Interest by DOD, ICAO, FAA, and commercial airlines
• GREET includes Passenger and freight transportation Various alternative fuels blended with
petroleum jet fuels
• Light-duty vehicles• Medium-duty vehicles• Heavy-duty vehicles• Various powertrains:
Internal Combustion EnginesElectrics Fuel cells
• Interest by FRA, railroad companies
• Potential for CNG/LNG to displace diesel
1 - Overview
Roadtransportation
Airtransportation
Railtransportation
Marinetransportation

GREET includes more than 100 fuel production pathways from various energy feedstock sources
PetroleumConventional crudeShale oilOil Sands
Compressed Natural GasLiquefied Natural GasLiquefied Petroleum GasMethanolDimethyl EtherFischer-Tropsch DieselFischer-Tropsch Jet FuelFischer-Tropsch NaphthaHydrogen
Natural GasNorth AmericanNon-North AmericanShale gas
CoalSurface miningUnderground mining
SoybeansPalmRapeseedJatrophaCamelinaAlgae
GasolineDieselJet FuelLiquefied Petroleum GasNaphthaResidual Oil
HydrogenFischer-Tropsch DieselFischer-Tropsch Jet FuelMethanolDimethyl Ether
BiodieselRenewable DieselRenewable GasolineRenewable Jet Fuel
Sugarcane
Corn
Cellulosic BiomassSwitchgrassWillow/PoplarCrop ResiduesForest ResiduesMiscanthus
Residual OilCoalNatural GasNuclearBiomassOther Renewables
EthanolButanolJet fuel
EthanolJet Fuel
EthanolHydrogenMethanolDimethyl EtherFischer-Tropsch DieselFischer-Tropsch Jet FuelPyro Gasoline/Diesel/Jet
Electricity
Renewable Natural GasLandfill GasAnimal WasteWaste water treatment
6
Coke Oven GasPetroleum CokeNuclear EnergyElectricity from different sources
Hydrogen

GREET includes various biomass feedstocks, conversion technologies, and fuels
7
Grains, sugars, and cellulosics Ethanol, butanol
Cellulosics Drop-in hydrocarbon fuels
Aviation and marine fuels
Fermentation, Indirect Gasification
Algae and oil crops
Gasification (e.g., FT), Alcohol to Jet, Sugar to Jet
Hydroprocessing
Biodiesel
Renewable diesel
Transesterification
Hydroprocessing, Hydrothermal Liquefaction
Pyrolysis, Fermentation, Gasification (e.g., FT)
1 - Overview
Waste feedstock Natural gas and derivativesAnaerobic Digestion
ElectricityCombustion
Combustion
Renewable dieselHydrothermal LiquefactionFermentation

GHG reduction requirements of EPA’s Renewable Fuel Standard (RFS) are on LCA basis
Renewable fuel (D6) – 20% GHG reduction- Plants existing before 2008- Corn ethanol- Corn starch butanol- Sorghum ethanol w/NG process energy
Compliance of fuel with RFS determined by EPA based on lifecycle greenhouse gas emissions
Use of suite of models, including GREET for LCA Land use change (LUC) emissions included for biofuels
8
Advanced biofuels (D5) – 50% GHG reduction
- Sugarcane ethanol- Naphtha and LPG from camelina- Sorghum ethanol w/ bioenergy
Biomass-based diesel (D4) – 50% GHG reduction
- Biodiesel (BD) and renewable diesel (RD) from soy, corn, rapeseed, camelina, algal and waste oils, fats and greases
- BD produced using esterification- RD w/ electricity and NG process energy- BD produced using glycerolysis and
transesterification
Cellulosic biofuels (D3) – 60% GHG reduction- Cellulosic diesel or ethanol from switchgrass,
miscanthus, energy cane, giant reed and napiergrass
- Fuels from crop residue, forest material, secondary cover crops on existing crop land, cellulose from food and yard waste
- Thermochemical pyrolysis, thermochemical gasification, biochemical direct fermentation, biochemical fermentation w/ catalytic upgrading w/ biomass process energy

California Low-Carbon Fuel Standard (LCFS) promotes low-carbon, liquid fuels
9
Adopted in 2009 by the State of California To reduce California’s transportation fuel carbon intensity (CI) by
10% in 2020 relative to 2010 Gasoline Diesel Alternative fuels Electricity and hydrogen
GHG emissions for various fuels are determined on LCA basis Carbon intensity (CI), in grams of GHGs (CO2, CH4, and N2O), is the measure
of GHG emissions associated with producing and consuming a fuel GREET was adapted to CA-GREET to decide fuel’s LCA GHG intensity (or well-
to-wheels CI) LCFS has been the most successful program so far; CARB is now
deciding LCFS requirement for after 2020

Key factors determining biofuel LCA results
LCA system boundary
Feedstock types
Conversion technologies: energy balance and materials inputs such as enzyme and catalyst
Technology improvement over time
Biorefineries with distinctly different products: co-product methods
Direct and indirect land use changes
10

•11
GREET system boundary for biofuel LCA: direct activities and indirect effects are included

WTW analysis of petroleum fuel pathways
Refining process Second-largest GHG emissions source in fuel cycle Complex system with multiple co-products Key process for assessing the impact of producing
HOF12
Petroleum Refining

Key factors determining biofuel LCA results
LCA system boundary
Feedstock types
Conversion technologies: energy balance and materials inputs such as enzyme and catalyst
Technology improvement over time
Biorefineries with distinctly different products: co-product methods
Direct and indirect land use changes
13

GREET renewable jet fuel GHGs: feedstock and conversion are key drivers
14
Based on GREET2016. Emissions from land use change is not included.

GREET life-cycle GHG emissions of selected biofuels: feedstock is the main driver
15
9557
328 11 -4
-150
-100
-50
0
50
100
150
With LUC Without LUC With LUC With LUC With LUC
Gasoline Corn ethanol Sugarcaneethanol
Corn stoverethanol
Switchgrassethanol
Miscanthusethanol
WTW
GH
G e
mis
sion
s, g
CO
2e/M
JWTP Biogenic CO₂ in Fuel PTW LUC WTW
3 - Accomplishments

Emission breakout for two ethanol types
16
Corn Ethanol
Corn Stover Ethanol

Key factors determining biofuel LCA results
LCA system boundary
Feedstock types
Conversion technologies: energy balance and materials inputs such as enzyme and catalyst
Technology improvement over time
Biorefineries with distinctly different products: co-product methods
Direct and indirect land use changes
17

Fertilizer use in U.S. corn farming has reduced significantly in the past 40 years
18
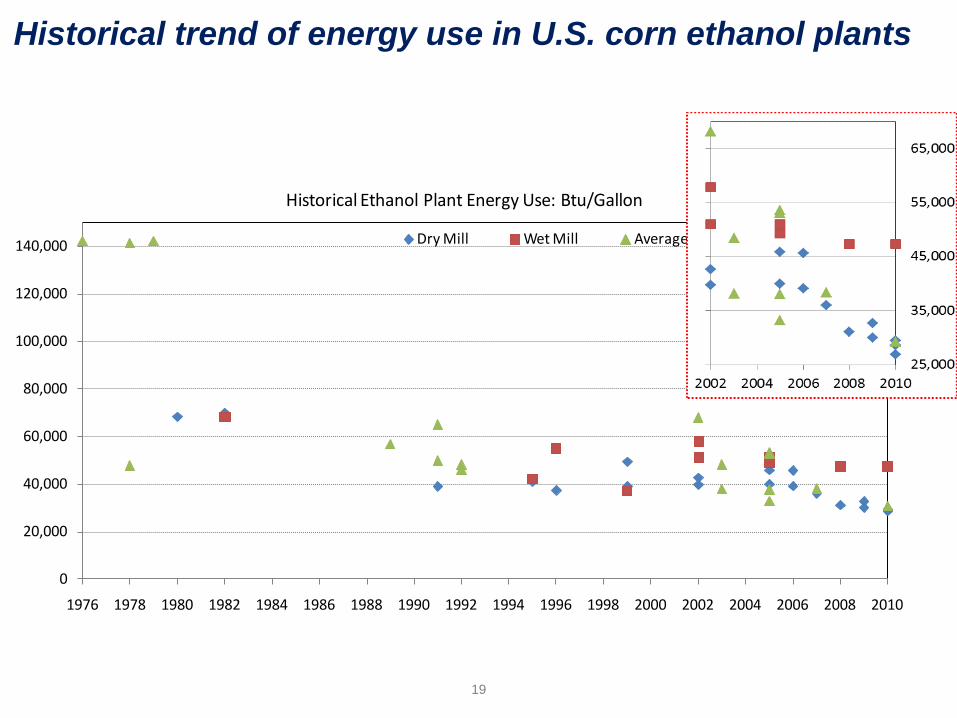
This is US annual statistics. Measured data at farm level will help biofuel LCA move to finer resolution.
0
20,000
40,000
60,000
80,000
100,000
120,000
140,000
1976 1978 1980 1982 1984 1986 1988 1990 1992 1994 1996 1998 2000 2002 2004 2006 2008 2010
Dry Mill Wet Mill Average
Historical Ethanol Plant Energy Use: Btu/Gallon
Historical trend of energy use in U.S. corn ethanol plants
19

Key factors determining biofuel LCA results
LCA system boundary
Feedstock types
Conversion technologies: energy balance and materials inputs such as enzyme and catalyst
Technology improvement over time
Biorefineries with distinctly different products: co-product methods
Direct and indirect land use changes
20

Integrated production of grain and stover ethanol can help further GHG reductionsEthanol with corn grain and corn stover can energy and
cost synergy for ethanol production
•21 Canter et al., BioEneg. Res., 2015.
Process
Material and Energy Flows
Heat
Electricity

Choice of co-product methods can have significant LCA effects
-120,000
-80,000
-40,000
0
40,000
80,000
C-E1
C-E2
C-E3
C-E4
C-E5
G-E
1
G-E
2
G-E
3
S-BD
1
S-BD
2
S-BD
3
S-BD
4
S-RD
1
S-RD
2
S-RD
3
S-RD
4
S-RD
5
. Gasoline . Diesel . Corn-EtOH . Switchgrass - EtOH . Biodiesel . Renewable Diesel .
GHG
Em
issi
ons
(g/m
mBt
u)
.
PTWWTPWTW
Soybean
Soy Meal
Soy Oil Naphtha
Jet Fuel
Light Ends
Renewable Diesel
22

Choice of benefits from CHP-produced heat influences life-cycle GHG emissions of co-produced fuels
Corn ethanol GHG emissions are below emissions for corn ethanol produced in a stand-alone facility Stover ethanol life-cycle GHG
emissions are higher than when it is treated as a stand-alone fuel Treat Allocation strongly affects
results and should be transparently documented
•23Canter et al., BioEneg. Res., 2015.
Net GHG emissions for corn grain and stover ethanol for the baseline and the two alternative CHP usage scenarios. The 20%, 50%, and 60% GHG reduction lines represent the targets for the corresponding reduction in GHG emissions compared with gasoline at 94 g CO2eq/MJ. The line for grain ethanol and stover ethanol represent the GHG emissions to produce these fuels in a non-integrated scenario.

Paper to be published in BioFPR
19
Co-product handling methods and results for integrated biorefineries (IBR) with fuels and products

IBRs with significant amount of biochemicals pose challenges to fuel LCA
– Fuel-specific LCA GHGs can be greatly impacted by the co-produced biochemicals• IBRs are highly integrated for heat needs and products; difficult and
unrealistic to separate inputs into different products from IBRs• Various co-product methods are adopted in LCA of a specific product
– Current fuel-focused GHG regulations, i.e., RFS and LCFS, do not directly consider GHG benefits of biochemicals• Fuel-specific LCA results are highly dependent on co-product
handling methods• Fuel-specific LCA results may or may not include the biochemical
GHG impacts, depending on co-product handling methods, and thus may cause potential “positive” leakage of GHG reduction benefits from biochemicals
20

Evaluated IBR produces renewable diesel blendstock (RDB) and succinic acid (SA)– A significant amount of co-produced SA: 62.6 kg SA per mmBtu of RDB
LCA of IBR: the succinic acid (SA) case
21

Co-product methods for fuels: displacement, IBR system-level allocation, and process-level allocation
27
Pathways Co-product handling methods Allocation basis
a) RDB production only No co-product method needed
b) RDB in RDB/SA co-production
System-level allocation
Carbon efficiencyMarket value, 100% of current SA priceMarket value, 50% of current SA priceMass
Process-level allocation
Carbon efficiencyMarket value, 100% of current SA priceMarket value, 50% of current SA priceMass
DisplacementSA displacing petroleum-derived maleic anhydride
c) RDB in RDB/AA co-production
System-level allocation
Carbon efficiencyMarket value, 100% of current AA priceMarket value, 50% of current AA priceMass
Process-level allocation
Carbon efficiencyMarket value, 100% of current AA priceMarket value, 50% of current AA priceMass
Displacement AA displacing natural gas-derived AA

Life-cycle GHG emissions of RDB from IBRs with co-production of SA
28

Biorefinery-level integrated LCA Link product-specific emission results to IBR production volumes for specific
products Provide facility-level LCA with total emission changes and contributions of
individual products Present results of the entire facility
29
-2,000,000
-1,500,000
-1,000,000
-500,000
0
500,000
1,000,000
RDB Only with No Co-product Design SA Co-production Design AA Co-production Design
CO
2e, m
etric
tons
/yea
r
Annual biorefinery-level GHG emission reductions
Biorefinery total GHG emissions RDB displacement emission creditBio-chemical displacement emission credit Biorefinery total GHG emission reduction

Corn ethanol plant: grain ethanol, corn oil biodiesel, corn fiber ethanol (manuscript submitted to BioFPR)
30
(a) The pathway is based on corn starch ethanol production with corn oil extraction (dry mill) . Main products include starch and fiber ethanol. The co-products DGS and corn oil are displaced by animal feed and soy oil, respectively. (b) Co-products are treated with combined ethanol approach. (c) Co-products are treated with separate ethanol approach.

Corn grain ethanol vs. corn fiber ethanol GHG results
31
-20.0
0.0
20.0
40.0
60.0
80.0
Starch ethanol,conventional
Starch and fiberethanol, nth
Starch ethanol,nth
Fiber ethanol,nth
GH
G e
mis
sion
s (g
CO
2e M
J-1 )
Corn Ethanol Vehicle DGS Oil Total
b Gasoline (94)
20% reduction
50% reduction60% reduction
100% reduction
-20.0
0.0
20.0
40.0
60.0
80.0
Starch ethanol,conventional
Starch and fiberethanol, SOT
Starch ethanol,SOT
Fiber ethanol,SOT
GH
G e
mis
sion
s (g
CO
2e M
J-1 )
Corn Ethanol Vehicle DGS Oil Total
a Gasoline (94)
20% reduction
50% reduction60% reduction
100% reduction
(a) SOT and (b) nth plant technology

Trend of estimated LUC GHG emissions for corn and sugarcane ethanol
32
Critical factors for LUC GHG emissions: Land intensification vs. extensification
• Crop yields: existing cropland vs. new cropland; global yield differences and potentials• Double cropping on existing land• Extension to new land types: cropland, grassland, forestland, wetland, etc.
Price elasticities• Crop yield response to price• Food demand response to price
Soil organic carbon changes from land conversions and land management
Corn Ethanol 0
5
10
15
20
25
30
35
40
45
50
CAR
B20
09
EPA
2010
Labo
rde
2011
CAR
B20
15
EU F
QD
(pro
p.)
2015
ECO
FSY
2015
LUC
GH
G E
mis
sion
s (g
CO
2e/M
J)
Sugarcane Ethanol

33
Carbon Calculator for Land Use Change from Biofuels (CCLUB) module in GREET

GREET LCA water consumption results (L/GJ): irrigation for biofuel feedstocks can increase water use
34
• Water LCA accounts for life-cycle freshwater consumption of transportation fuel production by evaluating the entire supply chain for each production pathway.
• Major water consumers include irrigation for biofuel feedstocks, and hydro- and thermo-electric power plants.

Biomass additionality argument questions whether bioenergy systems have carbon reductionsOnly additional biomass growth in biophysical systems can
result in carbon neutrality for bioenergyBiomass additionality by bioenergy
– Switch between biomass uses among different purposes vs. additional biomass growth: • Productivity of different biophysical systems • Biomass growth: managed systems vs. natural
biophysical systems – Length of carbon cycle of biomass feedstocks is a key
dimension• Annual: annual crops and perennial grasses• A few years: short-rotation trees• 50-100 years: forests
35

ConclusionsGREET has become a standard LCA tool to examine energy and
environmental footprints of energy systemsGREET has been used by EPA and CARB to develop RFS and LCFS
regulations; it is now a compliance tool for LCFSGREET biofuel LCA includes all activities for biomass growth: Farming energy input Fertilizer production and use Farming management practices
High-level biofuel result summary Biofuel LCA results are dominated by feedstock types (1st gen., 2nd gen., and
3rd gen. feedstocks) Conversion technologies to produce hydro-carbon fuels and jet fuels require
hydrogen Farming management practices can affect biofuel sustainability in general
and LCA GHG results in particular
36

37
Please visithttp://greet.es.anl.gov for:
• GREET models• GREET documents • LCA publications
• GREET-based tools and calculators

•38
There are nearly 30,000 registered GREET users globally
Geographically, 71% in North America, 14% in Europe, 9% in Asia
57% in academia and research, 33 % in industries, 8% in governments

GREET examines more than 80 on-road vehicle/fuel systems for both LDVs and HDVs
Conventional Spark-Ignition Engine Vehicles Gasoline Compressed natural gas, liquefied natural gas,
and liquefied petroleum gas Gaseous and liquid hydrogen Methanol and ethanol
Spark-Ignition, Direct-Injection Engine Vehicles Gasoline Methanol and ethanol
Compression-Ignition, Direct-Injection Engine Vehicles Diesel Fischer-Tropsch diesel Dimethyl ether Biodiesel
Fuel Cell Vehicles On-board hydrogen storage
– Gaseous and liquid hydrogen from various sources
On-board hydrocarbon reforming to hydrogen
Battery-Powered Electric Vehicles Various electricity generation sources
Hybrid Electric Vehicles (HEVs) Spark-ignition engines:
– Gasoline– Compressed natural gas, liquefied natural
gas, and liquefied petroleum gas– Gaseous and liquid hydrogen– Methanol and ethanol
Compression-ignition engines– Diesel– Fischer-Tropsch diesel– Dimethyl ether– Biodiesel
Plug-in Hybrid Electric Vehicles (PHEVs) Spark-ignition engines:
– Gasoline– Compressed natural gas, liquefied natural
gas, and liquefied petroleum gas– Gaseous and liquid hydrogen– Methanol and ethanol
Compression-ignition engines– Diesel– Fischer-Tropsch diesel– Dimethyl ether– Biodiesel
39

GREET approach and data sources Approach Build a consistent LCA platform with reliable, widely accepted methods/protocols Address emerging LCA issuesMaintain openness and transparency of LCAs by making GREET publicly
available Primarily process-based LCA approach (the so-called attributional LCA); some
features of consequential LCA are incorporated
Data sources Open literature and results from other researchers DOE and other agencies R&D results
Fuel producers and technology developers for fuels and automakers for vehicles
Simulations with models such as ASPEN Plus for fuel production and ANL Autonomie and EPA MOVES for vehicle operations
Baseline technologies and energy systems: EIA Annual Energy Outlook (AEO) projections, EPA eGrid for electric systems, etc.
40

US Federal Renewable Fuel Standard (RFS) promotes biofuels in transportation
41

US biofuel volumes under the RFS program
42
0
2,000
4,000
6,000
8,000
10,000
12,000
14,000
16,000
18,000
20,000
2010 2011 2012 2013 2014 2015 2016 2017
M g
al/Y
r
Cell. biofuel (D3) Adv. Biofuel (D5) Biomass-based diesel (D4) Rew. Fuel (D6)
From Bob Lane of Jacobsen

California LCFS has increased alternative fuels significantly
43
0200400600800
1,0001,2001,4001,6001,8002,000
2011 2012 2013 2014 2015 2016
Mill
on G
allo
n Eq
uiva
lent
s (G
GE)
Ethanol Biodiesel Renewable Diesel Fossil Natural Gas Biomethane Electricity
Ethanol LCFS credits LCFS: $90-100/ton CO2 (imputed from LCFS trading) CA economy-wide carbon market: $13-15/ton CO2 With $100/ton LCFS CO2 price; a gallon of ethanol has LCFS credit:
EtOH CI: gCO2e/MJ LCFS value: $/gal EtOH
70 (corn EtOH) $0.45
50 (corn EtOH) $0.81
30 (sugarcane EtOH) $1.1710 (Cell EtOH) $1.53

•44
LUC-related GHG emissions vary significantly among biofuel feedstocks
LUC GHG emissions
(g CO2eq MJ-1)WTW GHG
w/o LUC
(g CO2e MJ-1)
WTW GHG w/
LUC
(g CO2e MJ-1)Domestic International Total
Corn 1.4 ‒ 4.3 5.0 6.4 ‒ 9.3 57.1 63.5 ‒ 66.4
Miscanthus -22.3 ‒ -16.3 2.2 -20.1 ‒ -14.1 13.5 -6.7 ‒ -0.6
Note: 1) LUC GHG emissions are based on 100cm soil depth; variations reflect types of land impacted and land management practices.2) Conversion of cropland to cornfield with sustainable stover removal could result in increased SOC; conversion of grassland or forest to cornfield could result in decreased SOC
For cellulosic feedstocks, conversion of cropland and grassland to energy grass fields (e.g., Miscanthus farms) could increase or maintain SOC

45
Production of bioenergy feedstocks can cause land-use change and/or land management change
Forest, grassland, cropland, cropland-pasture CroplandLand types
Land Use Change Land Management Change
Land Management
Feedstock Options
Conventional, reduced and no Till Cover crop, manure application
Corn grain
Corn stoverPoplarMiscanthusSwitchgrassSoy Willow

SOC changes upon land transition vary spatially and by feedstock type
From Cropland Pasture From Forest
To C
orn
To M
isca
nthu
s
SOC rate t ha-1 yr-1
Qin et al., GCB Bioenergy, 2016.


![Chapter 3 Phenotyping in Sorghum [Sorghum bicolor (L.) Moench]](https://img.dokumen.tips/doc/110x75/61b4aa26258cbf24e0723b12/chapter-3-phenotyping-in-sorghum-sorghum-bicolor-l-moench.jpg)