Embed Size (px)
DESCRIPTION
Sorghum Fertility. Brian Arnall Oklahoma State University Dept Plant and Soil Sciences. Outline. Nitrogen Phosphorous Potassium pH Micro’s. Soil Testing. OSU, Ward, ect. $10 - $15 20 lb N $9 20 lb P $7.2 ¼ Ton Lime $5-10 Per Acre!!!!! Some Co-Ops and Fertilizer Dealers, - PowerPoint PPT Presentation
Citation preview

Sorghum Fertility
Brian ArnallOklahoma State University
Dept Plant and Soil Sciences

Outline
• Nitrogen
• Phosphorous
• Potassium
• pH
• Micro’s
Soil Testing
• OSU, Ward, ect. $10 - $15– 20 lb N $9– 20 lb P $7.2– ¼ Ton Lime $5-10
» Per Acre!!!!!
• Some Co-Ops and Fertilizer Dealers, – Take and Process samples for FREE!!!!!!

Nitrogen
• Determined by Yield LevelN
lbs / ac bu / ac lb / ac2000 36 302500 45 403000 54 504000 71 704500 80 855000 89 1007000 125 1608000 143 1959000 161 230
Grain Yield


Strips and Sensors

• Independent of Yield
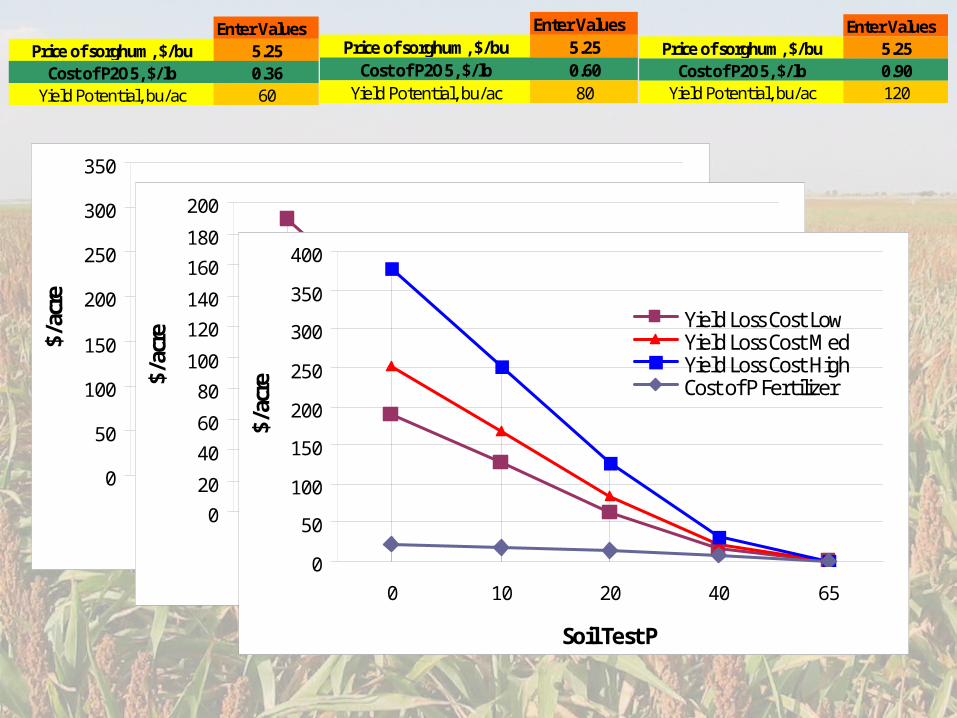
Phosphorous
Enter Values5.250.36100
STP Index Sufficiency P2O5 Needs Yield Loss w/o Plb /ac % lbs/ac bu/ac
0 40 60 6010 60 50 4020 80 40 2040 95 20 565 100 0 0
Yield Potential, bu/ac
Price of sorghum, $/buCost of P2O5, $/lb
0
50
100
150
200
250
300
350
0 10 20 40 65
Soil Test P
$/ac
re
Yield Loss Cost
Cost of P Fertilizer
0
20
40
60
80
100
120
140
160
180
200
0 10 20 40 65
Soil Test P
$/ac
re
Yield Loss CostCost of P FertilizerCost of P Fertilizer MedCost of P Fertilizer High
0
50
100
150
200
250
300
350
400
0 10 20 40 65
Soil Test P
$/ac
re
Yield Loss Cost LowYield Loss Cost MedYield Loss Cost HighCost of P Fertilizer
Enter Values5.250.3660Yield Potential, bu/ac
Price of sorghum, $/buCost of P2O5, $/lb
Enter Values5.250.6080
Price of sorghum, $/buCost of P2O5, $/lb
Yield Potential, bu/ac
Enter Values5.250.90120
Price of sorghum, $/buCost of P2O5, $/lb
Yield Potential, bu/ac


• Independent of Yield
Potassium
Enter Values5.251.10100
STK Index Sufficiency K2O needs Yield Loss w/o Klb /ac % lbs/ac bu/ac
0 40 100 6075 65 75 35
125 80 50 20200 95 30 5250 100 0 0
Yield Potential, bu/ac
Price of Sorghum, $/buCost of K2O, $/lb


Variability
Soil Test K variability among 24 1-acre cells in a field, 2001
0
50
100
150
200
250
300
350
1 2 3 4 5 6 7 8 9 10 11 12 13 14 15 16 17 18 19 20 21 22 23 24
Cell
So
il T
es
t K
Area STK Point STK
Soil test P variability among 24 1-acre cells in a field, 2001
0
65
130
195
260
325
1 2 3 4 5 6 7 8 9 10 11 12 13 14 15 16 17 18 19 20 21 22 23 24
Cell
So
il T
est-
P
Area STP Point STP

pH Issues
WheatpH Rel Yld Yield Econ $3.8 0 0 214.004.1 0.3 12 149.804.5 0.6 24 85.605 0.85 34 32.10
5.5 0.95 38 10.706 1 40 0.00
Average Yld 40 Grain $ 5.35
Sorghum pH Rel Yld Yield Econ $4.55
5.3 0.82 66 74.445.7 0.88 71 48.175.9 0.95 76 21.896.2 1 80 0.006.9 1 80 0.00
Average Yld 80 Grain $ 5.2
Mixed Reports, some state more Al tolerant and others show less.
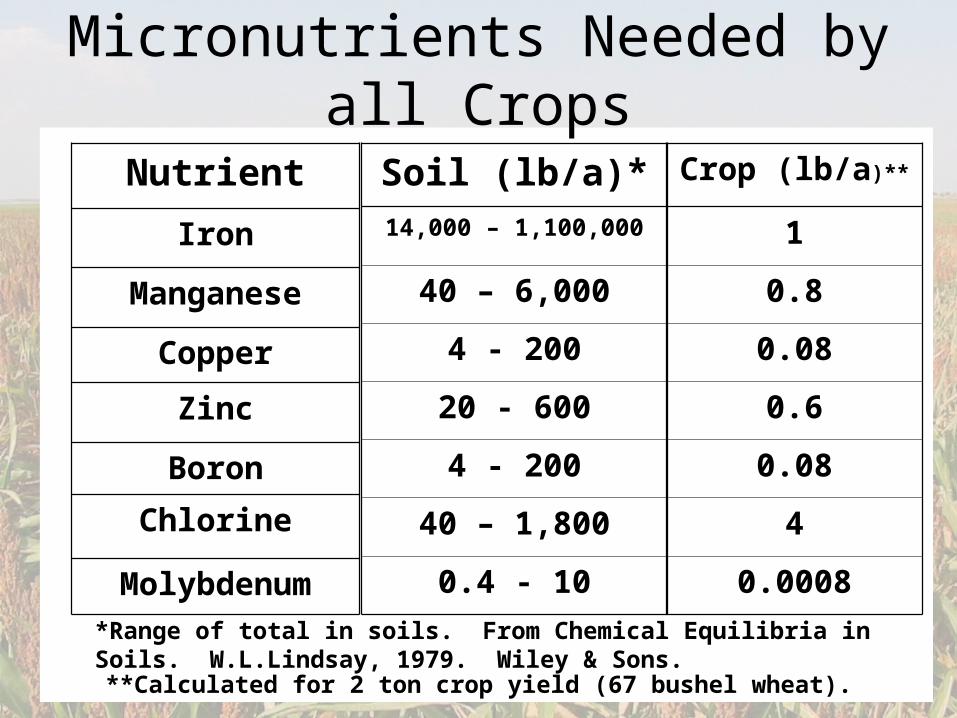
Nutrient
Iron
Manganese
Copper
Zinc
Boron
Chlorine
Molybdenum
Soil (lb/a)*14,000 – 1,100,000
40 – 6,000
4 - 200
20 - 600
4 - 200
40 – 1,800
0.4 - 10
*Range of total in soils. From Chemical Equilibria in Soils. W.L.Lindsay, 1979. Wiley & Sons.
Crop (lb/a)**
1
0.8
0.08
0.6
0.08
4
0.0008
**Calculated for 2 ton crop yield (67 bushel wheat).
Micronutrients Needed by all Crops
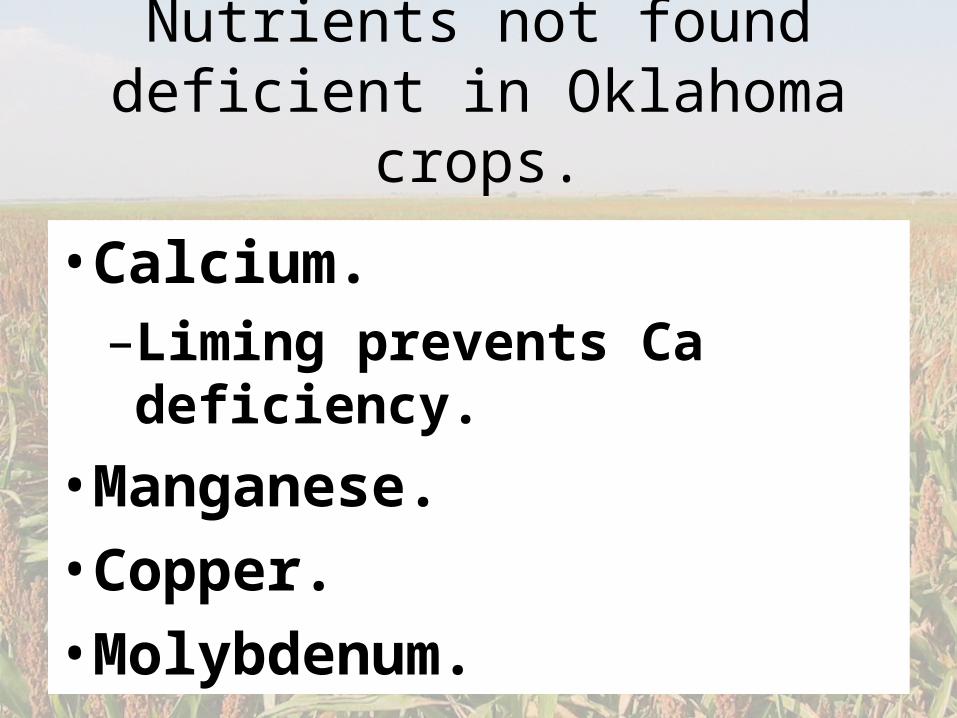
Nutrients not found deficient in Oklahoma crops.
• Calcium.–Liming prevents Ca
deficiency.
• Manganese.
• Copper.
• Molybdenum.
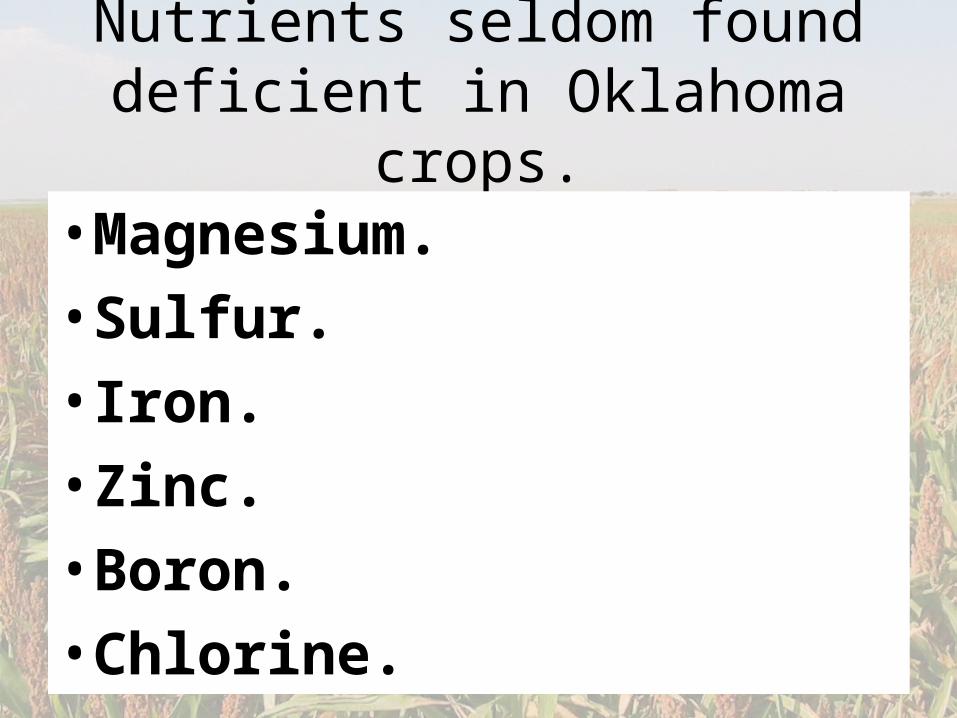
Nutrients seldom found deficient in Oklahoma crops.
• Magnesium.
• Sulfur.
• Iron.
• Zinc.
• Boron.
• Chlorine.

MgYellowing between veins, old leaves Dolomitic Lime Sul-po-Mag, K-Mag

SulfurCan look like N, Yellowing between veinsGyp, S, Ammon Sulfate

IronYellowing between veins, new leavesFerrous Sulfate, ect

Micro Nutrients
• Zinc, Bronze between Margin and Midrib. Bleaching on either side of Midrib Zinc Sulfate, Zinc Chloride, Zinc Chelate
• Boron, Borax
• Chloride, Upper Leave Wilt,Muriate of Potashwhich K is usually also deficient
Soil Testing
Just Do It!Just Do It!

Thank You!
• Corn and Sorghum Nutrient Need Pete’s Sheets coming soon


![RESEARCH Open Access Genotypic variation in sorghum [Sorghum … · 2018-06-03 · RESEARCH Open Access Genotypic variation in sorghum [Sorghum bicolor (L.) Moench] exotic germplasm](https://img.dokumen.tips/doc/110x75/5f03a3af7e708231d40a0b15/research-open-access-genotypic-variation-in-sorghum-sorghum-2018-06-03-research.jpg)


![Chapter 3 Phenotyping in Sorghum [Sorghum bicolor (L.) Moench]](https://img.dokumen.tips/doc/110x75/61b4aa26258cbf24e0723b12/chapter-3-phenotyping-in-sorghum-sorghum-bicolor-l-moench.jpg)