Embed Size (px)
Citation preview
Greenwich Central School Junior-Senior High School
Academic Achievement Report
2015-2016 School Year
Graduation Information/Class Profile – 2016
2016 Regents Examinations Results
2016 AP Results
2016 Middle Level State Exam Results
2016 GED Program Results
2
Table of Contents
2015-2016 Regents Exam Summary Page 3 School Wide Regents Diploma Comparison 2015-2016 Page 4 School Wide Regents Exam Results Comparison 2015-2016 2016 Grade 7 and 8 State Exam Results Page 5 2016 State Exam Results for Special Education Students Page 6 2016 State Exam Results for Students Receiving Academic Intervention Services (AIS) Page 7 2016 AP Results Page 8-9 2016 Regents Results Global Studies Page 10 United States History and Government Page 11 Integrated Algebra Page 12
Integrated Algebra Common Core Page 13 Geometry Page 14 Geometry Common Core Page 15
Algebra 2 / Trigonometry Page 16 Algebra 2 Common Core Earth Science Page 17 Living Environment Page 18 Chemistry Page 19 Physics Page 20 Comprehensive English Common Core Page 21 2016 NYSED Middle Level Testing Results Grade 8 Science Page 23 Grade 8 ELA Page 24
Grade 8 Math Page 25 Grade 7 ELA Page 26 Grade 7 Math Page 27 GRADE Reading Assessment Grade 8 Page 28 GRADE Reading Assessment Grade 7 Page 29 2016 GED Program Review Page 30 Class of 2016 Profile Page 31
3
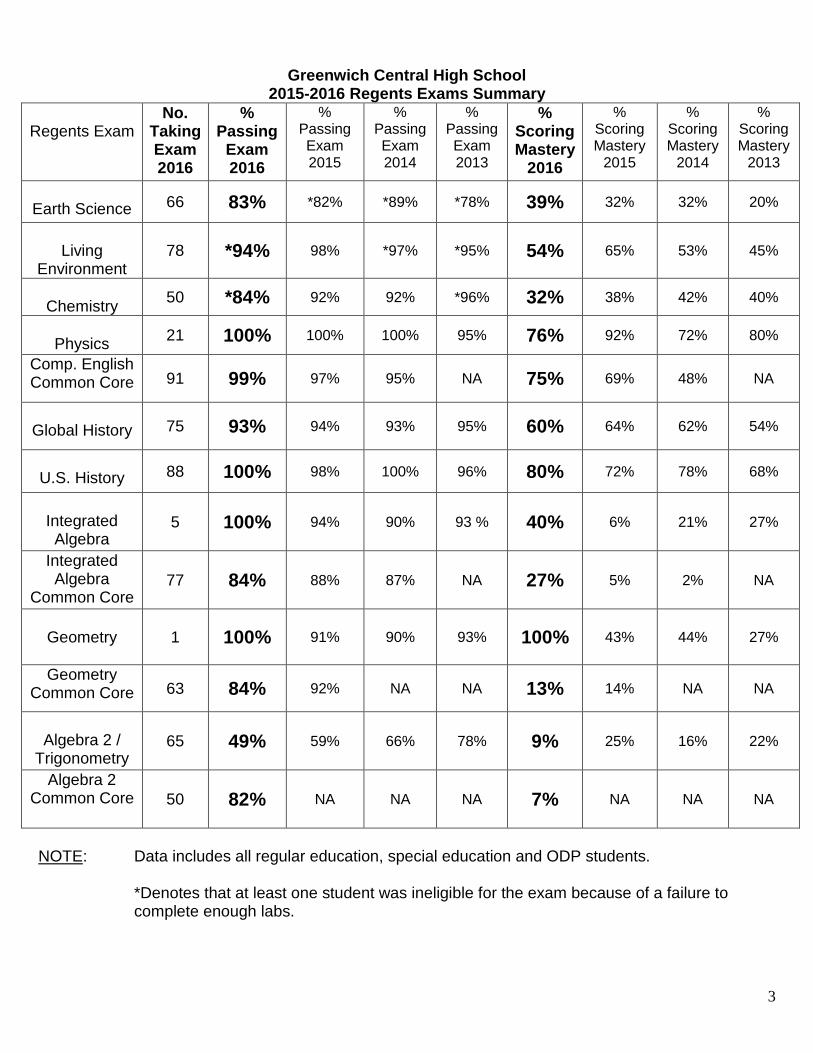
Greenwich Central High School
2015-2016 Regents Exams Summary
NOTE: Data includes all regular education, special education and ODP students.
*Denotes that at least one student was ineligible for the exam because of a failure to complete enough labs.
Regents Exam
No. Taking Exam 2016
% Passing
Exam 2016
% Passing Exam 2015
% Passing Exam 2014
% Passing Exam 2013
% Scoring Mastery
2016
% Scoring Mastery
2015
% Scoring Mastery
2014
% Scoring Mastery
2013
Earth Science 66 83% *82% *89% *78% 39% 32% 32% 20%
Living
Environment 78 *94% 98% *97% *95% 54% 65% 53% 45%
Chemistry
50 *84% 92% 92% *96% 32% 38% 42% 40%
Physics
21 100% 100% 100% 95% 76% 92% 72% 80%
Comp. English Common Core 91 99% 97% 95% NA 75% 69% 48% NA
Global History 75 93% 94% 93% 95% 60% 64% 62% 54%
U.S. History 88 100% 98% 100% 96% 80% 72% 78% 68%
Integrated Algebra
5 100% 94% 90% 93 % 40% 6% 21% 27%
Integrated Algebra
Common Core 77 84% 88% 87% NA 27% 5% 2% NA
Geometry
1 100% 91% 90% 93% 100% 43% 44% 27%
Geometry Common Core 63 84% 92% NA NA 13% 14% NA NA
Algebra 2 /
Trigonometry 65 49% 59% 66% 78% 9% 25% 16% 22%
Algebra 2 Common Core 50 82% NA NA NA 7% NA NA NA
4
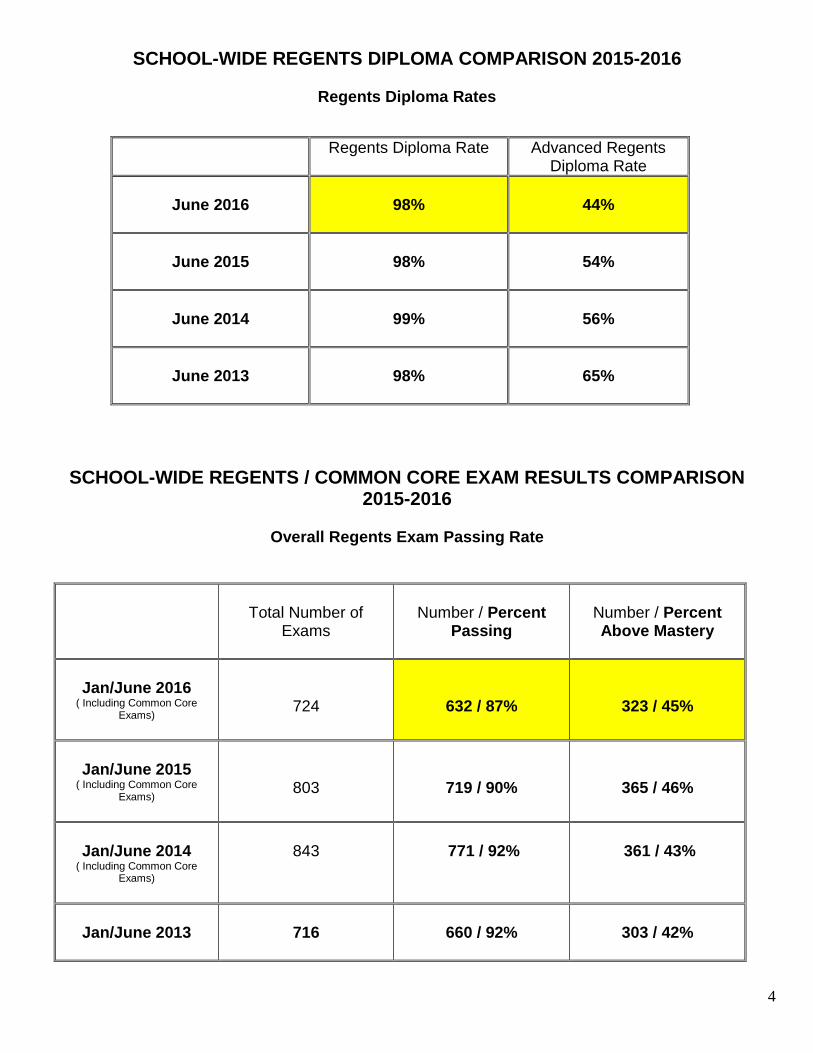
SCHOOL-WIDE REGENTS DIPLOMA COMPARISON 2015-2016
Regents Diploma Rates
Regents Diploma Rate Advanced Regents Diploma Rate
June 2016
98% 44%
June 2015
98% 54%
June 2014
99% 56%
June 2013
98% 65%
SCHOOL-WIDE REGENTS / COMMON CORE EXAM RESULTS COMPARISON 2015-2016
Overall Regents Exam Passing Rate
Total Number of
Exams
Number / Percent
Passing
Number / Percent Above Mastery
Jan/June 2016
( Including Common Core Exams)
724
632 / 87%
323 / 45%
Jan/June 2015
( Including Common Core Exams)
803
719 / 90%
365 / 46%
Jan/June 2014
( Including Common Core Exams)
843
771 / 92%
361 / 43%
Jan/June 2013
716
660 / 92%
303 / 42%
5
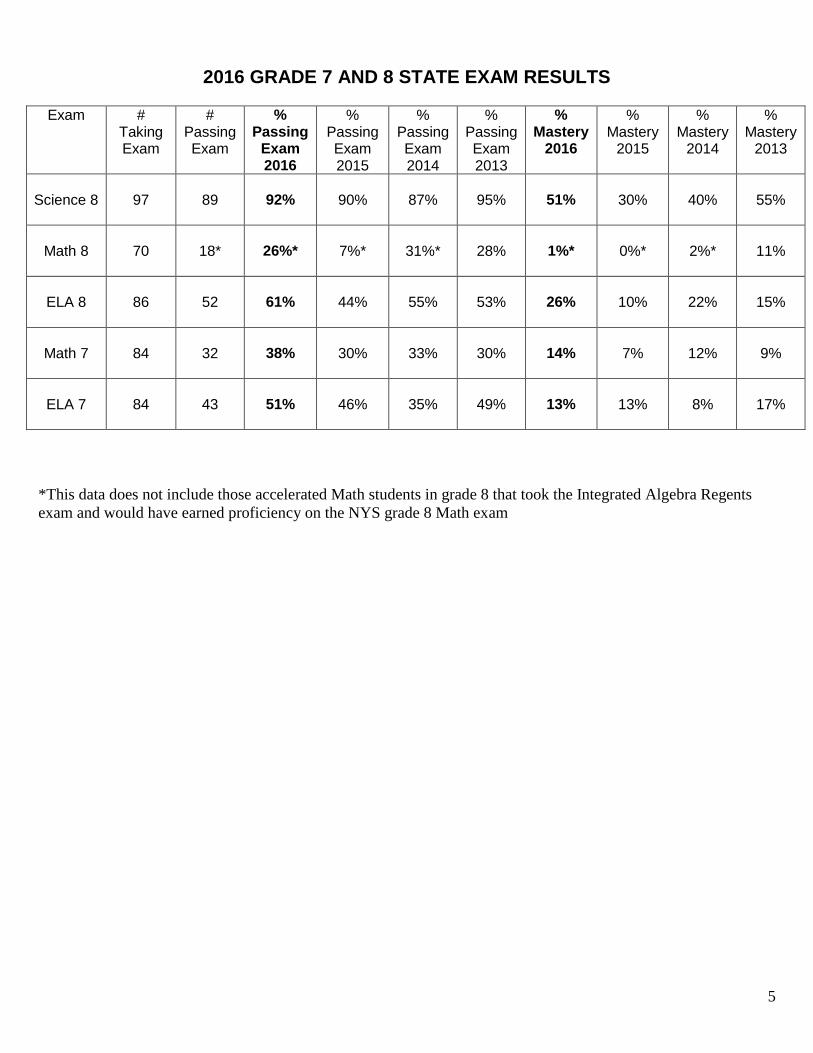
2016 GRADE 7 AND 8 STATE EXAM RESULTS
Exam # Taking Exam
# Passing Exam
% Passing
Exam 2016
% Passing Exam 2015
% Passing Exam 2014
% Passing Exam 2013
% Mastery
2016
% Mastery
2015
% Mastery
2014
% Mastery
2013
Science 8
97 89 92% 90% 87% 95% 51% 30% 40% 55%
Math 8
70
18*
26%*
7%*
31%*
28%
1%*
0%*
2%*
11%
ELA 8
86
52
61%
44%
55%
53%
26%
10%
22%
15%
Math 7
84
32
38%
30%
33%
30%
14%
7%
12%
9%
ELA 7
84
43
51%
46%
35%
49%
13%
13%
8%
17%
*This data does not include those accelerated Math students in grade 8 that took the Integrated Algebra Regents
exam and would have earned proficiency on the NYS grade 8 Math exam
6
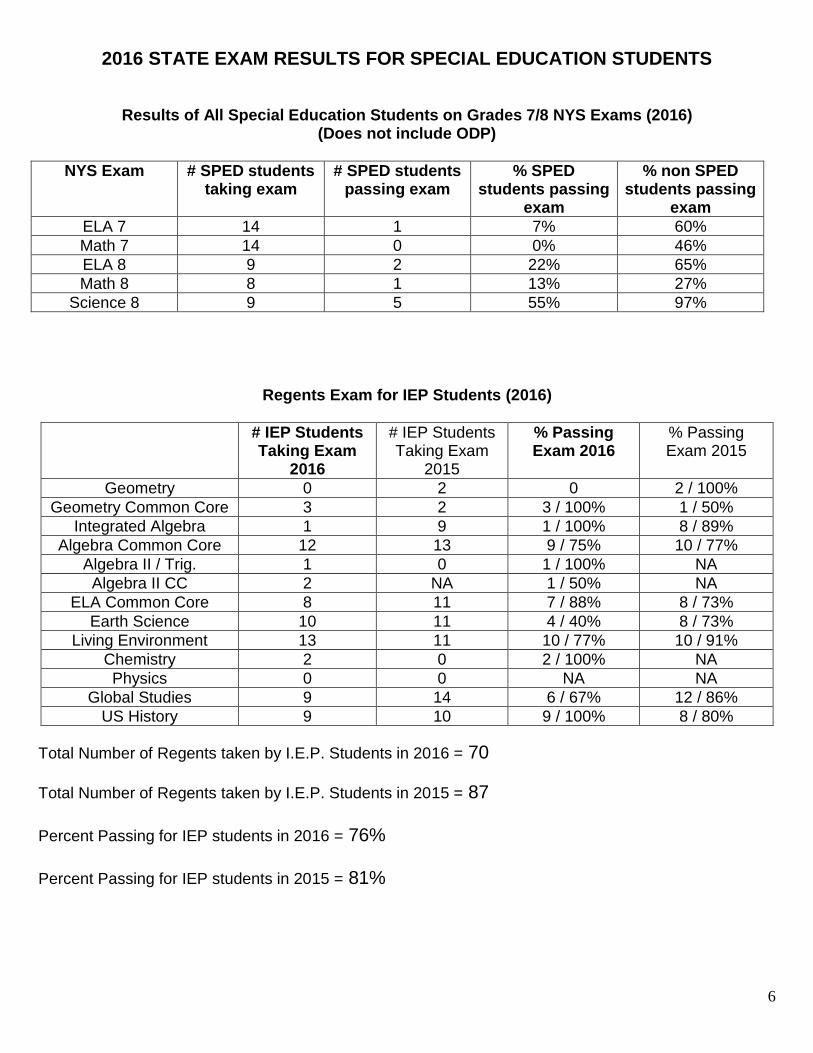
2016 STATE EXAM RESULTS FOR SPECIAL EDUCATION STUDENTS
Results of All Special Education Students on Grades 7/8 NYS Exams (2016) (Does not include ODP)
NYS Exam # SPED students taking exam
# SPED students passing exam
% SPED students passing
exam
% non SPED students passing
exam
ELA 7 14 1 7% 60%
Math 7 14 0 0% 46%
ELA 8 9 2 22% 65%
Math 8 8 1 13% 27%
Science 8 9 5 55% 97%
Regents Exam for IEP Students (2016)
# IEP Students Taking Exam
2016
# IEP Students Taking Exam
2015
% Passing Exam 2016
% Passing Exam 2015
Geometry 0 2 0 2 / 100%
Geometry Common Core 3 2 3 / 100% 1 / 50%
Integrated Algebra 1 9 1 / 100% 8 / 89%
Algebra Common Core 12 13 9 / 75% 10 / 77%
Algebra II / Trig. 1 0 1 / 100% NA
Algebra II CC 2 NA 1 / 50% NA
ELA Common Core 8 11 7 / 88% 8 / 73%
Earth Science 10 11 4 / 40% 8 / 73%
Living Environment 13 11 10 / 77% 10 / 91%
Chemistry 2 0 2 / 100% NA
Physics 0 0 NA NA
Global Studies 9 14 6 / 67% 12 / 86%
US History 9 10 9 / 100% 8 / 80%
Total Number of Regents taken by I.E.P. Students in 2016 = 70
Total Number of Regents taken by I.E.P. Students in 2015 = 87 Percent Passing for IEP students in 2016 = 76% Percent Passing for IEP students in 2015 = 81%
7
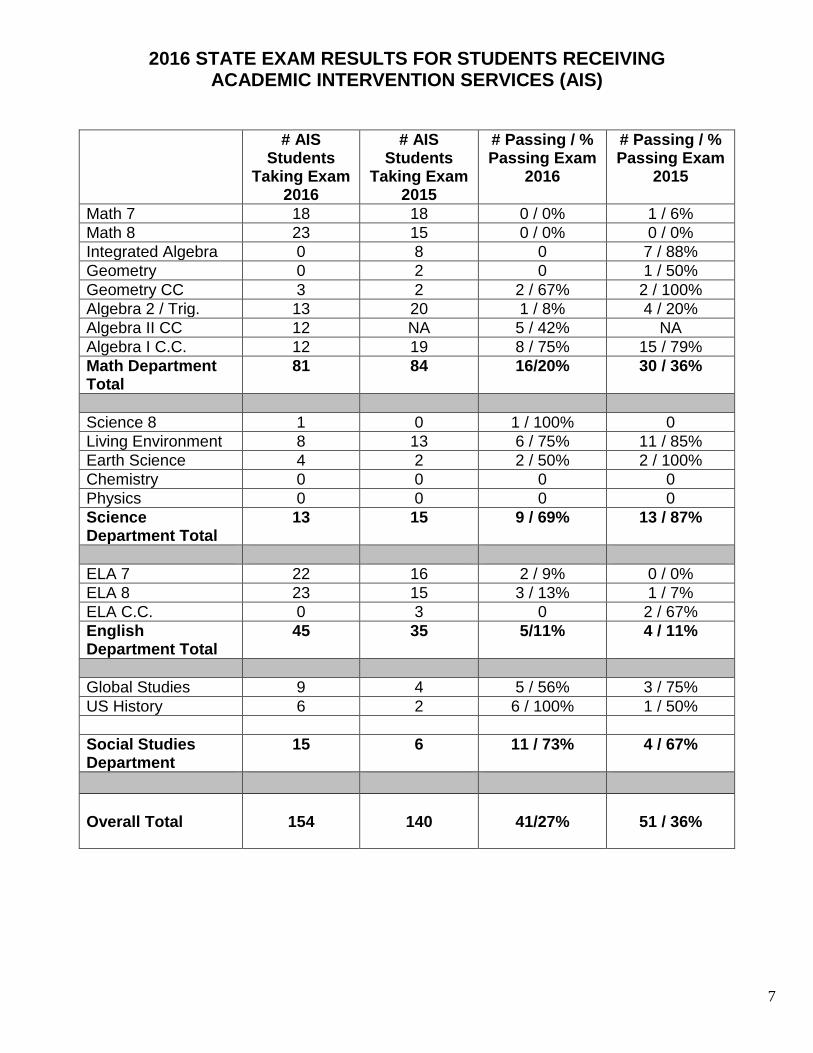
2016 STATE EXAM RESULTS FOR STUDENTS RECEIVING ACADEMIC INTERVENTION SERVICES (AIS)
# AIS Students
Taking Exam 2016
# AIS Students
Taking Exam 2015
# Passing / % Passing Exam
2016
# Passing / % Passing Exam
2015
Math 7 18 18 0 / 0% 1 / 6%
Math 8 23 15 0 / 0% 0 / 0%
Integrated Algebra 0 8 0 7 / 88%
Geometry 0 2 0 1 / 50%
Geometry CC 3 2 2 / 67% 2 / 100%
Algebra 2 / Trig. 13 20 1 / 8% 4 / 20%
Algebra II CC 12 NA 5 / 42% NA
Algebra I C.C. 12 19 8 / 75% 15 / 79%
Math Department Total
81 84 16/20% 30 / 36%
Science 8 1 0 1 / 100% 0
Living Environment 8 13 6 / 75% 11 / 85%
Earth Science 4 2 2 / 50% 2 / 100%
Chemistry 0 0 0 0
Physics 0 0 0 0
Science Department Total
13 15 9 / 69% 13 / 87%
ELA 7 22 16 2 / 9% 0 / 0%
ELA 8 23 15 3 / 13% 1 / 7%
ELA C.C. 0 3 0 2 / 67%
English Department Total
45 35 5/11% 4 / 11%
Global Studies 9 4 5 / 56% 3 / 75%
US History 6 2 6 / 100% 1 / 50%
Social Studies Department
15 6 11 / 73% 4 / 67%
Overall Total
154
140
41/27%
51 / 36%
8
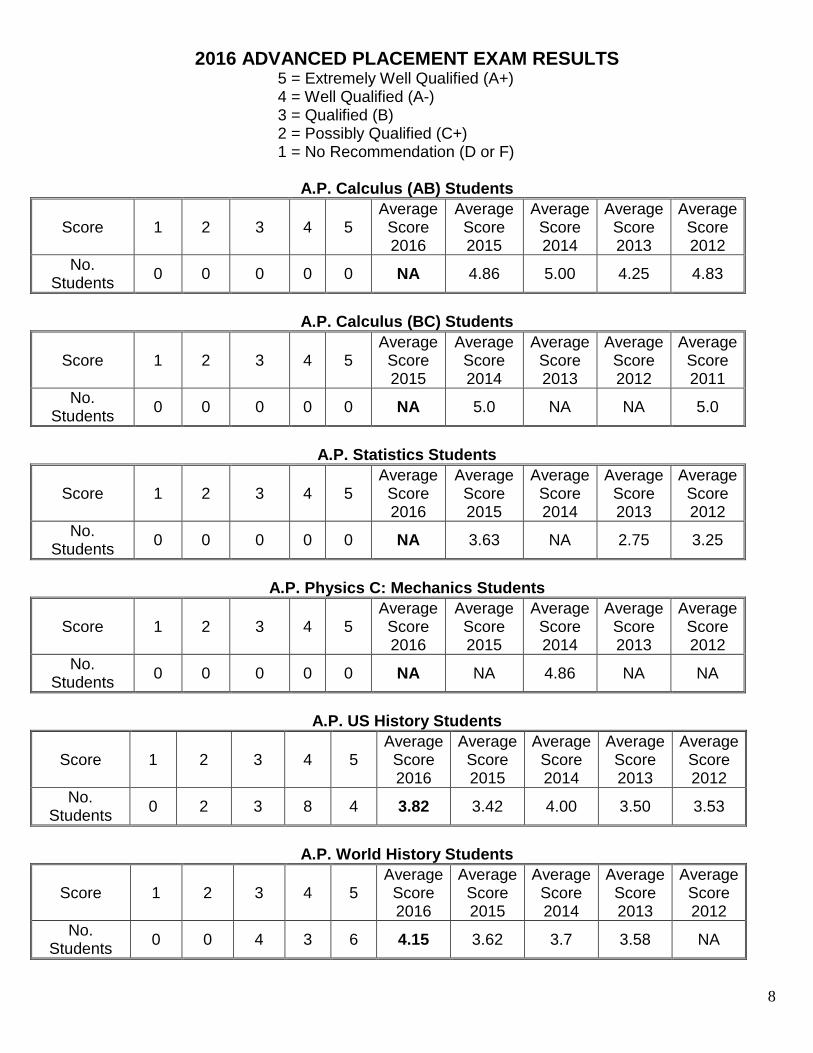
2016 ADVANCED PLACEMENT EXAM RESULTS 5 = Extremely Well Qualified (A+)
4 = Well Qualified (A-) 3 = Qualified (B) 2 = Possibly Qualified (C+) 1 = No Recommendation (D or F)
A.P. Calculus (AB) Students
Score 1 2 3 4 5 Average Score 2016
Average Score 2015
Average Score 2014
Average Score 2013
Average Score 2012
No. Students
0 0 0 0 0 NA 4.86 5.00 4.25 4.83
A.P. Calculus (BC) Students
Score 1 2 3 4 5 Average Score 2015
Average Score 2014
Average Score 2013
Average Score 2012
Average Score 2011
No. Students
0 0 0 0 0 NA 5.0 NA NA 5.0
A.P. Statistics Students
Score 1 2 3 4 5 Average Score 2016
Average Score 2015
Average Score 2014
Average Score 2013
Average Score 2012
No. Students
0 0 0 0 0 NA 3.63 NA 2.75 3.25
A.P. Physics C: Mechanics Students
Score 1 2 3 4 5 Average Score 2016
Average Score 2015
Average Score 2014
Average Score 2013
Average Score 2012
No. Students
0 0 0 0 0 NA NA 4.86 NA NA
A.P. US History Students
Score 1 2 3 4 5 Average Score 2016
Average Score 2015
Average Score 2014
Average Score 2013
Average Score 2012
No. Students
0 2 3 8 4 3.82 3.42 4.00 3.50 3.53
A.P. World History Students
Score 1 2 3 4 5 Average Score 2016
Average Score 2015
Average Score 2014
Average Score 2013
Average Score 2012
No. Students
0 0 4 3 6 4.15 3.62 3.7 3.58 NA
9
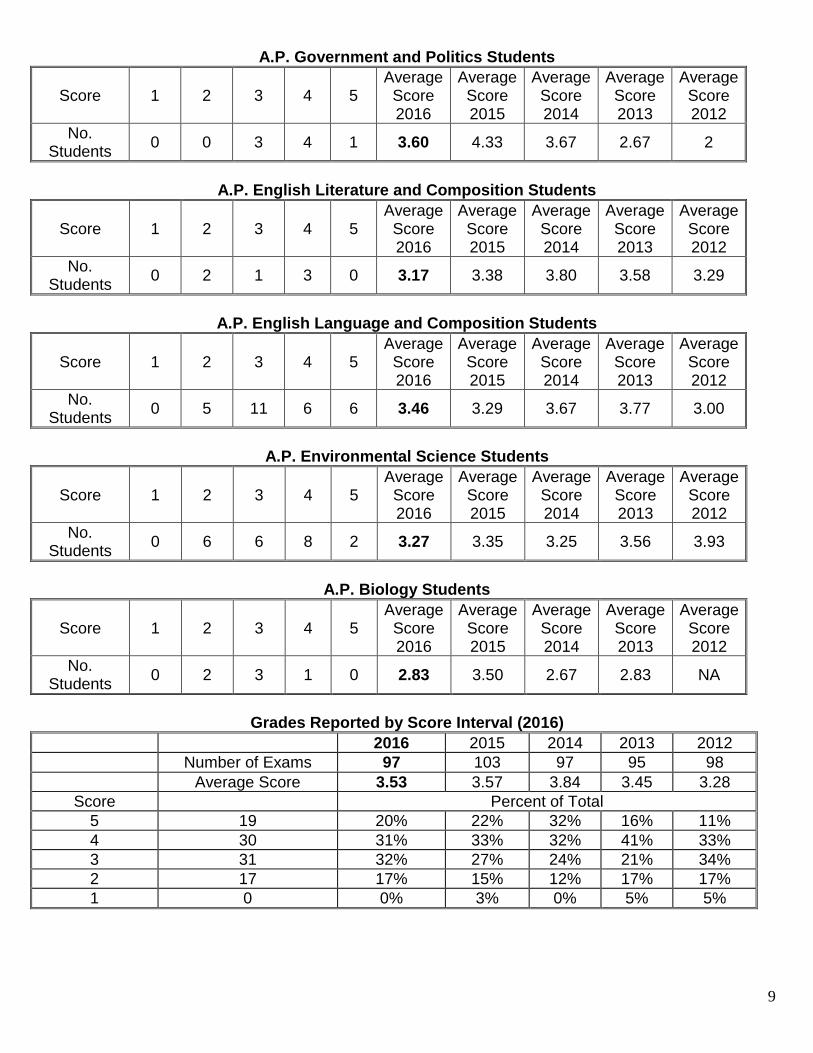
A.P. Government and Politics Students
Score 1 2 3 4 5 Average Score 2016
Average Score 2015
Average Score 2014
Average Score 2013
Average Score 2012
No. Students
0 0 3 4 1 3.60 4.33 3.67 2.67 2
A.P. English Literature and Composition Students
Score 1 2 3 4 5 Average Score 2016
Average Score 2015
Average Score 2014
Average Score 2013
Average Score 2012
No. Students
0 2 1 3 0 3.17 3.38 3.80 3.58 3.29
A.P. English Language and Composition Students
Score 1 2 3 4 5 Average Score 2016
Average Score 2015
Average Score 2014
Average Score 2013
Average Score 2012
No. Students
0 5 11 6 6 3.46 3.29 3.67 3.77 3.00
A.P. Environmental Science Students
Score 1 2 3 4 5 Average Score 2016
Average Score 2015
Average Score 2014
Average Score 2013
Average Score 2012
No. Students
0 6 6 8 2 3.27 3.35 3.25 3.56 3.93
A.P. Biology Students
Score 1 2 3 4 5 Average Score 2016
Average Score 2015
Average Score 2014
Average Score 2013
Average Score 2012
No. Students
0 2 3 1 0 2.83 3.50 2.67 2.83 NA
Grades Reported by Score Interval (2016)
2016 2015 2014 2013 2012
Number of Exams 97 103 97 95 98
Average Score 3.53 3.57 3.84 3.45 3.28
Score Percent of Total
5 19 20% 22% 32% 16% 11%
4 30 31% 33% 32% 41% 33%
3 31 32% 27% 24% 21% 34%
2 17 17% 15% 12% 17% 17%
1 0 0% 3% 0% 5% 5%
10
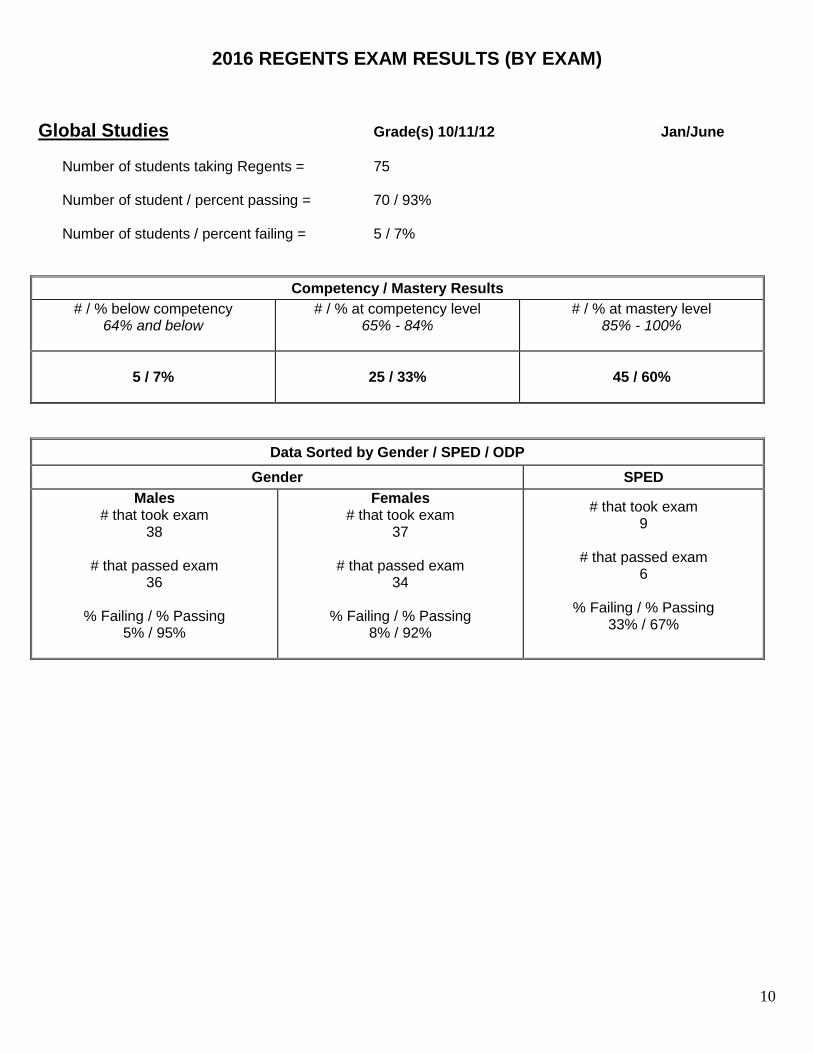
2016 REGENTS EXAM RESULTS (BY EXAM)
Global Studies Grade(s) 10/11/12 Jan/June
Number of students taking Regents = 75 Number of student / percent passing = 70 / 93% Number of students / percent failing = 5 / 7%
Competency / Mastery Results
# / % below competency 64% and below
# / % at competency level 65% - 84%
# / % at mastery level 85% - 100%
5 / 7%
25 / 33% 45 / 60%
Data Sorted by Gender / SPED / ODP
Gender SPED
Males # that took exam
38
# that passed exam 36
% Failing / % Passing 5% / 95%
Females # that took exam
37
# that passed exam 34
% Failing / % Passing 8% / 92%
# that took exam 9
# that passed exam 6
% Failing / % Passing 33% / 67%
11
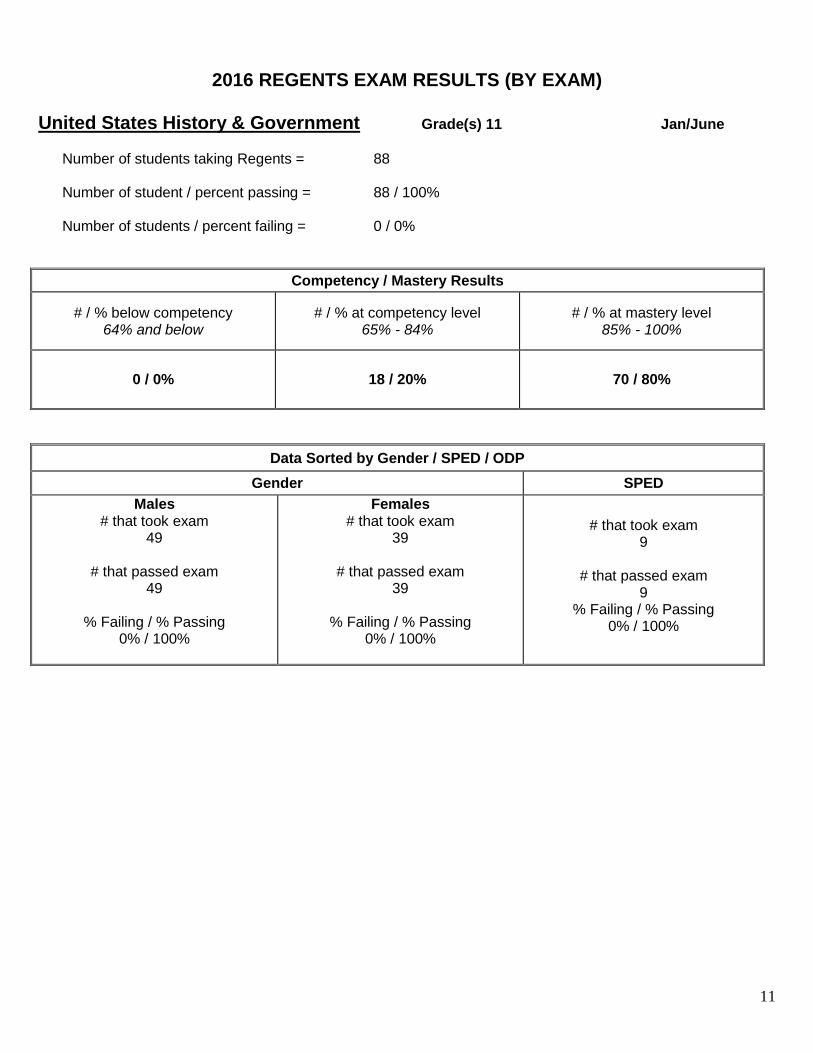
2016 REGENTS EXAM RESULTS (BY EXAM)
United States History & Government Grade(s) 11 Jan/June
Number of students taking Regents = 88 Number of student / percent passing = 88 / 100% Number of students / percent failing = 0 / 0%
Competency / Mastery Results
# / % below competency 64% and below
# / % at competency level 65% - 84%
# / % at mastery level 85% - 100%
0 / 0% 18 / 20% 70 / 80%
Data Sorted by Gender / SPED / ODP
Gender SPED
Males # that took exam
49
# that passed exam 49
% Failing / % Passing 0% / 100%
Females # that took exam
39
# that passed exam 39
% Failing / % Passing 0% / 100%
# that took exam 9
# that passed exam 9
% Failing / % Passing 0% / 100%
12
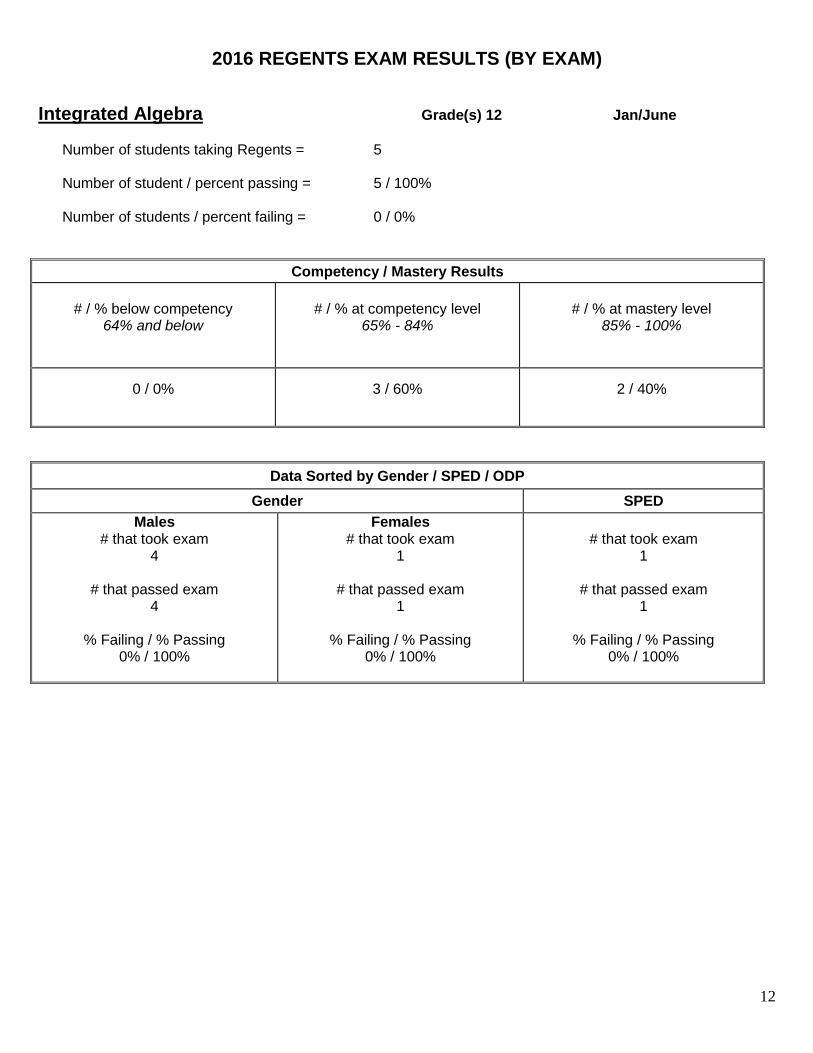
2016 REGENTS EXAM RESULTS (BY EXAM)
Integrated Algebra Grade(s) 12 Jan/June
Number of students taking Regents = 5 Number of student / percent passing = 5 / 100% Number of students / percent failing = 0 / 0%
Competency / Mastery Results
# / % below competency
64% and below
# / % at competency level 65% - 84%
# / % at mastery level 85% - 100%
0 / 0%
3 / 60%
2 / 40%
Data Sorted by Gender / SPED / ODP
Gender SPED
Males # that took exam
4
# that passed exam 4
% Failing / % Passing 0% / 100%
Females # that took exam
1
# that passed exam 1
% Failing / % Passing 0% / 100%
# that took exam 1
# that passed exam 1
% Failing / % Passing 0% / 100%
13
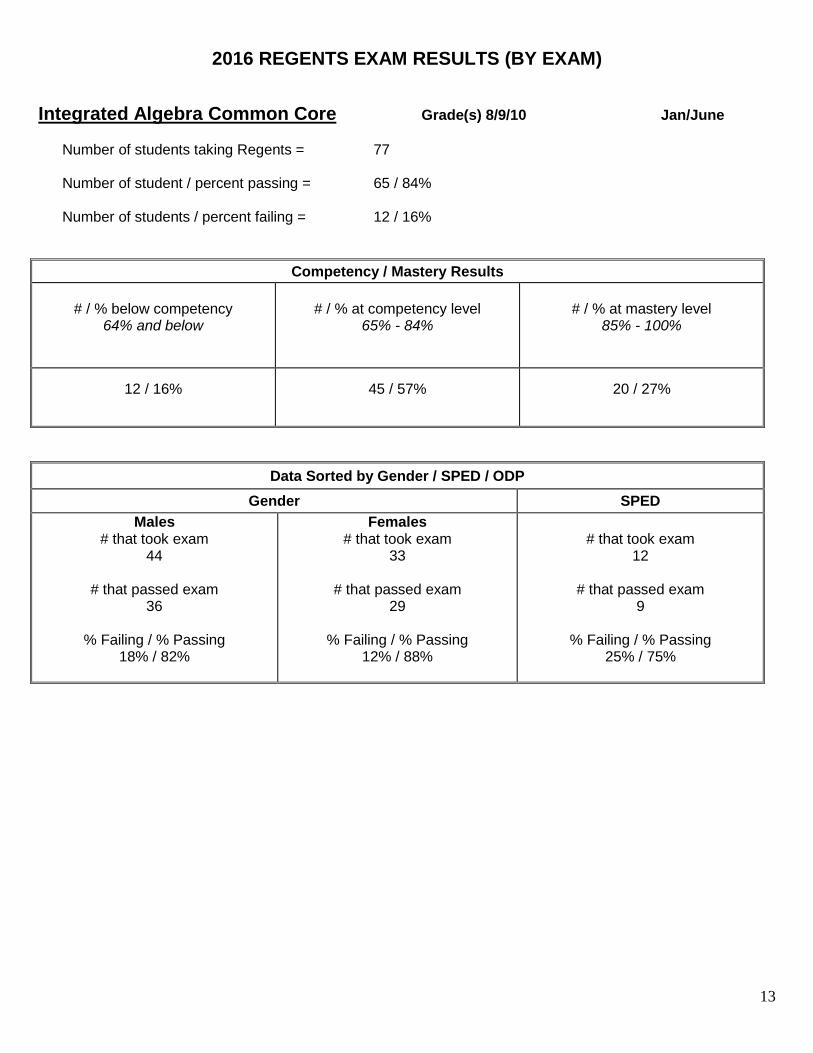
2016 REGENTS EXAM RESULTS (BY EXAM)
Integrated Algebra Common Core Grade(s) 8/9/10 Jan/June
Number of students taking Regents = 77 Number of student / percent passing = 65 / 84% Number of students / percent failing = 12 / 16%
Competency / Mastery Results
# / % below competency
64% and below
# / % at competency level 65% - 84%
# / % at mastery level 85% - 100%
12 / 16%
45 / 57%
20 / 27%
Data Sorted by Gender / SPED / ODP
Gender SPED
Males # that took exam
44
# that passed exam 36
% Failing / % Passing 18% / 82%
Females # that took exam
33
# that passed exam 29
% Failing / % Passing 12% / 88%
# that took exam 12
# that passed exam 9
% Failing / % Passing 25% / 75%
14
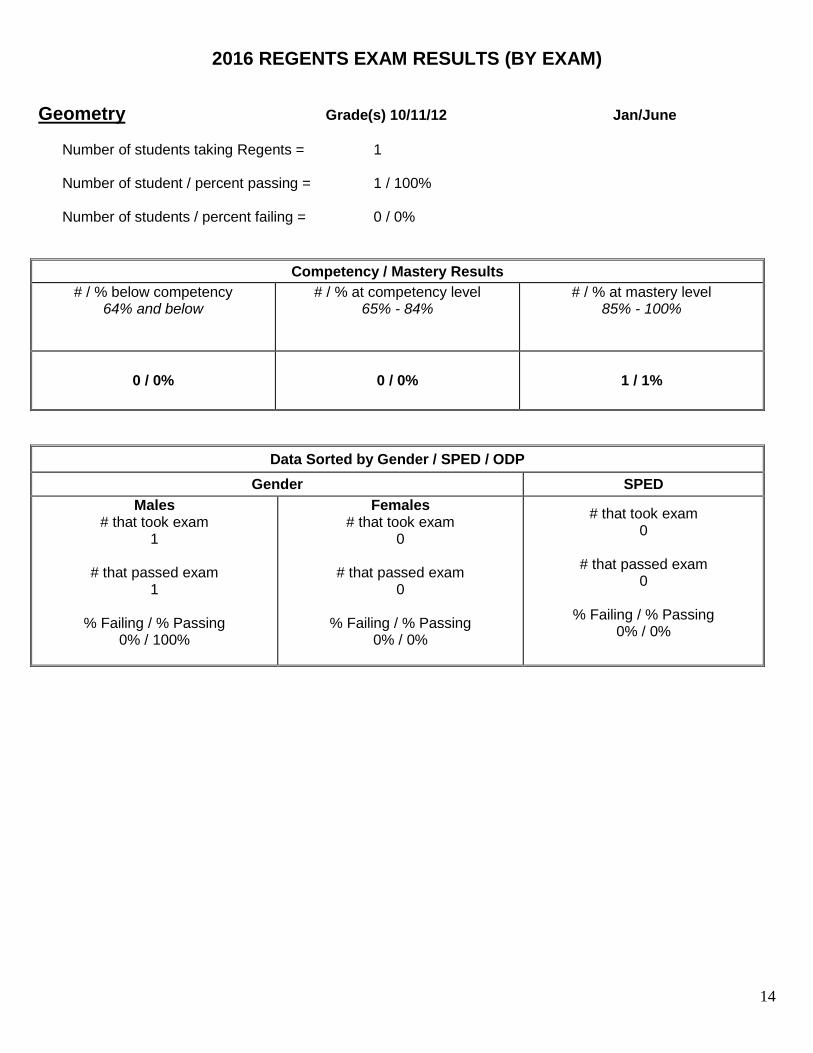
2016 REGENTS EXAM RESULTS (BY EXAM)
Geometry Grade(s) 10/11/12 Jan/June
Number of students taking Regents = 1 Number of student / percent passing = 1 / 100% Number of students / percent failing = 0 / 0%
Competency / Mastery Results
# / % below competency 64% and below
# / % at competency level 65% - 84%
# / % at mastery level 85% - 100%
0 / 0% 0 / 0% 1 / 1%
Data Sorted by Gender / SPED / ODP
Gender SPED
Males # that took exam
1
# that passed exam 1
% Failing / % Passing 0% / 100%
Females # that took exam
0
# that passed exam 0
% Failing / % Passing 0% / 0%
# that took exam 0
# that passed exam 0
% Failing / % Passing 0% / 0%
15
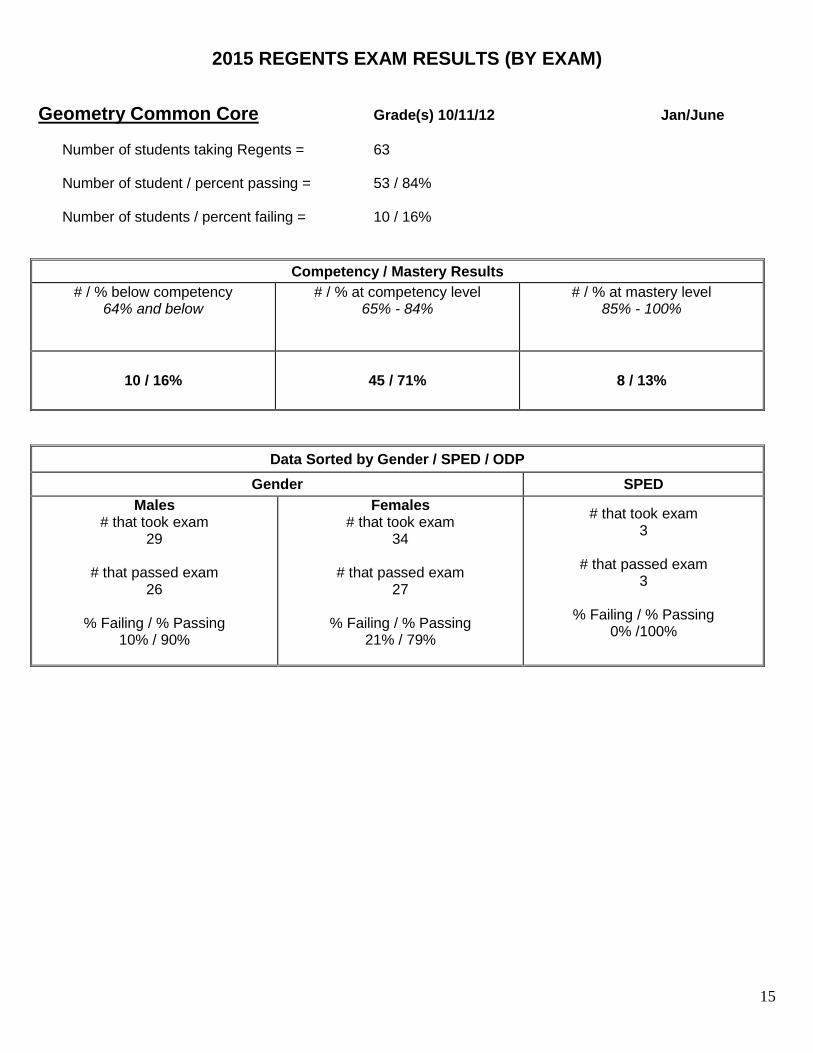
2015 REGENTS EXAM RESULTS (BY EXAM)
Geometry Common Core Grade(s) 10/11/12 Jan/June
Number of students taking Regents = 63 Number of student / percent passing = 53 / 84% Number of students / percent failing = 10 / 16%
Competency / Mastery Results
# / % below competency 64% and below
# / % at competency level 65% - 84%
# / % at mastery level 85% - 100%
10 / 16% 45 / 71% 8 / 13%
Data Sorted by Gender / SPED / ODP
Gender SPED
Males # that took exam
29
# that passed exam 26
% Failing / % Passing 10% / 90%
Females # that took exam
34
# that passed exam 27
% Failing / % Passing 21% / 79%
# that took exam 3
# that passed exam 3
% Failing / % Passing 0% /100%
16
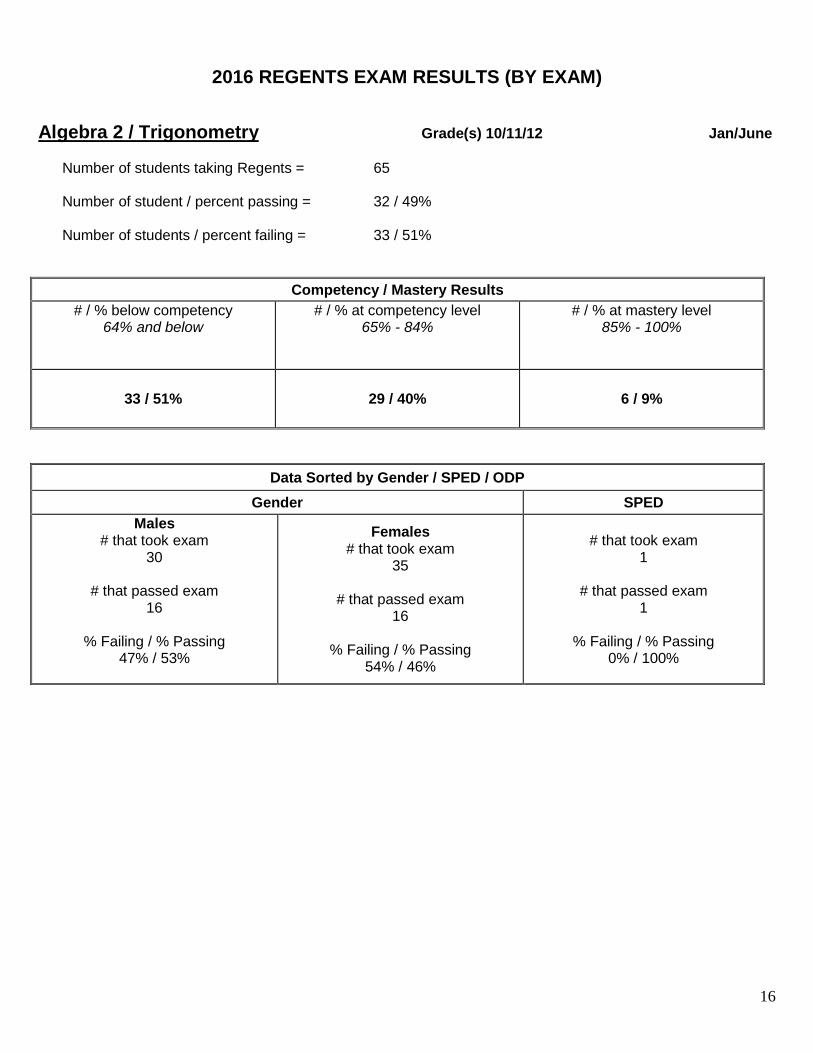
2016 REGENTS EXAM RESULTS (BY EXAM)
Algebra 2 / Trigonometry Grade(s) 10/11/12 Jan/June
Number of students taking Regents = 65 Number of student / percent passing = 32 / 49% Number of students / percent failing = 33 / 51%
Competency / Mastery Results
# / % below competency 64% and below
# / % at competency level 65% - 84%
# / % at mastery level 85% - 100%
33 / 51% 29 / 40% 6 / 9%
Data Sorted by Gender / SPED / ODP
Gender SPED
Males # that took exam
30
# that passed exam 16
% Failing / % Passing 47% / 53%
Females # that took exam
35
# that passed exam 16
% Failing / % Passing 54% / 46%
# that took exam 1
# that passed exam 1
% Failing / % Passing 0% / 100%
17
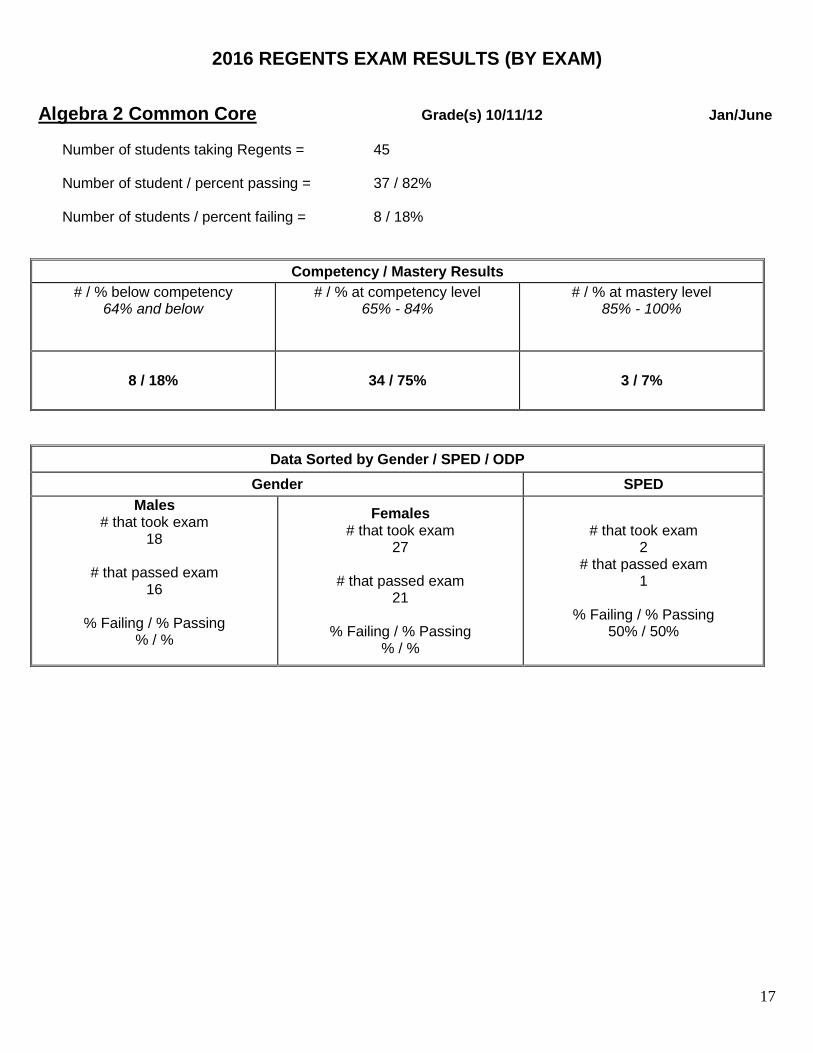
2016 REGENTS EXAM RESULTS (BY EXAM)
Algebra 2 Common Core Grade(s) 10/11/12 Jan/June
Number of students taking Regents = 45 Number of student / percent passing = 37 / 82% Number of students / percent failing = 8 / 18%
Competency / Mastery Results
# / % below competency 64% and below
# / % at competency level 65% - 84%
# / % at mastery level 85% - 100%
8 / 18% 34 / 75% 3 / 7%
Data Sorted by Gender / SPED / ODP
Gender SPED
Males # that took exam
18
# that passed exam 16
% Failing / % Passing % / %
Females # that took exam
27
# that passed exam 21
% Failing / % Passing % / %
# that took exam 2
# that passed exam 1
% Failing / % Passing 50% / 50%
18
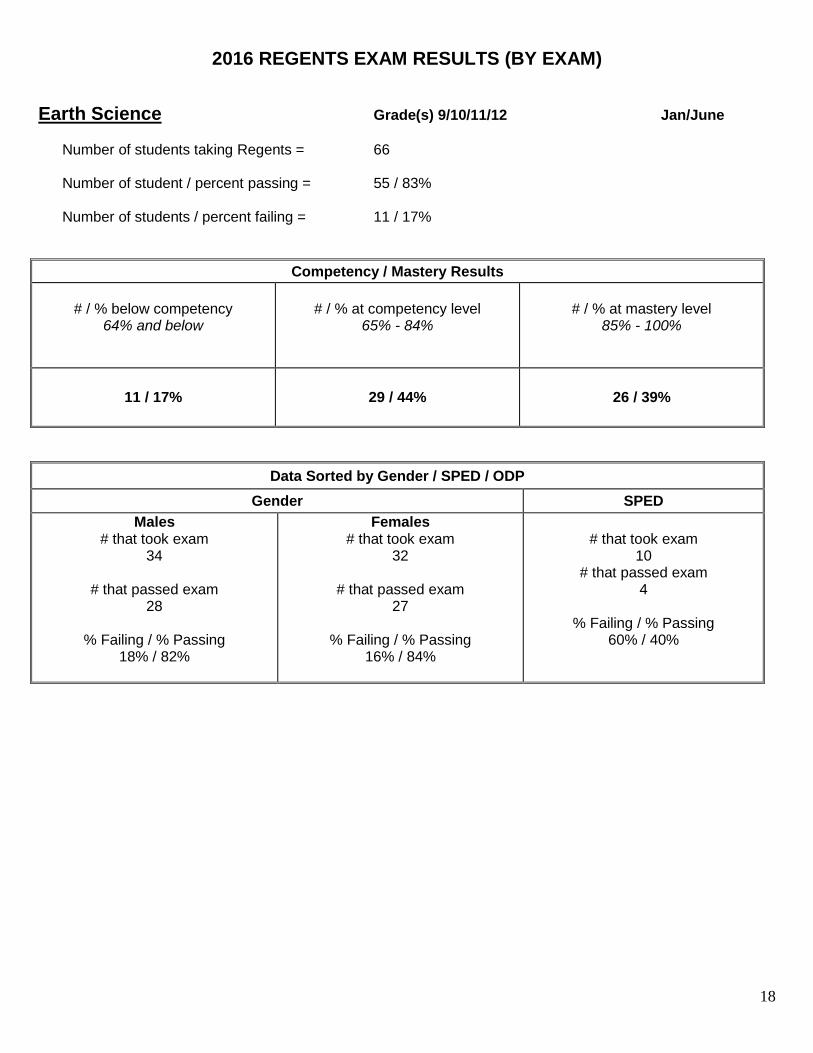
2016 REGENTS EXAM RESULTS (BY EXAM)
Earth Science Grade(s) 9/10/11/12 Jan/June
Number of students taking Regents = 66 Number of student / percent passing = 55 / 83% Number of students / percent failing = 11 / 17%
Competency / Mastery Results
# / % below competency
64% and below
# / % at competency level
65% - 84%
# / % at mastery level
85% - 100%
11 / 17% 29 / 44% 26 / 39%
Data Sorted by Gender / SPED / ODP
Gender SPED
Males # that took exam
34
# that passed exam 28
% Failing / % Passing 18% / 82%
Females # that took exam
32
# that passed exam 27
% Failing / % Passing 16% / 84%
# that took exam 10
# that passed exam 4
% Failing / % Passing 60% / 40%
19
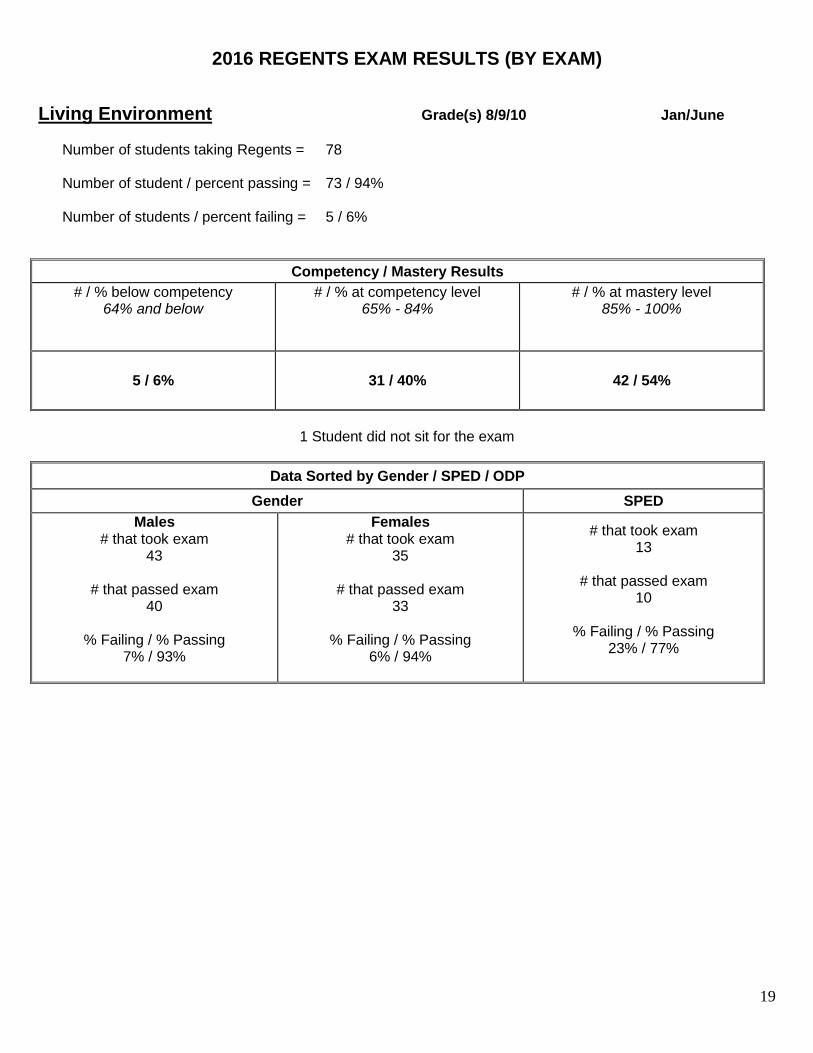
2016 REGENTS EXAM RESULTS (BY EXAM)
Living Environment Grade(s) 8/9/10 Jan/June
Number of students taking Regents = 78 Number of student / percent passing = 73 / 94% Number of students / percent failing = 5 / 6%
Competency / Mastery Results
# / % below competency 64% and below
# / % at competency level 65% - 84%
# / % at mastery level 85% - 100%
5 / 6% 31 / 40% 42 / 54%
1 Student did not sit for the exam
Data Sorted by Gender / SPED / ODP
Gender SPED
Males # that took exam
43
# that passed exam 40
% Failing / % Passing 7% / 93%
Females # that took exam
35
# that passed exam 33
% Failing / % Passing 6% / 94%
# that took exam 13
# that passed exam 10
% Failing / % Passing 23% / 77%
20
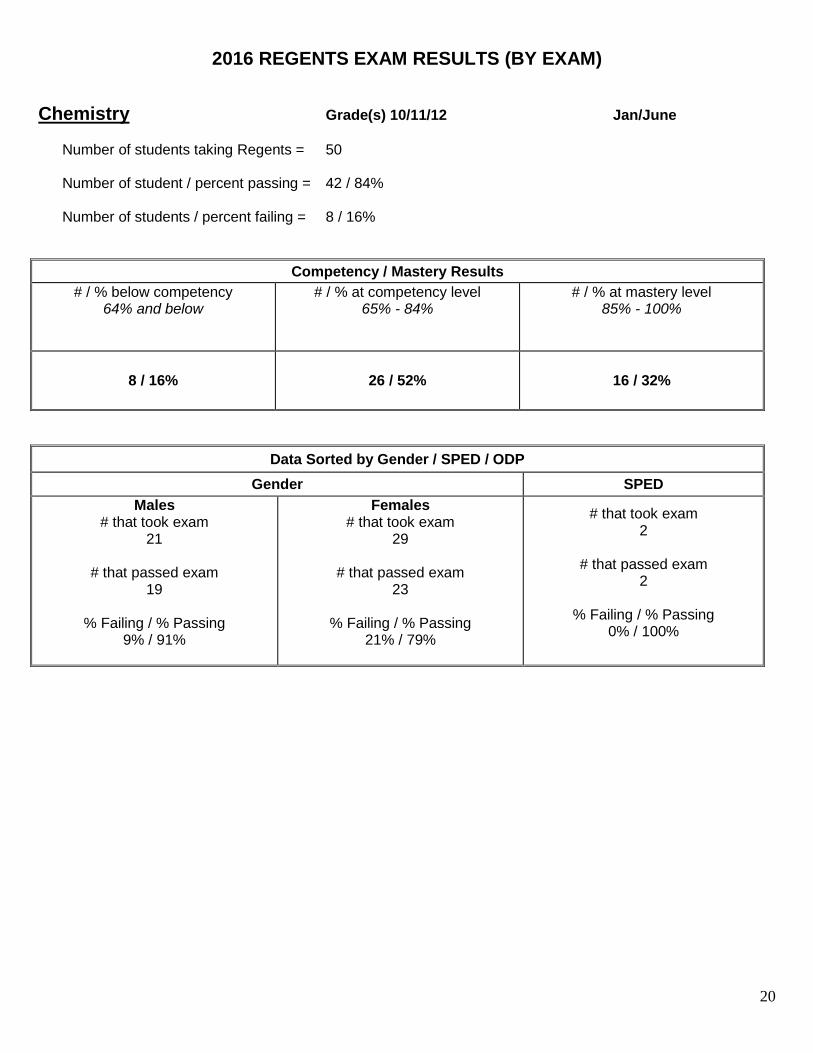
2016 REGENTS EXAM RESULTS (BY EXAM)
Chemistry Grade(s) 10/11/12 Jan/June
Number of students taking Regents = 50 Number of student / percent passing = 42 / 84% Number of students / percent failing = 8 / 16%
Competency / Mastery Results
# / % below competency 64% and below
# / % at competency level 65% - 84%
# / % at mastery level 85% - 100%
8 / 16% 26 / 52% 16 / 32%
Data Sorted by Gender / SPED / ODP
Gender SPED
Males # that took exam
21
# that passed exam 19
% Failing / % Passing 9% / 91%
Females # that took exam
29
# that passed exam 23
% Failing / % Passing 21% / 79%
# that took exam 2
# that passed exam 2
% Failing / % Passing 0% / 100%
21
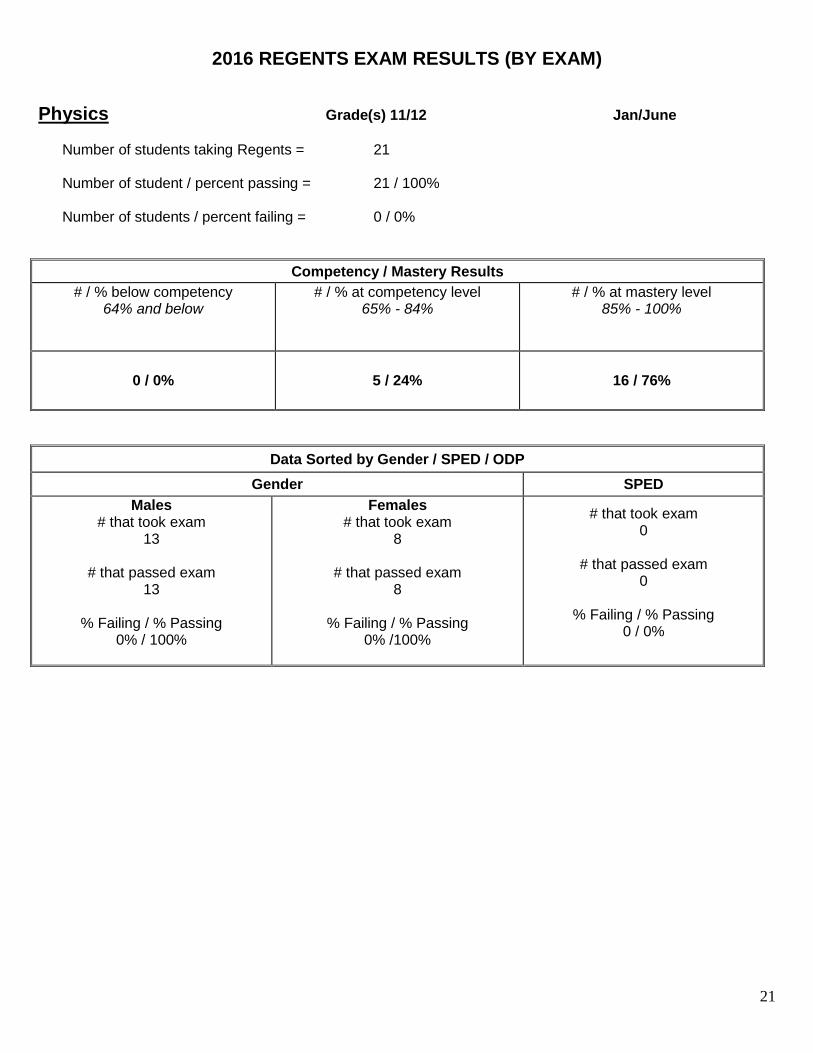
2016 REGENTS EXAM RESULTS (BY EXAM)
Physics Grade(s) 11/12 Jan/June
Number of students taking Regents = 21 Number of student / percent passing = 21 / 100% Number of students / percent failing = 0 / 0%
Competency / Mastery Results
# / % below competency 64% and below
# / % at competency level 65% - 84%
# / % at mastery level 85% - 100%
0 / 0% 5 / 24% 16 / 76%
Data Sorted by Gender / SPED / ODP
Gender SPED
Males # that took exam
13
# that passed exam 13
% Failing / % Passing 0% / 100%
Females # that took exam
8
# that passed exam 8
% Failing / % Passing 0% /100%
# that took exam 0
# that passed exam 0
% Failing / % Passing 0 / 0%
22
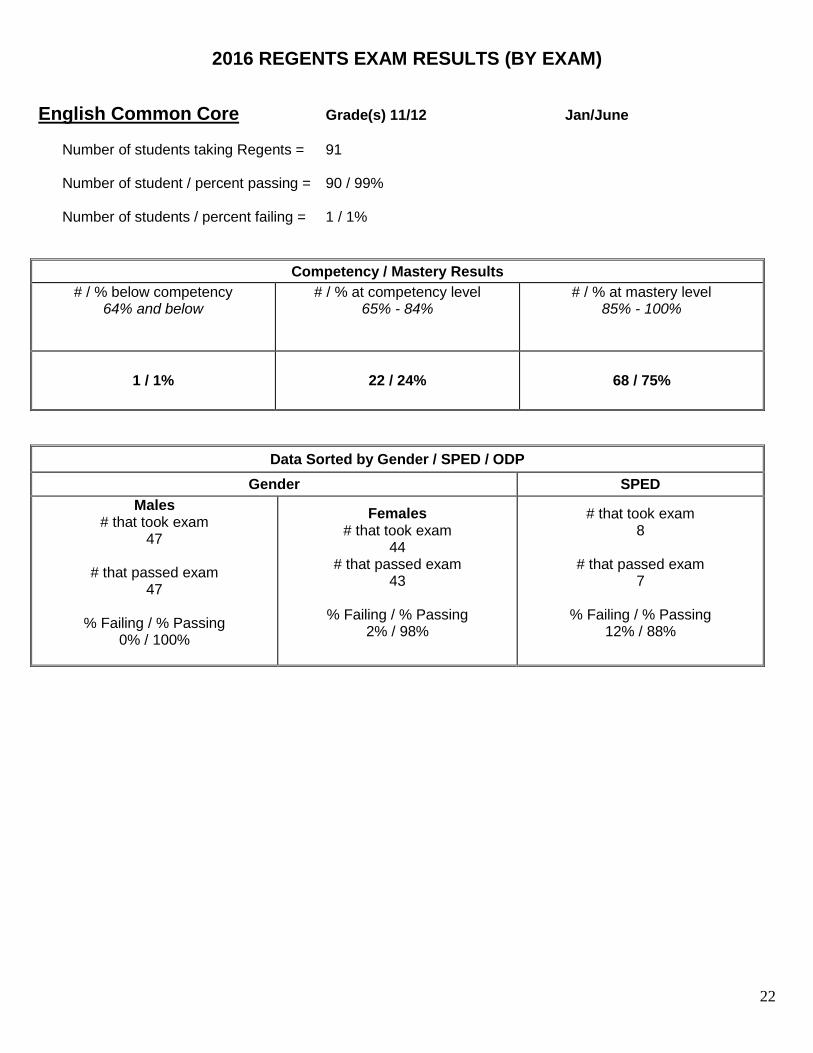
2016 REGENTS EXAM RESULTS (BY EXAM)
English Common Core Grade(s) 11/12 Jan/June
Number of students taking Regents = 91 Number of student / percent passing = 90 / 99% Number of students / percent failing = 1 / 1%
Competency / Mastery Results
# / % below competency 64% and below
# / % at competency level 65% - 84%
# / % at mastery level 85% - 100%
1 / 1% 22 / 24% 68 / 75%
Data Sorted by Gender / SPED / ODP
Gender SPED
Males # that took exam
47
# that passed exam 47
% Failing / % Passing 0% / 100%
Females # that took exam
44 # that passed exam
43
% Failing / % Passing 2% / 98%
# that took exam 8
# that passed exam 7
% Failing / % Passing 12% / 88%
23
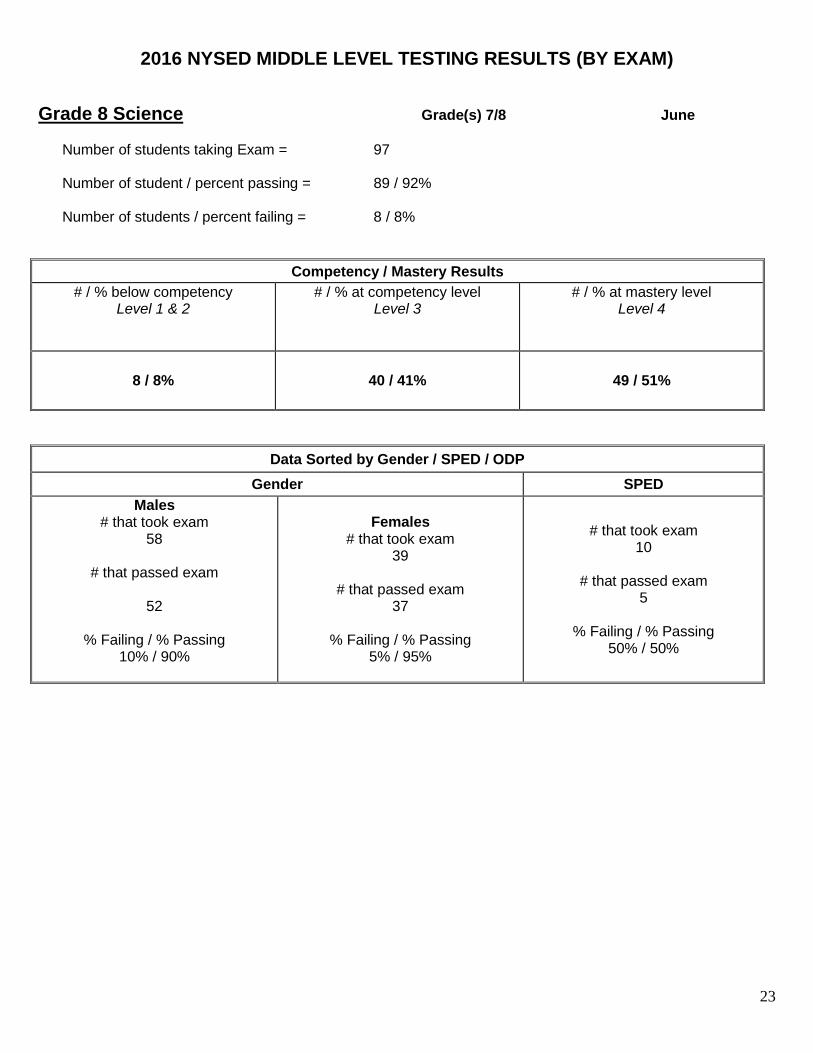
2016 NYSED MIDDLE LEVEL TESTING RESULTS (BY EXAM)
Grade 8 Science Grade(s) 7/8 June
Number of students taking Exam = 97 Number of student / percent passing = 89 / 92% Number of students / percent failing = 8 / 8%
Competency / Mastery Results
# / % below competency Level 1 & 2
# / % at competency level Level 3
# / % at mastery level Level 4
8 / 8% 40 / 41% 49 / 51%
Data Sorted by Gender / SPED / ODP
Gender SPED
Males # that took exam
58
# that passed exam
52
% Failing / % Passing 10% / 90%
Females # that took exam
39
# that passed exam 37
% Failing / % Passing 5% / 95%
# that took exam 10
# that passed exam 5
% Failing / % Passing 50% / 50%
24
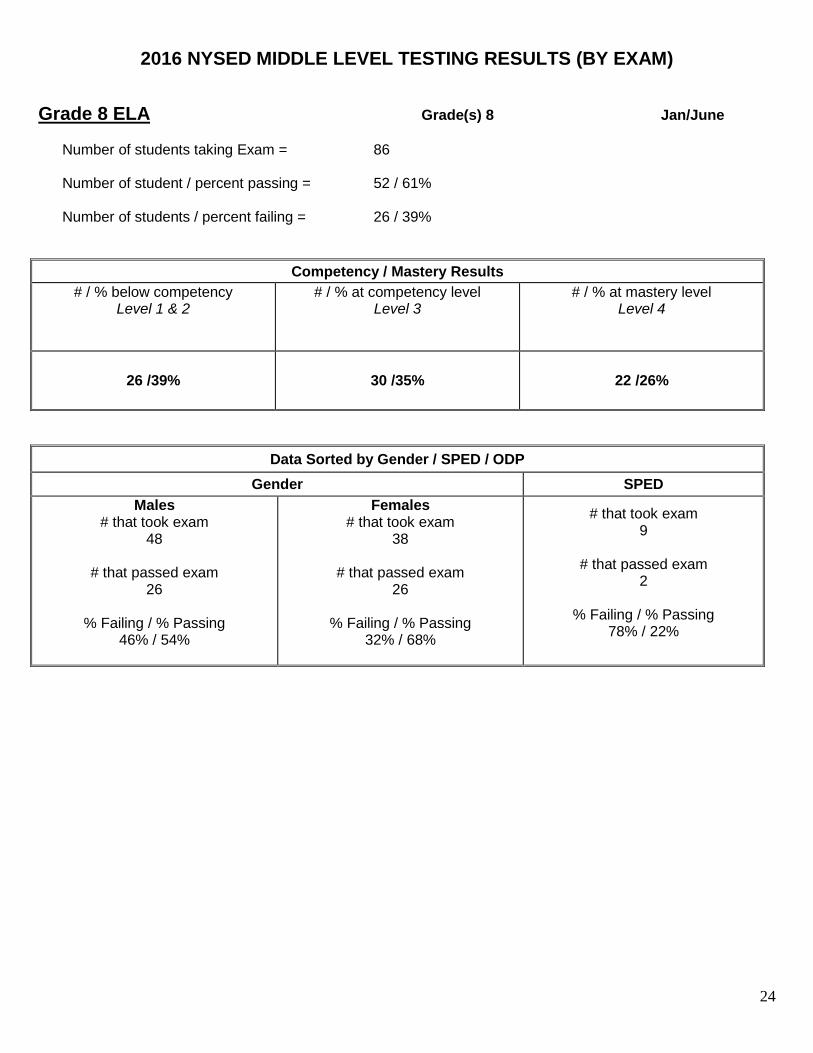
2016 NYSED MIDDLE LEVEL TESTING RESULTS (BY EXAM)
Grade 8 ELA Grade(s) 8 Jan/June
Number of students taking Exam = 86 Number of student / percent passing = 52 / 61% Number of students / percent failing = 26 / 39%
Competency / Mastery Results
# / % below competency Level 1 & 2
# / % at competency level Level 3
# / % at mastery level Level 4
26 /39% 30 /35% 22 /26%
Data Sorted by Gender / SPED / ODP
Gender SPED
Males # that took exam
48
# that passed exam 26
% Failing / % Passing 46% / 54%
Females # that took exam
38
# that passed exam 26
% Failing / % Passing 32% / 68%
# that took exam 9
# that passed exam 2
% Failing / % Passing 78% / 22%
25
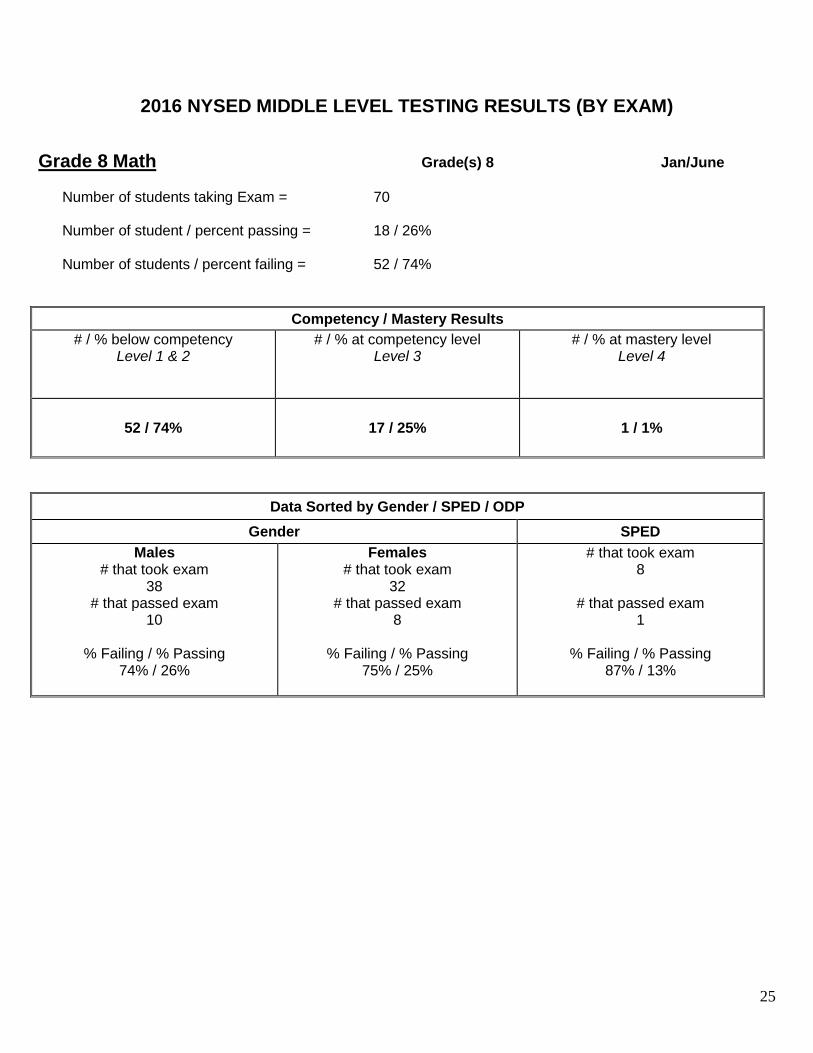
2016 NYSED MIDDLE LEVEL TESTING RESULTS (BY EXAM)
Grade 8 Math Grade(s) 8 Jan/June
Number of students taking Exam = 70 Number of student / percent passing = 18 / 26% Number of students / percent failing = 52 / 74%
Competency / Mastery Results
# / % below competency Level 1 & 2
# / % at competency level Level 3
# / % at mastery level Level 4
52 / 74% 17 / 25% 1 / 1%
Data Sorted by Gender / SPED / ODP
Gender SPED
Males # that took exam
38 # that passed exam
10
% Failing / % Passing 74% / 26%
Females # that took exam
32 # that passed exam
8
% Failing / % Passing 75% / 25%
# that took exam 8
# that passed exam 1
% Failing / % Passing 87% / 13%
26
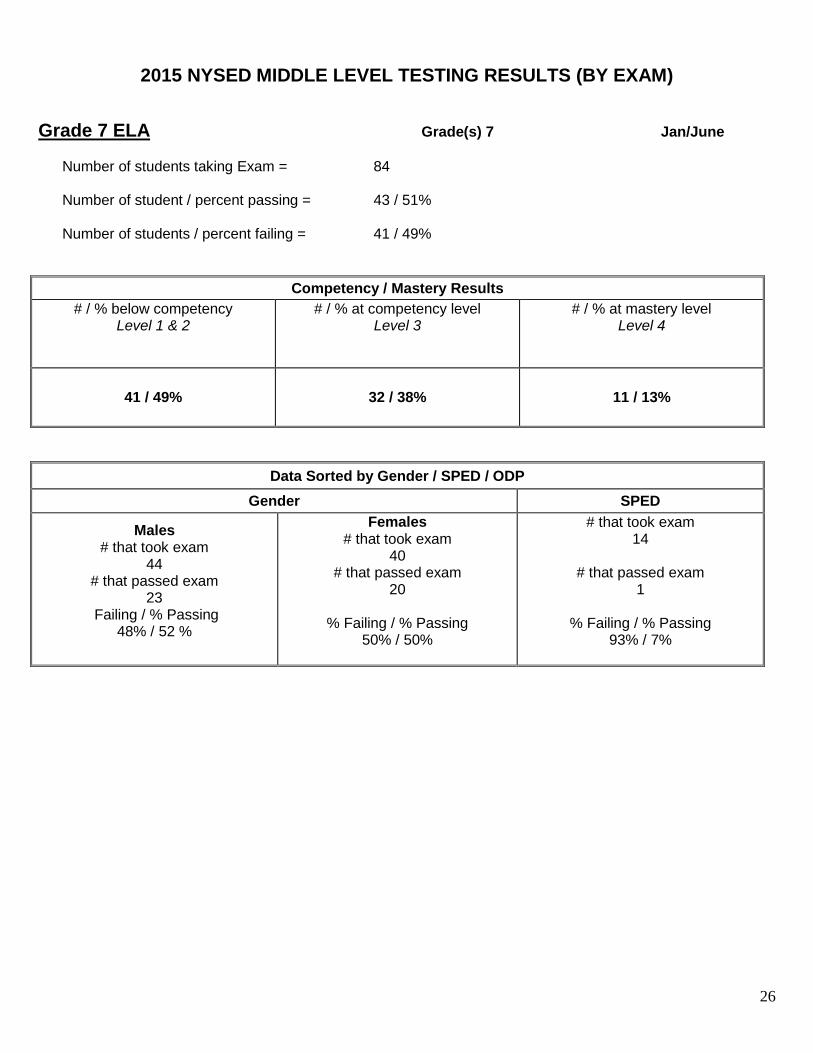
2015 NYSED MIDDLE LEVEL TESTING RESULTS (BY EXAM)
Grade 7 ELA Grade(s) 7 Jan/June
Number of students taking Exam = 84 Number of student / percent passing = 43 / 51% Number of students / percent failing = 41 / 49%
Competency / Mastery Results
# / % below competency Level 1 & 2
# / % at competency level Level 3
# / % at mastery level Level 4
41 / 49% 32 / 38% 11 / 13%
Data Sorted by Gender / SPED / ODP
Gender SPED
Males # that took exam
44 # that passed exam
23 Failing / % Passing
48% / 52 %
Females # that took exam
40 # that passed exam
20
% Failing / % Passing 50% / 50%
# that took exam 14
# that passed exam 1
% Failing / % Passing 93% / 7%
27
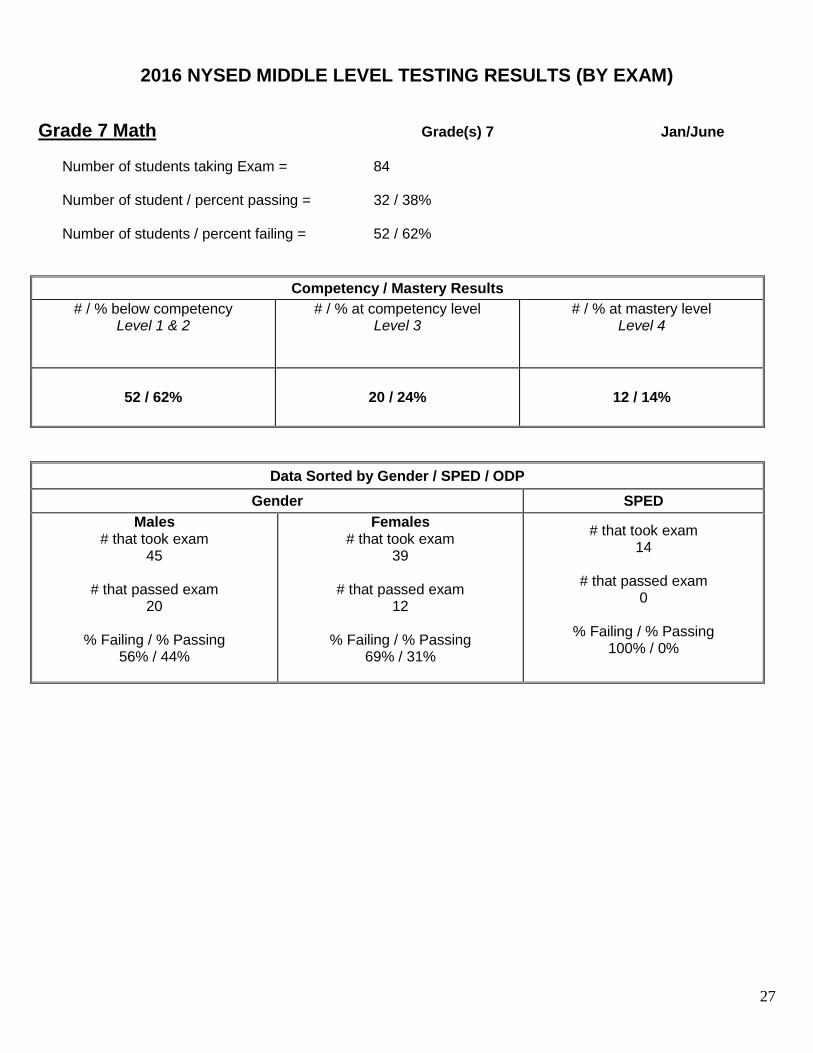
2016 NYSED MIDDLE LEVEL TESTING RESULTS (BY EXAM)
Grade 7 Math Grade(s) 7 Jan/June
Number of students taking Exam = 84 Number of student / percent passing = 32 / 38% Number of students / percent failing = 52 / 62%
Competency / Mastery Results
# / % below competency Level 1 & 2
# / % at competency level Level 3
# / % at mastery level Level 4
52 / 62% 20 / 24% 12 / 14%
Data Sorted by Gender / SPED / ODP
Gender SPED
Males # that took exam
45
# that passed exam 20
% Failing / % Passing 56% / 44%
Females # that took exam
39
# that passed exam 12
% Failing / % Passing 69% / 31%
# that took exam 14
# that passed exam 0
% Failing / % Passing 100% / 0%
28
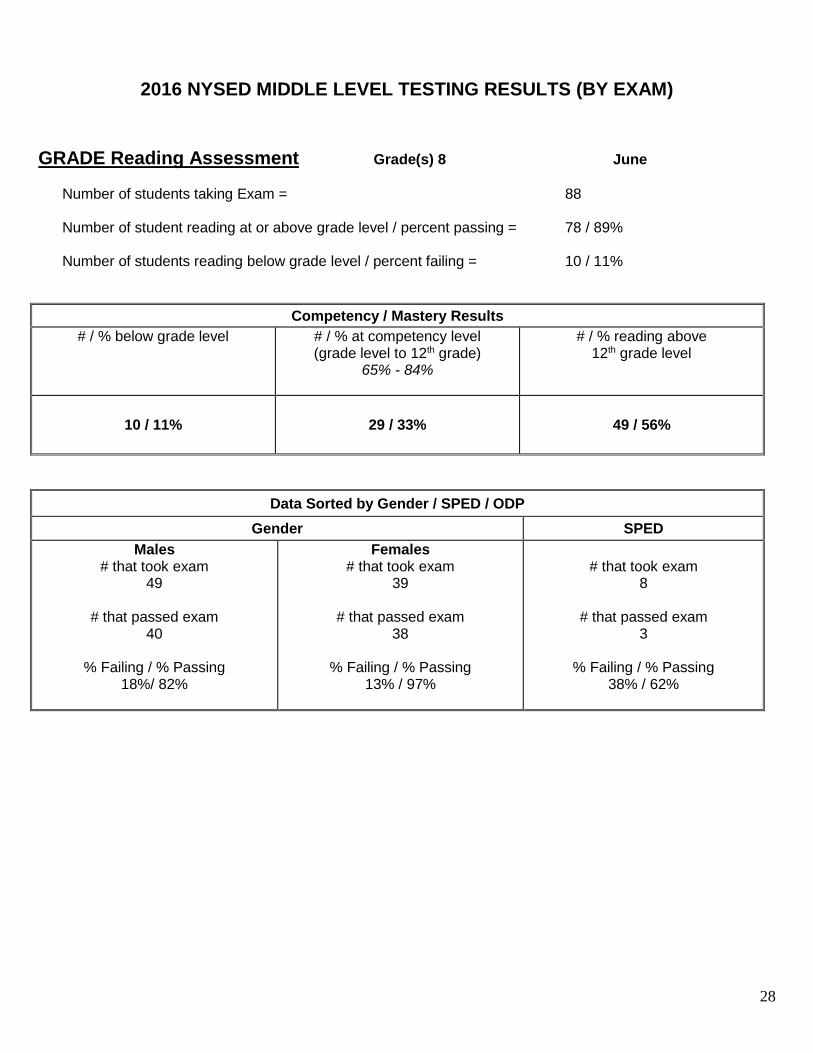
2016 NYSED MIDDLE LEVEL TESTING RESULTS (BY EXAM)
GRADE Reading Assessment Grade(s) 8 June
Number of students taking Exam = 88 Number of student reading at or above grade level / percent passing = 78 / 89% Number of students reading below grade level / percent failing = 10 / 11%
Competency / Mastery Results
# / % below grade level
# / % at competency level (grade level to 12th grade)
65% - 84%
# / % reading above 12th grade level
10 / 11%
29 / 33% 49 / 56%
Data Sorted by Gender / SPED / ODP
Gender SPED
Males # that took exam
49
# that passed exam 40
% Failing / % Passing 18%/ 82%
Females # that took exam
39
# that passed exam 38
% Failing / % Passing 13% / 97%
# that took exam 8
# that passed exam 3
% Failing / % Passing 38% / 62%
29
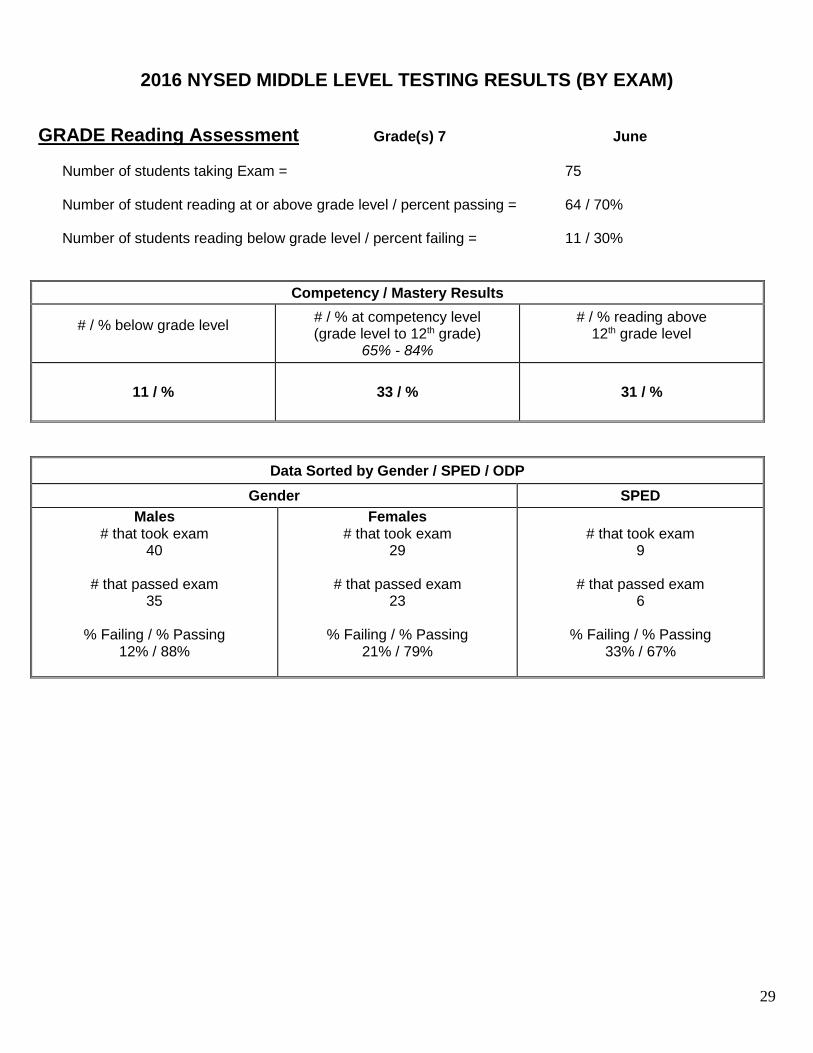
2016 NYSED MIDDLE LEVEL TESTING RESULTS (BY EXAM)
GRADE Reading Assessment Grade(s) 7 June
Number of students taking Exam = 75 Number of student reading at or above grade level / percent passing = 64 / 70% Number of students reading below grade level / percent failing = 11 / 30%
Competency / Mastery Results
# / % below grade level
# / % at competency level (grade level to 12th grade)
65% - 84%
# / % reading above 12th grade level
11 / %
33 / % 31 / %
Data Sorted by Gender / SPED / ODP
Gender SPED
Males # that took exam
40
# that passed exam 35
% Failing / % Passing 12% / 88%
Females # that took exam
29
# that passed exam 23
% Failing / % Passing 21% / 79%
# that took exam 9
# that passed exam 6
% Failing / % Passing 33% / 67%
30
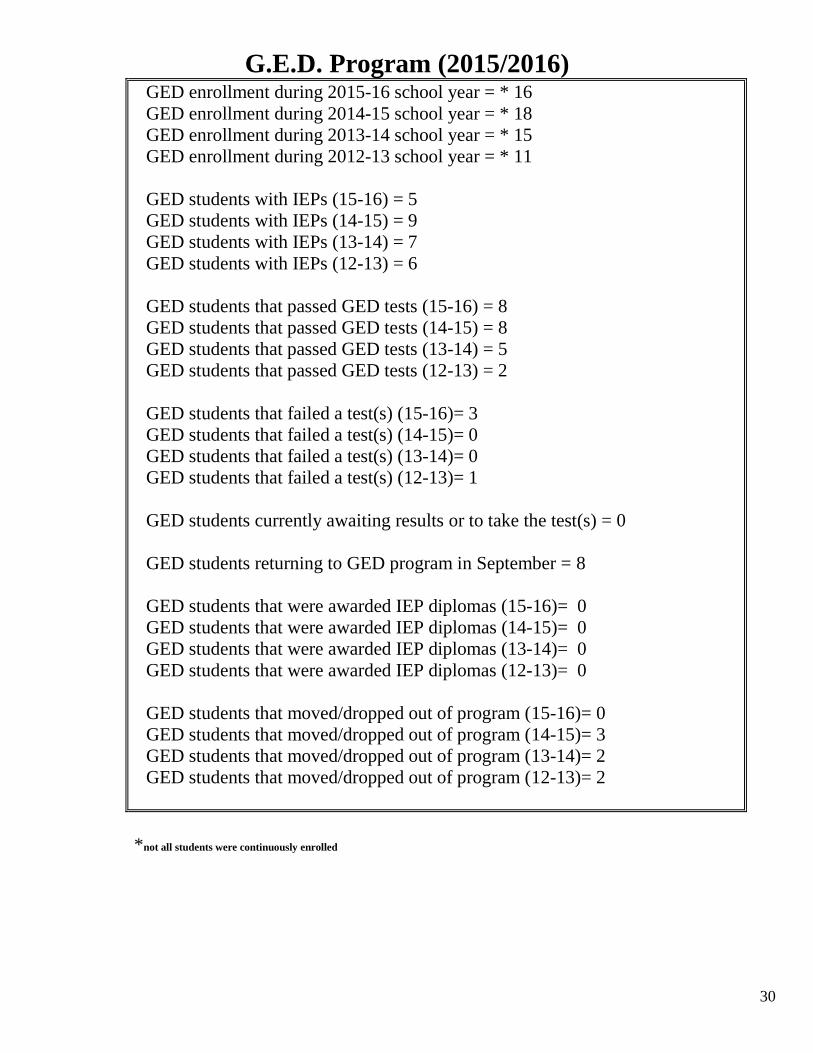
G.E.D. Program (2015/2016)
GED enrollment during 2015-16 school year = * 16
GED enrollment during 2014-15 school year = * 18
GED enrollment during 2013-14 school year = * 15
GED enrollment during 2012-13 school year = * 11
GED students with IEPs (15-16) = 5
GED students with IEPs (14-15) = 9
GED students with IEPs (13-14) = 7
GED students with IEPs (12-13) = 6
GED students that passed GED tests (15-16) = 8
GED students that passed GED tests (14-15) = 8
GED students that passed GED tests (13-14) = 5
GED students that passed GED tests (12-13) = 2
GED students that failed a test(s) (15-16)= 3
GED students that failed a test(s) (14-15)= 0
GED students that failed a test(s) (13-14)= 0
GED students that failed a test(s) (12-13)= 1
GED students currently awaiting results or to take the test(s) = 0
GED students returning to GED program in September = 8
GED students that were awarded IEP diplomas (15-16)= 0
GED students that were awarded IEP diplomas (14-15)= 0
GED students that were awarded IEP diplomas (13-14)= 0
GED students that were awarded IEP diplomas (12-13)= 0
GED students that moved/dropped out of program (15-16)= 0
GED students that moved/dropped out of program (14-15)= 3
GED students that moved/dropped out of program (13-14)= 2
GED students that moved/dropped out of program (12-13)= 2
*not all students were continuously enrolled
31
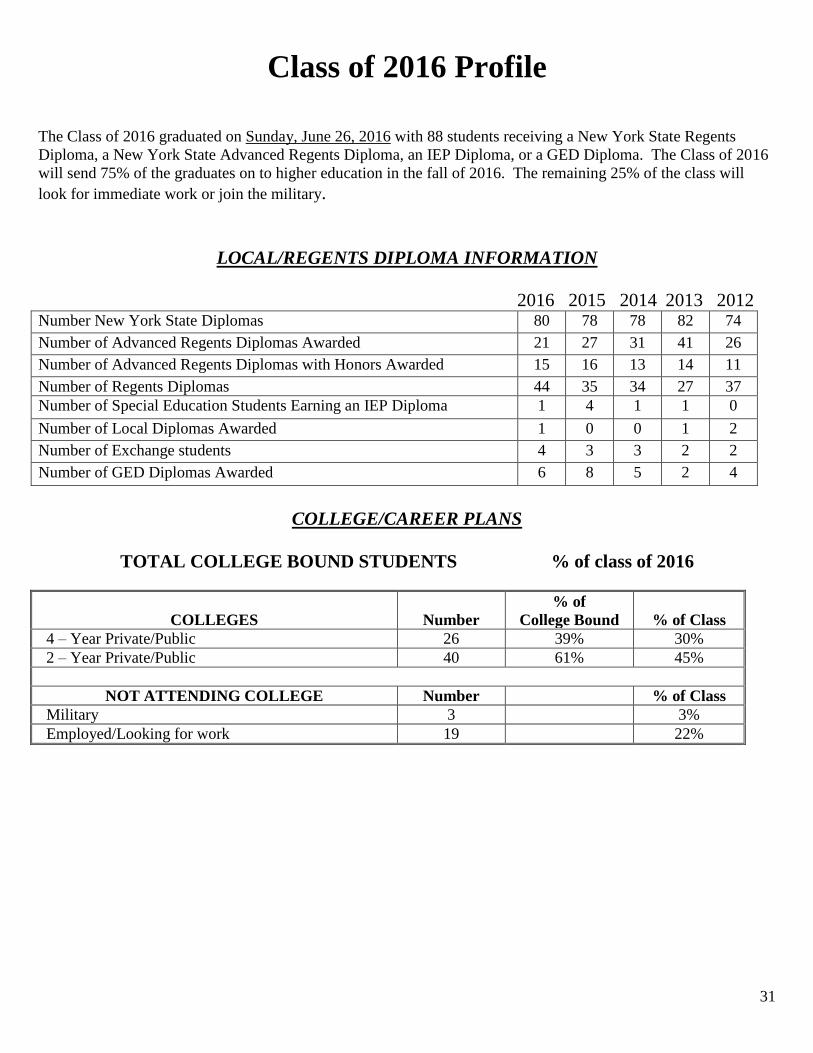
Class of 2016 Profile
The Class of 2016 graduated on Sunday, June 26, 2016 with 88 students receiving a New York State Regents
Diploma, a New York State Advanced Regents Diploma, an IEP Diploma, or a GED Diploma. The Class of 2016
will send 75% of the graduates on to higher education in the fall of 2016. The remaining 25% of the class will
look for immediate work or join the military.
LOCAL/REGENTS DIPLOMA INFORMATION
2016 2015 2014 2013 2012 Number New York State Diplomas 80 78 78 82 74
Number of Advanced Regents Diplomas Awarded 21 27 31 41 26
Number of Advanced Regents Diplomas with Honors Awarded 15 16 13 14 11
Number of Regents Diplomas 44 35 34 27 37
Number of Special Education Students Earning an IEP Diploma 1 4 1 1 0
Number of Local Diplomas Awarded 1 0 0 1 2
Number of Exchange students 4 3 3 2 2
Number of GED Diplomas Awarded 6 8 5 2 4
COLLEGE/CAREER PLANS
TOTAL COLLEGE BOUND STUDENTS % of class of 2016
COLLEGES
Number
% of
College Bound
% of Class
4 – Year Private/Public 26 39% 30%
2 – Year Private/Public 40 61% 45%
NOT ATTENDING COLLEGE Number % of Class
Military 3 3%
Employed/Looking for work 19 22%