Embed Size (px)
Citation preview
2822 | wileyonlinelibrary.com/journal/gcb Glob Change Biol. 2021;27:2822–2839.© 2021 John Wiley & Sons Ltd
Received: 9 October 2020 | Accepted: 8 February 2021
DOI: 10.1111/gcb.15566
P R I M A R Y R E S E A R C H A R T I C L E
Greenhouse gas production and lipid biomarker distribution in Yedoma and Alas thermokarst lake sediments in Eastern Siberia
Loeka L. Jongejans1,2 | Susanne Liebner3,4 | Christian Knoblauch5,6 | Kai Mangelsdorf7 | Mathias Ulrich8 | Guido Grosse1,2 | George Tanski1,9 | Alexander N. Fedorov10,11 | Pavel Ya. Konstantinov10 | Torben Windirsch1,2 | Julia Wiedmann1,12 | Jens Strauss1
1Alfred Wegener Institute Helmholtz Center for Polar and Marine Research, Permafrost Research Section, Potsdam, Germany2Institute of Geosciences, University of Potsdam, Potsdam, Germany3Section Geomicrobiology, GFZ German Research Center for Geosciences, Potsdam, Germany4Institute of Biochemistry and Biology, University of Potsdam, Potsdam, Germany5Institute of Soil Science, Universität Hamburg, Hamburg, Germany6Center for Earth System Research and Sustainability, Hamburg, Germany7Section Organic Geochemistry, GFZ German Research Center for Geosciences, Potsdam, Germany8Institute for Geography, University of Leipzig, Leipzig, Germany9Department of Earth Science, Vrije Universiteit Amsterdam, Amsterdam, Netherlands10Melnikov Permafrost Institute, Laboratory of General Geocryology, Siberian Branch Russian Academy of Sciences, Yakutsk, Russia11BEST International Centre, North- Eastern Federal University, Yakutsk, Russia12Baugrund- Ingenieurbüro GmbH Maul und Partner, Potsdam, Germany
CorrespondenceLoeka L. Jongejans, Alfred Wegener Institute Helmholtz Center for Polar and Marine Research, Permafrost Research Section, 14473 Potsdam, Germany.Email: [email protected]
Funding informationThe fieldwork was a joint field campaign funded by ERC PETA- CARB (#338335), DFG (UL426/1- 1), and the Melnikov Permafrost Institute, Siberian Branch of the Russian Academy of Sciences. Loeka L. Jongejans was funded by the German Federal Environmental Foundation (DBU) PhD Scholarship. Additional support for this study was provided by the HGF Initiative and Networking Fund (ERC_0013), BMBF KoPF (03F0764A; 03F0764B; 03F0764F), DFG Cluster of Excellence CLICCS (EXC 2017), and Potsdam Graduate School. AWI provided baseline funding for sample processing and expedition logistics.
AbstractPermafrost thaw leads to thermokarst lake formation and talik growth tens of meters deep, enabling microbial decomposition of formerly frozen organic matter (OM). We analyzed two 17- m- long thermokarst lake sediment cores taken in Central Yakutia, Russia. One core was from an Alas lake in a Holocene thermokarst basin that under-went multiple lake generations, and the second core from a young Yedoma upland lake (formed ~70 years ago) whose sediments have thawed for the first time since deposi-tion. This comparison provides a glance into OM fate in thawing Yedoma deposits. We analyzed total organic carbon (TOC) and dissolved organic carbon (DOC) content, n- alkane concentrations, and bacterial and archaeal membrane markers. Furthermore, we conducted 1- year- long incubations (4°C, dark) and measured anaerobic carbon dioxide (CO2) and methane (CH4) production. The sediments from both cores con-tained little TOC (0.7 ± 0.4 wt%), but DOC values were relatively high, with the highest values in the frozen Yedoma lake sediments (1620 mg L−1). Cumulative green-house gas (GHG) production after 1 year was highest in the Yedoma lake sediments
This is an open access article under the terms of the Creative Commons Attribution License, which permits use, distribution and reproduction in any medium, provided the original work is properly cited.© 2021 The Authors. Global Change Biology published by John Wiley & Sons Ltd.

| 2823JONGEJANS Et Al.
1 | INTRODUC TION
Rapid warming of the Arctic results in permafrost warming (Biskaborn et al., 2019) and thaw, enabling microbial decomposi-tion of previously frozen organic matter (OM; Schuur et al., 2008; Walter Anthony et al., 2016). Soil organic carbon (OC) that has been stored for millennia could be released to the atmosphere as green-house gases (GHGs). OC release from permafrost regions will con-tinue gradually with ongoing warming, thereby accelerating warming (Schuur et al., 2015). Factors controlling GHG release from thawing permafrost are complex and therefore not fully considered by most climate models (Turetsky et al., 2020).
Thermokarst lake and talik formation is the most common expres-sion of deep permafrost degradation (>10 m depth; Grosse et al., 2013). Ground subsidence following thawing of ice- rich ground beneath the lake leads to lake formation. A positive downward heat flux from the water further enhances thaw and leads to the formation of a talik. After lake drainage or desiccation, a subaerial thermokarst lake basin remains, which is called an alas (Soloviev, 1973). Consequently, the talik can refreeze and OC becomes freeze- locked again. Thermokarst and talik formation, especially in ice- rich Late Pleistocene Yedoma depos-its, result in deep thaw and subsequent ground subsidence. Aside from being ice- rich and susceptible to ground subsidence, deep Yedoma deposits (>25 m depth) are an important pool of permafrost OM (Schirrmeister et al., 2013; Strauss et al., 2017). In contrast, gradual top- down thawing, such as active layer deepening, affects only centimeters per decade (Grosse et al., 2011; Turetsky et al., 2020). Turetsky et al. (2020) estimated that abrupt thaw processes, such as thermokarst lake development, could lead to an additional net OC release from perma-frost regions of 80 ± 19 Pg by 2300 under RCP 8.5. Thermokarst de-velopment in Yedoma regions, therefore, contributes globally relevant GHG emissions to the active carbon cycle (Turetsky et al., 2020).
The amount of OM that can be mobilized upon thaw is highly dependent on the state of OM degradation. Several studies have analyzed permafrost OM on a molecular level using lipid biomarkers
to assess OM degradability (Jongejans et al., 2018; Sánchez- García et al., 2014; Stapel et al., 2018; Strauss et al., 2015). The ratio of odd to even chained n- alkanes, the carbon preference index (CPI), has been used as an indicator for OM degradability where high values suggest better preserved OM (Marzi et al., 1993). Other proxies can give insights into the source of OM, such as the average chain length (ACL; Killops & Killops, 2013; Poynter & Eglinton, 1990). Branched glycerol dialkyl glycerol tetraethers (GDGTs), as well as archaeol and isoprenoid GDGTs (isoGDGT- 0), are markers for past bacte-rial and archaeal biomass, respectively (Stapel et al., 2016; Weijers et al., 2006). In their study of Siberian Yedoma deposits, Stapel et al. (2018) found that increased concentrations of archaeal biomarkers correlated to increased OM contents, suggesting microbial activity and methane (CH4) production during deposition.
Only a limited number of biogeochemical studies has been car-ried out so far on talik sediments underneath thermokarst lakes (Heslop et al., 2015, 2019; Jongejans et al., 2020; Romankevich et al., 2017; Ulyantsev et al., 2017). The study of talik sediments is however highly relevant for climate studies as it allows important insights into the pathways of previously frozen OM upon rapid thaw and thus the potential for GHG production below thermokarst lakes. While many studies suggested a higher biolability of old Yedoma OM upon thaw compared to Holocene thermokarst deposits (Dutta et al., 2006; Jongejans et al., 2018; Lee et al., 2012; Neubauer, 2016; Schuur et al., 2009; Strauss et al., 2015, 2017; Zimov et al., 2006), a few studies showed opposite findings (Kuhry et al., 2020; Schädel et al., 2014). Furthermore, climatic conditions during permafrost formation were shown to play a crucial role for OM decomposition after thaw (Knoblauch et al., 2013; Walz et al., 2018). In addition, studies of bi-olability of dissolved OC (DOC) showed that old OC was more biola-bile compared to modern OC (Mann et al., 2015; Vonk et al., 2013).
Schädel et al. (2014, 2016) and Treat et al. (2015) compiled an overview of incubation studies of permafrost regions. Many of these incubation experiments included subsurface sediments (<1 m depth; e.g., Čapek et al., 2015; Diáková et al., 2016; Elberling et al., 2013;
(226 ± 212 µg CO2- C g−1 dw, 28 ± 36 µg CH4- C g−1 dw) and 3 and 1.5 times lower in the Alas lake sediments, respectively (75 ± 76 µg CO2- C g−1 dw, 19 ± 29 µg CH4- C g−1 dw). The highest CO2 production in the frozen Yedoma lake sediments likely results from decomposition of readily bioavailable OM, while highest CH4 production in the non- frozen top sediments of this core suggests that methanogenic communities estab-lished upon thaw. The lower GHG production in the non- frozen Alas lake sediments resulted from advanced OM decomposition during Holocene talik development. Furthermore, we found that drivers of CO2 and CH4 production differ following thaw. Our results suggest that GHG production from TOC- poor mineral deposits, which are widespread throughout the Arctic, can be substantial. Therefore, our novel data are relevant for vast ice- rich permafrost deposits vulnerable to thermokarst formation.
K E Y W O R D Sanaerobic, greenhouse gases, incubation experiments, lipid biomarkers, organic matter degradation, permafrost thaw, talik, Yakutia

2824 | JONGEJANS Et Al.
Estop- Aragonés & Blodau, 2012; Waldrop et al., 2010) and only few studies have incubated permafrost sediments from >10 m deep (Dutta et al., 2006; Knoblauch et al., 2013; Lee et al., 2012). Even though several studies showed that aerobic decomposition released more OC than anaerobic decomposition over short time scales (months– years; Knoblauch et al., 2013; Lee et al., 2012; Schädel et al., 2016), CH4 emissions from permafrost regions are projected to become more important on longer time scales (decades– centuries; Dean et al., 2018; Knoblauch et al., 2018). Furthermore, Knoblauch et al. (2018) showed that after multiple years, the production of car-bon dioxide (CO2) carbon equivalents is higher under anaerobic con-ditions when taking into account the much stronger global warming potential of CH4 compared to CO2 (28 over a 100- year timescale; Myhre et al., 2013). Moreover, increased thermokarst lake initiation, especially in the continuous permafrost zone (Nitze et al., 2017), might lead to a landscape- scale increase of anaerobic decomposi-tion processes.
Here, we studied GHG production, long- chain n- alkanes, branched GDGTs, and archaeal microbial markers in talik sediments to determine the OM characteristics of Yedoma sediments thawed under subaquatic conditions underneath two different thermokarst lakes. We focused on the following research questions: (1) can we characterize the OM degradability of thawed Yedoma deposits using biomarker analyses and (2) how much GHG is produced in these de-posits after thaw? For the first time, to the best of our knowledge, we present OC turnover data from Siberian Yedoma talik sediments. Furthermore, the combination of biomarker degradation proxies and incubation data from >10 m deep permafrost sediments that are thawed underneath a thermokarst lake is unique so far.
2 | MATERIAL S AND METHODS
2.1 | Study area
The study site is located in Central Yakutia (Sakha Republic), East Siberia, about 80 km southeast from the city of Yakutsk (Figure 1a). The region is part of the continuous permafrost zone with per-mafrost reaching several hundred meters in depth. The Yukechi study site (61.76495°N, 130.46664°E) includes drained lake basins (alases) and thermokarst lakes formed in Yedoma uplands with ice- rich deposits tens of meters thick that cover about two thirds of the study area (Soloviev, 1973; Ulrich et al., 2019; Windirsch et al., 2020).
Taiga vegetation, predominantly larch trees and sparse pine and birch communities, dominate the region. Underneath the for-est, the active layer reaches a thickness of ~1 m (Fedorov et al., 2014). The drained lake basins are covered by a steppe- like grass vegetation and are characterized by an active layer reaching >2 m thickness (Soloviev, 1959). The region is characterized by a strong continental climate with a mean annual air temperature of −10.7°C (mean January: −41°C, mean July: 18.5°C) and a mean annual pre-cipitation of 246 mm (period: 1982– 2012; Yakutsk Weather Station: RSM00024959; Climate- data.org, 2020).
Two different types of thermokarst lakes were selected for this study: an Alas lake and a Yedoma lake (Figure 1b). The Alas lake is located within the Yukechi Alas, which is a Holocene thermokarst basin of ~300– 500 m in diameter and ~10– 15 m lower compared to surrounding Yedoma uplands (Ulrich et al., 2019). The Alas lake has a diameter of ~57 m, a surface area of 1 ha and an average water depth
F I G U R E 1 Location of study sites. (a) Location of study area (pink square) in Central Yakutia close to Yakutsk in Siberia (globe in lower left corner). (b) Close- up of study area with coring location: YU- L7 below Alas lake (yellow circle) and YU- L15 below Yedoma lake (orange circle). (c) Digital elevation model of study area with core locations indicated. Source of (a) and (b): Sentinel- 2 (ESA) 2018- 08- 03, (c): Ulrich et al. (2017)
Altitude (m)N
YU-L7 YU-L15(b) (a)130°0'0"E
61°30'0"N
61°40'0"N
61°50'0"N
62°0'0"N
62°10'0"N
Yukechi Alas
Lena
Yaku
tsk
30 km
1 km
1 km219.5
197.5
(c)

| 2825JONGEJANS Et Al.
of 1.9 m (measured in summer 2014). The Yedoma thermokarst lake is a younger lake and is located on the Yedoma uplands. Its lake level lies approximately 18 m higher than the Alas lake level (Figure 1c). With a diameter of ~43 m and surface area of 0.6 ha, the Yedoma lake is smaller than the Alas lake but deeper (average water depth of 3.7 m). Using historical aerial imagery, this lake was estimated to be about 70 years old and developed in a small forest- free grassland area (Ulrich et al., 2017).
Thermokarst lake development in the Yukechi Alas has been monitored by the Melnikov Permafrost Institute in Yakutsk since 1992 (Fedorov & Konstantinov, 2003). Previous research by Ulrich et al. (2017) included remote sensing as well as field and statistical analysis of thermokarst lake change in the Yukechi Alas. In addition, Windirsch et al. (2020) assessed the local sediment genesis and its effect on permafrost carbon storage by analyzing sediment cores taken from Yedoma upland sediments in the close vicinity of the studied Yedoma lake YU- L15 (140 m SSW) and Alas deposits adjacent to Alas lake YU- L7 (110 m NNE; Figure S1).
2.2 | Field work
During the field campaign to Yukechi in March 2015, we re-trieved two sediment cores from the bottom of two thermokarst lakes (Figure 1b). Drilling was carried out from the lake ice using a URB2- 4T drilling rig mounted on a truck. The cores were drilled with 15.7 cm diameter for the uppermost parts and 8 cm in diame-ter in the lower parts. The sediment cores were removed from the core barrel using compressed air. Sediment core YU- L7 was 17.7 m long and retrieved from the Alas lake (61.76397°N, 130.46442°E). At the sampling position, the Alas lake had an ice cover of 70 cm and a water depth of 2.3 m on March 23, 2015. The sediment core consisted entirely of unfrozen sediments, which are part of the talik underneath the thermokarst lake. Sediment core YU- L15 was 17.2 m long and taken from the Yedoma upland lake (61.76086°N, 130.47466°E). This lake had a 71- cm thick ice cover and a water depth of 4.3 m at the sampling position on March 23, 2015. The sediment core consisted of unfrozen talik sediments down to a depth of 8.1 m followed by frozen sediments below. The cores were described visually in the field, packed in plastic core wrap-per, and kept frozen.
In both lakes, the ice was covered by ~35 cm snow. Directly un-derneath the ice cover, the pH and electrical conductivity of the lake water were respectively 8.0 and 2.45 mS cm−1 for the Alas lake and 8.3 and 2.29 mS cm−1 for the Yedoma lake.
2.3 | Laboratory analyses
We cut the sediment cores into halves with a band saw and cleaned the cutting surfaces by removing the material that was superficially thawed during the saw process. Then, we subsampled the cores for different biogeochemical laboratory analyses (Figure 2). Ten
sediment samples were taken from each core (every 1– 2 m according to the stratigraphy) and analyzed for total OC (TOC) content, lipid biomarkers, and anaerobic GHG production. Radiocarbon ages from both sediment cores were published separately (Jongejans et al., 2019). Sedimentological and geochemical data are being prepared for publication in an additional study.
2.3.1 | Organic carbon content
Sediment samples (n = 20) were analyzed for total carbon (TC) and total nitrogen (TN) content with an elemental analyzer (VarioMAX Elementar Analyser). The total inorganic carbon (TIC) content was quantified from the amount of CO2 that was released after sample treatment with phosphoric acid. The TOC content was calculated by subtracting the TIC from the TC and is expressed in weight per-centage (wt%). We calculated the TOC to TN weight ratio, which will be referred to as the C/N ratio. This ratio can be used as OM
F I G U R E 2 Schematic overview of sediment cores beneath Alas lake YU- L7 (left) and Yedoma lake YU- L15 (right). Subsamples were analyzed for lipid biomarkers (yellow squares) and incubation experiments (red squares)
YU-L7
YU-L15
Unfrozen
sediments
Lake
1716
Lake
Unfrozen
sediments
Frozen
sediments
2.30 m
Dep
th b
elow
sed
imen
t su
rfac
e (c
m)
BiomarkerSubsamples: Incubation
0
500
1000
1500
0
500
1000
1500
1770
4.30 m

2826 | JONGEJANS Et Al.
degradation proxy where the C/N ratio decreases with decomposi-tion (e.g., Gundelwein et al., 2007).
In addition, we extracted 3– 10 ml pore water from sediment samples from both cores (n = 57) that were thawed overnight at 20°C using rhizon samplers (membrane pore size: 0.12– 0.18 µm). These samples were taken from different depths than the samples for lipid biomarkers and incubations but from same stratigraphic zones. The samples were acidified with 20 µl hydrochloric acid (35%) to pH 2 and kept cool at 4°C. The dissolved OC (DOC) content was mea-sured as non- purgeable OC fraction using a Total Organic Carbon Analyzer TOC- VCPH/CPN (Shimadzu) and is expressed in mg L−1.
2.3.2 | Lipid biomarkers
Extraction and measurementSediment samples (n = 20) from the main stratigraphic units were an-alyzed for n- alkanes and lipid biomarkers (Figure 2). Approximately 8 g of dried, ground sediments were extracted using accelerated solvent extractions (ASE) with dichloromethane/methanol (DCM/MeOH; 99:1 v/v) using a Dionex 200 ASE Extractor. Each sample was held in a static phase (5 min heating) for 20 min (75°C, 5 MPa). Afterward, the samples were concentrated using a TurboVap500 at 42°C. We removed asphaltenes by dissolving the extracts in DCM/MeOH (99:1 v/v) and adding a 40× excess of n- hexane, leading to precipitation of n- hexane- insoluble substances. Four internal stand-ards were added for compound quantification: 5α- androstane, eth-ylpyrene, 5α- androstan- 17- one, and erucic acid. We separated the maltene fraction (n- hexane soluble compounds) by medium pressure liquid chromatography (Radke et al., 1980) into an aliphatic, aromatic and NSO (nitrogen, sulfur, and oxygen containing) fraction using n- hexane.
The n- alkanes were measured in the aliphatic fraction by gas chromatography- mass spectrometry (GC- MS) using a Trace GC Ultra coupled to a DSQ MS (Thermo Electron Corporation) with helium as carrier gas (1 ml min−1). The GC was equipped with a cold injection system and a BPX5 (SGE) column (50 m × 0.22 mm × 0.25 µm). The injector temperature was programmed from 50°C to 300°C at a rate of 10°C s−1. The oven was heated from its initial temperature of 50°C (1 min isothermal) to 310°C with a heating rate of 3°C min−1 (30 min isothermal). The MS was operated in the electron impact ionization mode at 50 eV. Full- scan mass spectra were obtained from m/z 50 to 600 Da with a scan rate of 2.5 scans s−1. Compounds were identified and quantified using the software Xcalibur™.
The branched and isoprenoid GDGTs, as well as the dialkyl glyc-erol diether lipid (archaeol; Figure S2) were measured in the NSO fraction using a Shimadzu LC- 10AD high- performance liquid chro-matograph coupled to a Finnigan TSQ 7000 mass spectrometer via an atmospheric pressure chemical ionization interface (corona current of 5 mA [5 kV], vaporizer T of 350°C, capillary T of 200°C, nitrogen sheath gas at 60 psi, no auxiliary gas). The sample was separated at 30°C in a column oven using a Prevail Cyano column (2.1 × 150 mm, 3 μm; Alltech) equipped with a pre- column filter. Compounds were
eluted isocratically with n- hexane (99%) and isopropanol (1%) for 5 min, followed by a linear gradient to 1.8% isopropanol in 40 min and in 1 min to 10% isopropanol. It was held for 5 min to clean the column, set back to initial conditions in 1 min, and held for 16 min for equilibration. The flow rate was set to 200 μl min−1. Mass spectra were obtained by selected ion monitoring in the positive ion mode and at a scan rate of 0.33 scans s−1. Compounds were identified using the software Xcalibur™ and quantified using a daily- measured external archaeol standard. Here, we present the concentration of branched GDGTs, isoGDGT- 0, and archaeol.
From both sediment cores, we selected five samples for open- system pyrolysis after Horsfield et al. (1989) and Stapel et al. (2018). The bitumen- free ASE residues were pyrolyzed (temperatures: 300– 600°C) and the pyrolysates, which were trapped with liquid N2, were measured on a pyrolysis gas chromatograph (Agilent GC 6890A chromatograph) equipped with a flame ionization detector (Py- GC- FID). The compounds were identified and quantified rela-tive to an n- butane external standard using the Agilent ChemStation software. We integrated short (C1– C5), intermediate (C6– C14), and longer (≥C15) n- alkanes and n- alk- 1- enes. In immature OM, these ali-phatic compounds represent aliphatic side chains as well as alcohols and fatty acids formerly covalently linked via ether or ester bonds to the complex organic matrix.
Lipid biomarker indicesFrom the n- alkane concentrations, we calculated two indices. The ACL of n- alkanes is a measure of the chain length distribution (Poynter & Eglinton, 1990), and indicates the OM source. It was calculated according to Equation (1) where i is the carbon number. We focus on long- chain n- alkanes, which are produced by terrestrial higher plants, for example in mosses (n- C23 and n- C25), in leaf waxes (n- C27 and n- C29), and in grasses (n- C31 and n- C33; e.g., Ficken et al., 1998; Zech et al., 2009).
The CPI is an index for OM degradability. Higher values typically indicate better preserved OM and the ratio decreases with degrada-tion (Bray & Evans, 1961; Marzi et al., 1993). The CPI was calculated according to Equation (2).
2.3.3 | Incubations
From the 20 sediment samples, 17 samples were used in the incuba-tion experiments to estimate GHG production from degrading OM. From each sample, we prepared three replicates for quality control. The frozen samples were thawed at 4°C overnight under an oxygen free atmosphere in a glovebox. After homogenization, approximately 10 g of sediment was weighed into 120 ml glass bottles and 10 ml
(1)ACL23−33 =
∑
i ⋅ Ci∑
Ci
.
(2)CPI23−33 =
∑
oddC23−31 +∑
oddC25−33
2 ⋅
∑
evenC24−32
.
| 2827JONGEJANS Et Al.
of autoclaved tap water added to each bottle with sediment. The 51 bottles were sealed with rubber stoppers and the headspace gas was exchanged with pure nitrogen to create an anaerobic atmosphere, comparable to the ambient conditions in the talik sediments below the thermokarst lakes. Samples were incubated anaerobically at 4°C for 1 year. CO2 and CH4 concentrations were measured biweekly in a 250- µl subsample using gas chromatography with an Agilent GC 7890A equipped with an Agilent HP- PLOT Q column. We used a ther-mal conductivity detector and flame ionization detector for measur-ing CO2 and CH4 concentrations, respectively, helium as a carrier gas, and an oven temperature of 100°C. From the concentrations, we cal-culated the average CH4 and CO2 production of the three replicates, which are expressed in µg CH4- C and CO2- C g−1 dry weight and g−1 TOC (an explanation of the calculations is provided in Supplement S1).
2.4 | Statistical analysis
We identified the stratigraphical units of the two sediment cores by constrained hierarchical clustering of all measured parameters. We carried out this statistical clustering in R v. 3.6.1 using the “chclust” function in the package “rioja” with the method “coniss” (Juggins, 2020). We calculated the correlation (Pearson) between all param-eters and reported the statistically significant correlations (p < 0.05). Also, we compared the two sediment cores and the units using Kruskal– Wallis and Mann– Whitney Wilcoxon nonparametric tests. Using a forward- selection stepwise multiple regression, we tried to identify what parameters explained the most variance in the cumu-lative CH4 and CO2 production. We carried out the regression in R using the package “MASS” with the function “stepAIC” (Venables & Ripley, 2002) and direction “forward”. This method iterates the Akaike information criteria (AIC) for the regression model when tak-ing out one parameter at the time. The AIC statistic is a method to evaluate how well the model fits. We calculated the relative impor-tance of the significant variables with the function “calc.relimp” from the package “relaimpo” (Groemping, 2006).
3 | RESULTS
3.1 | Organic matter characteristics
3.1.1 | Alas lake sediment core YU- L7
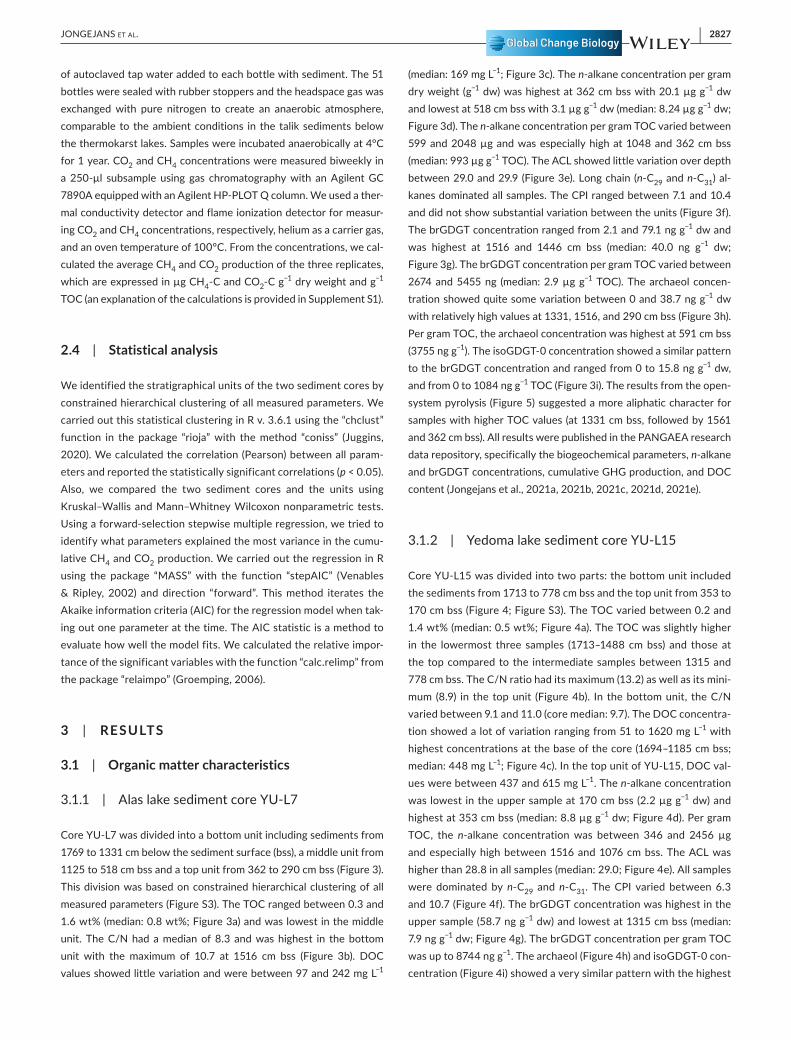
Core YU- L7 was divided into a bottom unit including sediments from 1769 to 1331 cm below the sediment surface (bss), a middle unit from 1125 to 518 cm bss and a top unit from 362 to 290 cm bss (Figure 3). This division was based on constrained hierarchical clustering of all measured parameters (Figure S3). The TOC ranged between 0.3 and 1.6 wt% (median: 0.8 wt%; Figure 3a) and was lowest in the middle unit. The C/N had a median of 8.3 and was highest in the bottom unit with the maximum of 10.7 at 1516 cm bss (Figure 3b). DOC values showed little variation and were between 97 and 242 mg L−1
(median: 169 mg L−1; Figure 3c). The n- alkane concentration per gram dry weight (g−1 dw) was highest at 362 cm bss with 20.1 µg g−1 dw and lowest at 518 cm bss with 3.1 µg g−1 dw (median: 8.24 µg g−1 dw; Figure 3d). The n- alkane concentration per gram TOC varied between 599 and 2048 µg and was especially high at 1048 and 362 cm bss (median: 993 µg g−1 TOC). The ACL showed little variation over depth between 29.0 and 29.9 (Figure 3e). Long chain (n- C29 and n- C31) al-kanes dominated all samples. The CPI ranged between 7.1 and 10.4 and did not show substantial variation between the units (Figure 3f). The brGDGT concentration ranged from 2.1 and 79.1 ng g−1 dw and was highest at 1516 and 1446 cm bss (median: 40.0 ng g−1 dw; Figure 3g). The brGDGT concentration per gram TOC varied between 2674 and 5455 ng (median: 2.9 µg g−1 TOC). The archaeol concen-tration showed quite some variation between 0 and 38.7 ng g−1 dw with relatively high values at 1331, 1516, and 290 cm bss (Figure 3h). Per gram TOC, the archaeol concentration was highest at 591 cm bss (3755 ng g−1). The isoGDGT- 0 concentration showed a similar pattern to the brGDGT concentration and ranged from 0 to 15.8 ng g−1 dw, and from 0 to 1084 ng g−1 TOC (Figure 3i). The results from the open- system pyrolysis (Figure 5) suggested a more aliphatic character for samples with higher TOC values (at 1331 cm bss, followed by 1561 and 362 cm bss). All results were published in the PANGAEA research data repository, specifically the biogeochemical parameters, n- alkane and brGDGT concentrations, cumulative GHG production, and DOC content (Jongejans et al., 2021a, 2021b, 2021c, 2021d, 2021e).
3.1.2 | Yedoma lake sediment core YU- L15
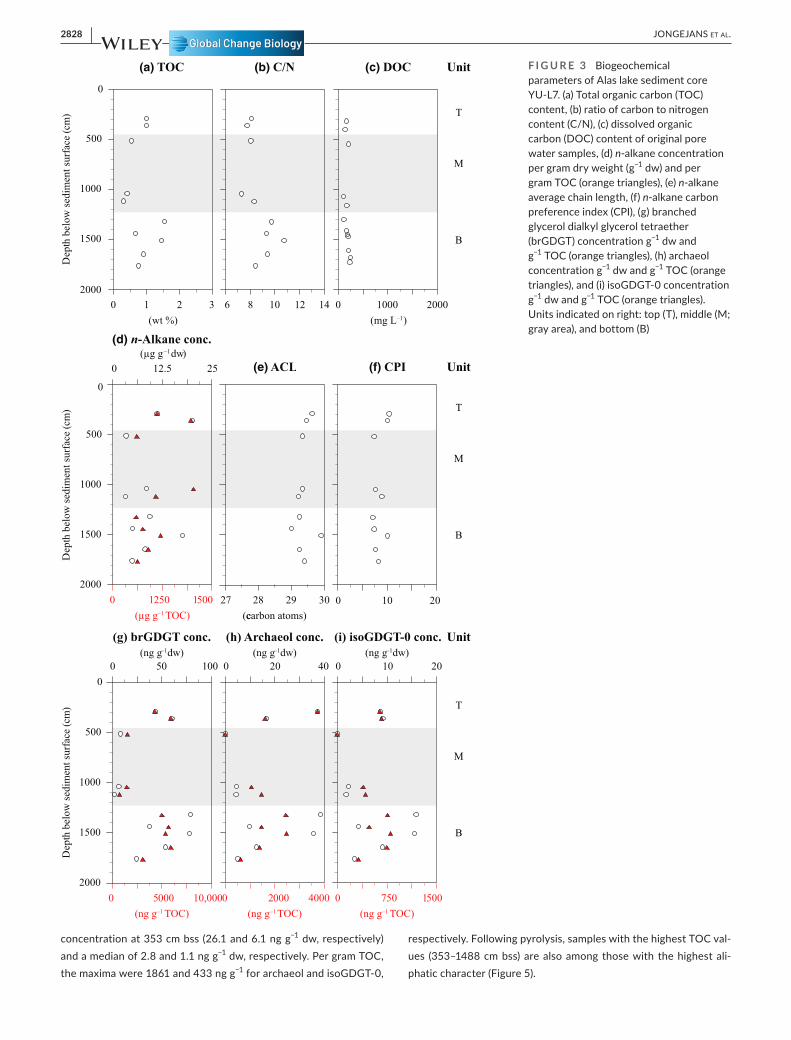
Core YU- L15 was divided into two parts: the bottom unit included the sediments from 1713 to 778 cm bss and the top unit from 353 to 170 cm bss (Figure 4; Figure S3). The TOC varied between 0.2 and 1.4 wt% (median: 0.5 wt%; Figure 4a). The TOC was slightly higher in the lowermost three samples (1713– 1488 cm bss) and those at the top compared to the intermediate samples between 1315 and 778 cm bss. The C/N ratio had its maximum (13.2) as well as its mini-mum (8.9) in the top unit (Figure 4b). In the bottom unit, the C/N varied between 9.1 and 11.0 (core median: 9.7). The DOC concentra-tion showed a lot of variation ranging from 51 to 1620 mg L−1 with highest concentrations at the base of the core (1694– 1185 cm bss; median: 448 mg L−1; Figure 4c). In the top unit of YU- L15, DOC val-ues were between 437 and 615 mg L−1. The n- alkane concentration was lowest in the upper sample at 170 cm bss (2.2 µg g−1 dw) and highest at 353 cm bss (median: 8.8 µg g−1 dw; Figure 4d). Per gram TOC, the n- alkane concentration was between 346 and 2456 µg and especially high between 1516 and 1076 cm bss. The ACL was higher than 28.8 in all samples (median: 29.0; Figure 4e). All samples were dominated by n- C29 and n- C31. The CPI varied between 6.3 and 10.7 (Figure 4f). The brGDGT concentration was highest in the upper sample (58.7 ng g−1 dw) and lowest at 1315 cm bss (median: 7.9 ng g−1 dw; Figure 4g). The brGDGT concentration per gram TOC was up to 8744 ng g−1. The archaeol (Figure 4h) and isoGDGT- 0 con-centration (Figure 4i) showed a very similar pattern with the highest
2828 | JONGEJANS Et Al.
concentration at 353 cm bss (26.1 and 6.1 ng g−1 dw, respectively) and a median of 2.8 and 1.1 ng g−1 dw, respectively. Per gram TOC, the maxima were 1861 and 433 ng g−1 for archaeol and isoGDGT- 0,
respectively. Following pyrolysis, samples with the highest TOC val-ues (353– 1488 cm bss) are also among those with the highest ali-phatic character (Figure 5).
F I G U R E 3 Biogeochemical parameters of Alas lake sediment core YU- L7. (a) Total organic carbon (TOC) content, (b) ratio of carbon to nitrogen content (C/N), (c) dissolved organic carbon (DOC) content of original pore water samples, (d) n- alkane concentration per gram dry weight (g−1 dw) and per gram TOC (orange triangles), (e) n- alkane average chain length, (f) n- alkane carbon preference index (CPI), (g) branched glycerol dialkyl glycerol tetraether (brGDGT) concentration g−1 dw and g−1 TOC (orange triangles), (h) archaeol concentration g−1 dw and g−1 TOC (orange triangles), and (i) isoGDGT- 0 concentration g−1 dw and g−1 TOC (orange triangles). Units indicated on right: top (T), middle (M; gray area), and bottom (B)
1500
1000
500
0
Dep
th b
elo
w s
e dim
ent
surf
ace
(cm
)
0 1 2 3
2000
(a) TOC
0 1000 2000
(c) DOC Unit
T
M
B
(b) C/N
2000
1500
1000
500
0
Dep
th b
elo
w s
edim
ent
surf
ace
(cm
) T
M
B
Unit
T
M
B
Unit
(e) ACL
27 28 29 30
(carbon atoms)c
0 10 20
(f) CPI0 12.5 25
0 1 1250 500
(d) n-Alkane conc.
2000
1500
1000
500
0
Dep
th b
elo
w s
edim
ent
surf
ace
(cm
)
0 5000 10,000
1000 50
(g) brGDGT conc. (h) Archaeol conc.
0 20 40
0 2000 4000
(i) isoGDGT-0 conc.
200 10
0 750 1500
6 10 148 12
(µg g dw–1 )
(ng g dw–1 ) (ng g dw–1 ) (ng g dw–1 )
(ng g–1 TOC)(ng g–1 TOC) (ng g–1 TOC)
(µg g–1 TOC)
(wt %) (mg L–1)

| 2829JONGEJANS Et Al.
F I G U R E 4 Biogeochemical parameters of Yedoma lake sediment core YU- L15. (a) Total organic carbon (TOC) content, (b) ratio of carbon to nitrogen content (C/N), (c) dissolved organic carbon (DOC) content of original pore water samples, (d) n- alkane concentration per gram dry weight (g−1 dw) and per gram TOC (orange triangles), (e) n- alkane average chain length, (f) n- alkane carbon preference index (CPI), (g) branched glycerol dialkyl glycerol tetraether (brGDGT) concentration g−1 dw and g−1 TOC (orange triangles), (h) archaeol concentration g−1 dw and g−1 TOC (orange triangles), and (i) isoGDGT- 0 concentration g−1 dw and g−1 TOC (orange triangles). Units indicated on right: top (T) and bottom (B; gray area), boundary talik to permafrost (PF) indicated with gray dashed line
0 1 2 3
Dep
thb
elo
wse
dim
ent
surf
ace
(cm
)
2000
1500
1000
500
0
0 1000 2000
Unit
T
B
TalikPF
0
Dep
th b
elo
w s
edim
ent
surf
ace
(cm
)
2000
1500
1000
500
3027 28 29 0 10 20
0 12.5 25
5000 1 2250
0
Dep
th b
elo
wse
dim
ent
surf
ace
(cm
)
2000
1500
1000
500
0 5 12 4000 10,000
0 50 100 0 20 40
Unit
T
B
TalikPF
0 000 000 0 750 500
200 10
Unit
T
B
TalikPF
6 10 148 12
(a) TOC (c) DOC(b) C/N
(e) ACL (f) CPI
(d) n-Alkane conc.
(g) brGDGT conc. (h) Archaeol conc. (i) isoGDGT-0 conc.
(ng g–1 TOC)(ng g–1 TOC)
(carbon atoms)
(µg g dw–1 )
(ng g dw–1 )(ng g dw–1 )(ng g dw–1 )
(µg g–1 TOC)
(wt %) (mg L–1)
(ng g–1 TOC)

2830 | JONGEJANS Et Al.
3.2 | Greenhouse gas production
3.2.1 | Alas lake sediment core YU- L7
In total, we measured anaerobic GHG production of 10 samples from the Alas lake sediment core YU- L7 (Figure 6). CH4 production after 1 year was highest (81.3 ± 38.2 µg CH4- C g−1 dw; mean ± stand-ard deviation) in the sample closest to the sediment surface in the top part at 290 cm bss (Figure 6a). Furthermore, CH4 production also exceeded 20 µg for the sediments at 1048 cm (54.5 ± 42.7 µg CH4- C g−1 dw) and 1769 cm bss (38.7 ± 66.3 µg CH4- C g−1 dw). When normalized to gram TOC, CH4 production was highest in the middle part of the core at 1048 cm bss (13.2 ± 10.4 mg CH4- C g−1 TOC). There was no trend in depth observed. For the three samples with the highest CH4 production, the maximum production rates
ranged from 0.62 to 0.91 µg CH4- C g−1 dw day−1 (Figure 6b). After ~350 days, the rates of these samples decreased. In samples yielding higher CH4 concentrations, CH4 production started after ~200 days and increased exponentially. In 6 out of 10 samples, the CH4 rates increased over time. Cumulative GHG production and rates for all replicates are shown in the supplement (Figures S6– S22).
CO2 production was highest in the top part of the sediment core at 362 cm bss (227.15 ± 248.8 µg CO2- C g−1 dw), closely followed by the sample at 1446 cm bss in the bottom unit (197.6 ± 225.7 µg CO2- C g−1 dw; Figure 6c). In the middle unit, CO2 production was very low. The CO2 production per gram TOC was highest at 1446 cm bss (30.5 ± 34.8 mg CO2- C g−1 TOC). In contrast to CH4, CO2 was produced from the start of the incubation and after which the rates decreased (e.g., Figure S6). Maximum rates of all samples varied be-tween 1.52 and 3.17 µg CO2- C g−1 dw day−1 (Figure 6d).
3.2.2 | Yedoma lake sediment core YU- L15
Anaerobic GHG production was measured on seven samples from the Yedoma lake sediment core YU- L15 (Figure 7). CH4 produc-tion in the Yedoma lake sediment core YU- L15 was highest in the top of the core (Figure 7a). The maximum was at 353 cm bss with 87.0 ± 44.0 µg CH4- C g−1 dw. The sample at 170 and 966 cm bss also showed substantial CH4 production (64.1 ± 57.2 and 41.6 ± 26.9 µg CH4- C g−1 dw, respectively). The CH4 production normalized to gram TOC was highest in the sample at 966 cm bss (18.8 ± 12.2 mg CH4- C g−1 TOC). Like in the Alas lake core, CH4 production started after 200 days for most samples and increased exponentially (e.g., Figure S6). In five samples, the CH4 production rates increased over time and were highest at the end of the incubations from 300 days and onward. The three samples with the highest cumulative CH4 production (353, 170, and 966 cm bss) also had the highest rates ranging from 0.56 to 1.15 µg CH4- C g−1 dw day−1 (Figure 7b).
The CO2 production was highest in the bottom of the core (Figure 7c). The maximum CO2 production was observed in the sample at 1488 cm bss (561.5 ± 527.4 µg CO2- C g−1 dw). In the
F I G U R E 5 Horsfield diagram: Chain length distribution of short (C1– C5), intermediate (C6– C14), and long (C15+) n- alkanes and n- alk- 1- enes after pyrolysis of the bitumen- free macromolecular organic matrix after Horsfield et al. (1989). Symbols correspond to samples from Alas lake sediment core YU- L7 (circles) and Yedoma lake sediment core YU- L15 (triangles)
0.4 0.6
C1–C5
0.7
0 C15+0.3
0.3
C6–C14
353
1488
170
996
1594
362
1048
1331
1516
1652
YU-L7
YU-L15
F I G U R E 6 Greenhouse gas production after 1 year from Alas lake sediment core YU- L7. (a) Cumulative methane (CH4) production in per gram dry weight (g−1 dw; circles) and per gram TOC (orange triangles), (b) maximum CH4 rates g−1 dw (circles) and g−1 TOC (orange triangles), (c) cumulative carbon dioxide (CO2) production in g−1 dw (circles) and g−1 TOC (orange triangles), (d). maximum CO2 rates g−1 dw (circles) and g−1 TOC (orange triangles). Units indicated on right: top (T), middle (M; gray area), and bottom (B)
T
M
B
Unit(a) CH4 4 prod.
0 25 50 75 100
0 5 10 15 20
(c) CO2 prod.
0 200 400 600
0 50 100 150
2000
1500
1000
500
0
Dep
th b
elo
wse
dim
ent
surf
ace
(cm
)
0 62 4 8
0 1200400 800
0 1.20.4 0.8
0 300100 200
(b) CH max. rates (d) CO2 max. rates
(µg g–1 TOC day–1)
day )(µg g dw–1 (µg g dw–1 –1 day )(µg g dw–1 –1 )(µg g dw–1 )
(mg g–1 TOC) (µg g–1 TOC day–1) (mg g–1 TOC)

| 2831JONGEJANS Et Al.
sample at 1076 cm (407.7 ± 680.1 µg CO2- C g−1 dw) and 170 cm bss (350.2 ± 346.9 µg CO2- C g−1 dw), CO2 production was also high. All samples produced more than 50 µg CO2- C, except for the sample at 1594 and 966 cm bss. The production per gram TOC was highest at 1076 cm bss (120.6 ± 201.2 mg CO2- C g−1 TOC). CO2 production started at the beginning of the incubation and increased gradually over time. Maximum CO2 production rates ranged from 1.05 to 7.67 µg CO2- C g−1 dw day−1 (Figure 7d).
3.2.3 | Carbon mineralization
Total anaerobic C production ranged from 0.02 to 0.23 mg g−1 dw in YU- L7 (max: 0.08 mg C g−1 dw as CH4) and from 0.02 to 0.56 mg g−1 dw in YU- L15 (max: 0.09 mg C g−1 dw as CH4). After 1 year, on average, 2.3 ± 3.1% of the initial carbon was mineralized to CO2 and 0.4 ± 0.6% to CH4 (Figure S4). In the first 100 days, 10 ± 21% of the cumulative CH4 was produced. Production of CH4 commenced after 200 days and CH4 produc-tion rates were highest after 300 days in most samples. In six samples (YU- L7: 1125, 1446, and 1652 cm bss; YU- L15: 778, 1076 and 1488 cm bss; Figures S10, S12, S14, S18, S20, and S22), the CH4 production was higher in the first week compared to the following weeks.
The CO2 production rates were highest in the first 100 days in 8 out of 17 samples. In four samples, the rates were highest after 300 days. Within the first 100 days, 49 ± 28% of the cumulative CO2 was produced. CO2 production was generally highest at the begin-ning of the incubations and gradually decreased over time.
3.3 | Statistical correlation and regression
Considering both cores, the TOC correlated positively with n- alkane, brGDGT, archaeol, and isoGDGT- 0 concentration (p < 0.01; Figure S5). The CO2 production was correlated with the ACL (R: −0.56, p < 0.05) and with the DOC content in adjacent samples (R: 0.58,
p < 0.05). The CH4 production was negatively correlated with the depth (R: −0.58, p < 0.05).
Using the forward- selection stepwise multiple regression method, we found that the CH4 production could not be explained by our data; no fitting model was found. The cumulative CO2 pro-duction can be explained by a generalized linear regression model as shown in Equation (3). This model describes 73.5% of the variance of the cumulative CO2 production, of which 58.5% is explained by the DOC content and the ACL alone. This clear relation of the CO2 production with a high DOC and low ACL is also shown in Figure 8.
F I G U R E 7 Greenhouse gas production after 1 year from Yedoma lake sediment core YU- L15. (a) Cumulative methane (CH4) production in per gram dry weight (g−1 dw; circles) and per gram TOC (orange triangles), (b) maximum CH4 rates g−1 dw (circles) and g−1 TOC (orange triangles), (c) cumulative carbon dioxide (CO2) production in g−1 dw (circles) and g−1 TOC (orange triangles), (d) maximum CO2 rates g−1 dw (circles) and g−1 TOC (orange triangles). Units indicated on right: top (T), middle (M; gray area), and bottom (B)
Unit
T
B
TalikPF
2
0
0
1 0
0 5 10 15
(a) CH4 prod.
0 25 50 75
150
600
0 50 100
(c) CO2 prod.
0 200 400
0
Dep
th b
elo
w s
edim
ent
surf
ace
(cm
)
2000
1500
1000
500
1.2
300
0 0.4 0.8
0 100 200
(b) CH4 max. rates
1200
80 62 4
0 400 800
(d) CO2 max. rates
(mg g–1 TOC) (µg g–1 TOC day–1) (mg g–1 TOC) (µg g–1 TOC day–1)
day )(µg g dw–1 –1(µg g dw–1 ) day )(µg g dw–1 –1(µg g dw–1 )
F I G U R E 8 Bivariate scatterplot illustrates the relation of the n- alkane average chain length (ACL) and dissolved organic carbon (DOC) content with the cumulative carbon dioxide (CO2) production after 1 year (indicated by symbol size). Samples from Alas lake sediment core (circles), talik of Yedoma lake sediment core (white triangles), and permafrost from Yedoma lake sediment core (gray triangles)
250
500
750
1000
1250
29.1 29.4 29.7
ACL
DO
C (
mg
L–
1 )
YU-L15 permafrost
YU-L15 talik
YU-L7 talik
2832 | JONGEJANS Et Al.
4 | DISCUSSION
4.1 | Organic matter degradation potential
4.1.1 | Organic carbon quantity
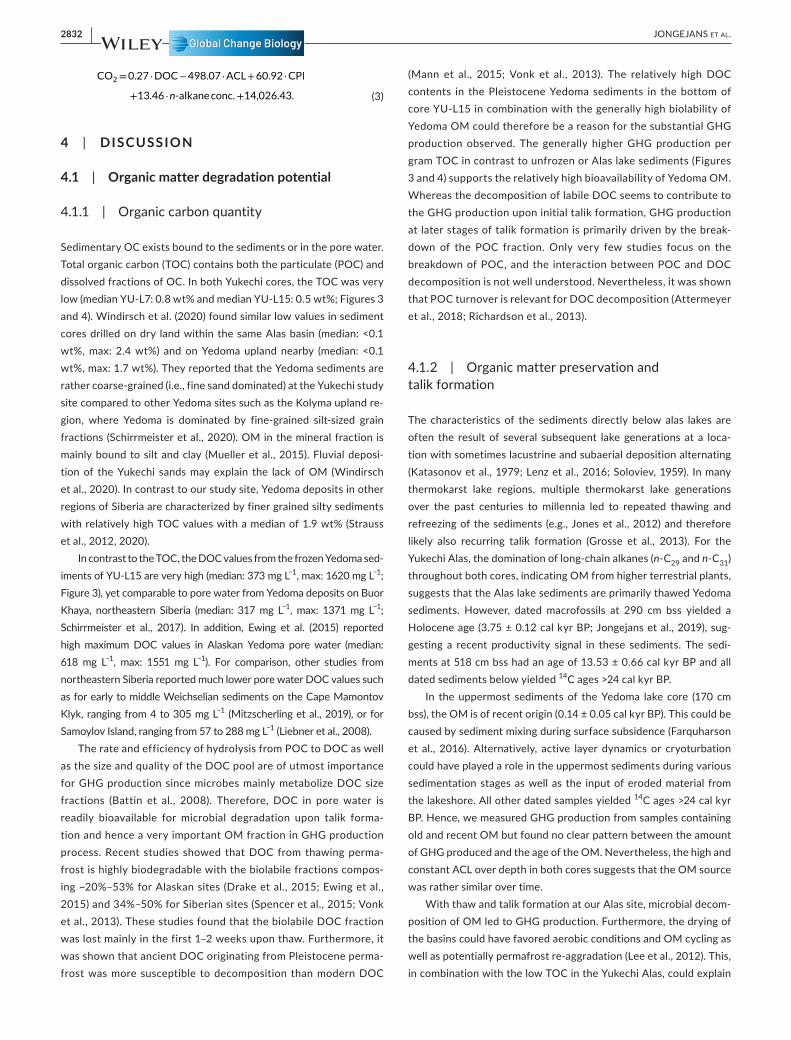
Sedimentary OC exists bound to the sediments or in the pore water. Total organic carbon (TOC) contains both the particulate (POC) and dissolved fractions of OC. In both Yukechi cores, the TOC was very low (median YU- L7: 0.8 wt% and median YU- L15: 0.5 wt%; Figures 3 and 4). Windirsch et al. (2020) found similar low values in sediment cores drilled on dry land within the same Alas basin (median: <0.1 wt%, max: 2.4 wt%) and on Yedoma upland nearby (median: <0.1 wt%, max: 1.7 wt%). They reported that the Yedoma sediments are rather coarse- grained (i.e., fine sand dominated) at the Yukechi study site compared to other Yedoma sites such as the Kolyma upland re-gion, where Yedoma is dominated by fine- grained silt- sized grain fractions (Schirrmeister et al., 2020). OM in the mineral fraction is mainly bound to silt and clay (Mueller et al., 2015). Fluvial deposi-tion of the Yukechi sands may explain the lack of OM (Windirsch et al., 2020). In contrast to our study site, Yedoma deposits in other regions of Siberia are characterized by finer grained silty sediments with relatively high TOC values with a median of 1.9 wt% (Strauss et al., 2012, 2020).
In contrast to the TOC, the DOC values from the frozen Yedoma sed-iments of YU- L15 are very high (median: 373 mg L−1, max: 1620 mg L−1; Figure 3), yet comparable to pore water from Yedoma deposits on Buor Khaya, northeastern Siberia (median: 317 mg L−1, max: 1371 mg L−1; Schirrmeister et al., 2017). In addition, Ewing et al. (2015) reported high maximum DOC values in Alaskan Yedoma pore water (median: 618 mg L−1, max: 1551 mg L−1). For comparison, other studies from northeastern Siberia reported much lower pore water DOC values such as for early to middle Weichselian sediments on the Cape Mamontov Klyk, ranging from 4 to 305 mg L−1 (Mitzscherling et al., 2019), or for Samoylov Island, ranging from 57 to 288 mg L−1 (Liebner et al., 2008).
The rate and efficiency of hydrolysis from POC to DOC as well as the size and quality of the DOC pool are of utmost importance for GHG production since microbes mainly metabolize DOC size fractions (Battin et al., 2008). Therefore, DOC in pore water is readily bioavailable for microbial degradation upon talik forma-tion and hence a very important OM fraction in GHG production process. Recent studies showed that DOC from thawing perma-frost is highly biodegradable with the biolabile fractions compos-ing ~20%– 53% for Alaskan sites (Drake et al., 2015; Ewing et al., 2015) and 34%– 50% for Siberian sites (Spencer et al., 2015; Vonk et al., 2013). These studies found that the biolabile DOC fraction was lost mainly in the first 1– 2 weeks upon thaw. Furthermore, it was shown that ancient DOC originating from Pleistocene perma-frost was more susceptible to decomposition than modern DOC
(Mann et al., 2015; Vonk et al., 2013). The relatively high DOC contents in the Pleistocene Yedoma sediments in the bottom of core YU- L15 in combination with the generally high biolability of Yedoma OM could therefore be a reason for the substantial GHG production observed. The generally higher GHG production per gram TOC in contrast to unfrozen or Alas lake sediments (Figures 3 and 4) supports the relatively high bioavailability of Yedoma OM. Whereas the decomposition of labile DOC seems to contribute to the GHG production upon initial talik formation, GHG production at later stages of talik formation is primarily driven by the break-down of the POC fraction. Only very few studies focus on the breakdown of POC, and the interaction between POC and DOC decomposition is not well understood. Nevertheless, it was shown that POC turnover is relevant for DOC decomposition (Attermeyer et al., 2018; Richardson et al., 2013).
4.1.2 | Organic matter preservation and talik formation
The characteristics of the sediments directly below alas lakes are often the result of several subsequent lake generations at a loca-tion with sometimes lacustrine and subaerial deposition alternating (Katasonov et al., 1979; Lenz et al., 2016; Soloviev, 1959). In many thermokarst lake regions, multiple thermokarst lake generations over the past centuries to millennia led to repeated thawing and refreezing of the sediments (e.g., Jones et al., 2012) and therefore likely also recurring talik formation (Grosse et al., 2013). For the Yukechi Alas, the domination of long- chain alkanes (n- C29 and n- C31) throughout both cores, indicating OM from higher terrestrial plants, suggests that the Alas lake sediments are primarily thawed Yedoma sediments. However, dated macrofossils at 290 cm bss yielded a Holocene age (3.75 ± 0.12 cal kyr BP; Jongejans et al., 2019), sug-gesting a recent productivity signal in these sediments. The sedi-ments at 518 cm bss had an age of 13.53 ± 0.66 cal kyr BP and all dated sediments below yielded 14C ages >24 cal kyr BP.
In the uppermost sediments of the Yedoma lake core (170 cm bss), the OM is of recent origin (0.14 ± 0.05 cal kyr BP). This could be caused by sediment mixing during surface subsidence (Farquharson et al., 2016). Alternatively, active layer dynamics or cryoturbation could have played a role in the uppermost sediments during various sedimentation stages as well as the input of eroded material from the lakeshore. All other dated samples yielded 14C ages >24 cal kyr BP. Hence, we measured GHG production from samples containing old and recent OM but found no clear pattern between the amount of GHG produced and the age of the OM. Nevertheless, the high and constant ACL over depth in both cores suggests that the OM source was rather similar over time.
With thaw and talik formation at our Alas site, microbial decom-position of OM led to GHG production. Furthermore, the drying of the basins could have favored aerobic conditions and OM cycling as well as potentially permafrost re- aggradation (Lee et al., 2012). This, in combination with the low TOC in the Yukechi Alas, could explain
(3)
CO2=0.27 ⋅DOC−498.07 ⋅ACL+60.92 ⋅CPI
+13.46 ⋅n-alkaneconc.+14,026.43.
| 2833JONGEJANS Et Al.
the low DOC values in the Alas core. During phases of intensified lake formation, interactions between pore water and the mineral phase could have led to liberation of DOC and the microbial trans-formation of the most biolabile fraction into GHG.
The sediments underneath the Yedoma lake have been thawed from the top down only for the last ~70 years for the first time since deposition (Ulrich et al., 2017), explaining the rather shallow talik compared to the Alas lake. The sediments at 778 cm bss of the Yedoma lake core, which was part of the talik, were attributed to the bottom cluster. This suggests that the studied OM characteristics in this sample are still more similar to the frozen sediments underneath than to the talik sediments above.
The frozen sediments in the bottom part have likely not been thawed since permafrost formation in the late Pleistocene. This suggests OM was better preserved in the permafrost sediments of the Yedoma lake compared to the top of the Alas lake sediments (Schuur et al., 2009). This was corroborated by a higher C/N ratio in the Yedoma lake sediments and in the bottom of the Alas lake sed-iments compared to the top and middle of YU- L7 (p < 0.05; Figures 3 and 4). However, we found no significant correlation between the OC loss (Figure S4) and the C/N ratio. This might be the result of the low TOC content in the Yukechi sediments; consequently, TOC and C/N are no reliable predictors of CO2 production. In the biomarker- based degradation indicators such as the CPIn- alkanes, we did not see the better preservation signal of the OM in the Yedoma lake core compared to the Alas lake core (Figures 3 and 4). Potentially, not enough time has passed since deposition for maturation (Bray & Evans, 1961). The CPI must hence be a result of the original signal and depositional environment of the OM rather than permafrost thaw history (Jongejans et al., 2020).
Stapel et al. (2018) showed that the OM from Yedoma deposits on Bol'shoy Lyakhovsky Island had a relatively high aliphatic propor-tion, which suggests the OM is more easily degradable compared to more aromatic OM. Our pyrolysis experiments showed a clear con-nection between the TOC content and the aliphatic character, which suggests that these samples might contain more biolabile OM.
4.1.3 | Presence of methanogenic communities
Archaeol and isoGDGT- 0 concentrations were significantly higher in the Alas compared to the Yedoma lake sediments (p < 0.05 and p < 0.01, respectively; Figures 3 and 4). Archaeol and isoGDGT- 0 are breakdown products of intact polar membrane lipids and represent the past archaeal biomass as a degradation product (Bischoff et al., 2013; Stapel et al., 2018). Archaeol, one of the main core membrane lipids of archaea, was used to infer methanogenic abundance spe-cifically before (Bischoff et al., 2013; Pancost et al., 2011). Increased isoGDGT- 0 and archaeol concentrations in thawed sediments can indicate a mixture of past and present archaea including methano-gens. The higher archaeal marker concentration in the Alas lake core suggests that the methanogenic communities were likely estab-lished after talik formation.
In previous studies, a positive correlation was found between CH4 production in thawing permafrost and the presence of metha-nogenic archaea (Carnevali et al., 2015; Holm et al., 2020; Knoblauch et al., 2018). In our study, the CH4 production was higher in the talik sediments of the Yedoma lake core. Lower CH4 and CO2 produc-tion in YU- L7 compared to YU- L15 suggests that the biolabile frac-tion of OM was already largely decomposed in a talik in previous thermokarst lake stages. This is corroborated by the lower C/N ratio in the Alas lake sediments. The moderate concentrations in the Yedoma lake core between 1161 and 966 cm bss might result from microbial activity during sedimentation (Bischoff et al., 2013). Holm et al. (2020) showed that microbial communities established prior to freezing could lead to an earlier start and stronger CH4 production compared to sediments where no prior communities were estab-lished. Further research is needed to study the interactions between present and past microbial communities, and the factors controlling GHG production in thawing permafrost.
4.2 | Greenhouse gas production
The 1- year- long incubation experiments showed distinct differences between the first- generation and multiple- generation thermokarst lake sediments. Both CH4 and CO2 production were higher in the Yedoma lake sediments compared to the Alas lake sediments (3 and 1.5 times higher mean, respectively). The GHG production did nei-ther correlate with the TOC content nor with the biomarker con-centrations and indices. Previous incubation studies of permafrost sediments found a positive correlation between CO2 production and TOC (Knoblauch et al., 2013; Lee et al., 2012; Walter Anthony et al., 2016). These studies, however, analyzed sediment samples with higher TOC contents compared to our study (median: 1.2, 5.0, and ~4 wt%, respectively). Furthermore, we compared sediment sam-ples that have undergone different depositional conditions and thaw legacy, which might explain the lack of correlation between TOC content and GHG production.
4.2.1 | Carbon dioxide production
CO2 production was highest in the bottom of YU- L15 (Figure 4). This is likely because the sediments were thawed for the first time since deposition, and the presence of readily bioavailable DOC after thaw. The latter is corroborated by the positive correlation between the initial DOC values in samples adjacent to the incubation samples and the CO2 production, supporting the rapid turnover of biolabile DOC fractions (Vonk et al., 2013). The CO2 production from the still fro-zen Yedoma sediments in our core (1713– 996 cm bss) is in the same order of magnitude as from Pleistocene sediments in the Lena Delta (0.13 ± 0.06 mg CO2- C g−1 dw; Knoblauch et al., 2013) and from mineral soils in Alaska and Siberia (0.34 ± 0.13 mg CO2- C g−1 dw; Lee et al., 2012). When expressed on a bulk carbon basis, however, the CO2 production in the permafrost sediments of the Yedoma lake

2834 | JONGEJANS Et Al.
(50.6 ± 53.4 mg CO2- C g−1 TOC) is much higher than from other Yedoma sites as reported by Knoblauch et al. (2013; 4.9 ± 2.1 mg CO2- C g−1 TOC) and Lee et al. (2012; 11.3 ± 12.3 mg CO2- C g−1 TOC). This means that despite the low carbon content of these sediments, the overall mineral OM has a high potential for being degraded into CO2. Nevertheless, the percentage of initial C that was mineralized to CO2 (2.3 ± 3.1%) was low in comparison with - year- long incuba-tion studies of organic- rich active layer sediments such as reported by Schädel et al. (2014; 6% loss) and Faucherre et al. (2018; 8% loss).
The median CO2 rates over time in the bottom unit of the Yedoma lake core was 50 µg CO2- C g−1 TOC day−1. While some anaero-bic incubations studies with permafrost samples had much lower CO2 production rates (median: 1.6– 3.6 µg CO2- C g−1 TOC day−1; Knoblauch et al., 2013; Zona et al., 2012), other studies found rates in the same order of magnitude as our data such as Lupascu et al. (2012) and Santruckova et al. (unpublished data; median 37.8 and 68.6 µg CO2- C g−1 TOC day−1, respectively). However, of these stud-ies, only Knoblauch et al. (2013) reported CO2 production in sedi-ments >1 m bss (i.e., down to 25 m depth).
The relatively high GHG production at the uppermost sample (290 cm bss) of the Alas lake sediment core might be explained by the input of Holocene OM (see Section 4.1.2) during a previous thermokarst lake stage where methanogenic communities were es-tablished, which might have a priming effect on the older carbon in these sediments (Wild et al., 2014).
4.2.2 | Methane production
In most of our samples, a significant start of CH4 production could be recognized only after 200 days (Figures S5 and S6). Previous incuba-tion studies also observed this lag phase and explained it as the result of the low initial abundance of methanogens in the sediments, which increases with thaw (Knoblauch et al., 2013, 2018; Treat et al., 2014; Waldrop et al., 2010). Interestingly, the frozen sample below the talik boundary in the Yedoma lake core (996 cm bss), showed the high-est maximum CH4 production rate (252.2 µg CH4- C g−1 TOC day−1). As these sediments were frozen continuously since deposition and permafrost incorporation, these findings suggest that methanogenic communities were established here prior or during deposition and survived while being freeze- locked (Holm et al., 2020). In this par-ticular sample, methanogenic taxa were likely present that produce CH4 using very low substrate TOC concentrations as reported from low- temperature incubations of Arctic soils (Blake et al., 2015), but further detailed microbial analyses are required to substantiate this hypothesis.
CH4 production was highest in the top of Yedoma lake core (Figure 7), which is corroborated by a negative correlation between CH4 production and the depth bss in this core. This fits well to thaw front migration with talik formation and subsequent gradual population of methanogenic communities. In their study of meth-anogenesis response to permafrost thaw, Holm et al. (2020) found that CH4 production was not correlated to C content, but rather to
paleoenvironmental conditions. They argued that CH4 production is more vulnerable to disturbance than anoxic CO2 production, be-cause methanogenesis is restricted to a very small group of archaea whereas there are many different groups of microorganisms produc-ing CO2 under anoxic conditions. Their findings show that anaerobic GHG release from thawing permafrost is complex and not yet well understood.
To our knowledge, Heslop et al. (2015) present the only other CH4 production rates from Yedoma deposits that were thawed in a talik. They measured C release rates as CH4 along a talik profile below an Alaskan first- generation thermokarst lake. In contrast to our data, Heslop et al. (2015) found highest CH4 production rates in the recently thawed sediments (59.6 ± 51.5 µg CH4- C g−1 TOC day−1) compared to the transitional permafrost (15.3 ± 9.1 µg CH4- C g−1 TOC day−1) and the thawed Yedoma sediments (17.9 ± 13.6 µg CH4- C g−1 TOC day−1). Our data did not show such a trend: sediments from the recently thawed permafrost (778 cm bss) had a low maxi-mum CH4 production rate (2.5 µg CH4- C g−1 TOC day−1). However, the rates from the top of YU- L15 (81.8– 135.1 µg CH4- C g−1 TOC day−1) were much higher. Nevertheless, the CH4 production is not neces-sarily directly linked to CH4 release, since a part of the produced CH4 might be oxidized in the sediment column before being released into the atmosphere (Winkel et al., 2019).
The CH4 production rates in the bottom unit of the Yedoma lake core (median: 0.02 µg CH4- C g−1 TOC day−1) were much lower com-pared to previously published CH4 rates in 4°C permafrost incuba-tion studies (0.12– 0.56 µg CH4- C g−1 TOC day−1; Knoblauch et al., 2013; Lupascu et al., 2012; Santruckova et al., unpublished data; Zona et al., 2012).
4.3 | GHG links with other parameters and outlook
Using the generalized linear regression models, we found that CO2 production was mainly explained by the ACL and the DOC content: sediments with the lowest ACL and highest DOC content produced the most CO2 (Figure 8). This suggests that these parameters de-scribe the lability of the OM best for our study. While the DOC seems to indicate the abundance of bioavailable OM (see Section 4.1), the ACL signal might represent a more labile OM source fraction from the respective surrounding ecosystem.
In some cases, we did find high archaeal markers or a strong al-iphatic character corresponding to a higher CH4 production, but in other samples, this was the exact opposite. We did not find signifi-cant correlations between biomarker distribution and CH4 produc-tion (Figure S5). Therefore, we assume that the variation must be explained by a complex interplay of different external factors con-trolling GHG production. The varying sedimentation history of the Yukechi sediments might play an important role in this, as different depositional mechanisms could have resulted in OM from different sources (e.g., transported vs. in situ, different types of plants) lead-ing to a mixture of labile and recalcitrant OM. This could have led to an activation of OM in some (sub- )samples but not in others. For the
| 2835JONGEJANS Et Al.
samples with increased bacterial and archaeal markers but low GHG production, the biomarkers might indicate past microbial activity rather than the presence of active methanogenic communities. The reactivation of such paleo- active horizons depends on factors which are not yet fully understood, but intense remineralization in the past as indicated by the high lipid biomarker concentrations might have strongly depleted labile organic compounds from the overall OM pool. Further research into intact polar lipids could help to quantify the interaction between present and past microorganisms (Bischoff et al., 2013; Stapel et al., 2018).
In contrast to our incubation experiment, external factors could influence the oxygen content of the sediments as well as the soil microbial communities under in situ conditions. Differences between the temperature used in our incubations (4°C) and the actual temperature in talik sediments, which varies seasonally depending on the depth and probably ranges from ~0°C to about 4°C (Heslop et al., 2015), might lead to over- or underestimation of GHG production. Earlier incubations (e.g., Tanski et al., 2019) and modeling research (e.g., Knoblauch et al., 2013) considered GHG production for 4 months per year, which represents the summer thaw season. GHG production in talik sediments, however, con-tinues year- round, which is why we incubated our samples for one entire year.
Thermokarst lake initiation and expansion in a warming cli-mate will continue to set free OM. Even though initially microbial abundances might be low in permafrost soils, long- term thawing of ice- rich sediments underneath thermokarst lakes will promote anaerobic conditions and activate methanogenic OM degradation, leading to substantial GHG production. Walter Anthony et al. (2016) showed that anaerobic carbon release from thermokarst lakes was directly proportional to the amount of carbon input by thawing of sediments. They calculated that, since the 1950s, 0.2– 2.5 Gt per-mafrost carbon was released as GHG in thermokarst expansion zones of pan- Arctic lakes. Converted to annual release, they found a mean CH4 production of 0.50 ± 0.09 mg CH4- C g−1 TOC year−1, which is much lower than the mean of all our samples after 1 year (3.80 ± 5.66 mg CH4- C g−1 TOC). Our findings underline the vast potential of thermokarst lake formation and subsequent GHG re-lease. Considering the importance of this input for the global climate system, this topic should receive continued attention.
5 | CONCLUSION
In this study, we analyzed GHG production and lipid biomarker dis-tributions in two 17- m- long thermokarst lake sediment cores taken in Central Yakutia, Russia. We found that the sediments in both cores were relatively OC poor, which is in agreement with previous research in the Yukechi region. We found substantial differences be-tween the well- preserved sediments below a young Yedoma lake, and the heavily thermokarst- affected sediments below an Alas lake. Both CH4 and CO2 production were higher in the Yedoma lake de-posits compared to Alas lake deposits. The highest CO2 production
was measured in the deepest, in situ still frozen part of the Yedoma lake core, which shows that potential CO2 production in newly thawed sediments strongly depends on the decomposition of read-ily available DOC. In contrast to previous research, we found no cor-relation between CO2 production and TOC content. However, CO2 production could mainly be explained by the ACL and DOC content, suggesting that OM source and quality is the main driver for CO2 production. CH4 production showed a different pattern: most CH4 was produced in the talik sediments below the Yedoma lake, sug-gesting that methanogenic communities were established in the thawed sediments but not yet in the frozen sediments in the bot-tom of the core. We assume that the variable depositional history of the Yukechi region led to the accumulation of OM from a differ-ent source and quality in different sediment layers, which explains the variation in GHG production in the sediments. The lower GHG production in the Alas lake core is a result of a degradation legacy that led to OM decomposition during earlier thermokarst lake gen-erations. GHG production from thawed permafrost was substan-tial even from OC- poor sediments, highlighting the importance of thermokarst formation in general, and thaw of mineral permafrost in particular for the climate system. Therefore, our study presents novel insights that are relevant for mineral- dominated deposits with generally low TOC contents, which are widespread throughout the Arctic.
ACKNOWLEDG MENTSWe thank the drilling team from the private company Stroiizyskaniya from Yakutsk. The expedition team thanks the local community of Chyuyya, a small village near the Yukechi Alas, for their hospital-ity and hosting us during the fieldwork. We thank the lab staff for helping with the biogeochemical analyses conducted at AWI Potsdam labs (Dyke Scheidemann and Antje Eulenburg), and incu-bation experiments and lipid biomarker analyses conducted at GFZ labs (Oliver Burckhardt, Charlotte Haugk, Lucas Horstmann, Daria Kapustina, Cornelia Karger, Ferdinand Perssen, and Anke Sobotta). The field campaign was supported by Avksentry P. Kondakov. This research was supported by the International Permafrost Association Action Group “The Yedoma Region”. Open access funding enabled and organized by Projekt DEAL.
CONFLIC T OF INTERE S TThe authors declare that there is no conflict of interest.
AUTHOR CONTRIBUTIONSLoeka L. Jongejans wrote the initial draft of the manuscript. Loeka L. Jongejans and Jens Strauss designed the lab studies. Guido Grosse, Mathias Ulrich, Jens Strauss, Alexander N. Fedorov, and Pavel Ya. Konstantinov selected the field sites and conducted the drilling expedition. Loeka L. Jongejans, Susanne Liebner, and Christian Knoblauch conducted the incubation experiments. Loeka L. Jongejans and Kai Mangelsdorf carried out the lipid bio-marker analysis. All authors contributed to the manuscript drafts and to manuscript finalization.
2836 | JONGEJANS Et Al.
DATA AVAIL ABILIT Y S TATEMENTAll results were published in the PANGAEA research data reposi-tory, specifically the biogeochemical parameters, n- alkane and brGDGT concentrations, cumulative GHG production, and DOC content (Jongejans et al., 2021a, 2021b, 2021c, 2021d, 2021e). The supplement includes additional images and tables illustrat-ing the methods and results, including graphs of the GHG of all replicates.
ORCIDLoeka L. Jongejans https://orcid.org/0000-0002-0383-4567 Susanne Liebner https://orcid.org/0000-0002-9389-7093 Christian Knoblauch https://orcid.org/0000-0002-7147-1008 Mathias Ulrich https://orcid.org/0000-0002-1337-252X Guido Grosse https://orcid.org/0000-0001-5895-2141 George Tanski https://orcid.org/0000-0002-2992-2071 Alexander N. Fedorov https://orcid.org/0000-0002-4016-2149 Torben Windirsch https://orcid.org/0000-0002-4292-6931 Jens Strauss https://orcid.org/0000-0003-4678-4982
R E FE R E N C E SAttermeyer, K., Catalán, N., Einarsdóttir, K., Freixa, A., Groeneveld, M.,
Hawkes, J., Bergquist, J., & Tranvik, L. (2018). Organic carbon pro-cessing during transport through boreal inland waters: Particles as important sites. Journal of Geophysical Research: Biogeosciences, 123, 2412– 2428. https://doi.org/10.1029/2018J G004500
Battin, T. J., Kaplan, L. A., Findlay, S., Hopkinson, C. S., Marti, E., Packman, A. I., Newbold, J. D., & Sabater, F. (2008). Biophysical controls on organic carbon fluxes in fluvial networks. Nature Geoscience, 1(2), 95– 100. https://doi.org/10.1038/ngeo101
Bischoff, J., Mangelsdorf, K., Gattinger, A., Schloter, M., Kurchatova, A. N., Herzschuh, U., & Wagner, D. (2013). Response of meth-anogenic archaea to Late Pleistocene and Holocene climate changes in the Siberian Arctic: Methanogenic Response to Climate Changes. Global Biogeochemical Cycles, 27(2), 305– 317. https://doi.org/10.1029/2011G B004238
Biskaborn, B. K., Smith, S. L., Noetzli, J., Matthes, H., Vieira, G., Streletskiy, D. A., Schoeneich, P., Romanovsky, V. E., Lewkowicz, A. G., Abramov, A., Allard, M., Boike, J., Cable, W. L., Christiansen, H. H., Delaloye, R., Diekmann, B., Drozdov, D., Etzelmüller, B., Grosse, G., … Lantuit, H. (2019). Permafrost is warming at a global scale. Nature Communications, 10(1), 264. https://doi.org/10.1038/s4146 7- 018- 08240 - 4
Blake, L. I., Tveit, A., Øvreås, L., Head, I. M., & Gray, N. D. (2015). Response of methanogens in arctic sediments to temperature and methanogenic substrate availability. PLoS One, 10(6), e0129733. https://doi.org/10.1371/journ al.pone.0129733
Bray, E. E., & Evans, E. D. (1961). Distribution of n- paraffins as a clue to recognition of source beds. Geochimica et Cosmochimica Acta, 22(1), 2– 15. https://doi.org/10.1016/0016- 7037(61)90069 - 2
Čapek, P., Diáková, K., Dickopp, J.- E., Bárta, J., Wild, B., Schnecker, J., Alves, R. J. E., Aiglsdorfer, S., Guggenberger, G., Gentsch, N., Hugelius, G., Lashchinsky, N., Gittel, A., Schleper, C., Mikutta, R., Palmtag, J., Shibistova, O., Urich, T., Richter, A., & Šantrůčková, H. (2015). The effect of warming on the vulnerability of subducted or-ganic carbon in arctic soils. Soil Biology and Biochemistry, 90, 19– 29. https://doi.org/10.1016/j.soilb io.2015.07.013
Carnevali, P. B. M., Rohrssen, M., Williams, M. R., Michaud, A. B., Adams, H., Berisford, D., Love, G. D., Priscu, J. C., Rassuchine, O., Hand, K. P., & Murray, A. E. (2015). Methane sources in arctic thermokarst
lake sediments on the North Slope of Alaska. Geobiology, 13(2), 181– 197. https://doi.org/10.1111/gbi.12124
Climate- data.org. (2020, April). Climate data for cities worldwide. http://en.clima te- data.org
Dean, J. F., Middelburg, J. J., Röckmann, T., Aerts, R., Blauw, L. G., Egger, M., Jetten, M. S. M., de Jong, A. E. E., Meisel, O. H., Rasigraf, O., Slomp, C. P., Zandt, M. H., in't Zandt, M. H., & Dolman, A. J. (2018). Methane feedbacks to the global climate system in a warmer world. Reviews of Geophysics, 56(1), 207– 250. https://doi.org/10.1002/2017R G000559
Diáková, K., Čapek, P., Kohoutová, I., Mpamah, P. A., Bárta, J., Biasi, C., Martikainen, P. J., & Šantrůčková, H. (2016). Heterogeneity of carbon loss and its temperature sensitivity in East- European sub-arctic tundra soils. FEMS Microbiology Ecology, 92(9). https://doi.org/10.1093/femse c/fiw140
Drake, T. W., Wickland, K. P., Spencer, R. G. M., McKnight, D. M., & Striegl, R. G. (2015). Ancient low– molecular- weight organic acids in perma-frost fuel rapid carbon dioxide production upon thaw. Proceedings of the National Academy of Sciences of the United States of America, 112(45), 13946– 13951. https://doi.org/10.1073/pnas.15117 05112
Dutta, K., Schuur, E. A. G., Neff, J. C., & Zimov, S. A. (2006). Potential carbon release from permafrost soils of Northeastern Siberia. Global Change Biology, 12(12), 2336– 2351. https://doi.org/10.1111/ j.1365- 2486.2006.01259.x
Elberling, B., Michelsen, A., Schädel, C., Schuur, E. A. G., Christiansen, H. H., Berg, L., Tamstorf, M. P., & Sigsgaard, C. (2013). Long- term CO2 production following permafrost thaw. Nature Climate Change, 3(10), 890– 894. https://doi.org/10.1038/nclim ate1955
Estop- Aragonés, C., & Blodau, C. (2012). Effects of experimental drying intensity and duration on respiration and methane production re-covery in fen peat incubations. Soil Biology and Biochemistry, 47, 1– 9. https://doi.org/10.1016/j.soilb io.2011.12.008
Ewing, S. A., O’Donnell, J. A., Aiken, G. R., Butler, K., Butman, D., Windham- Myers, L., & Kanevskiy, M. Z. (2015). Long- term anoxia and release of ancient, labile carbon upon thaw of Pleistocene permafrost. Geophysical Research Letters, 42(24), https://doi.org/10.1002/2015G L066296
Farquharson, L., Anthony, K. W., Bigelow, N., Edwards, M., & Grosse, G. (2016). Facies analysis of yedoma thermokarst lakes on the north-ern Seward Peninsula, Alaska. Sedimentary Geology, 340, 25– 37. https://doi.org/10.1016/j.sedgeo.2016.01.002
Faucherre, S., Jørgensen, C. J., Blok, D., Weiss, N., Siewert, M. B., Bang- Andreasen, T., Hugelius, G., Kuhry, P., & Elberling, B. (2018). Short and long- term controls on active layer and permafrost car-bon turnover across the arctic. Journal of Geophysical Research: Biogeosciences, 123(2), 372– 390. https://doi.org/10.1002/2017J G004069
Fedorov, A. N., Gavriliev, P. P., Konstantinov, P. Y., Hiyama, T., Iijima, Y., & Iwahana, G. (2014). Estimating the water balance of a thermokarst lake in the middle of the Lena River basin, eastern Siberia. Ecohydrology, 7(2), 188– 196. https://doi.org/10.1002/eco.1378
Fedorov, A. N., & Konstantinov, P. (2003). Observations of surface dy-namics with thermokarst initiation, Yukechi site, Central Yakutia. Proceedings of the 8th International Conference on Permafrost, 21– 25 July 2003, Zurich, Switzerland, 239– 243.
Ficken, K. J., Barber, K. E., & Eglinton, G. (1998). Lipid biomarker, δ13C and plant macrofossil stratigraphy of a Scottish montane peat bog over the last two millennia. Organic Geochemistry, 28(3), 217– 237. https://doi.org/10.1016/S0146 - 6380(97)00126 - 5
Groemping, U. (2006). Relative importance for linear regression in R: The package relaimpo. Journal of Statistical Software, Articles, 17(1), 1– 27. https://doi.org/10.18637/ jss.v017.i01
Grosse, G., Harden, J., Turetsky, M., McGuire, A. D., Camill, P., Tarnocai, C., Frolking, S., Schuur, E. A. G., Jorgenson, T., Marchenko, S., Romanovsky, V., Wickland, K. P., French, N., Waldrop, M., Bourgeau- Chavez, L., & Striegl, R. G. (2011). Vulnerability of
| 2837JONGEJANS Et Al.
high- latitude soil organic carbon in North America to disturbance. Journal of Geophysical Research Biogeosciences, 116(G4). https://doi.org/10.1029/2010J G001507
Grosse, G., Jones, B., & Arp, C. (2013). 8.21 Thermokarst lakes, drainage, and drained basins (pp. 325– 353).
Gundelwein, A., Müller- Lupp, T., Sommerkorn, M., Haupt, E. T. K., Pfeiffer, E.- M., & Wiechmann, H. (2007). Carbon in tundra soils in the Lake Labaz region of arctic Siberia. European Journal of Soil Science, 58(5), 1164– 1174. https://doi.org/10.1111/j.1365- 2389. 2007.00908.x
Heslop, J. K., Anthony, K. M. W., Grosse, G., Liebner, S., & Winkel, M. (2019). Century- scale time since permafrost thaw affects tempera-ture sensitivity of net methane production in thermokarst- lake and talik sediments. Science of the Total Environment, 691, 124– 134. https://doi.org/10.1016/j.scito tenv.2019.06.402
Heslop, J. K., Walter Anthony, K. M., Sepulveda- Jauregui, A., Martinez- Cruz, K., Bondurant, A., Grosse, G., & Jones, M. C. (2015). Thermokarst lake methanogenesis along a complete talik pro-file. Biogeosciences, 12(14), 4317– 4331. https://doi.org/10.5194/bg- 12- 4317- 2015
Holm, S., Walz, J., Horn, F., Yang, S., Grigoriev, M. N., Wagner, D., Knoblauch, C., & Liebner, S. (2020). Methanogenic response to long- term permafrost thaw is determined by paleoenvironment. FEMS Microbiology Ecology, 96(3), fiaa021. https://doi.org/10.1093/femse c/fiaa021
Horsfield, B., Disko, U., & Leistner, F. (1989). The micro- scale simula-tion of maturation: Outline of a new technique and its potential applications. Geologische Rundschau, 78, 361– 373. https://doi.org/10.1007/BF019 88370
Jones, M. C., Grosse, G., Jones, B. M., & Walter Anthony, K. (2012). Peat accumulation in drained thermokarst lake basins in contin-uous, ice- rich permafrost, northern Seward Peninsula, Alaska. Journal of Geophysical Research Biogeosciences, 117(G2). https://doi.org/10.1029/2011J G001766
Jongejans, L. L., Grosse, G., Ulrich, M., Fedorov, A. N., Konstantinov, P., & Strauss, J. (2019). Radiocarbon ages of talik sediments of an alas lake and a yedoma lake in the Yukechi Alas. PANGAEA. https://doi.org/10.1594/PANGA EA.904738
Jongejans, L. L., Liebner, S., Knoblauch, C., Mangelsdorf, K., & Strauss, J. (2021a). Biogeochemical parameters of thawed sediments un-derneath a Yedoma and Alas thermokarst lake in Eastern Siberia. PANGAEA, https://doi.org/10.1594/PANGA EA.928132
Jongejans, L. L., Liebner, S., Knoblauch, C., Mangelsdorf, K., & Strauss, J. (2021b). Branched glycerol dialkyl glycerol tetraether (brGDGT) concentration in thawed sediments underneath a Yedoma and Alas thermokarst lake in Eastern Siberia. PANGAEA. https://doi.org/10.1594/PANGA EA.928135
Jongejans, L. L., Liebner, S., Knoblauch, C., Mangelsdorf, K., & Strauss, J. (2021c). Cumulative greenhouse gas production in thawed sediments underneath a Yedoma and Alas thermokarst lake in Eastern Siberia. PANGAEA. https://doi.org/10.1594/PANGA EA.928140
Jongejans, L. L., Liebner, S., Knoblauch, C., Mangelsdorf, K., & Strauss, J. (2021d). Dissolved organic carbon content in thawed sediments underneath a Yedoma and Alas thermokarst lake in Eastern Siberia. PANGAEA. https://doi.org/10.1594/PANGA EA.928136
Jongejans, L. L., Liebner, S., Knoblauch, C., Mangelsdorf, K., & Strauss, J. (2021e). n- Alkane concentration in thawed sediments underneath a Yedoma and Alas thermokarst lake in Eastern Siberia. PANGAEA. https://doi.org/10.1594/PANGA EA.928134
Jongejans, L. L., Mangelsdorf, K., Schirrmeister, L., Grigoriev, M. N., Maksimov, G. M., Biskaborn, B. K., Grosse, G., & Strauss, J. (2020). n- Alkane characteristics of thawed permafrost deposits below a Thermokarst Lake on Bykovsky Peninsula, Northeastern Siberia. Frontiers in Environmental Science, 8, 118. https://doi.org/10.3389/fenvs.2020.00118
Jongejans, L. L., Strauss, J., Lenz, J., Peterse, F., Mangelsdorf, K., Fuchs, M., & Grosse, G. (2018). Organic matter characteristics in yedoma and thermokarst deposits on Baldwin Peninsula, west Alaska. Biogeosciences, 15(20), 6033– 6048. https://doi.org/10.5194/bg- 15- 6033- 2018
Juggins, S. (2020). rioja: Analysis of quaternary science data. https://cran.r- proje ct.org/packa ge=rioja
Katasonov, E., Ivanov, M., & Pudov, G. (1979). Structure and absolute geochronology of alas deposits in Central Yakutia. Novosibirsk: Science, 95.
Killops, S. D., & Killops, V. J. (2013). 5.1.2 General differences between major groups of organisms. Introduction to organic geochemis-try (p. 167). John Wiley & Sons. https://www.world cat.org/title/ intro ducti on- to- organ ic- geoch emist ry/oclc/89471 8224&refer er=brief_results
Knoblauch, C., Beer, C., Liebner, S., Grigoriev, M. N., & Pfeiffer, E.- M. (2018). Methane production as key to the greenhouse gas bud-get of thawing permafrost. Nature Climate Change, 8(4), 309– 312. https://doi.org/10.1038/s4155 8- 018- 0095- z
Knoblauch, C., Beer, C., Sosnin, A., Wagner, D., & Pfeiffer, E.- M. (2013). Predicting long- term carbon mineralization and trace gas produc-tion from thawing permafrost of Northeast Siberia. Global Change Biology, 19(4), 1160– 1172. https://doi.org/10.1111/gcb.12116
Kuhry, P., Bárta, J., Blok, D., Elberling, B., Faucherre, S., Hugelius, G., Jørgensen, C. J., Richter, A., Šantrůčková, H., & Weiss, N. (2020). Lability classification of soil organic matter in the northern per-mafrost region. Biogeosciences, 17(2), 361– 379. https://doi.org/10.5194/bg- 17- 361- 2020
Lee, H., Schuur, E. A. G., Inglett, K. S., Lavoie, M., & Chanton, J. P. (2012). The rate of permafrost carbon release under aerobic and anaerobic conditions and its potential effects on climate. Global Change Biology, 18(2), 515– 527. https://doi.org/10.1111/j.1365- 2486.2011.02519.x
Lenz, J., Wetterich, S., Jones, B. M., Meyer, H., Bobrov, A., & Grosse, G. (2016). Evidence of multiple thermokarst lake generations from an 11 800- year- old permafrost core on the northern Seward Peninsula. Alaska. Boreas, 45(4), 584– 603. https://doi.org/10.1111/bor.12186
Liebner, S., Harder, J., & Wagner, D. (2008). Bacterial diversity and com-munity structure in polygonal tundra soils from Samoylov Island, Lena Delta, Siberia. International Microbiology, 11, 195– 202. https://doi.org/10.2436/20.1501.01.60
Lupascu, M., Wadham, J. L., Hornibrook, E. R. C., & Pancost, R. D. (2012). Temperature sensitivity of methane production in the perma-frost active layer at Stordalen, Sweden: A comparison with non- permafrost northern wetlands. Arctic, Antarctic, and Alpine Research, 44(4), 469– 482. https://doi.org/10.1657/1938- 4246- 44.4.469
Mann, P. J., Eglinton, T. I., McIntyre, C. P., Zimov, N., Davydova, A., Vonk, J. E., Holmes, R. M., & Spencer, R. G. M. (2015). Utilization of an-cient permafrost carbon in headwaters of Arctic fluvial networks. Nature Communications, 6, 7856.
Marzi, R., Torkelson, B. E., & Olson, R. K. (1993). A revised carbon pref-erence index. Organic Geochemistry, 20(8), 1303– 1306. https://doi.org/10.1016/0146- 6380(93)90016 - 5
Mitzscherling, J., Horn, F., Winterfeld, M., Mahler, L., Kallmeyer, J., Overduin, P. P., Schirrmeister, L., Winkel, M., Grigoriev, M. N., Wagner, D., & Liebner, S. (2019). Microbial community composition and abundance after millennia of submarine permafrost warm-ing. Biogeosciences, 16(19), 3941– 3958. https://doi.org/10.5194/bg- 16- 3941- 2019
Mueller, C. W., Rethemeyer, J., Kao- Kniffin, J., Löppmann, S., Hinkel, K. M., & G. Bockheim, J. (2015). Large amounts of labile organic car-bon in permafrost soils of northern Alaska. Global Change Biology, 21(7), 2804– 2817. https://doi.org/10.1111/gcb.12876
Myhre, G., Shindell, D., Bréon, F.- M., Collins, W., Fuglestvedt, J., Huang, J., Koch, D., Lamarque, J.- F., Lee, D., Mendoza, B., Nakajima, T., Robock, A., Stephens, G., Takemura, T., & Zhang,

2838 | JONGEJANS Et Al.
H. (2013). Anthropogenic and natural radiative forcing. In T. F. Stocker, D. Qin, G.- K. Plattner, M. Tignor, S. K. Allen, J. Boschung, A. Nauels, Y. Xia, V. Bex, & P. M. Midgley (Eds.), Climate change 2013: The physical science basis. Contribution of working group I to the fifth assessment report of the Intergovernmental Panel on Climate Change (pp. 659– 740). Cambridge University Press. www.clima techa nge20 13.org
Neubauer, D. (2016). Characterization of organic matter stored in Yedoma and thermokarst permafrost. Unpublished MSc Thesis. Freie Universität Berlin.
Nitze, I., Grosse, G., Jones, B. M., Arp, C. D., Ulrich, M., Fedorov, A., & Veremeeva, A. (2017). Landsat- based trend analysis of lake dynam-ics across northern permafrost regions. Remote Sensing, 9(7), 1– 28. https://doi.org/10.3390/rs907 0640
Pancost, R. D., McClymont, E. L., Bingham, E. M., Roberts, Z., Charman, D. J., Hornibrook, E. R. C., Blundell, A., Chambers, F. M., Lim, K. L. H., & Evershed, R. P. (2011). Archaeol as a methanogen biomarker in ombrotrophic bogs. Organic Geochemistry, 42(10), 1279– 1287. https://doi.org/10.1016/j.orgge ochem.2011.07.003
Poynter, J., & Eglinton, G. (1990). 14. Molecular composition of three sediments from hole 717c: The Bengal fan. Proceedings of the Ocean Drilling Program: Scientific Results, 116, 155– 161.
Radke, M., Willsch, H., & Welte, D. H. (1980). Preparative hydrocarbon group type determination by automated medium pressure liquid chromatography. Analytical Chemistry, 52(3), 406– 411. https://doi.org/10.1021/ac500 53a009
Richardson, D. C., Newbold, J. D., Aufdenkampe, A. K., Taylor, P. G., & Kaplan, L. A. (2013). Measuring heterotrophic respiration rates of suspended particulate organic carbon from stream ecosystems. Limnology and Oceanography: Methods, 11(5), 247– 261. https://doi.org/10.4319/lom.2013.11.247
Romankevich, E. A., Vetrov, A. A., Belyaev, N. A., Sergienko, V. I., Semiletov, I. P., Sukhoverkhov, S. V., Bratskaya, S. Y., Prokuda, N. A., & Ulyantsev, A. S. (2017). Alkanes in Quaternary deposits of the Laptev Sea. Doklady Earth Sciences, 472(1), 36– 39. https://doi.org/10.1134/S1028 334X1 7010093
Sánchez- García, L., Vonk, J. E., Charkin, A. N., Kosmach, D., Dudarev, O. V., Semiletov, I. P., & Gustafsson, Ö. (2014). Characterisation of three regimes of collapsing arctic ice complex deposits on the SE Laptev sea coast using biomarkers and dual carbon isotopes. Permafrost and Periglacial Processes, 25(3), 172– 183. https://doi.org/10.1002/ppp.1815
Schädel, C., Bader, M.- F., Schuur, E. A. G., Biasi, C., Bracho, R., Čapek, P., De Baets, S., Diáková, K., Ernakovich, J., Estop- Aragones, C., Graham, D. E., Hartley, I. P., Iversen, C. M., Kane, E., Knoblauch, C., Lupascu, M., Martikainen, P. J., Natali, S. M., Norby, R. J., … Wickland, K. P. (2016). Potential carbon emissions dominated by carbon dioxide from thawed permafrost soils. Nature Climate Change, 6, 950– 954. https://doi.org/10.1038/nclim ate3054
Schädel, C., Schuur, E. A. G., Bracho, R., Elberling, B., Knoblauch, C., Lee, H., Luo, Y., Shaver, G. R., & Turetsky, M. R. (2014). Circumpolar as-sessment of permafrost C quality and its vulnerability over time using long- term incubation data. Global Change Biology, 20(2), 641– 652. https://doi.org/10.1111/gcb.12417
Schirrmeister, L., Dietze, E., Matthes, H., Grosse, G., Strauss, J., Laboor, S., Ulrich, M., Kienast, F., & Wetterich, S. (2020). The genesis of Yedoma Ice Complex permafrost – Grain- size endmember mod-eling analysis from Siberia and Alaska. E&G Quaternary Science Journal, 69(1), 33– 53. https://doi.org/10.5194/egqsj - 69- 33- 2020
Schirrmeister, L., Froese, D., Tumskoy, V., Grosse, G., & Wetterich, S. (2013). Yedoma: Late Pleistocene ice- rich syngenetic permafrost of Beringia. In S. A. Elias, C. J. Mock, & J. Murton (Eds.). Elsevier. https://doi.org/10.1016/B978- 0- 444- 53643 - 3.00106 - 0
Schirrmeister, L., Schwamborn, G., Overduin, P. P., Strauss, J., Fuchs, M. C., Grigoriev, M., Yakshina, I., Rethemeyer, J., Dietze, E., & Wetterich, S. (2017). Yedoma Ice Complex of the Buor Khaya
Peninsula (southern Laptev Sea). Biogeosciences, 14(5), 1261– 1283. https://doi.org/10.5194/bg- 14- 1261- 2017
Schuur, E. A. G., Bockheim, J., Canadell, J. G., Euskirchen, E., Field, C. B., Goryachkin, S. V., Hagemann, S., Kuhry, P., Lafleur, P. M., Lee, H., Mazhitova, G., Nelson, F. E., Rinke, A., Romanovsky, V. E., Shiklomanov, N., Tarnocai, C., Venevsky, S., Vogel, J. G., & Zimov, S. A. (2008). Vulnerability of permafrost carbon to climate change: Implications for the global carbon cycle. BioScience, 58(8), 701– 714. https://doi.org/10.1641/B580807
Schuur, E. A. G., McGuire, A. D., Schädel, C., Grosse, G., Harden, J. W., Hayes, D. J., Hugelius, G., Koven, C. D., Kuhry, P., Lawrence, D. M., Natali, S. M., Olefeldt, D., Romanovsky, V. E., Schaefer, K., Turetsky, M. R., Treat, C. C., & Vonk, J. E. (2015). Climate change and the permafrost carbon feedback. Nature, 520, 171– 179. https://doi.org/10.1038/natur e14338
Schuur, E. A. G., Vogel, J. G., Crummer, K. G., Lee, H., Sickman, J. O., & Osterkamp, T. (2009). The effect of permafrost thaw on old carbon release and net carbon exchange from tundra. Nature, 459(7246), 556– 559. https://doi.org/10.1038/natur e08031
Soloviev, P. A. (1959). Cryolithic Zone of the Northern Part of Lena- Amga Interfluve. Izdatel’stvo Akademii SSSR, Moscow, p. 142 (in Russian).
Soloviev, P. A. (1973). Thermokarst phenomena and land- forms due to frost heaving in Central Yakutia. Biuletyn Peryglacialny, 23, 135– 155.
Spencer, R. G. M., Mann, P. J., Dittmar, T., Eglinton, T. I., McIntyre, C., Holmes, R. M., Zimov, N., & Stubbins, A. (2015). Detecting the sig-nature of permafrost thaw in Arctic rivers. Geophysical Research Letters, 42(8), 2830– 2835. https://doi.org/10.1002/2015G L063498
Stapel, J. G., Schirrmeister, L., Overduin, P. P., Wetterich, S., Strauss, J., Horsfield, B., & Mangelsdorf, K. (2016). Microbial lipid signatures and substrate potential of organic matter in permafrost depos-its: Implications for future greenhouse gas production. Journal of Geophysical Research: Biogeosciences, 121(10), 2652– 2666. https://doi.org/10.1002/2016J G003483
Stapel, J. G., Schwamborn, G., Schirrmeister, L., Horsfield, B., & Mangelsdorf, K. (2018). Substrate potential of last interglacial to Holocene permafrost organic matter for future microbial green-house gas production. Biogeosciences, 15(7), 1969– 1985. https://doi.org/10.5194/bg- 15- 1969- 2018
Strauss, J., Laboor, S., Schirrmeister, L., Grosse, G., Fortier, D., Hugelius, G., Knoblauch, C., Romanovsky, V. E., Schädel, C., Schneider von Deimling, T., Schuur, E. A. G., Shmelev, D., Ulrich, M., & Veremeeva, A. (2020). Yedoma and Thermokarst site characteristics from sam-ple analysis, 1998– 2016, Alaska (US), Northern Siberia (RU). Alfred Wegener Institute - Research Unit Potsdam, PANGAEA. https://doi.org/10.1594/PANGA EA.919064
Strauss, J., Schirrmeister, L., Grosse, G., Fortier, D., Hugelius, G., Knoblauch, C., Romanovsky, V., Schädel, C., von Deimling, T. S., Schuur, E. A. G., Shmelev, D., Ulrich, M., & Veremeeva, A. (2017). Deep Yedoma permafrost: A synthesis of depositional character-istics and carbon vulnerability. Earth- Science Reviews, 172, 75– 86. https://doi.org/10.1016/j.earsc irev.2017.07.007
Strauss, J., Schirrmeister, L., Mangelsdorf, K., Eichhorn, L., Wetterich, S., & Herzschuh, U. (2015). Organic- matter quality of deep permafrost carbon – A study from Arctic Siberia. Biogeosciences, 12, 2227– 2245. https://doi.org/10.5194/bg- 12- 2227- 2015
Strauss, J., Schirrmeister, L., Wetterich, S., Borchers, A., & Davydov, S. P. (2012). Grain- size properties and organic- carbon stock of Yedoma Ice Complex permafrost from the Kolyma lowland, north-eastern Siberia. Global Biogeochemical Cycles, 26(3), https://doi.org/10.1029/2011G B004104
Tanski, G., Wagner, D., Knoblauch, C., Fritz, M., Sachs, T., & Lantuit, H. (2019). Rapid CO2 release from eroding permafrost in seawater. Geophysical Research Letters, 46(20), 11244– 11252. https://doi.org/ 10.1029/2019G L084303
| 2839JONGEJANS Et Al.
Treat, C. C., Natali, S. M., Ernakovich, J., Iversen, C. M., Lupascu, M., McGuire, A. D., Norby, R. J., Roy Chowdhury, T., Richter, A., Šantrůčková, H., Schädel, C., Schuur, E. A. G., Sloan, V. L., Turetsky, M. R., & Waldrop, M. P. (2015). A pan- Arctic synthesis of CH4 and CO2 production from anoxic soil incubations. Global Change Biology, 21(7), 2787– 2803. https://doi.org/10.1111/gcb.12875
Treat, C. C., Wollheim, W. M., Varner, R. K., Grandy, A. S., Talbot, J., & Frolking, S. (2014). Temperature and peat type control CO2 and CH4 production in Alaskan permafrost peats. Global Change Biology, 20(8), 2674– 2686. https://doi.org/10.1111/gcb.12572
Turetsky, M. R., Abbott, B. W., Jones, M. C., Anthony, K. W., Olefeldt, D., Schuur, E. A. G., Grosse, G., Kuhry, P., Hugelius, G., Koven, C., Lawrence, D. M., Gibson, C., Sannel, A. B. K., & McGuire, A. D. (2020). Carbon release through abrupt permafrost thaw. Nature Geoscience, 13(2), 138– 143. https://doi.org/10.1038/s4156 1- 019- 0526- 0
Ulrich, M., Matthes, H., Schirrmeister, L., Schütze, J., Park, H., Iijima, Y., & Fedorov, A. N. (2017). Differences in behavior and distribution of permafrost- related lakes in Central Yakutia and their response to climatic drivers. Water Resources Research, 53(2), 1167– 1188. https://doi.org/10.1002/2016W R019267
Ulrich, M., Matthes, H., Schmidt, J., Fedorov, A. N., Schirrmeister, L., Siegert, C., Schneider, B., Strauss, J., & Zielhofer, C. (2019). Holocene thermokarst dynamics in Central Yakutia – A multi- core and robust grain- size endmember modeling approach. Quaternary Science Reviews, 218, 10– 33. https://doi.org/10.1016/j.quasc irev. 2019.06.010
Ulyantsev, A. S., Romankevich, E. A., Bratskaya, S. Y., Prokuda, N. A., Sukhoverkhov, S. V., Semiletov, I. P., & Sergienko, V. I. (2017). Characteristic of quaternary sedimentation on a shelf of the Laptev Sea according to the molecular composition of n- alkanes. Doklady Earth Sciences, 473(2), 449– 453. https://doi.org/10.1134/S1028 334X1 7040158
Venables, W. N., & Ripley, B. D. (2002). Modern applied statistics with S (fourth). Springer. http://www.stats.ox.ac.uk/pub/MASS4/
Vonk, J. E., Mann, P. J., Davydov, S., Davydova, A., Spencer, R. G. M., Schade, J., Sobczak, W. V., Zimov, N., Zimov, S., Bulygina, E., Eglinton, T. I., & Holmes, R. M. (2013). High biolability of ancient permafrost carbon upon thaw. Geophysical Research Letters, 40(11), 2689– 2693. https://doi.org/10.1002/grl.50348
Waldrop, M. P., Wickland, K. P., White, R. III, Berhe, A. A., Harden, J. W., & Romanovsky, V. E. (2010). Molecular investigations into a globally important carbon pool: Permafrost- protected carbon in Alaskan soils. Global Change Biology, 16(9), 2543– 2554. https://doi.org/10.1111/j.1365- 2486.2009.02141.x
Walter Anthony, K., Daanen, R., Anthony, P., Schneider von Deimling, T., Ping, C.- L., Chanton, J. P., & Grosse, G. (2016). Methane emissions proportional to permafrost carbon thawed in Arctic lakes since the 1950s. Nature Geoscience, 9(9), 679– 682. https://doi.org/10.1038/ngeo2795
Walz, J., Knoblauch, C., Tigges, R., Opel, T., Schirrmeister, L., & Pfeiffer, E.- M. (2018). Greenhouse gas production in degrading ice- rich per-mafrost deposits in northeastern Siberia. Biogeosciences, 15(17), 5423– 5436. https://doi.org/10.5194/bg- 15- 5423- 2018
Weijers, J. W. H., Schouten, S., Spaargaren, O. C., Damsté, J. S., & Sinninghe Damsté, J. S. (2006). Occurrence and distribution of tetraether membrane lipids in soils: Implications for the use of the TEX86 proxy and the BIT index. Organic Geochemistry, 37(12), 1680– 1693. https://doi.org/10.1016/j.orgge ochem.2006.07.018
Wild, B., Schnecker, J., Alves, R. J. E., Barsukov, P., Bárta, J., Čapek, P., Gentsch, N., Gittel, A., Guggenberger, G., Lashchinskiy, N., Mikutta, R., Rusalimova, O., Šantrůčková, H., Shibistova, O., Urich, T., Watzka, M., Zrazhevskaya, G., & Richter, A. (2014). Input of easily available organic C and N stimulates microbial decomposition of soil organic matter in arctic permafrost soil. Soil Biology and Biochemistry, 75, 143– 151. https://doi.org/10.1016/j.soilb io.2014.04.014
Windirsch, T., Grosse, G., Ulrich, M., Schirrmeister, L., Fedorov, A. N., Konstantinov, P. Y., Fuchs, M., Jongejans, L. L., Wolter, J., Opel, T., & Strauss, J. (2020). Organic carbon characteristics in ice- rich permafrost in alas and Yedoma deposits, central Yakutia. Siberia. Biogeosciences, 17(14), 3797– 3814. https://doi.org/10.5194/bg- 17- 3797- 2020
Winkel, M., Sepulveda- Jauregui, A., Martinez- Cruz, K., Heslop, J. K., Rijkers, R., Horn, F., Liebner, S., & Walter Anthony, K. M. (2019). First evidence for cold- adapted anaerobic oxidation of methane in deep sediments of thermokarst lakes. Environmental Research Communications, 1(2). https://doi.org/10.1088/2515- 7620/ab1042
Zech, M., Buggle, B., Leiber, K., Marković, S., Glaser, B., Hambach, U., Huwe, B., Stevens, T., Sümegi, P., Wiesenberg, G., & Zöller, L. (2009). Reconstructing Quaternary vegetation history in the Carpathian Basin, SE- Europe, using n- alkane biomarkers as molecular fossils: Problems and possible solutions, potential and limitations. E&G Quaternary Science Journal, 58(2), 148– 155. https://doi.org/10.3285/eg.58.2.03
Zimov, S. A., Davydov, S. P., Zimova, G. M., Davydova, A. I., Schuur, E. A. G., Dutta, K., & Chapin, F. S. (2006). Permafrost carbon: Stock and decomposability of a globally significant carbon pool. Geophysical Research Letters, 33(20). https://doi.org/10.1029/2006G L027484
Zona, D., Lipson, D. A., Paw, U. K. T., Oberbauer, S. F., Olivas, P., Gioli, B., & Oechel, W. C. (2012). Increased CO2 loss from vegetated drained lake tundra ecosystems due to flooding: Increased tundra CO2 loss due to flooding. Global Biogeochemical Cycles, 26(2). https://doi.org/10.1029/2011G B004037
SUPPORTING INFORMATIONAdditional supporting information may be found online in the Supporting Information section.
How to cite this article: Jongejans LL, Liebner S, Knoblauch C, et al. Greenhouse gas production and lipid biomarker distribution in Yedoma and Alas thermokarst lake sediments in Eastern Siberia. Glob Change Biol. 2021;27:2822–2839. https://doi.org/10.1111/gcb.15566