Embed Size (px)
Citation preview

Int. J. Electrochem. Sci., 11 (2016) 8245 – 8255, doi: 10.20964/2016.10.62
International Journal of
ELECTROCHEMICAL SCIENCE
www.electrochemsci.org
Green Synthesis of Platinum Nanoparticles Using Quercus
Glauca Extract and Its Electrochemical Oxidation of Hydrazine
in Water Samples
R.Karthik1, R.Sasikumar
1, Shen-Ming Chen
1,*, M. Govindasamy
1, J.Vinoth Kumar
2, V. Muthuraj
2,
1Electroanalysis and Bioelectrochemistry Lab, Department of Chemical Engineering and
Biotechnology, National Taipei University of Technology, No.1, Section 3, Chung-Hsiao East Road,
Taipei 106, Taiwan (R.O.C). 2
Department of Chemistry, VHNSN College, Virudhunagar -626001, Tamilnadu, India. *E-mail: [email protected],
Received: 25 July 2016 / Accepted: 28 August 2016 / Published: 6 September 2016
Facile, rapid and eco-friendly synthesis of platinum nanoparticles (Pt NPs) using aqueous leaves
extract of Quercus glauca (Qg) has been reported for first time to detection of environmental and
human toxic hydrazine. The as-synthesized Pt NPs were characterized by spectroscopic and analytical
techniques. The prepared Pt NPs were around spherical in shape and the size range from 5-15 nm. The
electrocatalytic performance of hydrazine has been studied by CVs and amperometric techniques.
Interestingly, the Pt NPs modified GCE shows a sharp peak at a very lower onset oxidation potential
-0.3 V. The fabricated hydrazine sensor showed very lower detection limit, wide linear range, good
sensitivity and excellent selectivity of 7 nm, 0.01 to 283 µM, and 1.704 µA/µM/cm2
respectively. The
green synthesized Pt NPs modified GCE sensor was successfully used for the detection of hydrazine
(Spiked) in various water samples.
Keywords: Quercus glauca, Eco-friendly, Platinum nanoparticles, Hydrazine
1. INTRODUCTION
Hydrazine (N2H2) is one of the main reducing agent for used in industries and agricultures.
Hydrazine or its derivatives also widely used in different important applications. Specifically, blowing
agents, precursor to pesticides and pharmaceuticals, rocket fuel, corrosion inhibitors, plant growth
regulators, fuel cells, gun propellant, catalyst, insecticides and antioxidant etc.,[1]. Hydrazine also
considered is highly toxic and very dangerous even in low ppm range to human and environmental in
the anhydrous form. So, the U.S. environmental protection agency (EPA) declared and listed hydrazine

Int. J. Electrochem. Sci., Vol. 11, 2016
8246
is a most priority toxic pollutant. The high level of hydrazine causes diseases in human such as coma,
pulmonary edema, seizures, dizziness, nausea and eye, nose, throat irradiation and also severe
exposure to damage the central nervous system, kidneys and liver. Not only human, the animal also
affected for inhalation of hydrazine may produce liver tumors, dermatitis, spleen and thyroid problems.
Finally, severe exposure of hydrazine for continuous 6 months causes death. So, the detection of
hydrazine is very necessary. A number of methods have been previously reported to detection of
hydrazine including chemiluminescence [2], high performance liquid chromatography (HPLC) [3],
spectrophotometry [4], gas chromatography-mass spectrometry and fluorescence [1]. Among them, the
electrochemical methods offer a portable, cheap, time consuming, fast, sensitive and selective method
for the detection of hydrazine.
Recently, nanomaterials have much attention due to their variety of applications such as energy
storage devices, electronic and optical displays, manufacturing of advanced materials, super
computers, catalysis, chemical and biosensors, etc., [5-7]. Particularly, noble metal nanoparticles viz
Ag, Au, Pd and Pt have wide recognition owing to their potential role in physics, chemistry, material
science, biological and medicinal areas [8]. Among them, platinum has high surface area, high melting
point (1769 ˚C) and good resistance to corrosion and chemical attacks. It is an efficient catalyst for the
reduction of automobile pollution, hydrogen storage material, proton membrane exchange fuel cells,
direct methanol fuel cells and so forth. Up to now, various approaches were developed for the
synthesis of Pt NPs by different methods such as sol-gel route, chemical precipitation, pyrolysis,
hydrothermal synthesis, sol process, vapor deposition and electro-deposition. The aforementioned
techniques have some limitations such as multi-step process, high energy requirement and the use of
unsafe chemicals. To overcome these problems, plant-mediated synthesis technique is simple, low
cost, eco-friendly and commodious route for the synthesis of Pt NPs. Recently, very few reports
available for the synthesis of Pt NPs using several plant extracts including Cacumen platycladi, Prunus
yedoensis, Azadirachta indica, Cochlospermum gossypium, honey, Diopyroski kaki [9-14].
In this work, we report herein the facile synthesis of Pt NPs by using quercus glauca (Qg)
leaves extract for the electrochemical detection of hydrazine for first time. The prepared nanoparticles
were confirmed by UV-visible spectroscopy, Fourier-transform infrared spectroscopy (FTIR), X-ray
diffraction (XRD) and transmission electron microscopy (TEM). The proposed technique is fast, eco-
friendly, cheap, renewable and reproducible. The fabricated Pt NPs modified glassy carbon electrode
(GCE) displayed good electrocatalytic activity towards environment and human toxicity hydrazine
with good selectivity even in the presence of common metal ions and biologically co-interfering
substances.
2. MATERIALS AND METHODS
2.1. Plant materials and chemicals
The fresh leaves of Quercus glauca (Qg) were collected from National Taipei University of
Technology (NTUT), Taipei, Taiwan (Republic of China). Chloroplatinic acid hexahydrate
Int. J. Electrochem. Sci., Vol. 11, 2016
8247
(H2PtCl6.6H2O) and hydrazine were received from Sigma-Aldrich Company. All other chemicals were
purchased from the same company and used without further purification.
2.2. Preparation of quercus glauca leaves extract
5 g of collected quercus glauca leaves were washed with de-ionized water to remove possible
impurities and dried for an hour at room temperature. The healthy leaves were finely sliced tiny pieces
and boiled with 100 ml DI water for 15 min and cooled at room temperature. Finally, the pure greenish
yellow color extract was collected by filtration and stored at 4 ˚C for further use.
2.3. Biosynthesis of Platinum nanoparticles and fabrication on the GCE
In a typical synthesis, 40 ml of pure quercus glauca leaves extract was added to the 100 ml of 2
mM H2PtCl6.6H2O solution and stirred for 30 min at 80 ˚C. During the reaction, very dark brownish
color was formed which suggests that bio-reduction process is over and the formation of Pt NPs within
30 min. The synthesized Pt NPs were separated out by centrifugation, air-dried and used for further
characterization. Before modification, the GCE was polished with 0.05 µM alumina slurry after that,
the prepared Pt NPs was dispersed (2 mg/mL) and about 8 µL was drop casted on the GCE surface.
Then, it was allowed to dried at room temperature. Finally, the dried GCE was gently washed with DD
water to remove the loosely attached molecules. The obtained GCE was used for the further
electrochemical measurements. The synthesis route for Pt NPs material and its application as
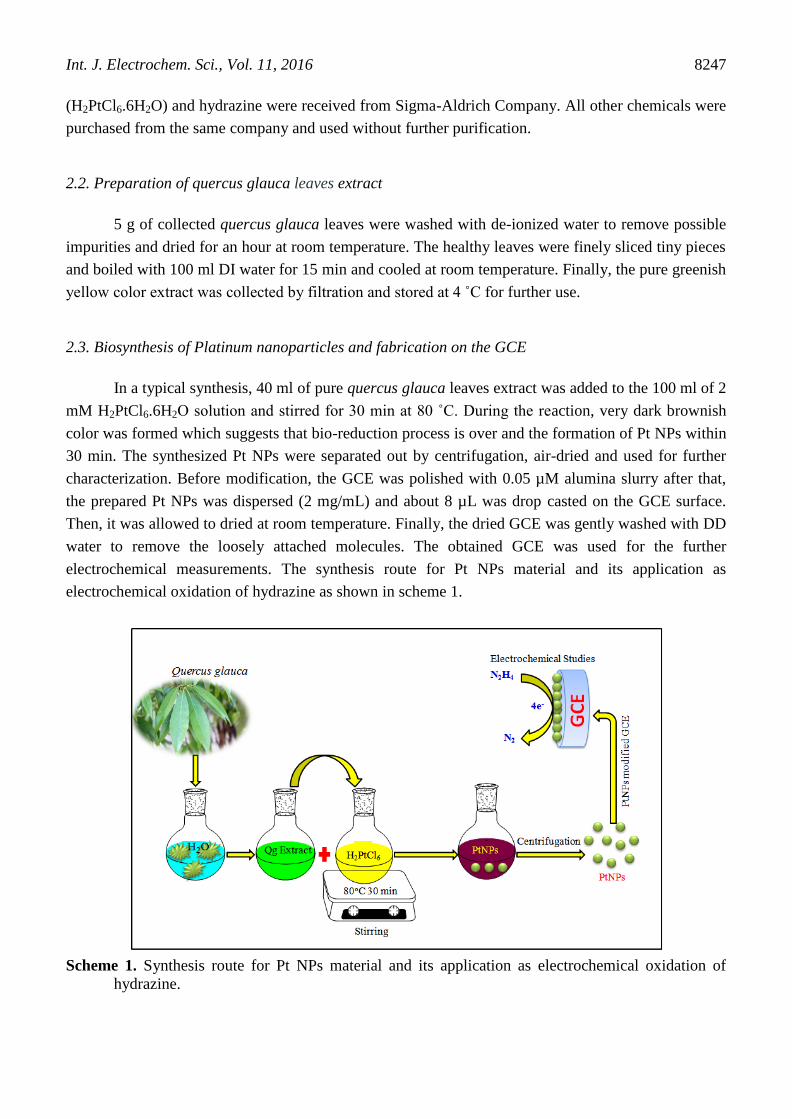
electrochemical oxidation of hydrazine as shown in scheme 1.
Scheme 1. Synthesis route for Pt NPs material and its application as electrochemical oxidation of
hydrazine.
Int. J. Electrochem. Sci., Vol. 11, 2016
8248
2.3. Characterization
The Pt NPs were characterized by UV-visible spectroscopy (Jasco V-770 spectrophotometer) in
the wavelength range of 200-800 nm. The FTIR spectrums of leaves extract and after formation of Pt
NPs were scanned (Jasco- FT/IR-6600 spectrophotometer) in the range of 400 to 4000 cm-1
. The
powder XRD were carried out on a XPERT-PRO (PANalytical B.V., The Netherlands) diffractometer
(Cu Ka radiation, k 1/4 1.54 Å). The size and morphology were confirmed by TEM (TECNAI G2
(Tokyo, Japan). Electrochemical impedance spectroscopy (EIS) studies were recorded using IM6ex
ZAHNER (Kronach, Germany). The electrochemical measurements were carried out in CHI 405a
electrochemical workstation (CH Instruments Inc., U.S.A) and amperometric (i-t) method was
measured by AFMSRX (PINE instruments, USA) with a rotating disk carbon electrode (RDCE)
having working area of 0.21 cm2. All the electrochemical studies were measured in a conventional
three-electrode system (counter electrode-Pt, reference electrode-Ag/AgCl and working electrode-GCE
(area 0.071 cm2)). All the electrochemical measurements have been executed at room temperature.
3. RESULTS AND DISCUSSION
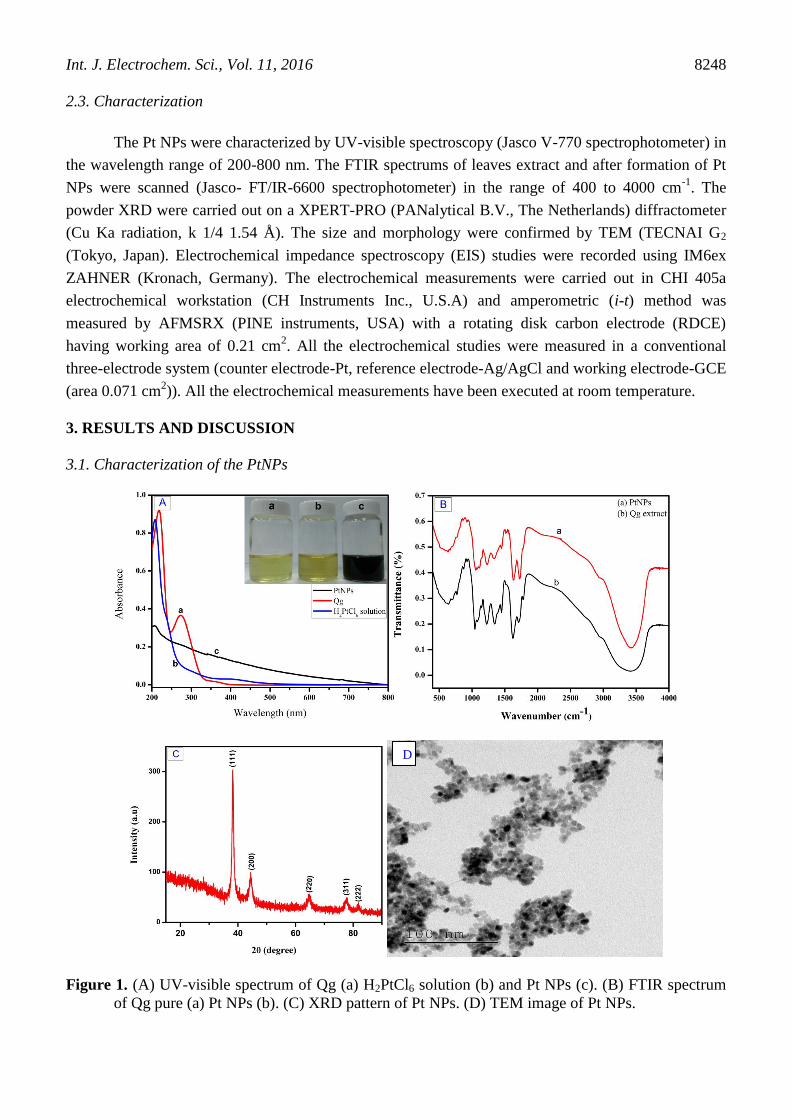
3.1. Characterization of the PtNPs
Figure 1. (A) UV-visible spectrum of Qg (a) H2PtCl6 solution (b) and Pt NPs (c). (B) FTIR spectrum
of Qg pure (a) Pt NPs (b). (C) XRD pattern of Pt NPs. (D) TEM image of Pt NPs.
D
Int. J. Electrochem. Sci., Vol. 11, 2016
8249
UV-vis spectroscopy is one of the most simple and commodious technique to identify the
formation of Pt NPs and shown in Fig.1A. The H2PtCl6.6H2O shows the absorption peak at around 210
nm (Fig1A(a)) is due to the ligand-to-metal charger-transfer transition between Pt4+
and Cl- ions and
the plant extract exhibits the peaks at 217 and 273 nm (Fig1A(b)). After the addition of Qg extract into
the H2PtCl6.6H2O, the color of the solution was changed from light yellow to dark brown (inset:
Fig1A). There was no other discernible peak observed in the UV-vis spectra (Fig1A(c)) and the
absorption value increased with the decrease of wavelength, which clearly confirmed the complete
reduction of Pt (IV) ions to Pt NPs.
FTIR spectroscopy was carried out to find out the possible biomolecules in Qg responsible for
the synthesis and stabilization of Pt NPs and shown in Fig.1B. FTIR spectra of Qg (Fig.1B (a)) showed
the bands at 3410, 1732, 1626, 1347, 1226 and 1042 cm-1
. The broad band at around 3150-3550 cm-1
attributed to the -OH groups of phenolic compounds (flavonoids), tannins and –NH stretching of
proteins. The peaks at 1732 and 1626 cm-1
represent the C=O stretching of carboxylic acids and
primary amines respectively. The bands at 1347 cm-1
correspond to the C-H bending vibrations of CH2
where as bands at 1226 and 1042 cm-1
respectively relevant to C-N stretching of aliphatic amine and
C-O-C stretching of ether or glycoside groups [15, 16]. After reduction with Pt ions, the intensity and
strength of all the peaks are evidently undermined and the shifts of some peaks observed in Fig.1B (b).
From the above results, the functional groups such as flavonoids, tannins, carboxyl, amino and
glycosides or ether groups are mainly responsible for reduction and stabilization of Pt ions to Pt NPs.
The crystalline structure and phase purity of as-synthesized Pt NPs were determined by X-ray
diffraction analysis (XRD). Fig.1C depicts the XRD pattern of Pt NPs synthesized by using Qg extract.
The five distinct diffraction peaks in the 2 theta range at 38.4, 44.7, 65.1, 77.9 and 82.2 corresponding
to the (111), (200), (220), (311) and (222) respectively. The crystallographic plane of platinum is face-
centered cubic (fcc) (JCPDS #87-0644). There is no other noticeable peak were detected,
demonstrating that as-synthesized Pt NPs had high crystalline nature. The TEM provides detail about
shape, size and morphology of green synthesized Pt NPs which is shown in Fig.1D the image clearly
indicates that Pt NPs have nearly spherical in shape and the particles size around 5-15nm.
3.2. Electrochemical impedance spectroscopy studies
Electrochemical impedance spectroscopy (EIS) is one of the most important techniques for
identifying the interfacial property of chemically modified electrodes [17]. Fig.2A reveals the nyquist
curve of bare GCE (a) and Pt NPs/GCE (b) containing 0.1 M KCl solution with 5 mM [Fe(CN)6]3-/4-
.
From the curve bare GCE (a) shows a very low semicircle it’s due to the less electron transfer
resistance compared than Pt NPs/GCE. The Pt NPs/GCE has much larger semicircle its due to the
higher electron transfer resistance (b), which clearly indicates the green synthesized Pt NPs was
successfully immobilized on the GCE surface.

Int. J. Electrochem. Sci., Vol. 11, 2016
8250
3.3. Electrochemical performance of hydrazine on the PtNPs modified GCE
Figure 2 (A). the EIS spectrum of bare (a) Pt NPs/GCE (b) containing 0.1 M KCl solution with 5 mM
[Fe(CN)6]3-/4-
. (B) CVs response of various modified electrodes presence of bare (a) Pt
NPs/GCE and absence of Pt NPs/GCE (c) of 200 µM hydrazine in 0.05M PBS pH-7 at scan
rate 50 mVs-1
. (C) Different concentration of hydrazine from 0 to 500 µM (a-f). (D) Different
scan rate from 20 to 200 mVs-1
(a-j) (inset: Ipa vs. scan rate).
Fig.2B shows the CVs response of the green synthesized Pt NPs modified GCE in the presence
(bare GCE (a) and Pt NPs/GCE (c)) and absence of (Pt NPs (b)) 200µM hydrazine containing 0.05M
phosphate buffer solution (PBS) pH-7 at a scan rate 50 mVs-1
. Fascinatingly, it is seen that the Pt NPs
modified GCE does not show any oxidation peak in the selected potential window range of -0.5 to
0.2V, which is suggesting that the Pt NPs modified GCE was electrochemically inactive. Meanwhile,
the presence of hydrazine a well-defined sharp oxidation peak (Fig.2B(c)) was observed in the onset
potential of -0.3V at the same selected potential window range. On the reverse cycle, no reduction
peak has been observed corresponding to the oxidation peak, which indicates that the electrochemical
reaction is irreversible. The presence of hydrazine in without modified GCE was also studied there is

Int. J. Electrochem. Sci., Vol. 11, 2016
8251
no oxidation peak was observed due to the unmodified GCE has no electrocatalytic activity towards
hydrazine. The above all result suggests that the green synthesized PtNPs as excellent electron
mediators and enhancing the electrochemical properties for the hydrazine oxidation. The
electrochemical oxidation mechanism of hydrazine was discussed and detailed in formerly reported
paper [18]. Fig.2C depicts the CVs of hydrazine solution in the various concentrations from 0-500
µM (a-f). The increasing the concentration of hydrazine the oxidation peak current was also increased,
which is suggests that the Pt NPs has good electrocatalytic activity towards hydrazine.
3.4. Effect of scan rate
Fig.2D reveals the CVs of the Pt NPs/GCE with various scan rates containing 200 µM of
hydrazine in PBS pH-7. It visibly shows that the anodic peak (Ipa) current was increased when
increasing the scan rates from 20 to 200 mV (a-j) and the peak potential was shifted to positive side.
The linear relationship plot was obtained with scan rate vs. Ipa (inset: Fig.2D) with linear regression
equation as Ipa = 0.3841x + 63.276 (mV). The correlation coefficient of R2= 990. The above result
indicates that the overall electrochemical process is typical surface controlled process [19].
3.5. Calibration curve and interference studies
The amperometric performance of the Pt NPs to consecutive addition of hydrazine was further
investigated under optimized from CVs experimental condition.
Figure 3.(A) Amperometric(i-t) response of PtNPs modified RDCE in PBS (pH-7) at applied potential
-0.18 V of the successive addition of various concentration of hydrazine (0.01 to 953 µM)
inset: linear relationship between Ipa vs. Hydrazine(µM) (B) Amperometric responses of Pt
NPs/RDCE to successive additions of hydrazine (a),250 fold excess concentration of Ca2+
(b)
Ba2+
(c) Cu2+
(d) Ni2+
(e) Cd2+
(f) Zn2+
(g) NO2- (h) NO3
2- (i) and 50 fold excess of biological
compounds DA (j) AA (k) UA (l) catachol (m).

Int. J. Electrochem. Sci., Vol. 11, 2016
8252
An Amperometric technique is one of the better sensitive and higher resolution method
compared than CVs technique. Based on the CVs optimized results, the amperometric (i-t) was
recorded based on green synthesized Pt NPs modified RDCE with successive addition of various
concentration of hydrazine to continuous stirred 0.05 M PBS (pH-7) at applied potential -0.18 V with
rotation speed 1200 rpm. The strong amperometric response can be observed in each addition of
hydrazine for the green synthesized Pt NPs modified RDCE and the oxidation peak current of
hydrazine increased linearly and reached a steady state current. The amperometric responses attained a
steady state signal with in 4s, suggests rapid electrocatalytic behavior. The anodic peak current was
dependent on the hydrazine concentrations. The augmented sensing performances due to the excellent
mass transport and the huge effective surface area resulting from the small size of the Pt NPs. The
amperometric signal illustrated a linear correlation to hydrazine concentration in the range of 0.01-
283µM (inset: Fig.3A), the linear regression equation was expressed as Ipa (μA) = 0.409 Chydrazine (μM)
+ 1.0812 with correlation coefficient (R2 = 989). The detection limit and sensitivity of 7nm and 1.704
µA/µM/cm2. The analytical performances such as limit of detection (LOD), applied potential, linear
range and sensitivity of the proposed electrochemical sensor have been compared with previously
reported hydrazine sensor and the comparative results are summarized in Table 1. From Table 1, it is
obvious that the limit of detection, good sensitivity and lower onset applied potential of the green
synthesized Pt NPs modified RDCE is comparable results for previously reported various modified
electrodes for hydrazine determination.
The selectivity is very important for the electrochemical sensor. In order to investigate the
selectivity based on green synthesized Pt NPs for hydrazine (a), 250 and 50 fold excess concentrations
of Ca2+
(b) Ba2+
(c) Cu2+
(d) Ni2+
(e) Cd2+
(f) Zn2+
(g) NO2- (h) NO3
2- (i) and biological compounds
such as DA (j) AA (k) UA (l) catachol (m) were chosen for their possible interferences respectively
(Fig.3B). The above results clearly confirmed that the aforementioned common metal ions and
biological compounds have no interference to the determination of hydrazine. The proposed sensor
exhibited has excellent selectivity towards hydrazine.
Table 1. Comparison of analytical performance of the proposed Green synthesized Pt NPs modified
electrode with previously reported modified electrodes for hydrazine detection.
Modified Electrodes Methods Applied
Potential
(V)
Sensitivity
(μA μM−1
cm−2
)
Linear
range
(µM)
Limit of
detection
(µM)
Ref
AuPd NPs/GR Amperometry 0.2 - 1-2185 0.2 20
Au/porous-TiO2 Amperometry 0.2 0.17 2.5-500 0.5 21
ZnO/Au Amperometry 0.3 1.6 66-415 0.06 22
Au/ZnO/WCNTs Amperometry 0.2 0.042 0.5-1800 0.15 23
Au NPs-GPE Amperometry 0.3 - - 3.07 24
γ-Fe2O3o/Au Amperometry 0.18 0.06 0.02-11 0.006 25
Ni-DAP/Au-Pt
NPs/NFs
Amperometry 0.35 - 0.2-85 0.1 26
(PANI/Pd)13
multilayers
CV -0.22 0.2-350 0.05 27
Pd-Au NPs/GCE Amperometry -0.26 - 0.1-500 0.07 28
Int. J. Electrochem. Sci., Vol. 11, 2016
8253
Pd/f-MWCNTs/GCE Amperometry 0.27 - 10-70 1 29
Pt
NPs/poly(taurine)/GCE
LSV 0.4 - 0.1–
1000
5 30
Pt
NPs/poly(BCP)/CNT/G
CE
LSV -0.28 - 0.5-1000 0.1 31
Mn2O3 nanorods Amperometry 0.6 - 2-1300 1.1 32
Au NPs/TWEEN/GO Amperometry 0.4 - 5-300 0.078 33
Pt NP BDD Amperometry -0.36 10-1000 3.3 34
Green synthesized Pt
NPs/GCE
Amperometry -0.18 1.704 0.01-283 0.007 This
work
Au-Gold: Pd-palladium: GR-Graphene; TiO2- Titanium dioxide; ZnO-Zinc oxide; WCNTs-Walled
carbon nanotubes; Au NPs-Gold nanoparticles; GPE-Graphite pencil electrode; Fe2O3- Iron oxide; Ni-
DAP-Nickel-2, 6-Diaminopyridine; Pt NPs-Platinum nanoparticles; NFs-Nanofibers; PANI-
Polyaniline; GCE-Glassy carbon electrode; f-MWCNT-functionalized multiwalled carbon nanotube;
BCP/CNT- Bromcresol purple/carbon nanotube; GO-Graphene oxide; Pt NP BDD-Platinum metal
nanoparticles boron-doped diamond
3.6. Real sample analysis
The real time application of developed hydrazine sensor was studied towards the determination of
hydrazine in various water samples. The various water samples was collected from various sources and
known concentrations of hydrazine were spiked then directly used for the hydrazine determination.
The standard addition method was followed to calculate the recoveries. The hydrazine spiked waters
samples are successfully quantified by Pt NPs/GCE. The obtained recoveries were ranging from 98.7
% to 99.8 % for the hydrazine and results are summarized in Table. 2. The obtained results showed the
satisfactory results.
Table 2. Determination of hydrazine in real samples using green synthesized Pt NPs/GCE
Sample Added (µM) Founda (µM) Recovery (%)
Tap water 10 9.92 99.2
20 19.89 99.4
Drinking water 10 9.94 99.4
20 19.96 99.8
River water 10
20
9.87
19.79
98.7
98.9 a Standard addition method
4. CONCLUSION
In conclusion, we have successfully developed green synthesized Pt NPs by using Qg leaves
extract. The structure and morphology of Pt NPs were characterized by various spectroscopic and

Int. J. Electrochem. Sci., Vol. 11, 2016
8254
analytical techniques such as UV-visible, TEM and FTIR. The crystalline structure of the as-prepared
Pt NPs was confirmed by XRD technique. EIS technique was used to examine the interfacial
properties of modified and unmodified electrodes. The green synthesized Pt NPs achieved an excellent
electrocatalytic activity towards the electro-oxidation of hydrazine in terms of very low detection limit,
wide linear range, lower onset oxidation potential and good sensitivity. The steady state current
response measured by amperometric technique, the response for electrochemical oxidation of
hydrazine was scrutinized within 4s. The practical applicability of the proposed chemical sensor was
demonstrated in various water samples (Tap, river and drinking water). In future, the exclusive and
excellent properties of our proposed chemical sensor can be widened into other significant
applications.
References
1. R. Karthik, Shen-Ming Chen, A. Elangovan, P. Muthukrishnan, R. Shanmugam, Bih-Show Lou,
Journal of Colloid and Interface Science, 468 (2016) 163-175.
2. A. Safavi, G. Absalan, F. Bamdad, Analytica Chimica Acta, 610 (2008) 243-248.
3. H. Kirchherr, Journal of Chromatography B: Biomedical Sciences and Applications, 617 (1993)
157-162.
4. M. George, K. Nagaraja, N. Balasubramanian, Analytical Letters, 40 (2007) 2597-2605.
5. M.C. Daniel, D. Astruc, Chem. Rev. 104 (2003) 293-346.
6. N. Karikalan, M. Velmurugan, S.M. Chen and K. Chelladurai, ACS Appl. Mater. Interfaces,
DOI: 10.1021/acsami.6b07260
7. N. Karikalan, M. Velmurugan, S. M. Chen and K. Chelladurai, RSC Adv, 6 (2016) 48523.
8. R. Karthik, Yu-Shen Hou, Shen-Ming Chen, A. Elangovan, M. Ganesan, P. Muthukrishnan,
Journal of Industrial and Engineering Chemistry 37 (2016) 330-339.
9. B. Zheng, T. Kong, X. Jing, T.O. Wubah, X. Li, D. Sun, F. Lu, Y. Zheng, J. Huang, Q. Li, Journal
of Colloid and Interface Science 396 (2013) 138-145.
10. P. Velmurugan, J. Shim, K. Kim, B.T. Oh, Materials letters 174 (2016) 61-65.
11. A. Thirumurugan, P. Aswitha, C. Kiruthika, S. Nagarajan, A.N. Christy, Materials Letters 170
(2016) 175-178.
12. V.T.P. Vinod, P. Saravanan, B. Sreedhar, D. Keerthi Devi, R.B. Sashidhar, Colloid Surface B., 83
(2011) 291-298.
13. R. Venu, T.S. Ramulu, S. Anandakumar, V.S. Rani, C.G. Kim, Colloid Surfaces A 384 (2011) 733-
738.
14. J.Y. Song, E.Y. Kwon, B.S. Kim, Bioproc. Biosyst. eng., 33 (2010) 159-164.
15. R.S. Bai, T.E. Water Res. 36 (2002) 1224-1236.
16. X. Huang, H. Wu, X. Liao, B. Shi, Green Chem. 12 (2009) 395-399.
17. B. Evgenij and M.J. Ross. Impedance spectroscopy theory, experiment, and applications. New
Jersy: Wiley; 2005
18. P. K. Kannan Stanislav, A. Moshkalev, and C. Sekhar Rou, RSC Adv., 6 (2016) 11329.
19. R. Madhu, B. Dinesh, S.M. Chen, R. Saraswathi and V. Mani, RSC Adv, 5 (2015) 54379.
20. Y. Liu, B. Li, W. Wei, Q. Wan and N. Yang, Adv. Mater. Res, 704 (2013) 246.
21. G. Wang, C. Zhang, X. He, Z. Li, X. Zhang, L. Wang and B. Fang, Electrochim. Acta, 55 (2010)
7204.
22. W. Sultana, S. Ghosh and B. Eraiah, Electroanalysis, 24 (2012) 1869.
Int. J. Electrochem. Sci., Vol. 11, 2016
8255
23. C. Zhang, G. Wang, Y. Ji, M. Liu, Y. Feng, Z. Zhang and B. Fang, Sens. Actuators B, 150 (2010)
247.
24. Md. AbdulAziz and A.N. Kawde, Talanta, 115 (2013) 214.
25. Y. You, Y. Yang and Z. Yang, J. Solid State Electrochem, 17 (2013) 701.
26. A. Azadbakht and A.R. Abbasi, Nano Micro Lett, 2 (2010) 296.
27. H. Lin, J. Yang, J. Liu, Y. Huang, J. Xiao, and X. Zhang, Electrochimica Acta, 90 (2013) 382.
28. M. Shamsipur, Z. Karimi, M. A. Tabrizi, and A. Shamsipur, Electroanalysis, 26 (9) (2014) 2001.
29. M. Rajkumar, C. P. Hong, and S.M. Chen, Int. J. Electrochem. Sci, 8(4) (2013) 5262.
30. Ç. C. Koçak, A. Altın, B. Aslışen and S. Koçak, Int. J. Electrochem. Sci, 11 (2016) 233.
31. S. Koçak, A. Altın and Ç. C. Koçak, Analytical Letters, 49(7) (2016) 1015.
32. B. Zhou, J.Yang and X. Jiang, Mater. Lett, 159 (2015) 362.
33. W. Lu, R. Ning, X. Qin, Y.i. Zhang, G. Chang, S. Liu, Y. Luo and X. Sun, J. Hazard. Mater, 197
(2011) 320.
34. R.B. Channon, J.C. Newland, A.W.T. Bristow, A.D. RAY, J.V. Macpherson, Electroanalysis, 25
(2013) 2613.
© 2016 The Authors. Published by ESG (www.electrochemsci.org). This article is an open access
article distributed under the terms and conditions of the Creative Commons Attribution license
(http://creativecommons.org/licenses/by/4.0/).