Embed Size (px)
DESCRIPTION
GREEN GROWTH CHALLENGE THE BRAZILIAN ALUMINUM INDUSTRY. 2012. Marco Antonielli Seyed MohammadReza Fahari Pablo Pero Cristina Rodríguez. MOTIVATION. Project Definition: We justify and design a green growth strategy for the aluminum sector in Brazil Why Green Growth? - PowerPoint PPT Presentation
Citation preview

GREEN GROWTH CHALLENGETHE BRAZILIAN ALUMINUM
INDUSTRY
Marco AntonielliSeyed MohammadReza Fahari
Pablo PeroCristina Rodríguez
2012

2
Project Definition:• We justify and design a green growth strategy for
the aluminum sector in Brazil
Why Green Growth?• climate change is global and increasingly costly• emissions on an unsustainable path• individual action: first mover advantage• an economic problem
• reduction of greenhouse gases emissions• engine for growth: green technology innovation
MOTIVATION
3
Project Definition:• We justify and design a green growth strategy for the
aluminum sector in Brazil
Why Brazil?• huge scope for growing green
Why Aluminum?• production is emission intensive• recyclable• lighter substitute for steel
MOTIVATION

1. Aluminum production process
2. Aluminum markets: Brazil and the world3. Why should Brazil promote aluminum production?4. Green growth strategy
OUTLINE

Bauxite Extraction
Alumina Production
Aluminum Production
ALUMINUM PRODUCTION CYCLE
Primary aluminum 2 main inputs: alumina and energy
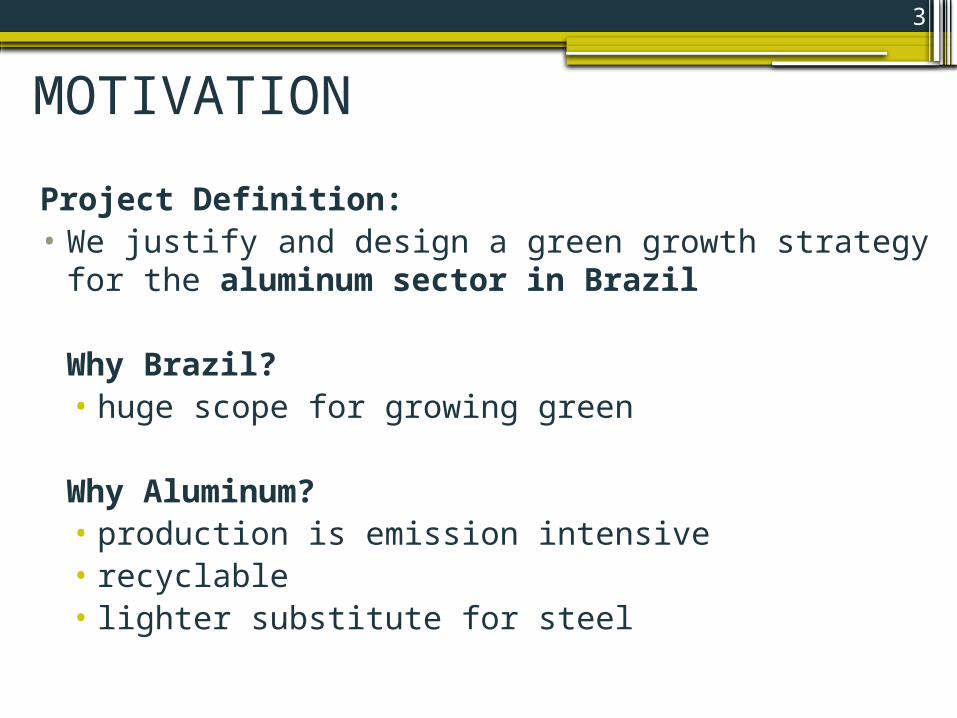
Two main features of the production process:
• Energy use• Environmental impact
Bulk of energy use primary smelting (electrolysis): 73%
Energy cost 35%
ENERGY INTENSITY

Primary - Di-rect (PFC,
Carbon, Fuel for Alumina,
etc.)
Primary - Indi-rect Electricity
Supply
Recycle/ Remelt
Fabrication
Primary smelting is the most polluting stage of aluminum production
Primary – Direct (PFC, Carbon, melting, etc.)
Primary – Indirect (Electricity consumption)
FabricationSecondary smelting
GREENHOUSE GAS EMISSIONS

1. Aluminum production process
2. Aluminum markets: Brazil and the world3. Why should Brazil promote aluminum production?4. Green growth strategy
OUTLINE

BRAZIL & WORLD RANKING
Year 2010 % GDP % Industry % Exports
Brazil 1 % 4,5% 2,4%
Year 2010 Primary Aluminum
Alumina and Bauxite
Brazilian production 7th 3rd
Brazilian exports 22nd 2nd
1997 1998 1999 2000 2001 2002 2003 2004 20050
200
400
600
800
1000
1200
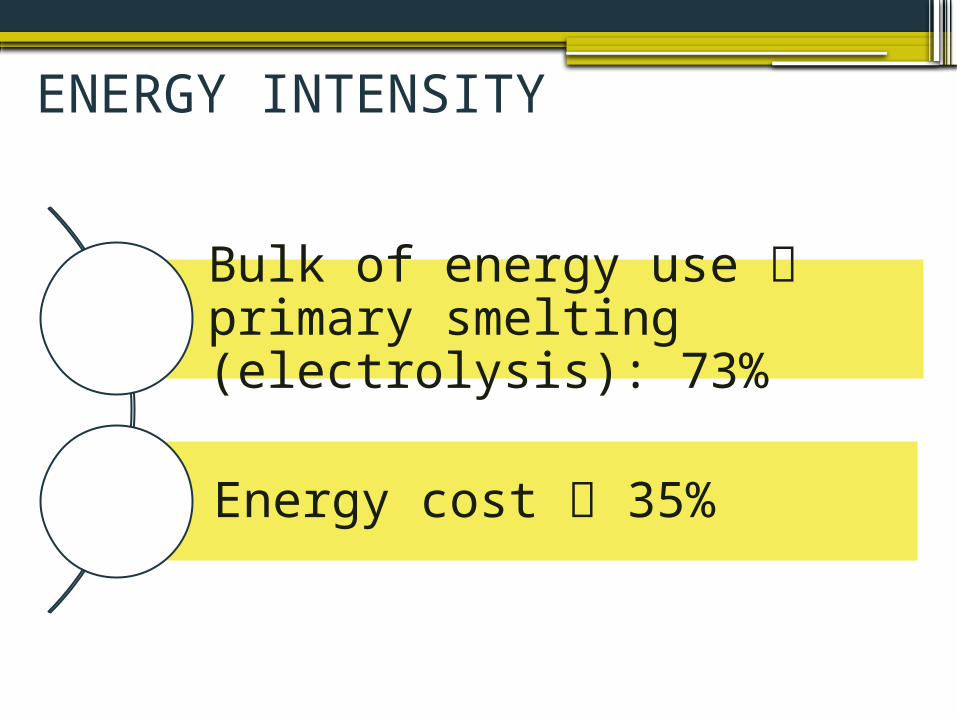
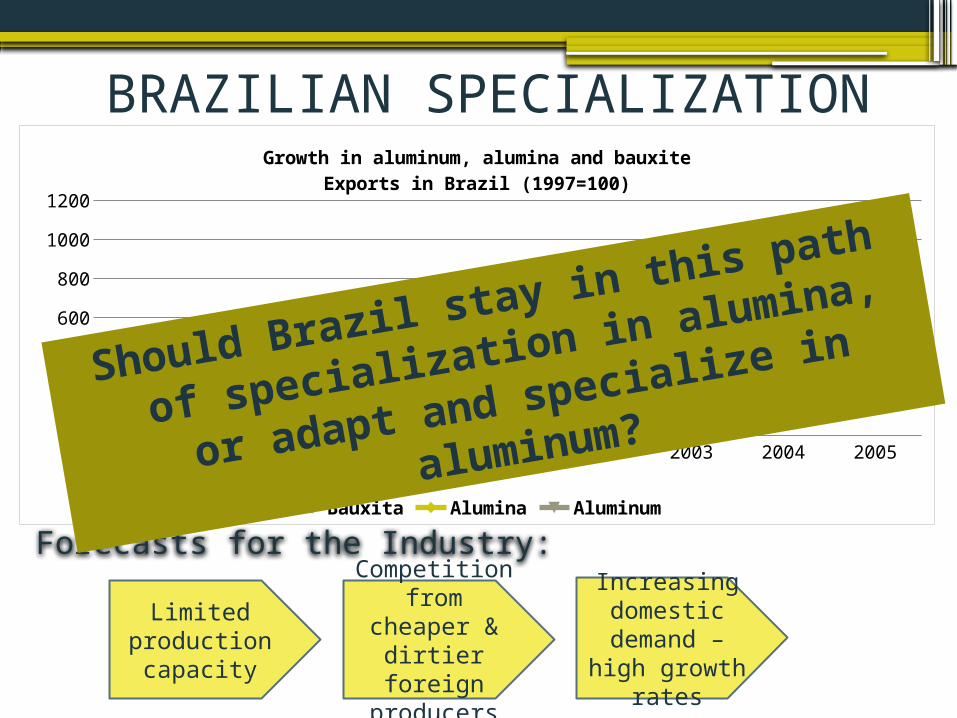
Growth in aluminum, alumina and bauxiteExports in Brazil (1997=100)
Bauxita Alumina Aluminum
BRAZILIAN SPECIALIZATION
Forecasts for the Industry:Limited
production capacity
Competition from cheaper
& dirtier foreign
producers
Increasing domestic demand –
high growth rates
Should Brazil stay in this path of
specialization in alumina, or
adapt and specialize in
aluminum?

1. Aluminum production process
2. Aluminum markets: Brazil and the world3. Why should Brazil promote aluminum production?4. Green growth strategy
OUTLINE
12
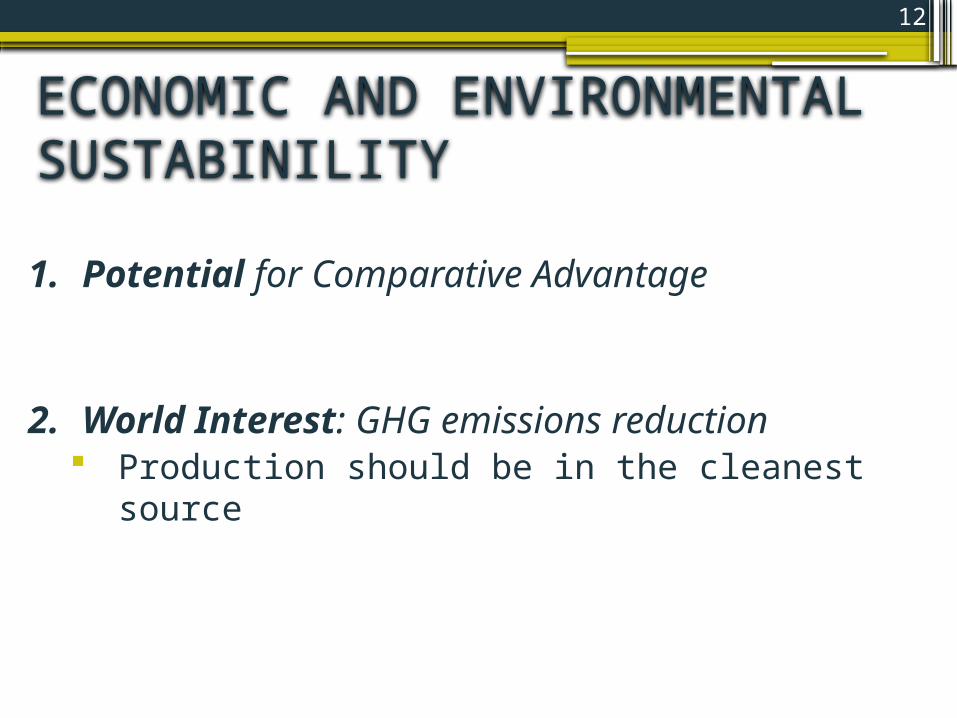
1. Potential for Comparative Advantage
2. World Interest: GHG emissions reduction Production should be in the cleanest source
ECONOMIC AND ENVIRONMENTAL SUSTABINILITY

13
•Private Costs:▫Bauxite & Alumina ▫Energy
•Social Costs (GHG emissions):▫Indirect from Energy Consumption▫Direct emissions from smelting process
POTENTIAL FOR COMPARATIVE ADVANTAGE
On average 60% - 70% of costs

14
WORLD PRODUCTION OF BAUXITA

15
Asia
Ocean
iaChin
a
Latin
Amer
ica
Wor
ld Ave
rage
Africa
/Midd
le Eas
t
Wes
tern E
urop
e
North
Amer
ica
Easter
n Eur
ope
0
50
100
150
200
250
ALUMINA PRODUCTION COSTS BY REGION (nominal USD/t 2001)

16
ELECTRICITY SOURCESIn primary production of aluminum
17
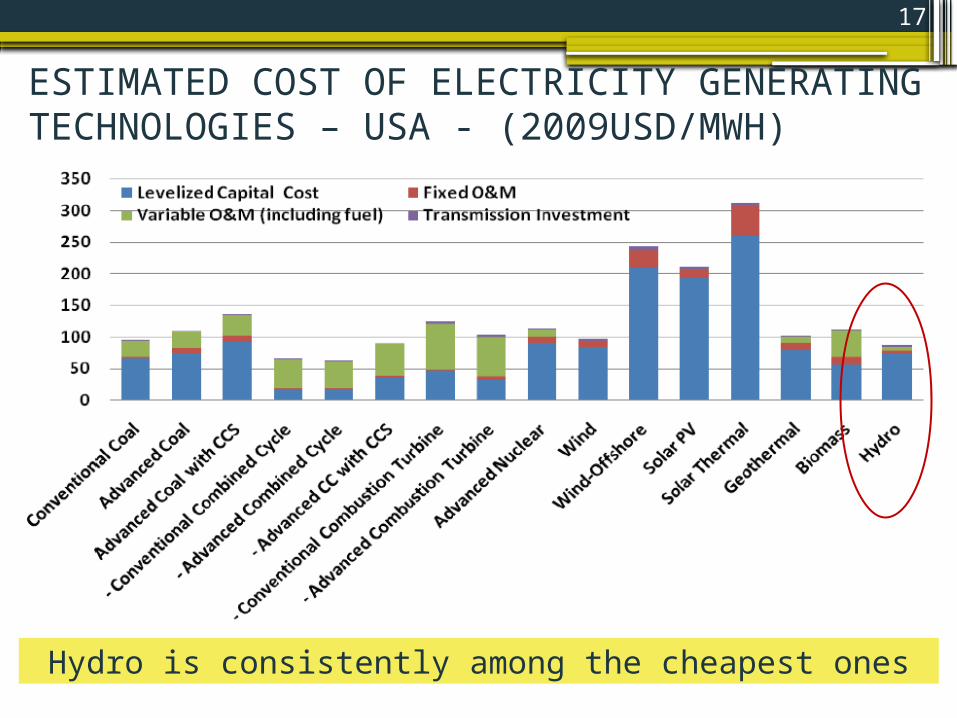
ESTIMATED COST OF ELECTRICITY GENERATING TECHNOLOGIES – USA - (2009USD/MWH)
Hydro is consistently among the cheapest ones

18
BRAZILIAN ELECTRICITY COST STRUCTURE (USD/MWh)
50
20
20
generation transmition distribution

19
BRAZILIAN ELECTRICITY COST STRUCTURE (USD/MWh)
Tax makes for 60% for final energy Price
50
20
20
125
generation transmition distribution taxes

GHG = Energy Consump * Quality + PFC Emissions
20
Emissions (kg CO2e/t Al)
EU Brazil
Alumina 638 1120Aluminum 1993 2698Recycling 205 213
No Scope for ImprovementAverage 15 MW/h per ton ofAl10% range in the World
Brazil’s clean energy Matrix Provides the best in the world
Big Scope for ImprovementEurope reduced PFC by 50% in a decadeRequires investment in R&D
GREENHOUSE GAS EMISSIONS
21
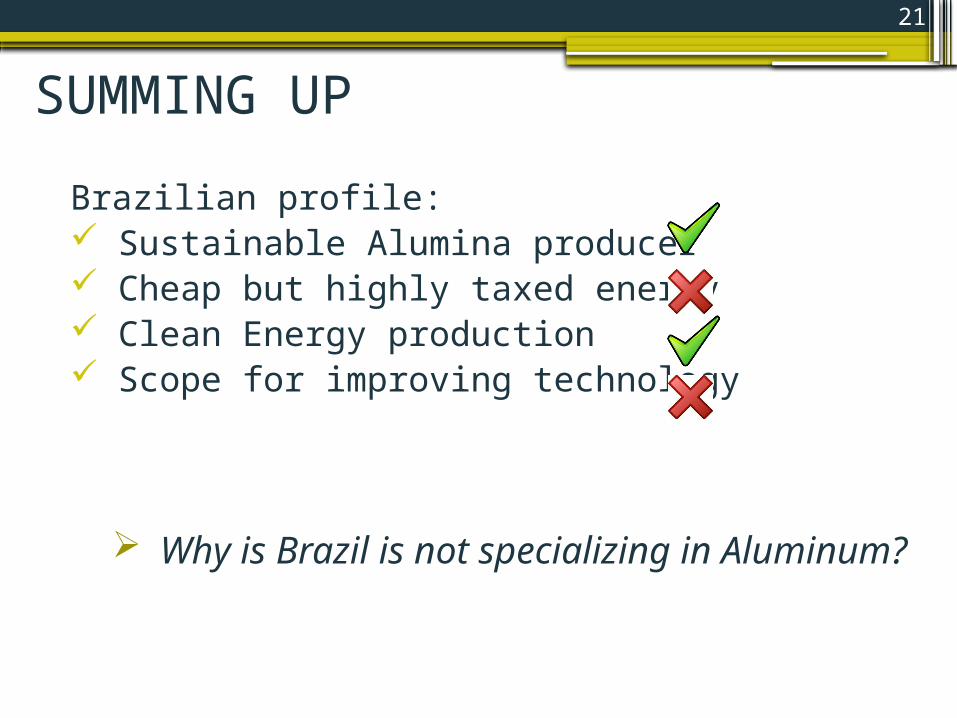
Brazilian profile: Sustainable Alumina producer Cheap but highly taxed energy Clean Energy production Scope for improving technology
Why is Brazil is not specializing in Aluminum?
SUMMING UP

22
IMPEDIMENTS•Market Failure:
▫No internalizing of the pollution externality
•Main Distortions:▫High distortionay tax▫Lack of availability of energy
1. Aluminum production process
2. Aluminum markets: Brazil and the world3. Why should Brazil promote aluminum production?4. Green growth strategy
OUTLINE
24
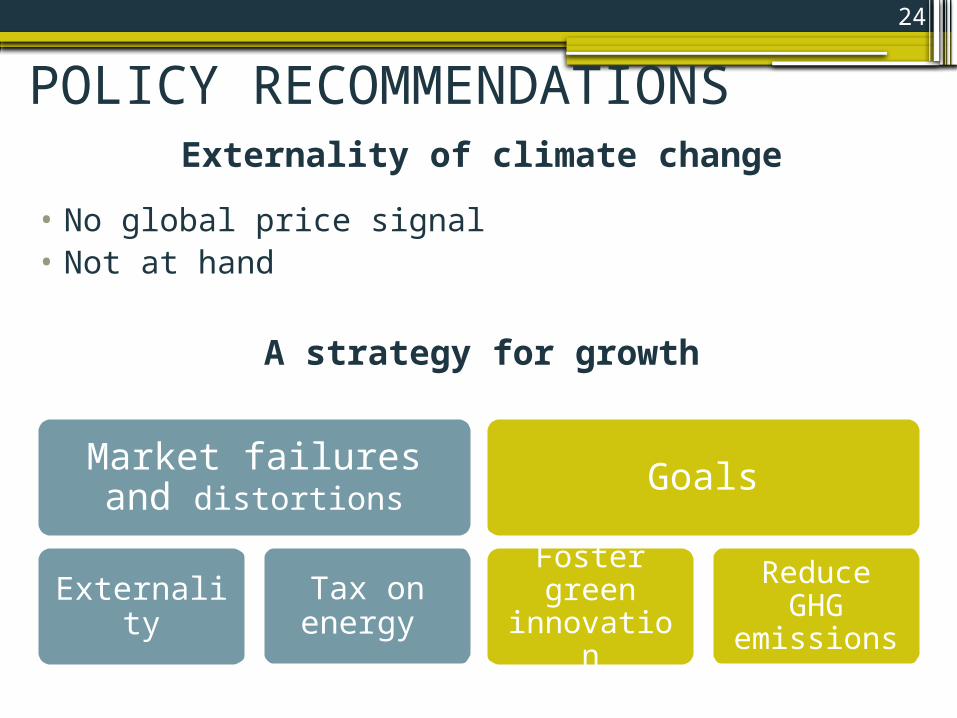
POLICY RECOMMENDATIONSExternality of climate change
• No global price signal• Not at hand
A strategy for growth
Market failures and distortions
Externality Tax on energy
Goals
Foster green
innovation
Reduce GHG
emissions

25
BORDER ADJUSTMENT TAXWhat is: A trade policy measure aimed at offsetting adverse
effects of domestic environmental regulation
• Non discriminatory Allowed by GATT art. XX
Sustain competitiveness of clean aluminum against dirtier imports
CONAMA Resolução
No. 436/2011
New limits on
emission intensity
Compliance costs
Tax on dirtier
imports

26
Concern: Energy production is cheap in Brazil, but it’s highly priced.• First-best: General tax cut on energy consumption Political constraint• Second-Best: Reduce in tax Subsidy per unit of production
1. Subsidies: How do we want them?Conditional
On expansion of capacity
On adoption of cleaner technology
Temporary
Regular control on emission
improvementEx: matching EU
standards
SUBSIDIES AND ENERGY MARKET

27
CLEAN DEVELOPMENT MECHANISM (CDM)What is CDM?- art. 12 of Kyoto Protocol Win-win framework of investing in clean technology in developing countries with funds raised from developed countries:
-Firms in the developed country buy Certified Emission Reduction credits-Firms in the developing country makes a green investment & sells CER
Additionality Condition: • Emission additional to what would otherwise have occurred. •It is satisfied:
▫The biggest direct factor of emission: PFC▫EU case: From 3500 to 1900 KgCO2eq/ton by developing the edge technlogy

28
CLEAN DEVELOPMENT MECHANISM (CDM)CDM in aluminium sector
Concerns:•Complicated procedure•Assymmetry of information•Uncertainty at national and international level
What can the government do to tackle with these concerns?•Using the current CDM body to promote aluminium CDM projects•Contributing in information flow and negotioating•Reducing uncertainties

29
CLEAN DEVELOPMENT MECHANISM (CDM)Small model
Participation condition:
(x1-x2) PCER + B > C• X1: The current emission• X2: Emission after undertaking CDM project• B: Positive externality• C: R&D cost of technology switchingData using european EU case:(x1-x2) PCER = (3634-1941)*(1661+4420)/2*12*15 = 183 M EuroC = (12*150)/2.9 = 620 M Euro 183/620 = 0.295 Covers around 30% of the total R&D cost.
30
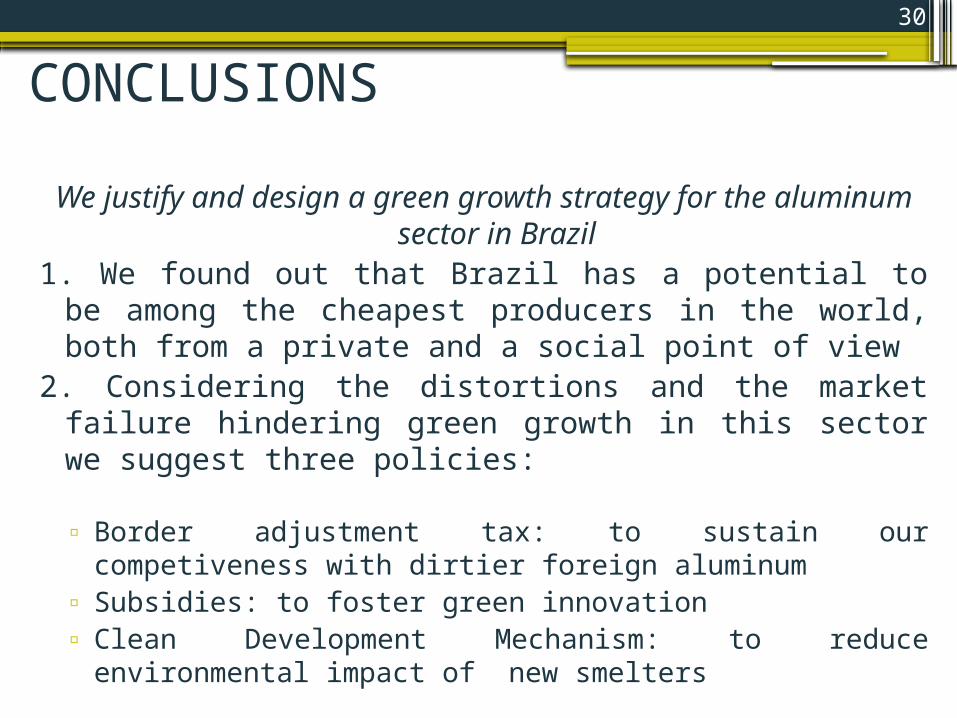
CONCLUSIONSWe justify and design a green growth strategy for the
aluminum sector in Brazil1. We found out that Brazil has a potential to be among
the cheapest producers in the world, both from a private and a social point of view
2. Considering the distortions and the market failure hindering green growth in this sector we suggest three policies:
▫ Border adjustment tax: to sustain our competiveness with dirtier foreign aluminum
▫ Subsidies: to foster green innovation ▫ Clean Development Mechanism: to reduce environmental
impact of new smelters

31
APPENDIX

32
PRIMARY ALUMINUM PRODUCTION COSTS BY REGION (nominal USD/t 2002)

33

BRAZILIAN IMPORTS OF ALUMINUM($US thousands)

TECHNOLOGY MIX BY REGION2004 2030
36
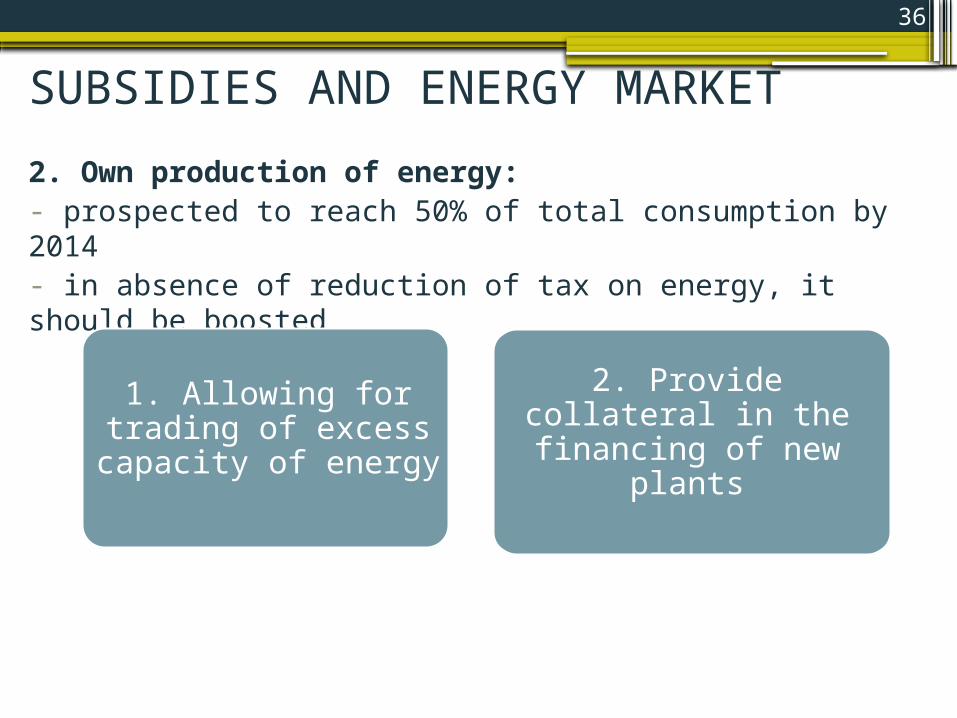
SUBSIDIES AND ENERGY MARKET2. Own production of energy:- prospected to reach 50% of total consumption by 2014- in absence of reduction of tax on energy, it should be boosted
1. Allowing for trading of excess capacity of
energy2. Provide collateral in the
financing of new plants

37
Bonding all polices•More funding
▫Local ▫internation
•Pushing Global agenda•Fits with Brazilian general growth strategy•Non-discriminatory protection•Price?? Short run increase but if
succesfull lower long run