Embed Size (px)
Citation preview

PEOPLE POWER WSDOT ON THE MOVE TO IMPROVE
ACTIVE TRANSPORTATION
Quarterly performance analysis of WSDOT's multimodal systems and programs
Roger Millar, Secretary of Transportation, PE, FASCE, FAICP
Edition 69 March 2018
Green pieces How WSDOT protects Washington's wetlands
Information superhighwayWSDOT helps keep travelers updated on conditions
Keeping it quietInside WSDOT's efforts to reduce roadway noise

2 | GNB Edition 69 | March 2018 Table of Contents
TABLE OF CONTENTS69
102
Results WSDOT 3Results Washington Dashboard 4Statewide Transportation
Policy Goals Dashboard 5Multimodal Asset
Performance Dashboard 6Multimodal Safety
Performance Dashboard 8Moving Ahead for Progress in
the 21st Century (MAP-21) 9
SafetyActive Transportation:
Annual Safety Report1 11
PreservationAsset Management: Safety
Rest Areas Annual Report 16
10 of WSDOT's eligible workforce teleworks at leasttwo days each monthPERCENT
$2.85annual average gasoline price in 2017 marked the first increase in five years
$24.3 MILLION
in economic benefit provided by WSDOT’s Incident Response teams clearing 14,838 incidents during the quarter
$9.8 in operating costs avoided by the trucking industry in 2017 due to WSDOT's electronic screening system
MILLION
traffic noise studies for upcoming transportation projects conducted between April 2017 and March 2018
22 of the total traffic fatalities in Washington in 2017 involved Bicyclists or PedestriansPERCENT
MobilityTravel Information
Annual Report 17 Incident Response
Quarterly Update1 18 WSDOT Ferries
Quarterly Update 20 Rail: Amtrak Cascades
Quarterly Update 22
EnvironmentWetlands Protection
Annual Report 23Noise Quality
Annual Report 26
Economic VitalityCommercial Vehicle Information
Systems & Networks Annual Report 28
Transportation & the Economy Annual Report 29
StewardshipWorkforce Development
Annual Report 31Capital Project Delivery
Programs Quarterly Updates 35 Current Legislative Evaluation & Accountability Program 36
Completed Projects & Contracts 38
Watch List 39 Advertisement Record 40 Schedule & Budget Summaries
& Change Orders 42 Pre-existing Funds 43 Gray Notebook
Information Guide 47Note: 1 Includes statewide transportation
policy goals for safety and mobility.
PERFORMANCE HIGHLIGHTS reported for the quarter ending March 31, 2018
SIX SITESthat included 33 ACRES added to WSDOT’s
WETLAND & STREAMSinventory in 2017
THE NUMBER OF PEOPLE FOLLOWINGTHE “@WSDOT” TWITTER ACCOUNT INCREASED 25.5%
212,574
266,8018
of 151 projects WSDOT Pre-existing Funds projects advertised during the quarter

GNB Edition 69 | March 2018 | 3 Results WSDOT
RESULTS WSDOT69New strategic plan under developmentResults WSDOT—the agency’s strategic plan—is undergoing a bit of a facelift. Results WSDOT for 2014-2017 featured six goals; three agency emphasis areas were added as strategies in 2016. These emphasis areas—Inclusion, Practical Solutions and Workforce Development—have become the new plan's goals. The new plan continues to direct WSDOT’s work with partners and communities. Results WSDOT also continues to focus on how the agency makes investments and delivers projects with limited resources.
Results WSDOT's goal teams are busy developing strategies and work plans, which will define the actions and deliverables needed to achieve the agency's goals. Articles in this issue, indicated by a box with a goal logo, show how these goals are being realized. A strategic plan dashboard is under development; look for it in upcoming issues of the Gray Notebook.
In addition to three goals, Results WSDOT features a vision, mission and values. WSDOT's vision, defined as where the agency wants to go, is "Washington travelers have a safe, sustainable and integrated multimodal transportation system." Results WSDOT's mission is a statement about the agency's core purpose, "We provide safe, reliable and cost-effective transportation options to improve communities and economic vitality for people and businesses."
Results WSDOT features six values, defined as "how we do business" or statements of guiding principles. The values are:
Æ Safety – Promote public and employee safety
Æ Engagement – Include all perspectives, disciplines and backgrounds in our outreach and decision making, employing a diverse workforce that reflects the communities we serve
Æ Innovation – Encourage creativity, continuous improvement and the advancement of technology
Æ Integrity – Be ethical, accountable, responsive and trustworthy
Æ Leadership – Inspire, motivate, develop and support each other
Æ Sustainability – Be resource stewards by supporting economic, environmental and community need
Recent editions of the Gray Notebook have featured articles on Workforce Development and Inclusion efforts at WSDOT. See this issue of the Gray Notebook, pp. 31-34 for the Workforce Development Annual Report, and Gray Notebook 66, pp. 43-47 for the Inclusion Annual Report.
Workforce DevelopmentBe an employer of choice, creating a modern workforce while attracting and retaining quality workers to deliver our legislative, regulatory, and service requirements.
Practical SolutionsAdvance the integration of Practical Solutions into WSDOT’s culture and practices to cost-effectively plan, design, build, operate and maintain the state’s transportation system.
InclusionStrengthen commitment to diversity and engagement in all of WSDOT’s business processes, functions and services to ensure every voice is heard.
Return toTable of
Contents

4 | GNB Edition 69 | March 2018 Results Washington Dashboard
RESULTS WASHINGTONDASHBOARD69
Results Washington, the state’s performance management system, outlines Gov. Jay Inslee’s priorities. This strategic framework sets the state’s vision and mission, as well as the foundational expectation that state agencies will achieve goals collaboratively. Results Washington has five goals: World Class Education; Prosperous Economy; Sustainable Energy and a Clean Environment; Healthy and Safe Communities; and Efficient, Effective and Accountable Government. For more information, visit http://www.results.wa.gov/.
Results Washington Measures by goal1Previous
periodCurrent period
On target2
Current trend
Desired trend
Annual Measure for which WSDOT is the lead agencyGoal 2: Prosperous EconomyControl the percent of National Highway System bridges, state and locally owned, in poor condition from increasing over 10% by 2020 (FY2016 & FY2017)
9.3% 8.6% Yes Control the percent of National Highway System pavement, state and locally owned, in poor condition from increasing over 10% by 2020 (2015 & 2016)
6.7% 7.4% Yes Control the percent of ferry terminal systems (by value) that are past due for replacement from increasing over 6% by 2020 (FY2016 & FY2017)
5.4% 5.2% Yes Control the percent of ferry vessel systems (by value) that are past due for replacement from increasing over 10% by 2020 (FY2016 & FY2017)
10.9% 13.3% No Maintain percentage of transit fleet that exceeds the Federal Transit Administration’s minimum useful life at 25% or below through 2020 (2015 & 2016)
34.6%3 40.2% No
Increase the percentage of Washingtonians using alternative transportation commute methods to 29% by 2020 (2015 & 2016)
27.6% 27.9% No
Ensure travel and freight reliability on strategic corridors does not deteriorate more than 5% through 20204 (2015 & 2016)
5.0%5 5.7% No
Operate strategic corridors at 90% efficiency or higher through 2020 (2015 & 2016) 93.4% 94.0% Yes Reduce the number of pedestrian and bicyclist fatalities on public roadways from 876 in 2012 to zero in 2030 (2016 & 2017)
106 122 No
Annual measures for which WSDOT is not the lead agency, but has an interest include:Goal 2: Prosperous EconomyIncrease state agency and educational institution utilization of state-certified small businesses in public works and other contracting and procurement by 2017 to: Minority-owned businesses, 10%; Women-owned businesses, 6%; Veteran-owned businesses, 5%5 (FY2016)
Minority-owned: 1.65%5
Women-owned: 1.23%5
Veteran-owned: 0.26%5
No N/A
Goal 3: Sustainable Energy and a Clean EnvironmentReduce transportation related greenhouse gas emissions from 44.9 million metric tons/year (projected 2020) to 37.5 million metric tons/year (1990) by 2020 (2014 & 2015) 41.2 44.0 No Reduce the average emissions of greenhouse gases for each vehicle mile traveled in Washington by 25% from 1.15 pounds in 2010 to 0.85 pounds by 2020 (2014 & 2015) 1.13 1.13 No Increase the average miles traveled per gallon of fuel for Washington’s overall passenger and light duty truck fleet (private and public) from 19.2 mpg in 2010 to 23 mpg in 2020 (2014 & 2015) 20.6 21.0 No Increase the number of plug-in electric vehicles registered in Washington from approximately 8,000 in 2013 to 50,000 by 2020 (2016 & 2017) 17,941 24,624 No Increase miles of stream habitat opened from 55 miles per year in 2017 to 80 by 20205,7 (2017) N/A 55 N/A N/A Increase number of fish passage barriers corrected per year from 60 in 2017 to 90 by 20205,7 (2017) N/A 60 N/A N/A Goal 4: Healthy and Safe CommunitiesDecrease number of traffic-related fatalities on all roads from 454 in 2011 to zero in 2030(2015 & 2016) 551 537 No
Data sources: WSDOT Office of Strategic Assessment and Performance Analysis and Results Washington’s Open Performance Program.Notes: 1 In addition to the measures listed in the table, WSDOT contributes performance information that is combined and reported with data from all state agencies in Goal 5: Efficient, Effective and Accountable Government. 2 A measure is “on target” if it is currently meeting its goal or if it is on a path to meet its goal by the target date. Some measures may be trending in the desired direction but not on target. 3 Value differs from previous editions. To better align with the Federal Transit Administration, WSDOT has updated its method for calculating useful life; it is now based on age or mileage instead of only age. 4 This measure is the percentage difference between the value of the reliability index in one period and the average of the value of the reliability index in the three preceding periods. 5 Measure applies to work completed by multiple state agencies. 6 This value has been updated since GNB 68. 7 This measure has been updated in Gray Notebook 69. Reported figures are baseline measurements.
Return toTable of
Contents

GNB Edition 69 | March 2018 | 5 Statewide Transportation Policy Goals Dashboard
STATEWIDE TRANSPORTATION POLICY GOALS DASHBOARD69
Statewide policy goal/ WSDOT performance measure
Previous period
Current period Goal
Goal met
Five-year trend (unless noted)
Desired trend
SafetyRate of traffic fatalities per 100 million vehicle miles traveled statewide(Annual measure: calendar years 2015 & 2016)
0.92 0.88 <1.001
0.75
0.93
Rate of recordable incidents for every 100 full-time WSDOT workers (Annual measure: calendar years 2016 & 2017)
4.6 4.7 <5.0 PreservationPercentage of state highway pavement in fair or better condition by vehicle miles traveled(Annual measure: calendar years 2015 & 2016)
93.0% 91.7% > 90%91.50
93.35
Percentage of state bridges in fair or better condition by bridge deck area(Annual measure: fiscal years 2016 & 2017)
91.2% 91.8% > 90%91.1
Mobility2 (congestion relief)
Highways: Vehicle Miles Traveled (VMT) on state highways(Annual measure: calendar years 2015 & 2016)
33.3billions
34.2billions N/A 31
33 Highways: Average incident clearance times for all Incident Response program responses(Calendar quarterly measure: Q1 2017 & Q1 2018)
12.1 minutes
13.1 minutes N/A
11.0
12.5
14.0
Ferries: Percentage of trips departing on time³(Fiscal quarterly measure: year to year Q3 FY2017 & Q3 FY2018) 96.2% 95.7% > 95%
93
96
99
Rail: Amtrak Cascades on-time performance4(Annual measure: fiscal years 2016 & 2017) 74.8% 56.3% > 80%
55.0
65.8
76.6
EnvironmentNumber of WSDOT stormwater management facilities constructed(Annual measure: fiscal years 2016 & 2017)
151 129 N/A129
156
183
210
Not applicable
Cumulative number of WSDOT fish passage improvement projects constructed(Annual measure: calendar years 2015 & 2016)
301 319 N/A268.50
294.25
320.00
StewardshipCumulative number of Nickel and TPA projects completed⁵ and percentage on time⁶(Calendar quarterly measure: Q4 2017 & Q1 2018, trendline for percentage on time
380/87%
380/87%
> 90% on time
86
88
Cumulative number of Nickel and TPA projects completed⁵ and percentage on budget⁶(Calendar quarterly measure: Q4 2017 & Q1 2018, trendline for percentage on budget)
380/91%
380/91%
> 90% on budget
90
92
Variance of total project costs⁵ compared to budget expectations⁶(Calendar quarterly measure: Q4 2017 & Q1 2018)
Under budget by
1.5%
Under budget by 1.5%
On or under budget -2.3
-1.4
Not applicable
Data source: WSDOT Office of Strategic Assessment and Performance Analysis.Notes: (*) = goal has not been set. Dash (—) = goal was not met in the reporting period. For the Economic Vitality Policy Goal, see p. 4 for Results Washington Goal 2: Prosperous Economy measures. 1 The Statewide Transportation Policy Goal for this performance measure is different than the federal MAP-21 goal for the same measure. 2 Mobility does not yet include goals for people walking/biking for transportation. 3 WSDOT Ferries’ on-time departures include any trip recorded by automated tracking as leaving the terminal within 10 minutes of scheduled time. 4 Amtrak Cascades’ on-time performance includes any trip arriving within 10 or 15 minutes, depending on the route, of scheduled arrival time. 5 Construction projects only. 6 Budget and schedule expectations are defined in the last approved State Transportation Budget. See p. 35 for more information.
4.300000
4.773334
5.246668
(Five-quarter trend)
(Five-quarter trend)
(Five-quarter trend)
(Five-quarter trend)
(Five-quarter trend)
Return toTable of
Contents

6 | GNB Edition 69 | March 2018 Multimodal Asset Performance Dashboard
MULTIMODAL ASSETPERFORMANCE DASHBOARD69
WSDOT performance measurePrevious
periodCurrent period Goal
Goal met
Five-year trend (unless noted)
Desired trend
Highway Assets BridgesPercentage of WSDOT-owned bridges in fair or better condition by bridge deck area(Fiscal years 2016 & 2017)
91.2% 91.8% ≥90%91
Number of WSDOT-owned bridgesload restricted or load posted(Fiscal years 2016 & 2017)
126 119 N/A119
141
Current WSDOT-owned steel bridge painting backlog in millions of dollars(Fiscal years 2016 & 2017)
$414.5 $460.8 N/A Projected 10-year WSDOT owned steel bridgepainting backlog in millions of dollars(Fiscal years 2016-2025 & 2017-2026)
$706.6 $740.8 N/A565
751
Current WSDOT-owned bridge deck area due or past due for replacement in millions of dollars(Fiscal years 2016 & 2017)
$115.6 $99.2 N/A70
116
Projected 10-year WSDOT owned bridge deck area due or past due for replacement in millions of dollars(Fiscal years 2016-2026 & 2017-2027)
$726.5 $831.1 N/A71
832
Percentage of NHS bridge deck area located on structurally deficient bridges (locally- and WSDOT -owned)(Fiscal years 2016 & 2017)
9.3% 8.6% ≤10%0.078
0.100
PavementPercentage of WSDOT-owned pavementin fair or better condition¹(Calendar years 2015 & 2016)
93.0% 91.7% >90%91.50
93.35
Highway Pavement Asset Sustainability Ratio;long term service replenishment rate²(Calendar years 2015 & 2016)
0.57 0.68 >0.900.52
0.77
Highway Pavement Deferred Preservation Liability (backlog) in millions of dollars(Calendar years 2015 & 2016)
$403 $330 $0325.000000
403.999952
Highway Pavement Remaining Service Life aspercentage of total useful life(Calendar years 2015 & 2016)
47.1% 48.6% 45%-55% 0.46 Percentage of lane miles of interstate pavement in poor condition(Calendar years 2015 & 2016)
4.0% 3.2% ≤5% Safety Rest AreasSafety rest area score through theMaintenance Accountability Process³(Calendar years 2016 & 2017)
B B B2.000000
3.999999
Total visitors at safety rest areasin millions of visitors(Calendar years 2016 & 2017)
24.1⁴ 24.4 N/A20.5
N/A
Highway Maintenance
Percentage of funded maintenance condition targets achieved⁵(Calendar years 2016 & 2017)
93% 77% 100%0.760
0.935
345
482
2.9
(Three-year trend)
(Three-year trend)
(Three-year trend)
Return toTable of
Contents

Multimodal Asset Performance Dashboard GNB Edition 69 | March 2018 | 7
WSDOT performance measure
Previous period
Current period Goal
Goal met
Five-year trend (unless noted)
Desired trend
Ferry Assets Vessels and Terminals Ferry vessel systems past due for replacement by value⁶(Fiscal years 2016 & 2017)
10.9% 13.3% ≤10%0.070
0.133
Ferry terminal systems past due for replacement⁷(Fiscal years 2016 & 2017) 5.3% 5.2% ≤6%
0.032
Ferry vessel preservation needs as percentage backlog of total vessel value(Fiscal years 2016 & 2017)
30.6% 23.6% N/A0.24
0.31
Ferry terminal preservation needs as percentage backlog of total terminal assets(Calendar years 2016 & 2017)
5.3% 5.2% N/A0.032
0.060
Multimodal Assets8
Aviation Airport combined (federal, state, local) grant funding in millions of dollars⁹(Fiscal years 2016 & 2017)
$59.7 $88.5 N/A9.2
Percentage of airport Master Record inspectionsconducted by WSDOT⁹(Calendar years 2015 & 2016)
100% 100% 100%0.49
1.01
Other Assets FacilitiesFacilities Preventive Maintenance Plan completion rate¹⁰(Biennial measure: 2015-2017 & 2017-2019)
88% 82% 71%0.73
0.98
Percentage of primary buildings¹⁰in fair or better condition(Biennial measure: 2015-2017 & 2017-2019)
59% 56% N/A0.55
0.62
10-year forecast of unmet needs (backlog)in millions of dollars¹¹(Biennial measure: 2015-2017 & 2017-2019)
$475.5 $474.7 N/A474.7
475.5
Data source: WSDOT Office of Strategic Assessment and Performance Analysis.Notes: N/A = not available or not applicable. Asterisk (*)= goal has not been set. Dash (—) = goal was not met in the reporting period. 1 Data includes only conditions for asphalt and concrete pavement; budget constraints prohibited data collection for chip seal pavement. Condition data is weighted by vehicle miles traveled. 2 Years of service life replenished through rehabilitation divided by service life consumed on an annual basis (long-term measure). 3 Safety rest areas are assigned a score according to the Maintenance Accountability Process on a level of service (LOS) scale, A through F. 4 This number has been updated and finalized to 24.1 from 24.0 as reported in previous editions. 5 Maintenance activities are assigned asset condition targets based upon an A through F level of service scale and funding levels; actual conditions are compared to funded asset condition levels on the LOS scale. See GNB 32, p. 19 for additional information on LOS standards. 6 WSDOT Ferries Division uses a risk assessment matrix, which combines the probability of system component failure with information on the failure’s impact on ferry operations to gauge when ferry systems are past due for replacement; systems in condition rating 3 are past due for replacement. 7 WSDOT Ferries Division uses an economic-based model for assessing terminal needs; the model has been updated each subsequent year to improve accuracy and is not directly comparable to previous data. 8 Multimodal Assets tracking does not yet include active transportation assets. 9 Asset condition data is not currently available for the WSDOT aviation programs; grant funding and inspections for the Airport Master Record are being used as stand-in measurements until data is available. The airport grant funding measurement applies to all public-use airports. The Airport Master Record inspection measurement only applies to public-use non-primary commercial airports. 10 The Preventive Maintenance Plan is developed biennially and ranks maintenance activities based upon a criticality assessment scale. Funding is insufficient to complete all activities; completion rate is measured only for funded work categories. 11 Measured as backlog of unmet needs over the next 10 years as identified by the capital facilities strategic plan.
(Three-year trend)
(Three-year trend)
(Three-year trend)
(Three-year trend)
(Two-biennium trend)
(Two-biennium trend)
(Two-biennium trend)
(Three-year trend)

8 | GNB Edition 69 | March 2018 Multimodal Safety Performance Dashboard
MULTIMODAL SAFETY PERFORMANCE DASHBOARD69
Statewide policy goal/ WSDOT performance measure
Previous period
Current period Goal
Goal met
Five-year trend (unless noted)
Desired trend
HighwayTotal number of fatalities on Washington state public roads¹(Calendar years 2015 & 2016)
551 537 <416²435.5
551.5
Total number of serious injuries onWashington state public roads¹(Calendar years 2015 & 2016)
2,100 2,209 <1,788²1910
2210
Number of fatalities per 100 million vehicle miles traveled on Washington state public roads¹(Calendar years 2015 & 2016)
.92 .88 <.709²0.75
0.93
Serious injuries per 100 million vehicle miles traveled on Washington state public roads¹(Calendar years 2015 & 2016)
3.52 3.63 <3.058²3.33
3.89
Pedestrians & BicyclistsNumber of combined pedestrian and bicyclist fatalities and serious injuries³(Calendar years 2016 & 2017)
591 575 <431²403
594
FerriesPassenger injuries per million passenger miles traveled⁴(Fiscal years 2016 & 2017)
0.42 0.70 <1.00.30
0.95
OSHA recordable crew injuries per 10,000revenue service hours⁴,⁵(Fiscal years 2016 & 2017)
5.6 3.4 <7.61.5
7.6
RailTotal number of train-related fatalities in Washington state⁶(Calendar years 2015 & 2016)
27⁷ 13 N/A4.0
27.2
Aviation
General aviation fatalities in Washington state⁸(Calendar years 2016 & 2017) 7 5⁹ N/A
1.0
14.5
Public TransitFatalities involving Washingtonstate public transportation(Calendar years 2015 & 2016)
3 8 N/A3
Injuries involving Washingtonstate public transportation(Calendar years 2015 & 2016)
295 321 N/A233
330
Data source: WSDOT Office of Strategic Assessment and Performance Analysis.Notes: N/A = not available or not applicable. Asterisk (*) = goal has not been set. Dash (—) = goal was not met or is not on track in the reporting period. 1 Fatality and serious injury data for the current period was finalized in January 2017. Pedestrians include people walking or using assistive mobility devices. 2 These figures are the 2018 statewide targets for federal MAP-21 safety performance reporting and are based on the goal of reaching zero fatalities in 2030. 3 Pedestrian and bicyclist fatality and serious injury data for the current period was finalized in May 2018. Pedestrians include people walking or using assistive mobility devices. 4 Ferries safety records in previous GNBs had been updated quarterly but have now been changed to reflect annual periods based on fiscal years. 5 OSHA = Occupational Safety and Health Administration. 6 Count includes all fatalities involving rail (passenger rail and freight rail) in Washington State. 7 There was a large increase in trespassing incidents on tracks in Washington state. As a result, more than 80% (22 of 27) of fatalities in 2015 were due to trespassing. 8 General aviation includes all civil aviation operations other than scheduled air services. Data for general aviation fatalities has been updated since GNB 63. 9 The fatality data for the current period was confirmed and finalized for calendar year 2017.
(Three-year trend)
(Three-year trend)
Return toTable of
Contents

GNB Edition 69 | March 2018 | 9 MAP-21
MOVING AHEAD FOR PROGRESSIN THE 21ST CEN TURY (MAP-21)69
WSDOT, Metropolitan Planning Organizations set state's MAP-21 performance targetsThis quarter, WSDOT established its federally-required Moving Ahead for Progress in the 21st Century (MAP-21) targets for bridges and pavement (also referred to as PM2), and highway system performance, freight, and Congestion Mitigation and Air Quality (also referred to as PM3). WSDOT established state targets through extensive collaboration with Metropolitan Planning Organizations (MPOs) on May 20, 2018. These targets will guide WSDOT and MPOs toward making significant progress to meet the established targets in the areas of PM2 and PM3 performance measures.
WSDOT will formally submit its MAP-21 targets for PM2 and PM3 to the Federal Highway Administration (FHWA) in the Baseline Performance Report, which is due October 1, 2018. This will begin a four-year reporting cycle for these two performance measures, which will include:
Æ Mid-Performance Period Progress Report, due by October 1, 2020
Æ Full-Performance Period Progress Report, due by October 1, 2022
WSDOT and MPOs will first report on their progress toward achieving its PM2 and PM3 targets in the 2020 report, which includes updates on two-year condition/performance and investment strategy discussions as well as target adjustment discussions. WSDOT and MPOs can only adjust their four-year targets at this time, but must explain the basis for the changes and
MAP-21 performance measures by program area2018target Penalty
Highway Safety Improvement Program (PM1) 23 CFR Part 490 ID No. 2125-AF49Number of traffic fatalities on all public roads1 415.52 Yes
Rate of traffic fatalities per 100 million vehicle miles traveled (VMT) on all public roads1 0.709 Yes
Number of serious traffic injuries on all public roads1 1,788.0 Yes
Rate of serious traffic injuries per 100 million VMT on all public roads1 3.058 Yes
Number of non-motorist traffic fatalities plus serious injuries 431.52 Yes
Rate of per capita traffic fatalities for drivers and pedestrians 65 or older Show yearly progress No
Rate of fatalities on high-risk rural roads1 Show yearly progress Yes
Highway-railway crossing fatalities3 Show yearly progress No
Notes: The PM1 targets were submitted on August 31, 2017, using 2012-2016 for current baseline data. 1 Performance metric includes all individuals (for example, pedestrians and bicyclists) who died or were seriously injured as a result of a motor vehicle crash in Washington. 2 Number has been rounded up. 3 Includes bicyclists and pedestrians.
MAP-21 safety reporting on an annual cycleTargets for the Highway Safety rules (included in PM1) are on an annual reporting cycle, which differs from the two-year and four-year reporting cycles for PM2 and PM3. The next annual reporting cycle for setting safety targets for 2019 requires WSDOT to submit targets to FHWA by August 31, 2018.
Data coming
Return toTable of
Contents

MAP-2110 | GNB Edition 69 | March 2018
how the adjusted target supports expectations documented in longer range plans.
FHWA will use the full report in 2022 to determine whether WSDOT has made significant progress toward its PM2 and PM3 targets. WSDOT may face penalties as indicated in the tables on p. 9 and below if it does not show necessary improvements. While not showing significant progress toward targets triggers a penalty—and requires
an explanation of what WSDOT will do to make future progress or require additional reporting—specific measures in PM1 and PM2 also have financial penalties if targets are not
met. These penalties require the redistribution of federal monies to help ensure significant progress will be made toward specific targets in the future.
MAP-21 performance measures by program areaCurrent
data2-year
target1,24-year
target1,2 PenaltyPavement and Bridges (PM2) 23 CFR Part 490 ID No. 2125-AF53 PavementPercent of Interstate pavement on the NHS in good condition 32.5%3 N/A 30% NoPercent of Interstate pavement on the NHS in poor condition 3.6%3 N/A 4%4 YesPercent of non-Interstate pavement on the NHS in good condition 18%3 45% 18% NoPercent of non-Interstate pavement on the NHS in poor condition 5%3 21% 5% No
BridgesPercent of NHS bridges classified in good condition (weighted by deck area) 32.8% 30% 30% NoPercent of NHS bridges classified in poor condition (weighted by deck area) 7.8% 10% 10%4 Yes
Highway System Performance, Freight, and Congestion Mitigation & Air Quality (PM3) 23 CFR Part 490 ID No. 2125-AF54 Highway System Performance (Congestion)Percent of person-miles traveled on the Interstate System that are reliable 73% 70% 68% No
Percent of person-miles traveled on the Non-Interstate NHS System that are reliable 77% N/A 61% No
National Freight Movement ProgramTruck Travel Time Reliability (TTTR) Index 1.63 1.70 1.75 No Congestion Mitigation & Air Quality Program
Non-Single Occupancy Vehicle (SOV) travel in Seattle urbanized area (NHS) 32% 32.8% 33.2% No
Peak hours of Excessive Delay per capita in Seattle urbanized area (NHS) 23 N/A 28 No
All Pollutants (kg/day)2 1,658.640 366.285 658.300 No
Carbon Monoxide (CO) (kg/day)2 313.160 309.000 309.060 No
Particulate Matter less than 10 microns (PM10) (kg/day)2 435.690 0.305 224.000 No
Particulate Matter less than 2.5 microns (PM2.5) (kg/day)2 36.820 2.100 8.700 No
Nitrogen Oxides (NOX) (kg/day)2 872.970 54.880 116.540 NoNotes: Federal rule allows state and MPOs to adjust four-year targets during the mid-performance progress report. 1 Two-year and four-year reports for PM2 and PM3 are due October 1, 2020, and October 1, 2022. 2 Base emissions are for the four-year period 2013-2016 as reported in the CMAQ Public Access System. 3 PM2 "Current data" is relative to four-year pavement targets only. 4 The National Highway Performance Program (NHPP) targets require the percent of Interstate pavement on the NHS in poor condition not exceed 5% and the percent of NHS bridges classified in poor condition (weighted by deck area) not exceed 10%.
MAP-21 folios helping MPOs, stakeholdersTo help MPOs and other stakeholders navigate the MAP-21 rules, WSDOT has developed a number of informational folios covering various rule topics. The folios serve to ensure that WSDOT and its partners are on the same page as MAP-21 work progresses. For links to WSDOT-specific MAP-21 folios, visit www.wsdot.wa.gov/Accountability/MAP-21.

GNB Edition 69 | March 2018 | 11 Safety – Active Transportation
ACTIVE TRANSPORTATION:ANNUAL SAFETY REPORT69
Pedestrian fatalities increase while bicyclist fatalities decrease in 2017People walking or biking accounted for 22% of statewide traffic fatalities in 2017, an increase from 20% in 2016. The total number of pedestrian and bicyclist fatalities on Washington state public roads was 122 in 2017, up from 105 in 2016.
The increase in pedestrian and bicyclist fatalities includes a 24% increase in pedestrian fatalities, which went from 88 in 2016 to 109 in 2017. Bicyclist fatalities decreased by 24% from 17 to 13 during the same period. The number of traffic fatalities involving people walking or biking has steadily increased from 60 in 2013 to 122 in 2017—an average of 94 fatalities per year over this five-year period.
The number of serious injuries involving pedestrians and bicyclists decreased 7% from 496 in 2016 to 461 in 2017. This includes a 0.6% decrease in serious injuries of pedestrians, from 361 to 359 during the same period. Serious injuries of bicyclists decreased by 24% from 135 in 2016 to 102 in 2017. The number of serious injuries to people walking or biking has increased from 351 in 2013 to 461 in 2017—an average of 428 serious injuries per year over this five-year period.
2013 2014 2015 2016 20171
Five-year trendReduction goal²
Pedestrian fatalities 50 77 86 88 109
Bicyclist fatalities 10 7 14 17 13
Total pedestrian and bicyclist fatalities 60 84 100 105 122
Total statewide trafficfatalities3 = 100% 436 462 551 536 565
Statewide percentage of pedestrian and bicyclist traffic fatalities
14% 18% 18% 20% 22%
Pedestrian and bicyclist fatalities increase to 122 in 2017,making up 22% of all traffic fatalities in Washington2013 through 2017; Number of fatalities and percentage of total traffic fatalities
Data source: WSDOT Transportation Data, GIS & Modeling Office.Notes: Some fatality numbers are changed from past GNBs due to updates within the FARS data source. 1 2017 data is preliminary. 2 The reduction goal for bicyclist and pedestrian fatalities is 5% annually. 3 Total statewide fatalities includes all modes of travel.
Notable results Æ Pedestrian and bicyclist fatalities
accounted for 22% of the total traffic fatalities in Washington in 2017, up from 20% in 2016
Æ Pedestrian and Bicyclist Program funded projects have led to a 55% decrease in traffic crashes involving bicyclists or pedestrians at project locations
Æ From 2013 to 2017, 73% of pedestrian and bicyclist fatalities in Washington occurred on roads with posted speed limits of 30 mph or higher
Æ Pedestrian and bicyclist fatalities increased from 105 in 2016 to 122 in 2017
Active transportation in the Gray NotebookThe Pedestrian and Bicyclist Safety Annual Report is now the Active Transportation Annual Safety Report. It will continue to include information on crashes and the potential for crashes involving people using active transportation modes (any human-powered mode of transport, most commonly bicycling and walking) in Washington.
WSDOT will begin reporting on active transportation mobility beginning in Gray Notebook 71.
Return toTable of
Contents

Safety – Active Transportation12 | GNB Edition 69 | March 2018
Number of pedestrian, bicyclist traffic crashes differs by locationFrom 2013 to 2017, 62% of fatal and serious injuries involving people walking or bicycling in Washington occurred on city streets, 26% were on state routes and 11% were on county roads. Of those occurring on state routes, 83% were in urban or urbanizing areas. While main street highways (sections of state routes that also serve as main streets for the local populations) represent about 10% of total lane miles on the state system, 44% of all pedestrian and bicyclist fatalities that occurred on the state system were on these roadways. Urban areas include higher volumes of road users of all types, especially active transportation users, increasing volume exposure (see sidebar to left).
Eighty-five percent of active transportation crashes on the state system occurred on roads with a posted speed of 30 mph or greater, and 76% were on routes classified as principal or minor arterials. Arterials frequently have posted speeds over 30 mph and also may present other challenges to bicyclists and pedestrians such as multiple lanes of traffic and longer distances between marked or traffic-controlled (e.g. stop sign, traffic signal, or pedestrian beacon) crossing locations.
Representation of people under age 30 in active transportation fatalities and serious injuries varies
From 2013 to 2017, people ages 19 and under represented 25% of the total population, but accounted for 19% of the pedestrian and bicyclist fatalities and serious injuries.
Estimating crash rates for bicyclists and pedestriansCrash rates for motorized vehicles are reported on the basis of vehicle miles traveled to account for vehicle volume exposure. The more miles a driver travels, the more exposure they have to a potential crash. Similarly, an increase in traffic volume on a particular section of road tends to increase the number of crashes on that road section (except at very high volumes, when the number of crashes no longer increases with increased volume).
It is more difficult to estimate the total miles walked and biked because sufficient data about bicyclist and pedestrian traffic volumes have not yet been collected. For crashes involving pedestrians and bicyclists, rates are often estimated using population.
WSDOT collects bicycle and pedestrian traffic data through its Bicycle and Pedestrian Count Program. These data will allow WSDOT to estimate bicycle miles traveled and pedestrian miles traveled to quantify volume exposure for people walking and biking. To read more about the Bicycle and Pedestrian Count Program, see Gray Notebook 65, p. 13.
In contrast, people in their 20s accounted for 18% of the pedestrian and bicyclist fatalities and serious injuries despite accounting for 14% of the population.
People of color and the poor over-represented in active transportation fatalities and serious injuries
From 2013 to 2017, about 59% of fatal and serious injury crashes in Washington occurred in geographic areas with a rate of poverty higher than the state average, despite these areas only accounting for 43% of the population. People living in poverty include an over-representation of people of color, the elderly, and people with disabilities.
From 2013 to 2017, American Indian or Alaska Native people represented 2% of the total population yet accounted for 6% of active transportation traffic fatalities in Washington. In contrast, Caucasians represent 81% of the population and 74% of pedestrian- or bicyclist-related traffic fatalities.
WSDOT using Target Zero to help reduce fatal and serious injury crashesWSDOT uses Washington state's Strategic Highway Safety Plan, Target Zero, to define emphasis areas for safety programs and to identify strategies to help reach the goal of eliminating traffic fatalities and serious injuries in the state by 2030. Pedestrians and bicyclists are identified in Target Zero as vulnerable road users and several contributing factors for pedestrian and bicyclist crashes are outlined along with strategies to reduce the frequency and severity of crashes involving these road users.

Safety – Active Transportation GNB Edition 69 | March 2018 | 13
Vehicle speed is a common contributing factor in pedestrian and bicyclist fatalities and serious injuries. From 2013 to 2017, the majority of fatal and serious injury crashes statewide involving pedestrians (74%) and bicyclists (69%) occurred on roads with a posted speed of 30 mph or greater.
In the fatality and serious injury crashes involving bicyclists from 2013 to 2017, 51% of bicyclists were using a roadway, 12% were using a shoulder and 15% were using a designated bike route. In the same time period, 62% of fatal and serious injury crashes involving pedestrians occurred when the pedestrian was crossing the road. Sixty-six percent of bicyclist and pedestrian fatalities and serious injuries from 2013 to 2017 occurred where no traffic control was present.
These factors show the benefits of investing in a more connected network for active transportation users. WSDOT provides funding for active transportation facility projects (see p. 14) that fill gaps in the active transportation network by providing separated facilities and street crossings that reduce motorist conflicts with active transportation users.
From 2013 to 2017, drug or alcohol impairment of pedestrians (48%) and bicyclists (43%) was a common contributing factor for fatal crashes. Fatal crashes involving pedestrians and bicyclists also often involved motorist impairment (16%) or distraction (34%). While WSDOT does not typically address the behavioral aspects of impaired and distracted driving, the agency strives to design a transportation system
that reduces the likelihood of fatality when mistakes occur. Additionally, WSDOT continues to support enforcement and education efforts to reduce impaired and distracted driving.
WSDOT updates design manual in 2017 to include greater emphasis on land use context
WSDOT continues to update the WSDOT Design Manual to allow for greater flexibility in prioritizing multimodal options, including facilities for active transportation users. The 2017 updates include additional guidance on choosing road vehicle design speed and prioritizing transportation modes based on land use context and choosing intersection control based on the mobility and safety performance of all transportation modes.
Some design practices that WSDOT is implementing to highlight active transportation include:
Æ Considering land use context, the presence of intermodal connections, and locations of businesses, schools, medical facilities, restaurants and other destination types that can be reached by walking or biking;
Æ Designing roads that encourage drivers to drive at the desired speed by using narrow travel lanes, lane shifts, vertical traffic calming, and visual cues; and
Æ Considering roundabouts, which shorten crossing distances for pedestrians and cause motorists to slow down and proceed with caution through intersections, for all intersection designs on the state system.
Reduce the number of pedestrian and bicyclist fatalities on public roadways from 87 in 2012 to zero by 2030.
Status: Off target (red)
Number of pedestrian and bicyclist fatalities in 2017Pedestrian fatalities 109Bicyclist fatalities 13Total 122
Strategies:
1. Practical Solutions - Implement multimodal planning and design that considers transportation and land use interactions and engages local partners and community members.
2. Education - Provide WSDOT staff with multimodal, Practical Solutions, and Safe Transportation for Every Pedestrian training. Work with all partners and citizens to raise awareness about driver, bicyclist and pedestrian behavior and human factors.
3. Research - Use results from available data and expand research to improve the understanding of bicyclist and pedestrian crash patterns and increase the use of new countermeasures designed to reduce pedestrian and bicyclist fatalities and injuries.
Leading Indicator
Safety – Active Transportation14 | GNB Edition 69 | March 2018
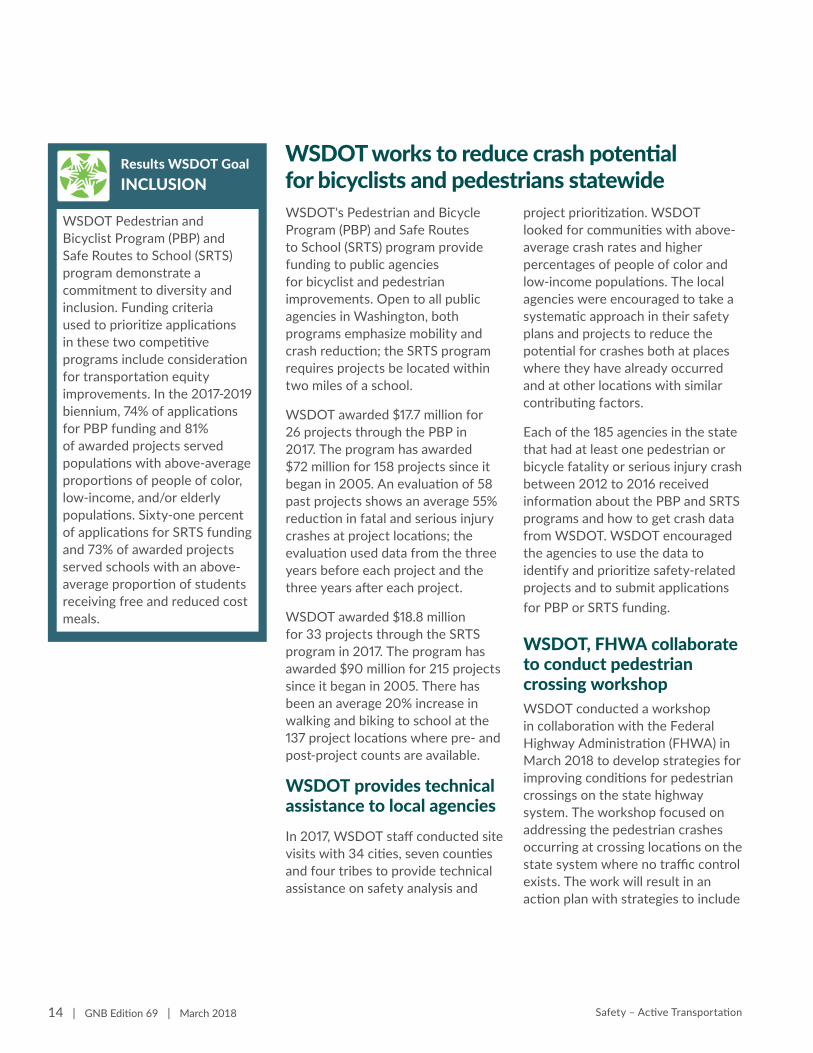
WSDOT's Pedestrian and Bicycle Program (PBP) and Safe Routes to School (SRTS) program provide funding to public agencies for bicyclist and pedestrian improvements. Open to all public agencies in Washington, both programs emphasize mobility and crash reduction; the SRTS program requires projects be located within two miles of a school.
WSDOT awarded $17.7 million for 26 projects through the PBP in 2017. The program has awarded $72 million for 158 projects since it began in 2005. An evaluation of 58 past projects shows an average 55% reduction in fatal and serious injury crashes at project locations; the evaluation used data from the three years before each project and the three years after each project.
WSDOT awarded $18.8 million for 33 projects through the SRTS program in 2017. The program has awarded $90 million for 215 projects since it began in 2005. There has been an average 20% increase in walking and biking to school at the 137 project locations where pre- and post-project counts are available.
WSDOT provides technical assistance to local agenciesIn 2017, WSDOT staff conducted site visits with 34 cities, seven counties and four tribes to provide technical assistance on safety analysis and
project prioritization. WSDOT looked for communities with above-average crash rates and higher percentages of people of color and low-income populations. The local agencies were encouraged to take a systematic approach in their safety plans and projects to reduce the potential for crashes both at places where they have already occurred and at other locations with similar contributing factors.
Each of the 185 agencies in the state that had at least one pedestrian or bicycle fatality or serious injury crash between 2012 to 2016 received information about the PBP and SRTS programs and how to get crash data from WSDOT. WSDOT encouraged the agencies to use the data to identify and prioritize safety-related projects and to submit applications for PBP or SRTS funding.
WSDOT, FHWA collaborate to conduct pedestrian crossing workshopWSDOT conducted a workshop in collaboration with the Federal Highway Administration (FHWA) in March 2018 to develop strategies for improving conditions for pedestrian crossings on the state highway system. The workshop focused on addressing the pedestrian crashes occurring at crossing locations on the state system where no traffic control exists. The work will result in an action plan with strategies to include
Results WSDOT GoalINCLUSION
WSDOT Pedestrian and Bicyclist Program (PBP) and Safe Routes to School (SRTS) program demonstrate a commitment to diversity and inclusion. Funding criteria used to prioritize applications in these two competitive programs include consideration for transportation equity improvements. In the 2017-2019 biennium, 74% of applications for PBP funding and 81% of awarded projects served populations with above-average proportions of people of color, low-income, and/or elderly populations. Sixty-one percent of applications for SRTS funding and 73% of awarded projects served schools with an above-average proportion of students receiving free and reduced cost meals.
WSDOT works to reduce crash potential for bicyclists and pedestrians statewide

Safety – Active Transportation GNB Edition 69 | March 2018 | 15
WSDOT opens landmark shared use trail: In December 2017, WSDOT opened a shared use trail across the new SR 520 floating bridge. This bridge is the world’s longest floating bridge, making the SR 520 Trail the world’s longest floating walk and bike path. Building an interconnected network of the right bicycle and pedestrian facilities (in this case a separated trail versus a shoulder) is key to providing a system that safely serves all ages and abilities of people who walk and bike.
in the State Active Transportation Plan and other WSDOT guidelines and policies. Strategies that are being considered include:
Æ Consolidating, reviewing and updating guidelines for installing marked crosswalks; and
Æ Completing a detailed inventory of marked crosswalks at uncontrolled locations on state routes and adding marked crosswalks where land use context indicates more crossing opportunities are needed.
Pedestrian and bicyclist safety legislative councils publish annual reportsThe Washington Traffic Safety Commission published the 2017 annual reports of the Pedestrian Safety Advisory Council (PSAC) and the Cooper Jones Bicyclist Safety Advisory Council (BSAC). The Legislature established
these councils in 2016 and 2017, respectively, to review and analyze data related to active transportation safety and make recommendations to reduce pedestrian and bicyclist fatalities and serious injuries. For more information about the establishment of these councils, see Gray Notebook 65 p. 15.
The 2017 Annual Report and Recommendations of the PSAC lists 23 recommendations including WSDOT-led work to develop target speed policy and guidelines and improved data collection. The full report is available at bit.ly/PSAC2017.
The 2017 Annual Report of the BSAC includes a review of bicyclist safety data and recommendations for improving bicyclist safety data collection. The full report is available at bit.ly/BSAC2017.
Contributors include Mike Bernard, Barb Chamberlain, Charlotte Claybrooke, John Milton, Ed Spilker,
Dan Davis, Regan Hansen and Joe Irwin
Washington finalizes MAP-21 safety performance targetsIn August 2017, WSDOT submitted a new annual safety performance target for MAP-21 regarding bicyclist and pedestrian fatalities and serious injuries.
MAP-21 target for fatalities and serious injuries of bicyclists and pedestriansFive-year rolling average; number of persons
2016 baseline <503
2018 official target <432
Note: 1 To meet this target, the value of the five-year rolling average in 2018 must be at or below the target set in 2017 or at or below its 2016 (baseline) level. The FHWA included this provision to avoid punishing aspirational target setting.
For more information about the MAP-21 safety performance targets, see Gray Notebook 66, p. 14. For more information about MAP-21, including links to WSDOT-specific MAP-21 folios, visit www.wsdot.wa.gov/Accountability/MAP-21.
OR¹

16 | GNB Edition 69 | March 2018 Preservation – Safety Rest Areas
ASSET MANAGEMENT:SAFETY REST AREAS ANNUAL REPORT69
Safety rest area use increases in 2017 to 24.4 million visitorsAn estimated 24.4 million visitors used WSDOT safety rest areas in 2017, which is about 280,000 (or 1%) more than the 24.1 million estimated visitors in 2016, and the highest number in the past decade. Visitor estimates are generally based on water use. The 47 statewide rest areas provide safe places for travelers to take a break from driving or bicycling. All rest areas provide bathroom facilities and most also have traveler information, picnic tables and pet areas. Some rest areas also offer free coffee through a volunteer program.
While visitor use increased in 2017, WSDOT safety rest areas again met their maintenance goal. WSDOT rest areas continue to score a “B” grade on average. To earn a “B” grade a rest area site must appear clean and have water and sewer systems that are operational. Gray Notebook 60, p. 20 has a detailed overview of the grading scale for maintenance items.
WSDOT safety rest areas aging, preservation backlog increasing
Forty-one restroom buildings and 17 other buildings at safey rest areas are older than 25 years old. The average age of restroom buildings statewide is 33 years old and the average age of other buildings at safety rest areas statewide is 23 years old. The age of rest areas is a major contributing factor to the maintenance preservation backlog for buildings and the utilities that serve them.
The maintenance preservation backlog for safety rest areas is $40.1 million as of March 2018, an increase of 64% from $24.4 million since it was last assessed in 2014 (Gray Notebook 57, p. 10). This increase is due in part to continued aging in the years since 2014, but most of the increase is due to the addition of more site components to the 2018 condition assessment. Site infrastructure such as recreational vehicle dump stations, lagoons, and sewer and water systems are critical and cost intensive systems that directly impact operation of the facilities and can impact the health of the surrounding environment.
Contributors include Alix Berg, Steve Holloway, Zak Swannack, Helen Goldstein and Regan Hansen
Notable results Æ Visits to safety rest areas increased
by 1% between 2016 and 2017, to 24.4 million
Æ WSDOT met its 2017 safety rest area maintenance goal of "B"
Safety rest areas annual report to be discontinuedThis article marks the last publication of the Safety Rest Areas Annual report in the Gray Notebook (GNB). Maintenance information for safety rest areas will be reported in the Highway Maintenance Annual Report starting in December 2018 (GNB 72) and usage, cost and condition information for safety rest areas will be reported in the Capital Facilities Annual Report starting in September 2019 (GNB 75).
The online version of this article links to an interactive map with more information about safety rest area visitor use and site features; visit http://bit.ly/GNBrestareasmap.
Two-thirds of WSDOT's safety rest area restroom buildings are more than 25 years oldNumber and percent of WSDOT safety rest area buildings by age as of March 2018
Building age Restroom buildings All other buildings25 years or less 22 (35%) 43 (63%)1
26 to 50 years 31 (49%) 13 (19%)1
Older than 50 years 10 (16%) 4 (6%)1
Total 63 68 1
Data source: WSDOT Capital Facilities Office.
Note: 1 Number and percentages of other buildings by age do not add to total because there are eight buildings with unknown age.
Return toTable of
Contents

GNB Edition 69 | March 2018 | 17 Mobility – Travel Information
TRAVEL INFORMATIONANNUAL REPORT69
WSDOT’s social media following sees growthWSDOT’s social media following continued to grow during the 2018 reporting period (April 1, 2017, through March 31, 2018). WSDOT’s Facebook page followers increased by 21.0%, from 61,688 to 74,671. The most popular post from WSDOT’s Facebook account was an announcement with continual updates on the December 18, 2017, train derailment over I-5 near DuPont, which has been viewed about 300,600 times.
WSDOT’s two Twitter accounts also gained followers during the reporting period. The number of people following the “@wsdot” Twitter account increased 25.5% from 212,574 in April 2017 to 266,801 in March 2018, and the “@wsdot_traffic” Twitter account had a 37.5% increase in total followers from 329,381 to 452,754 over the same period.
During the 2018 reporting period, downloads of WSDOT’s mobile app increased by 14.0% from 760,025 to 866,430. More and more people are accessing real-time travel information on-the-go from the agency’s smartphone app. Social media contributes to WSDOT’s strategic goal of Inclusion by providing information to customers from various communities.
WSDOT experiences increased Twitter usageThe number of calls to WSDOT’s 511 travel information phone system decreased 29.5% to 546,281 calls during the 2018 reporting period, down from 774,700 calls during the previous 12 months. While the exact cause of the drop in 511 calls is unknown, some previous users may be gathering traffic information using one of WSDOT's many other tools including email and text alerts, Twitter accounts, Facebook, the WSDOT mobile app, the WSDOT website, or private sector tools.
Contributors include Jeremy Bertrand, Ron Vessey, Takahide Aso and Dustin Motte
Notable results Æ WSDOT’s Facebook page followers
increased 21.0% from 61,688 in April 2017 to 74,671 in March 2018
Æ The number of “@wsdot_traffic” Twitter followers increased 37.5% from 329,381 in April 2017 to 452,754 in March 2018
0100
200
300
400
500
600
700
800
2018201720162015
Twitter followers increase, 511 calls decrease in past yearApril through March, 2015 through 20181; Numbers in thousands
Data source: WSDOT Communications OfficeNotes: 1 Reporting period is April 1 through March 31 of the following year. 2 WSDOT’s travel information phone system. 3 Official WSDOT Twitter account. 4 Official WSDOT trafficinformation Twitter account.
2
511 calls2 “@wsdot”3followers
“@wsdot_traffic”4 followers
3
3
21
1
Web traffic decreases, ad revenue increases
WSDOT’s travel information website had about 124 million page views during the 2018 reporting period, down 24.4% from approximately 164 million views last reporting period. The drop in website views is likely because there were fewer severe weather events during the 2017-2018 winter, which resulted in fewer people checking the website for pass conditions.
The average net revenue from advertising commercial goods or services on WSDOT’s travel information website was $9,943 per month from April 2017 through March 2018. This is a 38.9% increase in revenue from the monthly average of $7,159 for the previous 12 months.
In July 2017, Washington State Legislature formally authorized RCW 47.04.360, which allows commercial advertising on the WSDOT website and social media accounts. For more information, see https://www.wsdot.wa.gov/Business/Advertising/.
Return toTable of
Contents

18 | GNB Edition 69 | March 2018 Safety & Mobility – Incident Response
INCIDENT RESPONSEQUARTERLY UPDATE69
WSDOT Incident Response teams improve driver safety at 14,838 incidentsWSDOT’s Incident Response (IR) teams were dispatched to 14,838 incidents during the first quarter (January through March) of 2018. There were 549 fewer incidents during the first quarter of 2018 than during the same period in 2017, a 3.6% decrease.
WSDOT teams cleared incidents in an average of 13 minutes and six seconds. This is one minute longer than the average incident clearance time for the same quarter in 2017. In the first quarter of 2018, there were 4.0% more incidents lasting more than 90 minutes while incidents lasting 15-90 minutes increased 4.9%, and incidents lasting less than 15 minutes decreased 6.0% compared to the same quarter last year. The proportion of incidents which blocked at least one lane was 26.1% for this quarter compared to 23.1% during the same quarter last year.
WSDOT focuses on safety when clearing incidents, working to reduce incident-induced delay as well as the potential for secondary incidents. Secondary incidents occur in the congestion resulting from a prior incident and may be caused by distracted driving, unexpected slowdowns or debris in the roadway. The IR teams help alert drivers about incidents and assist in clearing the roadway to reduce the likelihood of new incidents. A table summarizing the IR program’s performance and benefits for the quarter is on the next page.
WSDOT’s assistance at incident scenes provided an estimated $24.3 million in economic benefit during the first quarter of 2018 by reducing the impacts of incidents on drivers. These benefits are provided in two ways:
Æ WSDOT reduces the time and fuel motorists waste in incident-induced traffic delay by clearing incidents quickly. About $13.8 million of IR’s economic benefit for the quarter result from reduced traffic delay.
Æ WSDOT helps prevent secondary incidents by proactively managing traffic at incident scenes. About $10.5 million of IR’s economic benefit result from preventing an estimated 2,793 secondary incidents and resulting delay. This figure is based on Federal Highway Administration data that indicates 20% of all incidents are secondary incidents.
Based on WSDOT’s budget for IR, every $1 spent on the program this quarter provided drivers roughly $16.21 in economic benefit.
The mission of WSDOT’s Incident Response program is to clear traffic incidents safely and quickly, minimizing congestion and the risk of secondary incidents. The statewide program has a biennial budget of $12 million, about 59 full-time equivalent positions and 69 dedicated vehicles. Teams are on-call 24/7 and actively patrol approximately 1,300 centerline miles (3,400 lane miles) of highway on major corridors around the state during peak traffic hours. This covers approximately 18% of all state-owned centerline miles statewide.
First quarter (January through March) 2017 and 2018
INCIDENT RESPONSESMINUTE AVERAGEINCIDENT CLEARANCE TIME
INCIDENT RESPONSES14,838Q
12018 13.1 MINUTE AVERAGE
INCIDENT CLEARANCE TIME
15,387Q 1
2017 12.13.6%8.3% CLEARANCE
TIMEINCREASED
INCIDENTRESPONSESDECREASED
Data source: Washington Incident Tracking System.Notes: The data above only accounts for incidents to which an IR unit responded. IR data reported for the current quarter (Q1 2018) is considered preliminary. In the previous quarter (Q4 2017), WSDOT responded to 14,141 incidents, clearing them in an average of 13.5 minutes. These numbers have been confirmed and are now finalized.
Notable results Æ WSDOT responded to 14,838
incidents during the quarter, providing about $24.3 million in economic benefit
Æ WSDOT cleared incident scenes in an average of 13 minutes and six seconds, reducing traffic delay and the risk of secondary incidents
10000
First quarter incidents trend up over past five years
2014 2015 2016 2017 2018
Return toTable of
Contents

Safety & Mobility – Incident Response GNB Edition 69 | March 2018 | 19
WSDOT’s Incident Response provides an estimated $24.3 million in economic benefitJanuary through March 2018; Incidents by duration; Times in minutes; Costs and benefits in millions of dollars
Incident durationNumber of incidents1
Percent blocking2,5
Average incident clearance time3,5
(all incidents)Cost of incident-induced delay5
Economic benefits from IR program4,5
Less than 15 minutes 11,224 15.4% 4.8 $13.4 $6.2
Between 15 and 90 minutes 3,434 58.0% 31.3 $30.9 $13.5
Over 90 minutes 180 88.8% 182.4 $10.9 $4.6
Total 14,838 26.1% 13.1 $55.2 $24.3
Percent change from the first quarter of 2017 3.6% 3.0% 8.3% 4.8% 4.4%
Data source: Washington Incident Tracking System.Notes: Some numbers do not add to 100% due to rounding. 1 Teams were unable to locate 874 of the 14,838 incidents. Because an IR team attempted to respond, these incidents are included in the total
incident count. 2 An incident is considered blocking when it shuts down one or more lanes of travel.3 Incident clearance time is the time between an IR team’s first awareness of an incident and when the last responder has left the scene.4 Estimated economic benefits include benefits from delay reduction and prevented secondary incidents. See WSDOT’s Handbook for Corridor
Capacity Evaluation, 2nd edition, pp. 45-47, for WSDOT’s methods to calculate IR benefits.5 Performance measure excludes the incidents IR teams were unable to locate.
Customer feedback: Æ Heather was very professional, worked quickly and paid close attention to safety—she gave clear instructions and showed concern—very pleased with her service.
Æ Mark was helpful and kind! He helped me contact AAA and put out a flare for safety. This is a great service to the public, thanks!
Æ Ted spotted us broken down on a busy off ramp and provided service, keeping traffic away. He kept us from getting stuck. Thank you so much!
WSDOT teams respond to 180 over-90-minute incidentsWSDOT Incident Response units provided assistance at the scenes of 180 incidents that lasted more than 90 minutes during the first quarter of 2018. This is seven more incidents—a 4.0% increase—than the same quarter in 2017. Over-90-minute incidents accounted for only 1.2% of all incidents, but they resulted in 19.7% of all incident-related delay costs.
Nine of the 180 over-90-minute incidents took six hours or more to clear (referred to as extraordinary incidents). This is one incident less than in the first quarter of 2017. The nine extraordinary incidents took an average of eight hours and 45 minutes to clear, accounting for 2.9% of all incident-induced delay costs for the quarter.
The average incident clearance time for all over-90-minute incidents was about three hours and two minutes. This is about four minutes longer than the same quarter in 2017. Excluding the nine extraordinary incidents, WSDOT’s average clearance time for over-90-minute incidents was two hours and 45 minutes. Performance data reported in this article comes from WSDOT’s Washington Incident Tracking System, which tracks incidents to which a WSDOT IR team responded.
For more information on how WSDOT calculates these figures and all IR performance metrics, see WSDOT's Handbook for Corridor Capacity Evaluation, 2nd edition, pp. 45-47.
Contributors include Vince Fairhurst, Michele Villnave, Takahide Aso and Dustin Motte

20 | GNB Edition 69 | March 2018 Mobility – WSDOT Ferries
WSDOT FERRIESQUARTERLY UPDATE69
Ferries service reliability remains above goalThere were 38,648 regularly scheduled ferry trips during the third quarter of fiscal year (FY) 2018 (January through March 2018). WSDOT Ferries completed 99.4% (38,413) of these trips. This exceeds the annual service reliability performance goal of 99% and is 0.4 percentage points lower than the same quarter in FY2017 (see table on the next page).
In the third quarter of FY2018, Ferries canceled 406 trips and was able to replace 171 of them, resulting in 235 net missed trips. This was 142 more net missed trips compared to the 93 missed during the same quarter in FY2017.
Of the 406 canceled trips for the quarter, 218 were due to a propulsion-related issue on the Motor/Vehicle Issaquah (127 of the 218 canceled trips were replaced, so the service impact was 91 net missed trips). This vessel was assigned to the Fauntleroy - Vashon - Southworth ferry route, which was reduced from a three-boat to a two-boat schedule. Canceled trips for this reduction in service are shown in the schedule reset (133 cancellations) and vessel/mechanical (85 of the 116 cancellations) categories in the graph to the left.
Ridership increases during the third quarter of FY2018WSDOT Ferries ridership was approximately 5.1 million during the third quarter of FY2018. This was about 35,000 (0.7%) fewer passengers than WSDOT projected for the quarter and about 134,500 (2.7%) more passengers than the corresponding quarter in FY2017. Ridership during the third quarter of FY2018 increased on seven of the nine routes compared to the same quarter in FY2017.
The Port Townsend - Coupeville route experienced the largest increase in ridership (7.4%) compared to the same quarter in FY2017. The Anacortes - Sidney, B.C. route had a 10.8% decrease in ridership compared to the same quarter last year. This was the largest percentage point decrease in route ridership during the quarter, but represents only 110 fewer riders on this route.
The Anacortes - Sidney, B.C. route closes during the winter; it was closed one day longer this year (January 7 to March 31) compared to FY2017. This resulted in the route operating for six days during the third quarter of FY2018 compared to seven days of operation during the same quarter last year, contributing to the decrease in ridership on the route.
On-time performance decreases, remains above goalOn-time performance was 95.7% in the third quarter of FY2018, 0.5% lower than the same quarter in FY2017. The quarterly rate is above Ferries’ annual on-time performance goal of 95%. On-time performance decreased on seven of nine routes compared to the third quarter of FY2017. On average, 4.3% (1,605) of trips in the third quarter of FY2018 did not leave the terminal
Notable results Æ Ferries completed 38,413 (99.4%)
of its 38,648 regularly scheduled trips in the third quarter of fiscal year 2018
Æ Ferries ridership was approximately 5.1 million in the third quarter of fiscal year 2018, about 134,500 (2.7%) more than the corresponding quarter in FY2017
Schedule reset top reason for cancellationsThird quarter (January - March) FY2018
Emergency/security52 (12.8%)
Schedulereset
11 (2.7%)
Data source: WSDOT Ferries.Notes: Fiscal years (FY) run from July 1 through June 30. As a result, January - March 2018 represents the third quarter of FY2018. 1 The category for “Other” includes vessel availability, issues at terminals, and events like disabled vehicles, environmental reasons and non-vessel related incidents that can impact operations. 2 Ferries replaced 171 of the 406 canceled trips for a total of 235 net missed trips.
78 (19.2%)
Vessel/mechanical116 (28.6%)
16 (3.9%)Other1
133 (32.8%)
Weather/tides
Crewing
406 trip cancellations2
Return toTable of
Contents

Mobility – WSDOT Ferries GNB Edition 69 | March 2018 | 21
Passenger complaints increase for the quarterFerries received 213 complaints and 27 compliments during the third quarter of FY2018, compared to 191 complaints and 33 compliments during the same quarter in FY2017. Fifty-seven of the 213 complaints centered around loading and unloading, an increase of 12 from the 45 reported in the third quarter of FY2017. Ticket issues was the category with the largest improvement and had 12 fewer complaints than the same period in FY2017, resulting in five complaints during the third quarter of FY2018.
Contributors include Matt Hanbey, Kynan Patterson, Joe Irwin and Dustin Motte
Ferries on-time performance and reliability decreases in the third quarter of fiscal year 2018January through March FY2017 and FY2018; Annual on-time goal = 95%; Annual service reliability goal = 99%
Route
On-time performance (third quarter) Trip reliability (third quarter)
FY2017 FY2018 Status Trend FY2017 FY2018 Status Trend
San Juan Domestic 90.6% 90.6% 0.0% 99.8% 99.7% -0.1%
Anacortes/Friday Harbor – Sidney, B.C. 100% 91.7% -8.3% 100.0% 100.0% 0.0%
Edmonds – Kingston 98.5% 98.1% -0.4% 100.0% 99.9% -0.1%
Fauntleroy – Vashon – Southworth 95.4% 94.8% -0.6% 100.0% 98.8% -1.2%
Port Townsend – Coupeville 97.7% 98.0% +0.3% 96.1% 95.4% -0.7%
Mukilteo – Clinton 99.3% 98.7% -0.6% 100.0% 100.0% 0.0%
Point Defiance – Tahlequah 99.4% 98.7% -0.7% 99.9% 99.8% -0.1%
Seattle – Bainbridge Island 95.2% 94.0% -1.2% 99.9% 100.0% +0.1%
Seattle – Bremerton 97.6% 96.2% -1.4% 99.8% 99.7% -0.1%
Total system 96.2% 95.7% -0.5% 99.8% 99.4% -0.4%
Data source: WSDOT Ferries.Notes: FY = fiscal year (July 1 through June 30). As a result, January - March 2018 represents the third quarter of FY2018. A trip is considered delayed when a vessel leaves the terminal more than 10 minutes later than the scheduled departure time. Ferries operates 10 routes but combines the Anacortes – Friday Harbor route with the San Juan Interisland route as the San Juan Domestic for on-time performance and service reliability. Due to unique fare collection methods in the San Juan Islands, and similar origin and destination legs on both routes, some statistics cannot be separated between the two routes.
The rate of Occupational Safety and Health Administration (OSHA) recordable crew injuries per 10,000 revenue service hours increased from two in the third quarter of FY2017 to 9.7 during the same period in FY2018. This represents 23 more injuries than the same quarter in FY2017, and missed Ferries’ annual goal of having a rate of fewer than 7.6 crew injuries per 10,000 revenue service hours.
Revenue follows ridership, trends up for the quarterFerries farebox revenue continued its upward trend, coming in at about $37.9 million for the third quarter of FY2018. Farebox revenue was about $2.0 million (5.6%) more than the same quarter in FY2017, but about $493,000 (1.0%) below projections. The online version of this
article links to an interactive map at bit.ly/GNBferriesmap.
within 10 minutes of the scheduled departure time, slightly higher than the average of 3.8% (1,444) for the same quarter in FY2017. The Anacortes/Friday Harbor - Sidney, B.C. route had the largest percentage point decrease in on-time performance (8.3%) compared to the same quarter last year. Due to the low number of sailings, this means that one of 12 total trips did not leave on time.
Passenger injuries decrease, employee injuries increaseThe rate of passenger injuries per million riders decreased from 0.4 in the third quarter of FY2017 to 0.2 in the third quarter of FY2018, representing a drop from two to one passenger injury. The passenger injury rate during the quarter met Ferries’ goal of having one or fewer injuries per million riders.

22 | GNB Edition 69 | March 2018 Mobility – Passenger Rail
RAIL: AMTRAK CASCADES QUARTERLY UPDATE69
Amtrak Cascades ridership strong even with significant interruptions due to landslidesRidership on Amtrak Cascades remained strong in 2017 despite significant service interruptions and cancellations primarily due to landslides. Overall ridership decreased 0.7% from 817,000 people in 2016—the highest total in five years—to 811,000 people in 2017.
The first six months of 2017 saw a 2% (7,000 rider) decrease in ridership from the same period in 2016, primarily due to landslides. There were 31 landslides during the first six months of 2017, compared with seven in 2016. Each landslide results in a 48-hour closure of the track through the affected area, which led to 200 canceled trains from January through June 2017. Two-thirds of the landslides occurred in Clark County—between the Kelso and Vancouver stations—an area which has not previously seen large numbers of landslides. WSDOT is engaged in ongoing discussions with Clark County to try to determine the causes of these landslides.
In contrast, the second half of 2017 saw a 0.2% increase in ridership from 2016. Amtrak Cascades saw some of the highest monthly ridership levels in five years during this time period, with a six-month total of 450,000 riders in 2017, compared to 449,000 for the same period in 2016. This increase is attributed to a strong summer marketing campaign, including a partnership with the Seattle Mariners.
More than half of Amtrak Cascades ridership is on the Seattle/Portland segmentThe segment of the Amtrak Cascades corridor between Seattle and Portland accounted for 54% of riders in 2017, which is the same percentage of ridership that the segment had in 2016. More than 440,000 passengers took trips that both began and ended somewhere between the two cities. Additionally, King Street Station in Seattle and Union Station in Portland were the two busiest stations on the Amtrak Cascades corridor in 2017.
Ticket revenues decrease slightly in 2017Amtrak Cascades ticket revenue totaled $29.6 million in 2017, a 2% decrease from $30.2 million in 2016. The Seattle-to-Portland travel segment was the busiest, accounting for 31% ($9.1 million) of ticket revenues in 2017. The second-busiest segment, Seattle-to-Vancouver, B.C., accounted for 18.6% of revenue, at $5.5 million.
Contributors include Teresa Graham, Barbara LaBoe, Janet Matkin, Kathryn Blumhardt and Helen Goldstein
Notable results � Amtrak Cascades ridership decreased by less than 1% to 811,000 passengers in 2017
� Amtrak Cascades revenue decreased by 2%, from $30.2 million in 2016 to $29.6 million in 2017
Total Amtrak Cascades ticket revenue tops $29.6 million2017; Percent of total dollar value
Data source: WSDOT Rail, Freight and Ports Division.Notes: Amtrak Cascades runs 467 miles fromVancouver, B.C. to Eugene, Oregon. Percentagesmay not add to 100 due to rounding.
Seattle/Portland$9.1 million (30.7%)
Seattle/Vancouver, B.C.
$5.5 million (18.6%)
Portland/Eugene$0.7 million
(2.4%)
Vancouver, B.C./Portland
$1.0 million (4.3%)
Portland/Tacoma$1.5 million (5.1%)
All othercity pairs$10.3 million(34.8%)
Seattle/Vancouver,Wash.$1.5 million(5.1%)
Return toTable of
Contents

GNB Edition 69 | March 2018 | 23 Environment – Wetlands Protection
WETLANDS PROTECTION ANNUAL REPORT69
Notable results Æ WSDOT added six new wetland and
stream mitigation sites on 33 acres in 2017, bringing the total to 291 sites on 1,606 acres
Æ WSDOT closed out six mitigation sites at the end of the 10-year monitoring period
Æ WSDOT's mitigation banks earned 1.25 credits and provided agency transportation projects 0.94 credits in 2017
WSDOT adds 33 acres of wetland and stream mitigation sites in 2017WSDOT began monitoring six new wetland and stream mitigation sites on 33 acres in 2017, bringing the total to 291 wetland and stream mitigation sites—including six mitigation banks—on 1,606 acres. WSDOT started issuing monitoring reports on mitigation sites in 1988 and has since transferred 171 sites (675 acres) to long-term stewardship with WSDOT partners.
From 2001 through 2017, the number of WSDOT-monitored wetland and stream mitigation sites increased by 122% (54 to 120) and total acreage increased by 460% (213 to 1,192). The increase is mostly a result of construction projects funded by the 2003 Nickel and the 2005 Transportation Partnership Account revenue packages.
WSDOT designs and builds transportation projects to avoid or minimize disturbance to wetlands and streams. When construction impacts cannot be avoided, the agency designs and builds wetland and stream mitigation sites as compensation.
To ensure these sites meet permit requirements, WSDOT monitors them as they develop—typically for 10 years— before transferring them to long-term stewardship. WSDOT’s inventory of mitigation sites includes:
Æ Ninety-one wetland and stream mitigation sites currently in the 10-year monitoring period;
Æ One advanced mitigation site that WSDOT did not previously count because no projects used it until 2017;
WSDOT mitigation sites increase to 1,606 acres1988 through 2017; Total acreage (and percent of total) of replacement wetlands and stream mitigation sites by type
Data source: WSDOT Environmental Services Office.
Rehabilitation (8%)Stream mitigation (8%)
Restoration (9%)
Preservation (15%)
Enhancement (17%)
Establishment (18%)
Protects a wetland or stream from disturbance and may enhance adjacent wetland functions; 396 acres
Buffer (25%)
Develops wetlands in a non-wetland area; 297 acres
Improves an existing wetland to increase its function; 277 acres
Protects wetlands from threats to their function or condition; 245 acres
Re-establishes functions to a former wetland; 142 acres
Repairs or relocates stream beds and banks; 126 acres
Re-plants temporarily disturbed vegetation; 123 acres
How mitigation banks work for WSDOTThe Environmental Protection Agency and Army Corps of Engineers’ guidance on compensatory mitigation recommends mitigation banking. Mitigation banking can be thought of as a type of “savings account” for future capital projects and mitigation needs. Mitigation banks create credits based on the number of acres and their value. These credits can be withdrawn from the account (or used) by projects as compensation for unavoidable wetland impacts within the bank’s specified service area.
For more information about mitigation banks, visit http://bit.ly/wsdotmitigation.
Return toTable of
Contents

Environment – Wetlands Protection24 | GNB Edition 69 | March 2018
Æ Two sites past the initial monitoring period that have not yet met all permit requirements;
Æ Twenty sites being evaluated by the U.S. Army Corps of Engineers and Washington State Department of Ecology for completion of their permit requirements;
Æ Six mitigation banks; and
Æ One hundred seventy-one sites in long-term stewardship that have met their permit requirements.
Refer to Gray Notebook 53, p. 20 for a description of the life of a typical WSDOT wetland mitigation site.
WSDOT strives to meet completion requirements for mitigation sitesIn 2017, WSDOT completed monitoring work at six mitigation sites where permit requirements were met by the end of the monitoring period. WSDOT mitigation sites provide benefits such as water quality improvement, wildlife and pollinator habitats or work as storage areas for floodwater.
Two other mitigation sites were past their initial monitoring period and did not yet meet all final-year permit requirements in 2017. WSDOT is awaiting reviews from the Army Corps of Engineers and Washington State Department of Ecology on one of these sites that needed plant replacement, weed control and additional time to develop in order to meet permit requirements. The other site recently failed to meet final-year permit requirements and vegetation was re-planted.
With additional time for vegetation to grow, the sites are expected to meet the requirements in the next few years.
WSDOT internship program recognized at Governor’s summitWSDOT's Wetland Ecology and Monitoring Techniques Internship—a partnership with The Evergreen State College for over 20 years—was recognized at the Governor’s Summit on Career Connected Learning. The internship program links a government agency and an accredited academic institution to provide career-connected learning to students. The paid summer internship allows WSDOT to hire interns for 11 weeks for $3,386 per intern, including wages and overhead costs paid to the college. This provides cost savings of $9,234 per intern compared to the starting
0
20
40
60
80
100
120
140
201720152013201120092007200520032001
WSDOT monitors 120 mitigation sites including six mitigation banks2001 through 2017; Number of sites and acres monitored
Data source: WSDOT Environmental Services Office.Notes: Of the 120 sites above, WSDOT has 92 active mitigation sites, 20 sites submitted for closeout that are being evaluated, two sites beyond the initial monitoring period and six bank units.
Mitigation sites1
1
0
200
400
600
800
1,000
1,200
1,400Sites Acres
2
2 Acres monitored Nickel funding passed TPA funding passed
Connecting Washingtonfunding passed4
4
5
5
3
3
Results WSDOT GoalWORKFORCEDEVELOPMENT
WSDOT’s Wetland Ecology and Monitoring Techniques Internship creates relationships with students at The Evergreen State College. The internship experience provides qualified candidates meaningful and educational work experience and develops a pipeline for talent to WSDOT after the interns receive their degrees.
seasonal salary of $12,620 for a TPS 1 Biologist in the Wetland Monitoring office for the 11-week period. In other words, WSDOT is able to hire approximately four interns for the same cost as one TPS 1 Biologist.
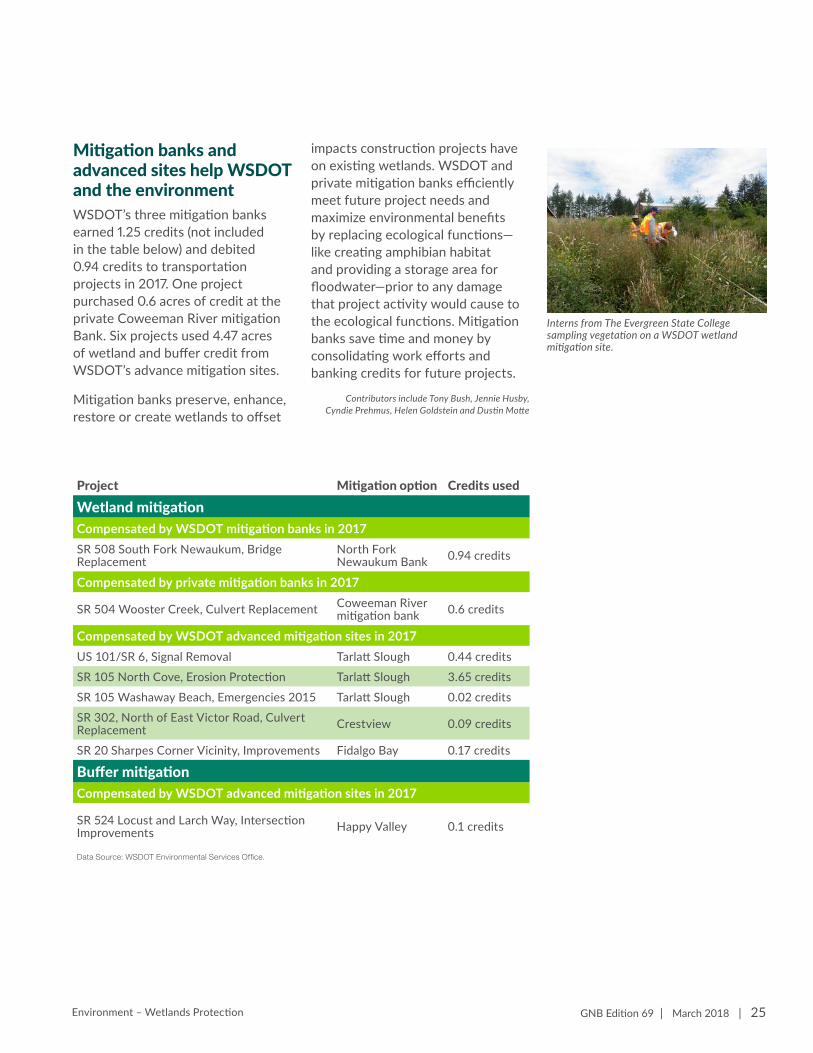
Environment – Wetlands Protection GNB Edition 69 | March 2018 | 25
Mitigation banks and advanced sites help WSDOT and the environmentWSDOT’s three mitigation banks earned 1.25 credits (not included in the table below) and debited 0.94 credits to transportation projects in 2017. One project purchased 0.6 acres of credit at the private Coweeman River mitigation Bank. Six projects used 4.47 acres of wetland and buffer credit from WSDOT’s advance mitigation sites.
Mitigation banks preserve, enhance, restore or create wetlands to offset
impacts construction projects have on existing wetlands. WSDOT and private mitigation banks efficiently meet future project needs and maximize environmental benefits by replacing ecological functions—like creating amphibian habitat and providing a storage area for floodwater—prior to any damage that project activity would cause to the ecological functions. Mitigation banks save time and money by consolidating work efforts and banking credits for future projects.
Contributors include Tony Bush, Jennie Husby, Cyndie Prehmus, Helen Goldstein and Dustin Motte
Project Mitigation option Credits used
Wetland mitigationCompensated by WSDOT mitigation banks in 2017SR 508 South Fork Newaukum, Bridge Replacement
North Fork Newaukum Bank 0.94 credits
Compensated by private mitigation banks in 2017
SR 504 Wooster Creek, Culvert Replacement Coweeman River mitigation bank 0.6 credits
Compensated by WSDOT advanced mitigation sites in 2017US 101/SR 6, Signal Removal Tarlatt Slough 0.44 credits
SR 105 North Cove, Erosion Protection Tarlatt Slough 3.65 credits
SR 105 Washaway Beach, Emergencies 2015 Tarlatt Slough 0.02 credits
SR 302, North of East Victor Road, Culvert Replacement Crestview 0.09 credits
SR 20 Sharpes Corner Vicinity, Improvements Fidalgo Bay 0.17 credits
Buffer mitigationCompensated by WSDOT advanced mitigation sites in 2017
SR 524 Locust and Larch Way, Intersection Improvements Happy Valley 0.1 credits
Data Source: WSDOT Environmental Services Office.
Interns from The Evergreen State College sampling vegetation on a WSDOT wetland mitigation site.

26 | GNB Edition 69 | March 2018 Environment – Noise Quality
NOISE QUALITYANNUAL REPORT69
WSDOT completes eight noise studies for future projectsWSDOT completed eight traffic noise studies for Type 1 transportation projects between April 1, 2017, and March 31, 2018. These studies collect noise measurements and traffic counts and predict future noise levels with and without noise barriers for each project. WSDOT is proactive in the implementation of noise walls to mitigate noise and improve quality of life for residents living near major highways across the state. WSDOT noise quality projects are categorized as either Type 1 or Type 2 (see box to the left for information on project types).
WSDOT currently has 55 Type 2 projects eligible for construction. The project list was reprioritized in June 2015 based on population density, area noise levels and cost of abatement in communities built prior to noise level requirements. Type 2 noise reduction projects are selected for completion by the state Legislature.
New noise wall reduces traffic noise along I-405 corridorWSDOT has constructed one new Type 1 noise wall since March 2017. This wall, which measures 0.3 miles, was part of the I-405 Northbound Peak Use Shoulder Lane project in Snohomish County. This project added a new northbound peak use shoulder lane to increase capacity and manage congestion. A before and after analysis of improvements on I-405, including the peak-use shoulder lane project, can be found in WSDOT's 2017 Corridor Capacity Report, pp. 19-22. Overall, WSDOT has constructed approximately 91 miles of noise barriers since 1963.
WSDOT utilizes noise variance permits in construction workWSDOT obtained 37 noise variance permits from local jurisdictions between April 1, 2017, and March 31, 2018. These permits allow construction crews to produce more noise than is generally acceptable at night, and work to be completed on time in areas with heavy traffic and safety concerns during the day.
WSDOT tests new rumble strip designsWSDOT is continuing to research new rumble strip designs to reduce roadway noise. Rumble strips are grooves cut into pavement that, when driven over, produce noise and vibration within the vehicle that are intended to alert drivers that they are drifting out of their lane.
In 2017, WSDOT collected noise measurements on four new rumble strip designs. These new designs attempt to reduce the external roadway noise
Notable results � WSDOT conducted eight traffic noise studies for upcoming transportation projects between April 2017 and March 2018
� WSDOT has constructed approximately 91 miles of noise walls since 1963, including 0.3 miles between April 2017 and March 2018
WSDOT evaluates noise for two project typesWSDOT conducts noise studies for two types of projects:
Æ Type 1 projects involve new construction for projects which could potentially increase traffic noise for nearby residents;
Æ Type 2 projects are retrofits for existing high-traffic roadways near residential areas that were constructed before 1976—which is the first year that noise evaluations were required for highway projects. WSDOT maintains a prioritized list of eligible Type 2 projects to be considered for completion by the Legislature.
For both types of projects, WSDOT evaluates how noise can be cost-effectively reduced and seeks input from affected communities before taking any noise-reducing action (like constructing a noise wall).
Return toTable of
Contents

Environment – Noise Quality GNB Edition 69 | March 2018 | 27
associated with rumble strips, while still safely notifying distracted drivers to correct the vehicle.
The designs WSDOT tested incorporated changes to two dimensions of the original rumble strip divots, length and spacing, as well as a new sinusoidal or "mumble strip" design that has been used in Minnesota and California. A mumble strip is a type of rumble strip that uses a shallow wave design rather than the typical divots found in rumble strips.
The mumble strip test results showed that the new design led to a reduction in external noise levels of between 5 and 12 decibels. Decibels increase logarithmically, so an
increase of 10 decibels corresponds to a sound 10-times more intense, which sounds like double the noise. The other divot designs produced results similar to the standard rumble strip design. The results showed varying decibel levels for the different rumble strip divot dimensions.
The mumble strip design test section is on a two-mile stretch of State Route 155 near Coulee. The other three variations of the rumble strip design were tested in Othello. See Gray Notebook 57, p. 20 and Gray Notebook 61, p. 20 for more information on past research phases.
Contributors include Jim Laughlin, Kathryn Blumhardt and Regan Hansen
WSDOT requires noise walls to meet two criteriaWSDOT evaluates noise walls using two criteria. These criteria are based on federal standards for noise barriers.
First, WSDOT analyzes the feasibility of noise walls by determining how effectively they block noise in communities with high noise levels. In order to be constructed, the wall must provide the homes behind it at least 5 decibels of noise reduction. An example of this is the increase in sound between an average dishwasher (75 decibels) and a garbage disposal (80 decibels) when the listener is standing in the kitchen.
Secondly, WSDOT estimates the costs associated with building the noise barrier. The agency compares the allowed cost per resident with an estimated cost per resident. This allowable cost takes into consideration the number of homes that will benefit from noise reduction. If the estimated cost is less than or equal to the allowable cost, then WSDOT recommends the noise wall for construction.
For example, the recently completed noise wall on I-405 in Snohomish County had an allowable cost of $5,678,335, which was calculated using the expected increase in noise level as a result of the project for 309 residences that would be affected. The estimated cost of the noise wall was $4,278,263, allowing construction to move forward.
ECONOMIC ANALYSIS
WSDOT reduces costs by buying equipment instead of rentingThe Mukilteo Multimodal Terminal project is replacing the Mukilteo ferry terminal to provide passengers safer and more efficient use of all modes of transit in the area. In order to begin construction on the project, WSDOT required equipment that would monitor noise and vibration. After evaluating multiple options, WSDOT chose to purchase the necessary equipment. The purchase cost the agency $86,000—approximately $38,000 less than the expected cost of renting the same equipment. WSDOT also will be able to use the newly purchased equipment on future projects.
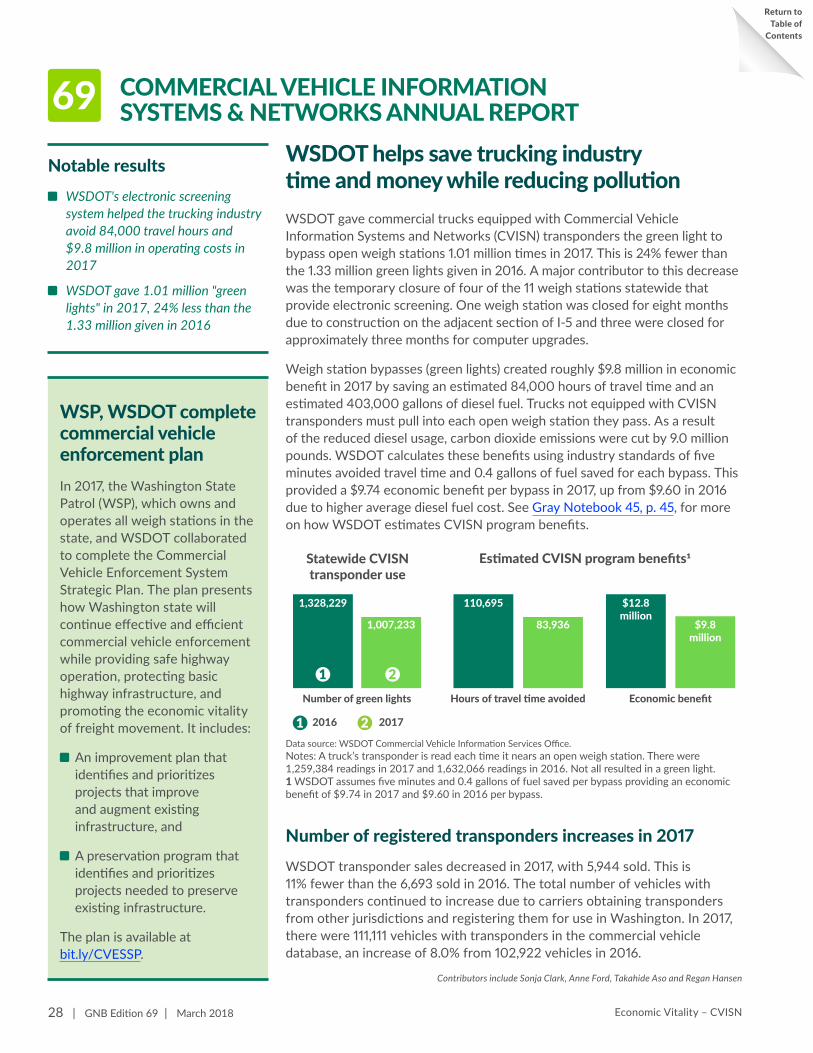
28 | GNB Edition 69 | March 2018 Economic Vitality – CVISN
COMMERCIAL VEHICLE INFORMATIONSYSTEMS & NETWORKS ANNUAL REPORT69
WSDOT helps save trucking industry time and money while reducing pollutionWSDOT gave commercial trucks equipped with Commercial Vehicle Information Systems and Networks (CVISN) transponders the green light to bypass open weigh stations 1.01 million times in 2017. This is 24% fewer than the 1.33 million green lights given in 2016. A major contributor to this decrease was the temporary closure of four of the 11 weigh stations statewide that provide electronic screening. One weigh station was closed for eight months due to construction on the adjacent section of I-5 and three were closed for approximately three months for computer upgrades.
Weigh station bypasses (green lights) created roughly $9.8 million in economic benefit in 2017 by saving an estimated 84,000 hours of travel time and an estimated 403,000 gallons of diesel fuel. Trucks not equipped with CVISN transponders must pull into each open weigh station they pass. As a result of the reduced diesel usage, carbon dioxide emissions were cut by 9.0 million pounds. WSDOT calculates these benefits using industry standards of five minutes avoided travel time and 0.4 gallons of fuel saved for each bypass. This provided a $9.74 economic benefit per bypass in 2017, up from $9.60 in 2016 due to higher average diesel fuel cost. See Gray Notebook 45, p. 45, for more on how WSDOT estimates CVISN program benefits.
Number of green lights
1,328,229
1,007,233
Economic benefitHours of travel time avoided
110,695
83,936
$12.8million
$9.8million
Estimated CVISN program benefits1Statewide CVISNtransponder use
1 2016 2 2017
Data source: WSDOT Commercial Vehicle Information Services Office.Notes: A truck’s transponder is read each time it nears an open weigh station. There were 1,259,384 readings in 2017 and 1,632,066 readings in 2016. Not all resulted in a green light. 1 WSDOT assumes five minutes and 0.4 gallons of fuel saved per bypass providing an economic benefit of $9.74 in 2017 and $9.60 in 2016 per bypass.
1 2
Number of registered transponders increases in 2017WSDOT transponder sales decreased in 2017, with 5,944 sold. This is 11% fewer than the 6,693 sold in 2016. The total number of vehicles with transponders continued to increase due to carriers obtaining transponders from other jurisdictions and registering them for use in Washington. In 2017, there were 111,111 vehicles with transponders in the commercial vehicle database, an increase of 8.0% from 102,922 vehicles in 2016.
Contributors include Sonja Clark, Anne Ford, Takahide Aso and Regan Hansen
Notable results Æ WSDOT's electronic screening
system helped the trucking industry avoid 84,000 travel hours and $9.8 million in operating costs in 2017
Æ WSDOT gave 1.01 million "green lights" in 2017, 24% less than the 1.33 million given in 2016
WSP, WSDOT complete commercial vehicle enforcement planIn 2017, the Washington State Patrol (WSP), which owns and operates all weigh stations in the state, and WSDOT collaborated to complete the Commercial Vehicle Enforcement System Strategic Plan. The plan presents how Washington state will continue effective and efficient commercial vehicle enforcement while providing safe highway operation, protecting basic highway infrastructure, and promoting the economic vitality of freight movement. It includes:
Æ An improvement plan that identifies and prioritizes projects that improve and augment existing infrastructure, and
Æ A preservation program that identifies and prioritizes projects needed to preserve existing infrastructure.
The plan is available at bit.ly/CVESSP.
Return toTable of
Contents
GNB Edition 69 | March 2018 | 29 Economic Vitality – Transportation and the Economy
TRANSPORTATION AND THE ECONOMY: ANNUAL REPORT69
Washington state's transportation network and operations are closely tied to the state's economy. Nearly all economic activity relies on the transportation network daily—for getting commuters to work, or transporting goods and services to consumers. Efficient transportation systems facilitate economic activity, while congestion and bottlenecks can mean lost time and productivity for commuters, as well as higher costs for businesses. A practical way to analzye the complex relationship between the economy and the transportation system is to examine changes in individual economic indicators and their probable effects on a variety of transportation outcomes.
Economic conditions also influence how the transportation system performs, primarily because they affect the demand for transportation. Between 2016 and 2017, the number of non-farm employees in Washington state increased 2.8% from 3.24 million to 3.33 million, and the number of Washington residents at least 16 years of age increased 1.7% from 5.74 million to 5.84 million. These changes, both of which are continuations of multi-year trends, can be expected to increase the demand for transportation in Washington state.
In contrast, an increase in the price of gasoline can be expected to cause some drivers to make fewer trips or use other modes of transportation. The annual average price of gasoline rose between 2016 and 2017, increasing by 13.1% from $2.52 per gallon to $2.85 per gallon. This is the first increase in the annual average price of gasoline in Washington state in five years. There are some indications that this increase may have affected the demand for driving; the number of passenger vehicles registered in Washington state declined by 1.3% between 2016 and 2017, going from 4.76 million to 4.70 million.
The most recent available data for both vehicle miles traveled (VMT) and drive-alone commuting are for 2016, and therefore do not reflect the 2017 increase in gas prices. Between 2015 and 2016, the drive-alone commuting rate dropped slightly from 72.4% to 72.1%. This decline was not large enough to offset the growth in demand for transportation over the same period, as VMT in Washington state increased by 2.0% from 59.7 billion in 2015 to 60.9 billion in 2016. Preliminary data suggests that VMT increased again in 2017, although at a much lower rate, which could indicate that the effect of increased gas prices, while present, was outweighed by other factors such as the growth in employment and population.
Higher VMT may, depending on where the additional miles are traveled, result in more congestion. Additional VMT also causes pavement conditions to deteriorate faster, increasing the need for roadway preservation and maintenance.
Contributors include Lizbeth Martin-Mahar, Kathryn Blumhardt and Helen Goldstein
Notable results Æ The annual average price of gasoline
in Washington state rose for the first time in five years, going from $2.52 per gallon in 2016 to $2.85 per gallon in 2017
Æ Washington state's population aged 16 and above increased by 1.7% between 2016 and 2017, going from 5.74 million to 5.84 million
Return toTable of
Contents

Economic Vitality – Transportation and the Economy30 | GNB Edition 69 | March 2018
Transportation and the Economy DashboardStatewide Economic Indicator
Previous period
Current period Five-year trend (unless noted) Relationship to Transportation
Employment(Millions of non-farm employees in Washington state; 2016 & 2017)
3.24 3.33More people working means more people commuting and more people who can afford leisure trips.
Median annual household income in Washington state (Inflation-adjusted, 2016 dollars; 2015 & 2016)
$64,938 $67,10659000
69000
An increase in real (inflation-adjusted) household income increases demand for goods and services, which in turn increases demand for transportation
Washington residents at least 16 years of age (Millions of persons; 2016 & 2017)
5.74 5.84
An increase in the number of Washington residents at least 16 years of age means an increase in the potential number of drivers on the road.
Passenger vehicle registrations(Millions of passenger vehicles registered in Washington; excludes all trucks; 2016 & 2017)
4.76 4.70
An increase in the number of passenger vehicles registered in Washington increases the potential number of cars on the road.
Annual average gas price (Inflation-adjusted annual average price per gallon in 2017 dollars; 2016 & 2017)
$2.52 $2.85
Higher fuel prices may cause some commuters to consider alternative commute options; lower fuel prices make driving more affordable.
Vehicle miles traveled (VMT) (Billions of vehicle miles traveled on public roads in Washington; 2015 & 2016)
59.7 60.9
An increase in VMT could increase congestion, as well as roadway preservation and maintenance needs. Increased VMT will also increase fuel consumption unless it is accompanied by increased fuel efficiency.
Drive-alone commuting rate(Percentage of Washington commuters driving alone to work; 2015 & 2016)
72.4% 72.1%The percentage of commuters driving alone influences the demand on the transportation system.
Revenue from Washington state Motor Vehicle Fuel Tax(Billions of dollars, not adjusted for inflation; 2013-2015 & 2015-2017 biennia)
$2.55 $3.28
2300
3400
The Motor Vehicle Fuel Tax is a major source of transportation funding in Washington state; revenue from it depends on the number of gallons of fuel purchased.
Data sources: U.S. Bureau of Labor Statistics, Washington State Office of Financial Management, Washington State Department of Licensing, U.S. Energy Information Administration, WSDOT 2017 Corridor Capacity Report, Bureau of Labor Statistics: American Community Survey, Transportation Revenue Forecast Council: February 2018 Transportation Economic and Revenue Forecasts.
2800
3400
2.25
4.25
5450
5900
4200
4900
53
62
72
73
(four-biennium trend)

GNB Edition 69 | March 2018 | 31 Stewardship – Workforce Development
WORKFORCE DEVELOPMENT ANNUAL REPORT69
Notable results Æ WSDOT filled 1,150 positions in
2017, a 12% increase above the 1,026 positions filled in 2016
Æ Ten percent of WSDOT's eligible workforce teleworks at least two days each month
Workforce Development is one of three goals for Results WSDOT, the agency's strategic plan for 2017-2021. WSDOT strives to be an employer of choice—attracting and retaining a skilled, diverse workforce—valuing employee development and engagement, supported by a modern work environment.
Workforce grows by 4% while 42% of WSDOT employees may retire by 2022WSDOT had 6,866 permanent full-time employees as of March 31, 2018. This is 280 (4%) more than the same quarter one year ago. Agency-wide, 42% (2,770) of employees have the “possibility” of retiring by 2022 and 20% (1,282) are considered “probable” to retire. Retirement forecasts are as of September 2017, when there were 6,546 employees with retirement benefits. The forecasts are based on employee age, retirement plans and years of service. “Possible” refers to those eligible to retire with reduced or full benefits. “Probable” refers to employees eligible to retire with full benefits.
In calendar year 2017 there were 964 employees who separated from WSDOT. Separations occur as a result of abandonment of position, death, disability, dismissal, end of appointment, layoff, resignation and retirement.
Retirements drive workforce development strategies as agency strives to attract more diverse, qualified candidatesAs of December 2017, engineering and maintenance employees made up 74% of the agency’s workforce. Of the agency’s 2,324 permanent engineering employees, 44% (992) have the possibility of retirement, and 18% (417) are considered probable to retire by 2022. Forty-two percent (1,044) of the agency’s 2,508 permanent maintenance employees have the possibility of retirement, and 21% (521) are considered probable to retire by 2022. Forty-five percent (790) of the agency's 1,754 Ferries' employees have the possibility of retirement, and 26% (454) are considered probable to retire by 2022. Ferries' ordinary seamen accounted for 7% of Ferries' workforce. Given significant retirement probabilities, WSDOT is implementing strategies to support a stable and skilled workforce including increased outreach and referral programs.
WSDOT seeks diverse, qualified candidates including women and veterans
WSDOT has set a goal of increasing the number of diverse, qualified candidates who apply for Transportation Engineer 1, Maintenance Technician 2 and Ordinary Seaman by 5% each per year through June 2021. These three job classifications represent entry into the agency's largest labor pools and the beginning of potential career ladders for continuous growth. In addition, WSDOT has set a goal to increase the number of qualified women and veteran applicants by 5% each per year through June 2021. As of December 2017, 24.9% (1,766) of the agency's workforce were women; 8% (566) of the agency's workforce were veterans. Equal Employment
PROBABLE RETIREESEMPLOYEES ELIGIBLE TO RETIRE WITH FULL BENEFITS BY 2022
POSSIBLE RETIREES2,770
42% EMPLOYEES ELIGIBLE TO RETIRE WITH REDUCED OR FULL BENEFITS BY 2022
1,28220%
Data source: WSDOT Office of Human Resources and Safety.Note: Number of employees are reported for the quarter ending March 2018, while possible retirees and probable retirees reported are for the quarter ending September 2017.
280 MORE EMPLOYEES THAN IN THE SAME QUARTER ONE YEAR AGO
WSDOT FULL TIME EMPLOYEES6,866
Return toTable of
Contents

Stewardship – Workforce Development32 | GNB Edition 69 | March 2018
indicate that the agency increased its recruitments by at least 31%, far exceeding its goal of a 5% to 10% increase.
In April 2017, WSDOT implemented the pilot program to assist its efforts to recruit high-demand and hard-to-fill maintenance positions and advance WSDOT’s employment goals and initiatives. As of April 2018, preliminary results indicate the overall referral rate from this program was 46%, well above the initial estimated referral rate of 25%. There were 67 hires in the job classifications eligible for the pilot. Referrals totaled 31 with 16 qualifying for an incentive payment.
WSDOT is evaluating the preliminary data and will decide the future of the Northwest Region program and whether to extend it to other regions in the state.
WSDOT’s retirement forecasts guide recruitment outreach efforts. The incentive program provides eligible employees with a lump-sum payment of $200 per hired referral.
Most WSDOT employees satisfied with their jobsSeventy-one percent of WSDOT employees are, in general, satisfied with their jobs, while 63% would recommend the agency as a great place to work, according to the 2017 Washington State Employee Engagement Survey. WSDOT aims to increase these results by 3%, to 74% and 66%, respectively, by February 2021.
As WSDOT strives to be an employer of choice, efforts like employee engagement surveys,
Opportunity federal and state diversity laws identify “affected groups” as Asian/Pacific Islander, African/American/Black, Hispanic, American Indian/Alaska Native, and Female; State law expands the definition for affirmative action purposes to also include Persons with Disabilities, Disabled Veterans, Vietnam-Era Veterans, and Persons Over Forty Years of Age.
Increased agency presence at career events yields results; hiring increases 10%In 2017, WSDOT launched an Entry-level Engineering Outreach Program designed to combine the outreach efforts of the agency's recruitment team with engineers from around the state, identifying talent by traveling to various colleges within the U.S. and around the state. WSDOT outreach efforts also focus on other entry-level classifications such as the Maintenance Technician 2 and Ordinary Seaman positions.
WSDOT attended 25 career events in 2017, and 28 career events in 2018, as of April 30. These events focus on outreach to diverse pools of candidates, especially within engineering positions. Approximately 1,150 positions were filled in 2017, a 12% increase over the 1,026 positions filled in 2016). To help employees climb the career ladder, WSDOT makes career services presentations designed to help strengthen employees' interviewing skills and application materials.
Referral program exceeds goal
Preliminary results of a pilot Referral Incentive Program in WSDOT's Northwest Region (Seattle area)
Talent Pipelines strategy aims to strengthen, diversify the agency
Through its "Talent Pipelines" strategy, WSDOT is exploring a variety of initiatives to strengthen, diversify and engage the pool of candidates who apply when relevant roles are created or open. The strategy changes recruiting from a reactive activity—looking for workers only when a position is open—to a proactive activity, thinking about the future needs of the organization, particularly when retirements loom large. Ultimately, WSDOT wants its workforce to reflect the diverse communities the agency serves.
Michelle McNamara, South Central Region,and Oscar Cerda, Office of Equal Opportunity, encourage participants to consider WSDOT careers at the Congressman Newhouse Career Fair held in the Tri-Cities in April 2018.
Cody Buchanan, a WSDOT recruiter, attends King County Construction Career Day in Seattle in October 2017.

Stewardship – Workforce Development GNB Edition 69 | March 2018 | 33
well-being assessments and exit interviews not only deliver performance information, but also provide feedback leading to improvements in the employee experience. Another example of such efforts, WSDOT wellness activities and assessments, was reported in Gray Notebook 68, pp. 14-15.
Overall work environment satisfies most WSDOT employees
Fifty-nine percent of WSDOT employees are satisfied with their overall work environment, according to the 2017 Washington State Employee Engagement Survey. WSDOT's goal is to increase satisfaction by 6%, to 65% by February 2021. Overall work environment measures include:
Æ Flexibility – the ability for an employee to adjust scheduled hours as needed;
Æ Mobility – the ability for an employee to work remotely from home or alternative sites;
Æ Physical space – the building, furniture, lighting, noise and variety of spaces for different work tasks (see Gray Notebook 67, p. 26 for more information on how WSDOT is creating a Modern Work Environment through its buildings);
Æ Technology – the employee's work desktop computer, laptop, mobile phone, tablet, remote access, and more; and
Æ Well-being – how the work environment affects an employee's physical, social and emotional health.
More employees teleworkTen percent of WSDOT's eligible employees telework—work from home or another remote location at least two days a month. This is an increase from 8% a year ago. The agency's goal is to improve telework participation rates to 12% by December 2020.
Telework and flexible work schedules help the agency implement Gov. Jay Inslee’s Executive Order 16-07, “Building a Modern Work Environment.”
Telework is an effective strategy to reduce emissions from employee commuting and energy consumption in WSDOT facilities. WSDOT believes telework, compressed work weeks and flexible schedules enhance productivity, job satisfaction and morale. These strategies help retain and recruit talent, provide continuity of operations, and meet future agency office space requirements.
At the end of the first quarter of calendar year 2018 (March 31), 56.1% (3,106) of eligible WSDOT employees were working a compressed work week schedule compared to 66.5% (3,947) reported a year ago. In a compressed work schedule, employees work fewer than 10 days every two weeks, but work longer hours each day. In the same time period, approximately 53.8% (3,659) of eligible WSDOT employees were working flexible schedules compared to 63% (3,214) reported one year ago. A flexible work schedule is one outside the core business hours of 8 a.m. to 5 p.m. The agency’s participation targets for these are 67% and 63%, respectively.
The apparent decrease in participation in compressed work weeks and flexible schedules occurred because vacant positions were counted in the previous report; the data collection error has been corrected and the 2018 numbers more accurately reflect actual participation.
Infant at Work pilot successful, 18 new parents enrolled
From March 2017 to March 2018, 14 eligible employees participated in a pilot program that allowed them to bring their infants to work at WSDOT, instead of having to take leave. The Infant At Work (IAW) pilot program was established as part of the Modern Work Environment initiative, in an effort to support a positive work/life balance and productivity for eligible employees who were new parents or legal guardians of a single infant. The successful pilot means the IAW Program has become WSDOT policy; in April 2018 four new parents enrolled in the program.
Supervisors complete entry level management training
In 2017, 171 WSDOT supervisors completed a “Leading Others” supervisory training provided by the state’s Department of Enterprise Services, compared to five in 2016. Leading Others, a pilot in 2016, was adopted as an official training for WSDOT supervisors.
WSDOT has partnered with Department of Enterprise Services to offer five WSDOT-only leadership courses. Two courses currently offered are Leading Others and Leading Teams. Employees are selected to attend training

Stewardship – Workforce Development34 | GNB Edition 69 | March 2018
depending on their level within the agency. The training efforts support the agency’s Talent Development strategy. WSDOT has a goal of providing leadership training to 500 employees by June 2019.
Practical Solutions training supports all three agency strategic plan goals
Since the agency began offering "PS 101: Practical Solutions Approach to Project Development Overview" in April 2016, 853 learners have completed the class. Another 91 learners have completed "PS 201: Multimodal Fundamentals." The vast majority of the learners are WSDOT employees, but the agency has also provided the training to outside stakeholder groups. Both trainings support all three goals of Results WSDOT, the agency's strategic plan by:
1. Helping WSDOT integrate Practical Solutions into its culture,
2. Developing WSDOT's workforce, and
3. Being inclusive through engaging stakeholders before, during and after projects.
"Practical Solutions 101" provides an overview of the Practical Solutions approach as well as WSDOT’s project development process. The WSDOT “Multimodal Fundamentals” course explains why multimodal solutions are critical to the land use and transportation performance nexus. This course targets project development staff in the planning, design, traffic and program management disciplines.
Results WSDOT GoalPRACTICAL SOLUTIONS
WSDOT is advancing the integration of Practical Solutions into its culture and practices. Training is foundational to cost-effectively plan, design, build, operate and maintain the state's transportation system. Practical Solutions curriculum includes community engagement, one of the strategies designed to help the agency achieve Inclusion.
Andrew Beagle, Practical Solutions Engineer, leads a "Multimodal Fundamentals" class as part of the agency's Practical Solutions training efforts. The class was taught to WSDOT Olympic Region employees in Tumwater in January 2018.
Competitive compensation helps attract, retain workers
In 2017, Washington state employees received a 2% general wage increase. In addition, WSDOT successfully bargained to increase compensation for employees in 22 job classifications. Those targeted increases helped to supplement areas with documented recruitment and/or retention issues. Compensation requests are subject to criteria in state law, collective bargaining with unions, and legislative approval. Such requests are important as the agency strives to maintain competitive salaries to attract and retain a world-class workforce in support of WSDOT’s Workforce Analysis and Growth strategy.
Workforce Analysis and Growth is a component of the agency’s Workforce Development goal, with initiatives designed to:
Æ Build career ladders within the agency,
Æ Ensure job classifications accurately describe the job duties and responsibilities performed by WSDOT employees,
Æ Effectively communicate job classes and or geographic locations where WSDOT is experiencing recruitment and/or retention difficulties due to compensation lagging the market, and
Æ Maintain a management compensation structure that fairly reflects work responsibilities, management skill requirements and reporting accountability.
Contributors include Amber Erdahl, Amy Fermo, Heidi Mabbott, Alvina Mao, Kate Severson, Pam Smith
and Yvette Wixson
GNB Edition 69 | March 2018 | 35 Stewardship – Capital Projects Delivery Programs
CAPITAL PROJECT DELIVERY PROGRAMSQUARTERLY UPDATES69
WSDOT completes one Connecting Washington contract WSDOT completed one Connecting Washington (CW) funded contract in the third quarter of the 2017-2019 biennium (January through March 2018). The agency has completed six CW projects totaling $7.8 million and 10 contracts totaling $28.9 million since the funding package was passed in 2015. Contracts are parts of larger projects (see p. 40 for additional information).
WSDOT did not complete any additional Nickel or Transportation Partnership Account (TPA) projects or contracts during the quarter. WSDOT has completed 380 total Nickel and TPA construction projects since July 2003, with 87% on time and 91% on budget. The agency currently has six Nickel and TPA projects underway (see p. 41 for additional information).
The cost at completion for the 380 Nickel and TPA construction projects is $9.41 billion, 1.5% less than the baseline cost of $9.69 billion. As of March 31, 2018, WSDOT had 19 Nickel and TPA projects yet to be completed, with a total value of approximately $5.92 billion.
Nickel, TPA funding continue to be lower than original 2003 and 2005 projectionsFuel tax collections show 2003 and 2005 revenue forecasts, which were used to determine project lists, did not anticipate the economic recession in projecting future growth in fuel tax revenues. The 2003 Nickel and 2005 TPA gas taxes that fund projects are based on a fixed tax rate per gallon and do not change with the price of fuel. As such, reduced gasoline and diesel consumption and sales lead to reduced tax revenue.
The 2003 Nickel transportation package was originally a 10-year plan, with revenues forecasted to total $1.9 billion from 2003 through 2013. Fuel tax revenues collected during this period were 10.2% lower than the original March 2003 projection.
Fuel tax funding from the 2005 TPA package was also lower than the original March 2005 projection. The original projection for the TPA account was $4.9 billion over a 16-year period from 2005 through 2021. Current TPA projections through 2021 are estimated to be $4.0 billion, roughly $900 million (18.4%) less than the original 2005 projection.
Nickel and TPA gas tax revenues are used to pay the debt on the bonds sold to finance the planned projects. Once all the bonds are sold, revenues collected will be used to pay the debt.
Beige Page contributors include Mike Ellis, Penny Haeger, Heather Jones, Thanh Nguyen, Theresa Scott, Aaron Ward, Kathryn Blumhardt, Joe Irwin and Kate Wilfong
Notable results Æ WSDOT completed one Connecting
Washington contract in the third quarter of the 2017-2019 biennium
Æ WSDOT removed 36 projects from its Watch List during the third quarter of the 2017-2019 biennium; one remains
Æ WSDOT advertised 102 of 151 Pre-existing Funds projects during the third quarter of the 2017-2019 biennium
Return toTable of
Contents

36 | GNB Edition 69 | March 2018 Stewardship – Current Legislative Evaluation & Accountability Program
CURRENT LEGISLATIVE EVALUATION & ACCOUNTABILITY PROGRAM QUARTERLY UPDATE69
Combined Nickel & Transportation Partnership Account Status of projects to date; 2003 through March 31, 2018; Dollars in millions
Number of Projects
Value of Program1
Subtotal of completed construction projects2 380 $9,689.8 Non-construction projects that have been completed or otherwise removed from Nickel/TPA lists3, 4 5 $74.4
Projects included in the current transportation budget but not yet complete 19 $5,916.0 Projects that have been deferred indefinitely or deleted and removed from Nickel/TPA lists 3, 4 13 $499.2
Projects now funded by Connecting Washington and removed from Nickel/TPA lists (see GNB 63, p. 35) 4 $101.7
Total number of projects5 in improvement and preservation budget 421 $16,281.2
Schedule and budget summary Nickel & TPA combined: Results of completed construction projects in the current Legislative Transportation Budget and prior budgets; Dollars in millions
Completed in 2017- 2019
Biennium Budget
Cumulative Program
Total number of projects completed 3 380
Percent completed early or on time 33% 87%
Percent completed under or on budget 67% 91%
Baseline cost at completion $2,713.0 $9,689.8
Current cost at completion $2,714.6 $9,541.2
Percent of total program over or under budget 0.1% over 1.5% under
Advertisement record: Results of projects entering the construction phase or under construction Combined Nickel & TPA
Total current number of projects in construction phase as of March 31, 2018 6 Percent advertised early or on time 100%
Total number of projects advertised for construction during the 2017-2019 biennium (July 1, 2017, through June 30, 2019) 0
Percent advertised early or on time N/A
Projects to be advertised: Results of projects now being advertised for construction or planned to be advertised Combined Nickel & TPA
Total number of projects being advertised for construction (April 1 through September 30, 2018) 0
Percent on target for advertisement on schedule or early N/A
Budget status for the 2017-2019 biennium; Dollars in millions WSDOT biennial budgetBudget amount for 2017-2019 biennium $1,036.6
Actual expenditures in 2017-2019 biennium to date (July 1, 2017, through March 31, 2018) $263.3 Total 2003 Transportation Funding Package (Nickel) expenditures $60.7
Total 2005 Transportation Partnership Account expenditures $171.7
Total Pre-existing Funds expenditures6 $30.9
Data source: WSDOT Capital Program Development and Management. Notes: Numbers have been rounded. This chart was updated in GNB 63 to reflect reconciled Nickel and TPA project counts, and as a result it does not exactly match Current Legislative Evaluation and Accountability Program charts from editions prior to GNB 63. 1 Dollars in millions. 2 Cumulative projects completed from July 1, 2003, to March 31, 2018. 3 Non-construction projects include commitments for engineering and right of way work. 4 Projects that have been deferred indefinitely or deleted include projects that have no funding available, projects that have been halted by the Legislature and those for which other entities (e.g., cities and counties) are now serving as the lead agency. 5 The project total has been updated to show “unbundled” projects which may have been previously reported in programmatic construction groupings (such as Roadside Safety Improvements or Bridge Seismic Retrofit). See Gray Notebook 38, p. 55 for more details. 6 For more information on the Pre-existing Funds program, see pp. 43-46.
Return toTable of
Contents

Stewardship – Current Legislative Evaluation & Accountability Program GNB Edition 69 | March 2018 | 37
Current Legislative Evaluation and Accountability Program rail projects as of March 31, 2018; Dollars in millions
2003 Nickel Package
2005 TPA Package
CombinedNickel & TPA
Schedule, scope and budget summary of completed LEAP projectsCumulative to date (July 1, 2003 through March 31, 2018) 14 8 22
Percent completed early or on time1 100% 100% 100%
Percent completed within scope1 100% 100% 100%
Percent completed on or under budget1 100% 100% 100%
Baseline cost at completion $200.0 $57.6 $257.6
Current cost at completion $199.9 $57.6 $257.5
Percent of total program on or under budget1 100% 100% 100%
Advertisement record of LEAP projects under construction or entering the construction phaseCumulative to date (July 1, 2003 through March 31, 2018) 1 2 3
Total projects advertised 0 1 1
Percent advertised early or on time N/A 100% 100%
Total award amounts to date $0 $9.0 $9.0
Data source: WSDOT Capital Program Development and Management.Notes: Numbers may not total 100% due to rounding. The rail projects are primarily delivered through master agreements with BNSF, which administers construction activities on the projects. The data above is unchanged from the previous quarter because no additional rail projects were completed. 1 Rail projects are commitments delivered by BNSF, Sound Transit, ports and operators. Master agreements between WSDOT and lead agencies become the documents that govern the delivery of the project including budget, scope and schedule. The administrative process allows for amendments enabling the projects to be delivered within the parameters of the new amended agreement (on time, and on budget).
Current Legislative Evaluation and Accountability Program ferries projects as of March 31, 2018; Dollars in millions
2003 Nickel Package
2005 TPA Package
CombinedNickel & TPA
Schedule, scope and budget summary of completed LEAP projectsCumulative to date (July 1, 2003 through March 31, 2018) 13 10 23
Percent completed early or on time1 100% 100% 100%
Percent completed within scope1 100% 100% 100%
Percent completed on or under budget1 100% 100% 100%
Baseline cost at completion $303.7 $343.5 $647.2
Current cost at completion $303.7 $343.5 $647.2
Percent of total program on or under budget1 100% 100% 100%
Advertisement record of LEAP projects under construction or entering the construction phaseCumulative to date (July 1, 2003 through March 31, 2018) 0 0 0
Total projects advertised 0 0 0
Percent advertised early or on time N/A N/A N/A
Total award amounts to date $0 $0 $0
Data source: WSDOT Capital Program Development and Management. Notes: Percentages may not total 100% due to rounding. 1 The Legislature funds Ferries’ projects at a grouped-project or Budget Identification Number (BIN) level for terminals and vessels; however, the delivery of construction projects requires that each of these BIN groups be broken into sub-projects with specific scopes, budgets and schedules. The list of sub-projects is updated as the project progresses into the design phase and the budget and schedule are better defined. This process enables WSDOT to deliver the projects within the updated budget amounts and milestones (on time, and on budget).
WSDOT completes 22 rail and 23 ferries projects with Nickel and TPA funds

38 | GNB Edition 69 | March 2018 Stewardship – Completed Projects & Contracts
COMPLETED PROJECTS & CONTRACTS QUARTERLY UPDATE69
Measuring operationally complete projectsProjects and contracts are “on time” if they are operationally complete within the quarter planned in the last approved schedule, and “on budget” if costs are within 5% of the last approved budget.
Delivery performance of completed projects and contracts is measured against the last approved schedules and budgets in accordance with criteria established by the Legislature. In addition to the last approved budgets and schedules for these projects and contracts, initial budgets and schedules are included to show changes that may have occurred during design and construction phases.
For information on previously completed Nickel, TPA and CWA projects, visit www.wsdot.wa.gov/projects/completed.
WSDOT reports one completed contract during the quarterWSDOT completed one Connecting Washington (CW) contract in the third quarter of the 2017-2019 biennium (January through March 2018).
I-5/Mounts Road Vicinity - Variable Message Sign (CW) PIERCE COUNTY
This contract installed a Variable Message Sign (VMS) on northbound I-5 approaching Mounts Road near DuPont. It is part of the larger I-5/Joint Base Lewis-McChord (JBLM) Corridor Improvements project.
Project benefits: The VMS was installed prior to the beginning of construction on the I-5, Steilacoom-Dupont Road to Thorne Lane - Corridor Improvements contract, which is also part of the I-5/Joint Base Lewis-McChord Corridor Improvements project. The VMS will provide useful information to drivers in this area during the course of this contract, which will widen I-5 from Exit 119 to Exit 124. In addition, the VMS will improve future corridor congestion management and safety in the area.
Budget performance: This contract was operationally complete for $474,000, on budget with respect to the last approved budget. This contract is part of the I-5 JBLM Corridor Improvements project, so it did not have an individual initial budget.
Schedule performance: This project was operationally complete in January 2018, on time with respect to the initial and last approved schedule.
Contract reportingThe Gray Notebook differentiates completed projects from completed contracts. Contracts are basically smaller segments of larger projects (for example pavement repairs to a section of I-5 that are part of a larger concrete rehabilitation program). Completing contracts may or may not mean these larger projects are finished.
This Variable Message Sign on northbound I-5 approaching Mounts Road near DuPont is part of the larger I-5/Joint Base Lewis-McChord (JBLM) Corridor Improvements project and will improve future corridor congestion management and safety in the area.
Return toTable of
Contents
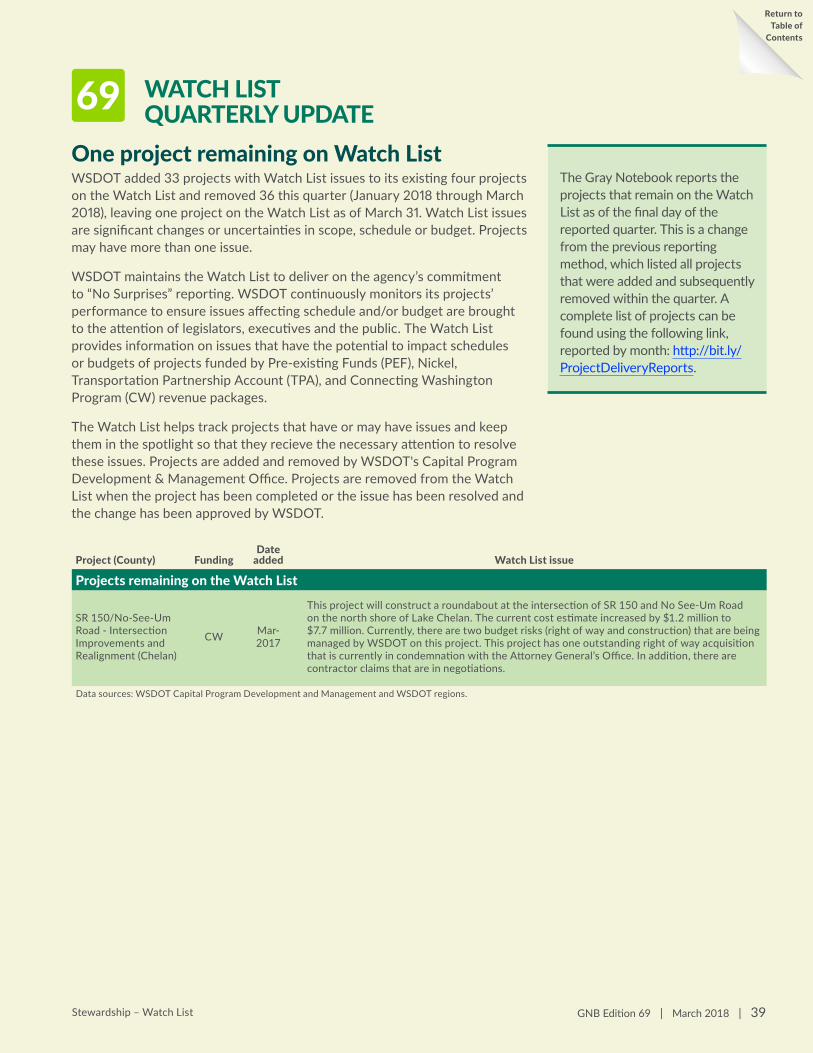
GNB Edition 69 | March 2018 | 39 Stewardship – Watch List
WATCH LIST QUARTERLY UPDATE69
Project (County) FundingDate
added Watch List issue
Projects remaining on the Watch List
SR 150/No-See-Um Road - Intersection Improvements and Realignment (Chelan)
CW Mar-2017
This project will construct a roundabout at the intersection of SR 150 and No See-Um Road on the north shore of Lake Chelan. The current cost estimate increased by $1.2 million to $7.7 million. Currently, there are two budget risks (right of way and construction) that are being managed by WSDOT on this project. This project has one outstanding right of way acquisition that is currently in condemnation with the Attorney General’s Office. In addition, there are contractor claims that are in negotiations.
Data sources: WSDOT Capital Program Development and Management and WSDOT regions.
One project remaining on Watch List WSDOT added 33 projects with Watch List issues to its existing four projects on the Watch List and removed 36 this quarter (January 2018 through March 2018), leaving one project on the Watch List as of March 31. Watch List issues are significant changes or uncertainties in scope, schedule or budget. Projects may have more than one issue.
WSDOT maintains the Watch List to deliver on the agency’s commitment to “No Surprises” reporting. WSDOT continuously monitors its projects’ performance to ensure issues affecting schedule and/or budget are brought to the attention of legislators, executives and the public. The Watch List provides information on issues that have the potential to impact schedules or budgets of projects funded by Pre-existing Funds (PEF), Nickel, Transportation Partnership Account (TPA), and Connecting Washington Program (CW) revenue packages.
The Watch List helps track projects that have or may have issues and keep them in the spotlight so that they recieve the necessary attention to resolve these issues. Projects are added and removed by WSDOT's Capital Program Development & Management Office. Projects are removed from the Watch List when the project has been completed or the issue has been resolved and the change has been approved by WSDOT.
The Gray Notebook reports the projects that remain on the Watch List as of the final day of the reported quarter. This is a change from the previous reporting method, which listed all projects that were added and subsequently removed within the quarter. A complete list of projects can be found using the following link, reported by month: http://bit.ly/ProjectDeliveryReports.
Return toTable of
Contents
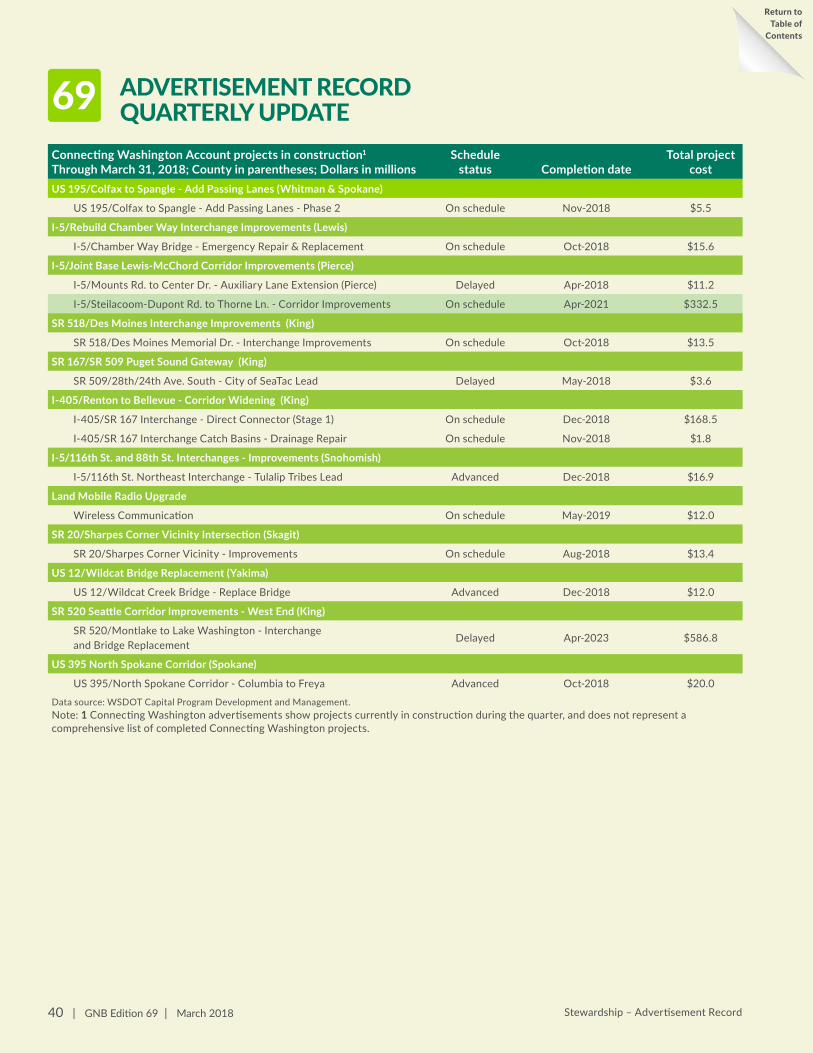
40 | GNB Edition 69 | March 2018 Stewardship – Advertisement Record
ADVERTISEMENT RECORDQUARTERLY UPDATE69
Connecting Washington Account projects in construction1 Through March 31, 2018; County in parentheses; Dollars in millions
Schedule status Completion date
Total project cost
US 195/Colfax to Spangle - Add Passing Lanes (Whitman & Spokane)
US 195/Colfax to Spangle - Add Passing Lanes - Phase 2 On schedule Nov-2018 $5.5
I-5/Rebuild Chamber Way Interchange Improvements (Lewis)
I-5/Chamber Way Bridge - Emergency Repair & Replacement On schedule Oct-2018 $15.6
I-5/Joint Base Lewis-McChord Corridor Improvements (Pierce)
I-5/Mounts Rd. to Center Dr. - Auxiliary Lane Extension (Pierce) Delayed Apr-2018 $11.2
I-5/Steilacoom-Dupont Rd. to Thorne Ln. - Corridor Improvements On schedule Apr-2021 $332.5
SR 518/Des Moines Interchange Improvements (King)
SR 518/Des Moines Memorial Dr. - Interchange Improvements On schedule Oct-2018 $13.5
SR 167/SR 509 Puget Sound Gateway (King)
SR 509/28th/24th Ave. South - City of SeaTac Lead Delayed May-2018 $3.6
I-405/Renton to Bellevue - Corridor Widening (King)
I-405/SR 167 Interchange - Direct Connector (Stage 1) On schedule Dec-2018 $168.5
I-405/SR 167 Interchange Catch Basins - Drainage Repair On schedule Nov-2018 $1.8
I-5/116th St. and 88th St. Interchanges - Improvements (Snohomish)
I-5/116th St. Northeast Interchange - Tulalip Tribes Lead Advanced Dec-2018 $16.9
Land Mobile Radio Upgrade
Wireless Communication On schedule May-2019 $12.0
SR 20/Sharpes Corner Vicinity Intersection (Skagit)
SR 20/Sharpes Corner Vicinity - Improvements On schedule Aug-2018 $13.4
US 12/Wildcat Bridge Replacement (Yakima)
US 12/Wildcat Creek Bridge - Replace Bridge Advanced Dec-2018 $12.0
SR 520 Seattle Corridor Improvements - West End (King)
SR 520/Montlake to Lake Washington - Interchange and Bridge Replacement
Delayed Apr-2023 $586.8
US 395 North Spokane Corridor (Spokane)
US 395/North Spokane Corridor - Columbia to Freya Advanced Oct-2018 $20.0
Data source: WSDOT Capital Program Development and Management.Note: 1 Connecting Washington advertisements show projects currently in construction during the quarter, and does not represent a comprehensive list of completed Connecting Washington projects.
Return toTable of
Contents

Stewardship – Advertisement Record GNB Edition 69 | March 2018 | 41
Nickel & TPA projects in construction Through March 31, 2018; County in parentheses; Dollars in millions
Fund type
Advertised on time Ad date
Operationallycomplete date
Award amount
I-5 Concrete Rehabilitation Program (King) Nickel
I-5/Northbound South 260th to Duwamish River Bridge - Concrete Rehab Nickel N/A Nov-2016 Oct-2018 $30.8
I-5/Northbound Boeing Access Rd. to Northeast Ravenna Bridge - Pavement Repair Nickel N/A Dec-2016 Sep-2019 $38.6
Work associated with the I-5/Northbound South Spokane St. Vicinity - Concrete Pavement Replacement, and I-5/Northbound I-90 Vicinity to James St. Vicinity - Concrete Pavement Replacement is included in I-5/Northbound Boeing Access Rd. to Northeast Ravenna Bridge - Pavement Repair.
SR 99 Alaskan Way Viaduct Replacement (King) Nickel/TPA
SR 99/South King Street Vicinity to Roy Street – Viaduct Replacement
Nickel/TPA √ May-2010 To be
determined $1,089.7
The schedule for this project changes frequently and WSDOT cannot verify the contractor's schedule at this time.
US 395/North Spokane Corridor (NSC) – Design and Right of Way – New Alignment (Spokane)
Nickel/TPA
US 395/NSC Freya St. - Structures TPA N/A Dec-2016 Nov-2018 $7.6
I-5/Tacoma HOV Improvements (Pierce) Nickel/TPA
I-5/SR 16 Interchange - Construct HOV Connections TPA √ Feb-2016 Oct-2019 $121.6
I-5/Portland Ave to Port of Tacoma Rd. - Northbound HOV TPA Late Sep-2014 Jul-2018 $152.6
I-5/M Street to Portland Avenue – Add HOV Lanes Nickel √ Mar-2014 Aug-2018 $99.9
I-90/Snoqualmie Pass East – Hyak to Keechelus Dam – Corridor Improvement (Kittitas) TPA
I-90/Snowshed to Keechelus Dam to Stampede Pass - Add Lanes/ Build Wildlife Bridges TPA Late Feb-2015 Oct-2018 $72.8
I-90/Snowshed to Keechelus Dam Phase 1C – Replace Snowshed and Add Lanes Advertisement was delayed to address fire and safety issues with the original snowshed design, resulting in long-term savings.
TPA Late Apr-2011 Oct-2018 $177.1
I-90/Concrete Rehabilitation1 (multiple counties) Nickel
Data source: WSDOT Capital Program Development and Management.Note: 1 The next I-90 concrete rehabilitation contract is scheduled to be advertised in 2019, but no contracts are currently under construction. It is listed here because it is an ongoing Nickel project.

42 | GNB Edition 69 | March 2018 Stewardship – Schedule & Budget Summaries
SCHEDULE & BUDGET SUMMARIESQUARTERLY UPDATE69
Biennial summary of Nickel and Transportation Partnership Account projectsCosts estimated at completion; Dollars in millions
Cumulative to date Fund type
Advertised on time1
Completed on time
Within scope
Baseline cost
Current cost
Completed on budget2
2017-2019 biennium summaryThis information is updated quarterly during the biennium
0 Nickel3 TPA
1 on time2 late
1 on time 2 late 1 $2,713.0 $2,714.6 1 on budget
2 over budget
2015-2017 biennium summary 0 Nickel11 TPA
7 on time4 late
10 on time 1 late 11 $809.9 $777.7 10 on budget
1 over budget
2013-2015 biennium summary 6 Nickel15 TPA
16 on time5 late
15 on time6 late 21 $555.7 $514.0 18 on budget
3 over budget
2011-2013 biennium summary 5 Nickel36 TPA
31 on time10 late
32 on time9 late 41 $1,485.5 $1,459.6 37 on budget
4 over budget
2009-2011 biennium summary 16 Nickel74 TPA
73 on time17 late
80 on time10 late 90 $1,641.6 $1,597.0 85 on budget
5 over budget
2007-2009 biennium summary 42 Nickel69 TPA
91 on time20 late
96 on time15 late 111 $1,685.7 $1,685.2 102 on budget
9 over budget
2005-2007 biennium summary 52 Nickel24 TPA
71 on time5 late
68 on time8 late 76 $673.9 $668.8 67 on budget
9 over budget
2003-2005 biennium summary 27 Nickel 25 on time2 late
27 on time0 late 27 $124.6 $124.4 25 on budget
2 over budget
Data source: WSDOT Capital Program Development and Management. Notes: Dollar amounts are rounded up. 1 Projects are “on time” if they are operationally complete within the quarter planned in the last approved schedule. 2 Projects are “on budget” if the costs are within 5% of the last approved budget.
WSDOT reports three change orders of $500,000 or more during the quarterDuring the quarter ending March 31, 2018, WSDOT approved three change orders of $500,000 or more. These totaled approximately $4.27 million, with $1 million in credits to WSDOT and approximately $3.27 million in debits. The first change order, valued at about $2.27 million, covered costs associated with the restoration of Alaskan Way Street between South King Street and Yesler Way following the SR 99 Tunnel Project construction. One change order, valued at approximately $1 million, involved additional costs to include storm sewers for unanticipated stormwater runoff on the I-5 Portland Avenue to Port of Tacoma Road Northbound High Occupancy Vehicle (HOV) project. The storm sewers are necessary because WSDOT added the southbound HOV lanes to the northbound bridge to utilize all of the available road space. For the last change order, WSDOT was credited $1 million to settle outstanding disputes with the Design Builder, Eastside Corridor Constructors, regarding costs, delay, impacts and risks associated with the SR 520 Eastside Transit and HOV project.
After an extensive review—which can involve subject matter experts, contract specialists and other outside stakeholders—WSDOT sometimes changes its engineers’ original plans and specifications in order to complete projects. When this occurs, WSDOT issues a formal modification (or change order) to the contract containing a description of the change and details about how or if the contractor may be compensated for it. Each month, WSDOT posts all change orders estimated to cost $500,000 or more online at http://bit.ly/WSDOTchangeorders.
Return toTable of
Contents
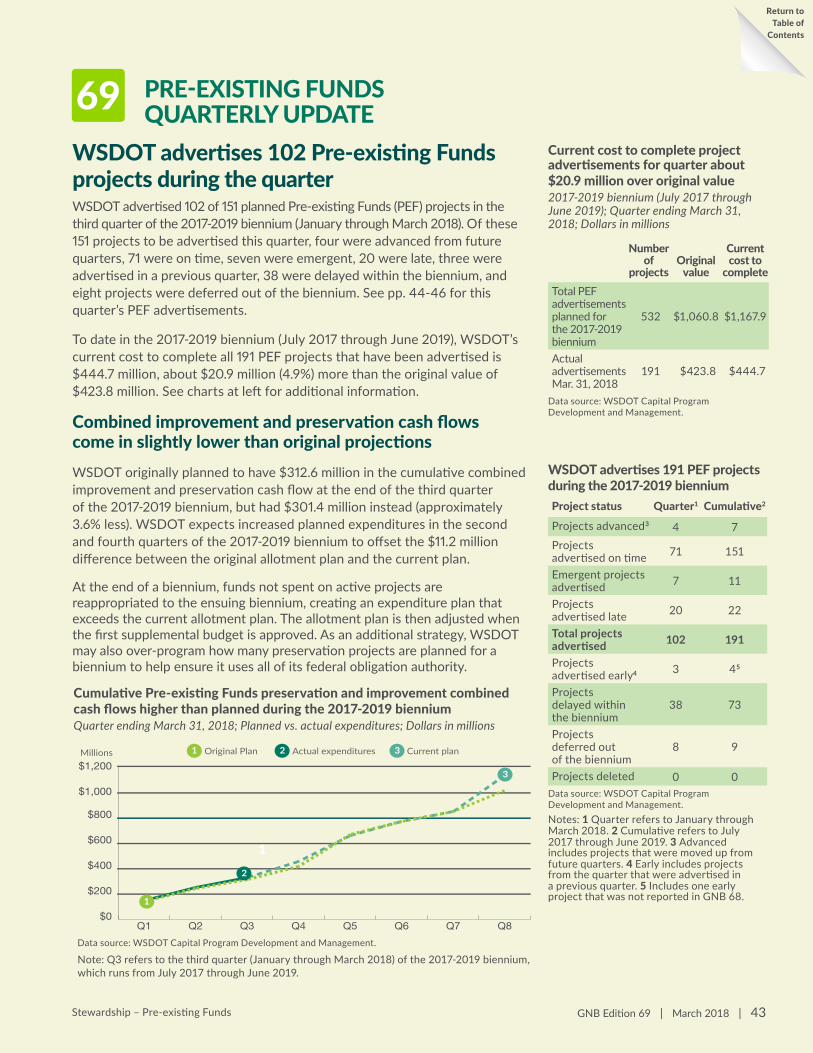
GNB Edition 69 | March 2018 | 43 Stewardship – Pre-existing Funds
PRE-EXISTING FUNDSQUARTERLY UPDATE69
Current cost to complete project advertisements for quarter about $20.9 million over original value2017-2019 biennium (July 2017 through June 2019); Quarter ending March 31, 2018; Dollars in millions
Number of
projects Original
value
Current cost to
completeTotal PEF advertisements planned for the 2017-2019 biennium
532 $1,060.8 $1,167.9
Actual advertisements Mar. 31, 2018
191 $423.8 $444.7
Data source: WSDOT Capital Program Development and Management.
WSDOT advertises 191 PEF projects during the 2017-2019 bienniumProject status Quarter1 Cumulative2
Projects advanced3 4 7Projects advertised on time 71 151
Emergent projects advertised 7 11
Projects advertised late 20 22
Total projects advertised 102 191
Projects advertised early4 3 45
Projects delayed within the biennium
38 73
Projects deferred out of the biennium
8 9
Projects deleted 0 0Data source: WSDOT Capital Program Development and Management.Notes: 1 Quarter refers to January through March 2018. 2 Cumulative refers to July 2017 through June 2019. 3 Advanced includes projects that were moved up from future quarters. 4 Early includes projects from the quarter that were advertised in a previous quarter. 5 Includes one early project that was not reported in GNB 68.
WSDOT advertises 102 Pre-existing Funds projects during the quarter
Cumulative Pre-existing Funds preservation and improvement combined cash flows higher than planned during the 2017-2019 bienniumQuarter ending March 31, 2018; Planned vs. actual expenditures; Dollars in millions
Data source: WSDOT Capital Program Development and Management.
Note: Q3 refers to the third quarter (January through March 2018) of the 2017-2019 biennium, which runs from July 2017 through June 2019.
$0
$200
$400
$600
$800
$1,000
$1,200
Q8Q7Q6Q5Q4Q3Q2Q1
Original Plan Actual expenditures Current plan
1
1
1
2
2
Millions 3
3
WSDOT advertised 102 of 151 planned Pre-existing Funds (PEF) projects in the third quarter of the 2017-2019 biennium (January through March 2018). Of these 151 projects to be advertised this quarter, four were advanced from future quarters, 71 were on time, seven were emergent, 20 were late, three were advertised in a previous quarter, 38 were delayed within the biennium, and eight projects were deferred out of the biennium. See pp. 44-46 for this quarter’s PEF advertisements.
To date in the 2017-2019 biennium (July 2017 through June 2019), WSDOT’s current cost to complete all 191 PEF projects that have been advertised is $444.7 million, about $20.9 million (4.9%) more than the original value of $423.8 million. See charts at left for additional information.
Combined improvement and preservation cash flows come in slightly lower than original projectionsWSDOT originally planned to have $312.6 million in the cumulative combined improvement and preservation cash flow at the end of the third quarter of the 2017-2019 biennium, but had $301.4 million instead (approximately 3.6% less). WSDOT expects increased planned expenditures in the second and fourth quarters of the 2017-2019 biennium to offset the $11.2 million difference between the original allotment plan and the current plan.
At the end of a biennium, funds not spent on active projects are reappropriated to the ensuing biennium, creating an expenditure plan that exceeds the current allotment plan. The allotment plan is then adjusted when the first supplemental budget is approved. As an additional strategy, WSDOT may also over-program how many preservation projects are planned for a biennium to help ensure it uses all of its federal obligation authority.
Return toTable of
Contents

Stewardship – Pre-existing Funds44 | GNB Edition 69 | March 2018
Advanced (4)
SR 14/Chamberlain Sewer - Minor Rehabilitation - Southwest Region SR 167/Milwaukee Ave. to Pierce County Line - Paving
Regionwide Curve Warning Signs (2017-2019) SR 503/Rock Creek Rd. to Williams Rd. Vicinity - Pavement Rehabilitation
On time (71)
I-5/Southbound South Lucile St. to Spring St. - ADA Compliance SR 524/Great Dane Creek - Fish Passage
I-5/James Street Express Lane Barrier Gate Repair North Central Region 2017-2019 Weathering Steel Guardrail Rehabilitation
I-5/Stillaguamish River Bridge to Hill Ditch Bridge - Portland Cement Concrete Pavement Rehabilitation US 97/1.7 Miles North of Blewett Pass - Culvert Replacement
I-5/236th St. Northeast to Starbird Rd. Interchange - Ramp Paving US 97/4.7 Miles North of Blewett Pass - Culvert Replacement
I-5/SR 532 Interchange - ADA Compliance SR 153/Methow River Bridge Milepost 22.3 - Structural Rehabilitation
SR 9/Francis Rd. - Intersection Improvements SR 153/Methow River Bridges - Structural Rehabilitation
SR 9/SR 20 to Park Cottage Place - Paving SR 153/Methow River Bridge Milepost 13.5 - Structural Rehabilitation
SR 9/SR 20 to Park Cottage Place - ADA Compliance I-5/Martin Way Bridge - Special Repair
SR 18/Westbound West Valley Highway South Vicinity to Auburn Black Diamond Rd. Vicinity - Paving SR 7/South of La Grande Rd. East to Intersection of SR 702 - Chip Seal
SR 18/Westbound Auburn Black Diamond Rd. Vicinity to Jenkins Creek - Paving US 12/South of Sargent Blvd. to Wynoochee River - Paving
SR 18/Westbound Southeast 304th St. On-Ramp - ADA Compliance US 12/Wynoochee River Bridge - Bridge Deck Repair
SR 18/Westbound Jenkins Creek to Southeast 231st St. - Paving US 101/North of Junction SR 109 to North of Ocean Beach Rd. - Chip Seal
SR 18/Southeast 231st St. - ADA Compliance US 12/Unnamed Tributary to Wynoochee River - Remove Fish Barrier
SR 20/SR 9 South Leg to Hansen Creek Vicinity - Paving SR 102/Washington State Corrections Center St. to US 101 - Chip Seal
SR 20/SR 9 South Leg to Ferry Street - ADA Compliance SR 112/Olsen Creek in Vicinity of Vista Dr. - Remove Fish Barrier
SR 99/S Cloverdale St. to Duwamish River - Paving SR 702/88th Ave. South to SR 7 - Chip Seal
SR 99/S Holden St Intersection - ADA Compliance Southwest Region Various Locations - Upgrade Electrical Services
SR 99/Roy St. to North 60th St. - Paving I-205 and I-5 Pavement Rehabilitation
SR 99/Roy St. to North 60th St. - ADA Compliance I-5 Northbound/1 Mile South of Todd Rd. Vicinity to Weigh Station Vicinity - Paving
SR 99/North 60th St. to North 145th St. - Paving I-5 Southbound/1 Mile South of Todd Rd. Vicinity to North Kelso Ave. Vicinity - Paving
SR 99/North 60th St. to North 145th St. - ADA Compliance I-5/1.7 Miles South of Todd Road to Kalama River Rd. - Deck Repair
SR 509/S 112th St. to Duwamish River - Paving US 101/Heath St. to Duryea St. - Replace Enclosed Drainage System
SR 509/South 112th St. Vicinity - ADA Compliance SR 123/US 12 to Lewis County Line - Chip Seal
SR 522/Paradise Lake Rd. Vicinity to Fales Rd. Vicinity - Rumble Strip Installation
SR 432/Tennant Way Railroad Crossing - Update Crossing Signals and Lights
SR 522/SR 9 Vicinity to Echo Lake Rd. Vicinity - Paving SR 432/Cowlitz River Bridge - Painting
SR 522/Eastbound Snohomish River Bridge - Bridge Deck Overlay SR 503 Spur/Speelyai Creek Bridge to Skamania County - Chip Seal
SR 524/Locust & Larch Way - Intersection Improvements US 12/Naches River Nelson Bridge Eastbound - Bridge Painting
Data source: WSDOT Capital Program Development and Management.
WSDOT advertises four advanced Pre-existing Funds projectsJanuary-March 2018

Stewardship – Pre-existing Funds GNB Edition 69 | March 2018 | 45
WSDOT advertises seven emergent Pre-existing Funds projectsJanuary-March 2018
On time continued...
US 12/Naches River Nelson Bridge Westbound - Bridge Painting SR 21/Canniwai Creek to US 2 - Chip Seal
US 12/1 Mile West of Forest Service Rd. 1284 to White Pass Vicinity - Paving SR 21/Keller Ferry to Republic - Chip Seal
I-90/Yakima River Bridge West of Ellensburg Westbound - Deck Rehabilitation SR 25/US 395 to Bossburg - Chip Seal
I-90/Yakima River Bridge East of Cle Elum Westbound - Deck Rehabilitation SR 25/Bossburg to Canada - Chip Seal
I-90/Yakima River Bridge West of Ellensburg Eastbound - Deck Rehabilitation SR 261/Sutton to I-90 - Chip Seal
I-90/Yakima River Bridge East of Cle Elum Eastbound - Deck Rehabilitation SR 291/Charles Rd. to Stevens County Line - Paving
Eastern Region Curve Warning Sign Update 2017-2019 SR 291/Stevens County Line to Suncrest - Paving
Eastern Region Chip Seal Rumble Strips - Install Rumble Strip US 395/Deer Park Corridor Safety Improvements
SR 21/US 395 to I-90 - Chip Seal
Emergent (7)
I-90/Schrag Westbound/Eastbound Safety Rest Area - Pressure Tank Replacement - Eastern Region
SR 167/Southbound 15th St. Southwest Vicinity to 15th St. Northwest Vicinity - Paving
I-5/Northbound Metro North Base Interchange - Approach Slab Repair US 12/US 12 Over East Isaacs Ave. Bridge - Joint Repair
SR 18/Holder Creek - Environmental Mitigation SR 41/Oldtown Bridge Replacement
I-90/Eastbound SR 202 Vicinity to 436th Ave. Southeast - Redirectional Landform Mitigation
Advertised late (20)
I-82/Selah Creek Eastbound Safety Rest Area - Water System Improvements Phase 2 - South Central Region I-182/SR 240 and George Washington Way Interchange - Paving
I-90/Eastbound East Channel Bridge - Modular Expansion Joint Replacement SR 241/Forsell Rd./Green Valley Rd. - Intersection Improvements
I-90/Eastbound East Sunset Way Interchange Vicinity to 436th Ave. Southeast Interchange Vicinity - Pavement Repair US 395/West Kennewick Ave. to I-182 Bridge - ADA Compliance
I-90/Westbound Raging River Bridge - Approach Slab Repair and Concrete Deck Overlay
US 395/BNSF and Union Pacific Railroad and Canal Bridges - Joint Repair
I-90/Eastbound Winery Rd. Bridge - Deck Overlay SR 25/Spokane River Bridge - North Embankment Repair
SR 530/Trafton Creek - Fish Passage US 195/North of Junction SR 23 - Bridge Deck Repair
SR 530/Schoolyard Creek - Fish Passage US 195/North of Junction SR 271 - Bridge Deck Repair
SR 548/Kickerville Rd. - Intersection Improvements US 195/Pine Creek - Bridge Deck Repair
US 97/Swauk Creek Campground - Fish Passage Retrofit US 195/Over John Wayne Trail - Bridge Deck Repair
US 12/Old Highway 12 to Myra Rd. - Chip Seal US 195/Rosalia - Bridge Deck Repair
Data source: WSDOT Capital Program Development and Management.

Stewardship – Pre-existing Funds46 | GNB Edition 69 | March 2018
Advertised early (3)
North Central Region 2017-2019 Regionwide Shoulder Rumble Strip Installation 2017-2019 South Central Region - Region Wide Basic Safety - Signing
South Central Region 2017-2019 Region Wide Curve Warning Signs - Chevron Updates
Delayed within the biennium (38)
I-5/Express Lanes System Entrances - Electronic Sign Replacement Olympic Region - Guardrail Installations
SR 99/South 359th St. Vicinity to South 344th St. Vicinity - Paving (City Lead) SR 7/Pedestrian Crossing - Safety Improvement
SR 525 Spur/SR 525 to SR 526 - Paving US 12/Anderson Rd. to Moon Rd. - Safety Improvement
SR 526/SR 525 to Boeing Access Rd. Vicinity - Paving US 101/5th St. to South H St. - Paving
SR 526/SR 525 to Boeing Access Rd. Vicinity - ADA Compliance US 101/5th St. to South H St. - ADA Compliance
SR 536/Skagit River to I-5 - Paving US 101/Kennedy Creek Bridges - Special Repair
SR 536/Front Street to I-5 - ADA Compliance SR 107/Chehalis River Bridge - Bridge Painting
SR 542/I-5 to Britton Rd. - Paving SR 109/Grass Creek Bridge - Special Repair
SR 542/I-5 to Hannegan Rd. Vicinity - ADA Compliance SR 116/Kilisut Harbor - Remove Fish Barrier
SR 542/Dewey Rd. Vicinity - Culvert Replacement SR 165/Wilkeson Creek Bridge to North of Pearl St. Ct. - Stormwater Retrofit
US 2/Nason Creek Rest Area - ADA Compliance SR 410/Buckley - Rebuild Signals
US 2/Leavenworth Vicinity - ADA Compliance SR 510/Meridian Rd. Southeast - Roundabout
SR 17/Prior Farms - Left Turn Lane SR 14/0.5 Miles East of Cape Horn Slide Bridge - Debris Flow Fence
SR 20/7 Miles West of Rainy Pass - Flood Deflection Berm SR 503/Brush Prairie Railroad Crossing - Bus and Truck Pullout Lanes
I-90/Winchester Rest Areas - ADA Compliance SR 397/East Bruneau Ave. - Railroad Crossing Improvements
US 97/Okanogan River Bridge at Omak - Deck Repair I-90/US 2 Garden Springs to Broadway Ave. - Variable Speed System
SR 153/Methow River Bridge Milepost 11.8 - Structural Rehabilitation I-90/Barker Rd. Intersection Improvements
SR 285/Wenatchee Area - Paving I-90/2nd Ave. West Bridge Westbound On-Ramp - Deck Repair
SR 285/Wenatchee Area - ADA Compliance I-90/3rd Ave. Bridge Westbound On-Ramp - Deck Repair
Deferred out of the biennium (8)
SR 7/SR 507 to South of South 38th St. - Paving I-82/County Line Rd. Interchange - Paving
SR 7/SR 507 to South of South 38th St. - ADA Compliance I-82/Gap Rd. Interchange - Paving
I-82/SR 241 Interchange - Paving I-82/Wine Country Rd. Interchange - ADA Compliance
I-82/Wine Country Rd. Interchange - Paving SR 27/Missouri Flat Creek to Stadium Way - Portland Cement Concrete Pavement Rehabilitation
Data source: WSDOT Capital Program Development and Management.
WSDOT advertises three Pre-existing Funds projects earlyJanuary-March 2018
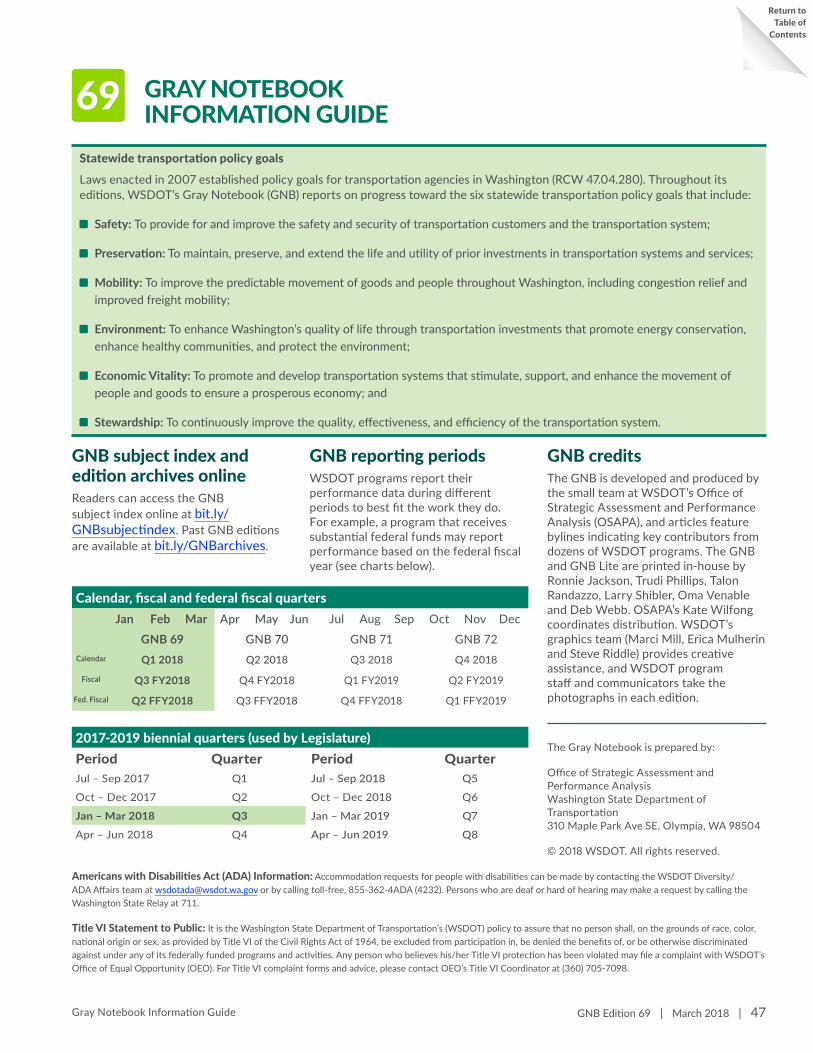
GNB Edition 69 | March 2018 | 47 Gray Notebook Information Guide
GRAY NOTEBOOK INFORMATION GUIDE69
Americans with Disabilities Act (ADA) Information: Accommodation requests for people with disabilities can be made by contacting the WSDOT Diversity/ADA Affairs team at [email protected] or by calling toll-free, 855-362-4ADA (4232). Persons who are deaf or hard of hearing may make a request by calling the Washington State Relay at 711.
Title VI Statement to Public: It is the Washington State Department of Transportation’s (WSDOT) policy to assure that no person shall, on the grounds of race, color, national origin or sex, as provided by Title VI of the Civil Rights Act of 1964, be excluded from participation in, be denied the benefits of, or be otherwise discriminated against under any of its federally funded programs and activities. Any person who believes his/her Title VI protection has been violated may file a complaint with WSDOT’s Office of Equal Opportunity (OEO). For Title VI complaint forms and advice, please contact OEO’s Title VI Coordinator at (360) 705-7098.
GNB subject index and edition archives onlineReaders can access the GNB subject index online at bit.ly/GNBsubjectindex. Past GNB editions are available at bit.ly/GNBarchives.
GNB reporting periodsWSDOT programs report their performance data during different periods to best fit the work they do. For example, a program that receives substantial federal funds may report performance based on the federal fiscal year (see charts below).
GNB creditsThe GNB is developed and produced by the small team at WSDOT’s Office of Strategic Assessment and Performance Analysis (OSAPA), and articles feature bylines indicating key contributors from dozens of WSDOT programs. The GNB and GNB Lite are printed in-house by Ronnie Jackson, Trudi Phillips, Talon Randazzo, Larry Shibler, Oma Venable and Deb Webb. OSAPA’s Kate Wilfong coordinates distribution. WSDOT’s graphics team (Marci Mill, Erica Mulherin and Steve Riddle) provides creative assistance, and WSDOT program staff and communicators take the photographs in each edition.
The Gray Notebook is prepared by:
Office of Strategic Assessment and Performance Analysis Washington State Department of Transportation 310 Maple Park Ave SE, Olympia, WA 98504
© 2018 WSDOT. All rights reserved.
Statewide transportation policy goals
Laws enacted in 2007 established policy goals for transportation agencies in Washington (RCW 47.04.280). Throughout its editions, WSDOT’s Gray Notebook (GNB) reports on progress toward the six statewide transportation policy goals that include:
Æ Safety: To provide for and improve the safety and security of transportation customers and the transportation system;
Æ Preservation: To maintain, preserve, and extend the life and utility of prior investments in transportation systems and services;
Æ Mobility: To improve the predictable movement of goods and people throughout Washington, including congestion relief and improved freight mobility;
Æ Environment: To enhance Washington’s quality of life through transportation investments that promote energy conservation, enhance healthy communities, and protect the environment;
Æ Economic Vitality: To promote and develop transportation systems that stimulate, support, and enhance the movement of people and goods to ensure a prosperous economy; and
Æ Stewardship: To continuously improve the quality, effectiveness, and efficiency of the transportation system.
Calendar, fiscal and federal fiscal quartersJan Feb Mar Apr May Jun Jul Aug Sep Oct Nov Dec
GNB 69 GNB 70 GNB 71 GNB 72Calendar Q1 2018 Q2 2018 Q3 2018 Q4 2018
Fiscal Q3 FY2018 Q4 FY2018 Q1 FY2019 Q2 FY2019
Fed. Fiscal Q2 FFY2018 Q3 FFY2018 Q4 FFY2018 Q1 FFY2019
2017-2019 biennial quarters (used by Legislature)Period Quarter Period QuarterJul – Sep 2017 Q1 Jul – Sep 2018 Q5
Oct – Dec 2017 Q2 Oct – Dec 2018 Q6
Jan – Mar 2018 Q3 Jan – Mar 2019 Q7
Apr – Jun 2018 Q4 Apr – Jun 2019 Q8
Return toTable of
Contents