Embed Size (px)
Citation preview

General SSF InformationCountry Indonesia
SSF Agreement Number IND-M-MOH Component Malaria Last Round 12
SSF Title Intensified Malaria Control Program in Kalimantan, Sulawesi, Sumatra and Six Provinces of Eastern Indonesia
Principal Recipient Directorate of Vector Borne Disease Control of the Ministry of Health of the Republic of Indonesia
SSF Status Active - Extension - TFM
SSF Start Date 01 Mar 2013 SSF End Date 28 Feb 2015
Current* Implementation Period Start Date 01 Mar 2013
Current* Implementation Period End Date
28 Feb 2015 Latest Rating A2
Current* Implementation Period Signed Amount $ 46,701,504
Current* Implementation Period Committed Amount
$ 40,976,275
Current* Implementation Period Disbursed Amount
$ 40,109,259
Cumulative Signed Amount $ 46,701,504 Cumulative Committed Amount $ 40,976,275 Cumulative
Disbursed Amount $ 40,109,259
% Disbursed 98%
Time Elapsed (at the end of the latest reporting period)
10 months
* Latest Implementation Period if SSF is closed
page 1 of 22
IND-M-MOH
IndonesiaGrant Performance Report
External Print Version
Last Updated on: 01 September 2014

New GPR Report - Table of Contents(For ExternalVersion)
1. Program Description and Contextual Information
2. Key Grant Performance Information
2.1. Program Impact and Outcome Indicators
2.2. Programmatic Performance
2.3. Financial Performance
2.4. Progress Update and Disbursement Information
2.5. Contextual Information
2.2.1. Reporting Periods
2.2.2. Program Objectives, Service Delivery Areas and Indicators
2.2.3. Cumulative Progress To Date
2.3.1. Grant Financial Key Performance Indicators (KPIs)
2.3.2. Program Budget
2.3.3. Program Expenditures
1.1. Grant Summary - Web
1.2. Country Latest Statistics
1.3. Comments on Key Discrepancies between Approved Proposal and Grant Agreement
1.4. Conditions Precedent
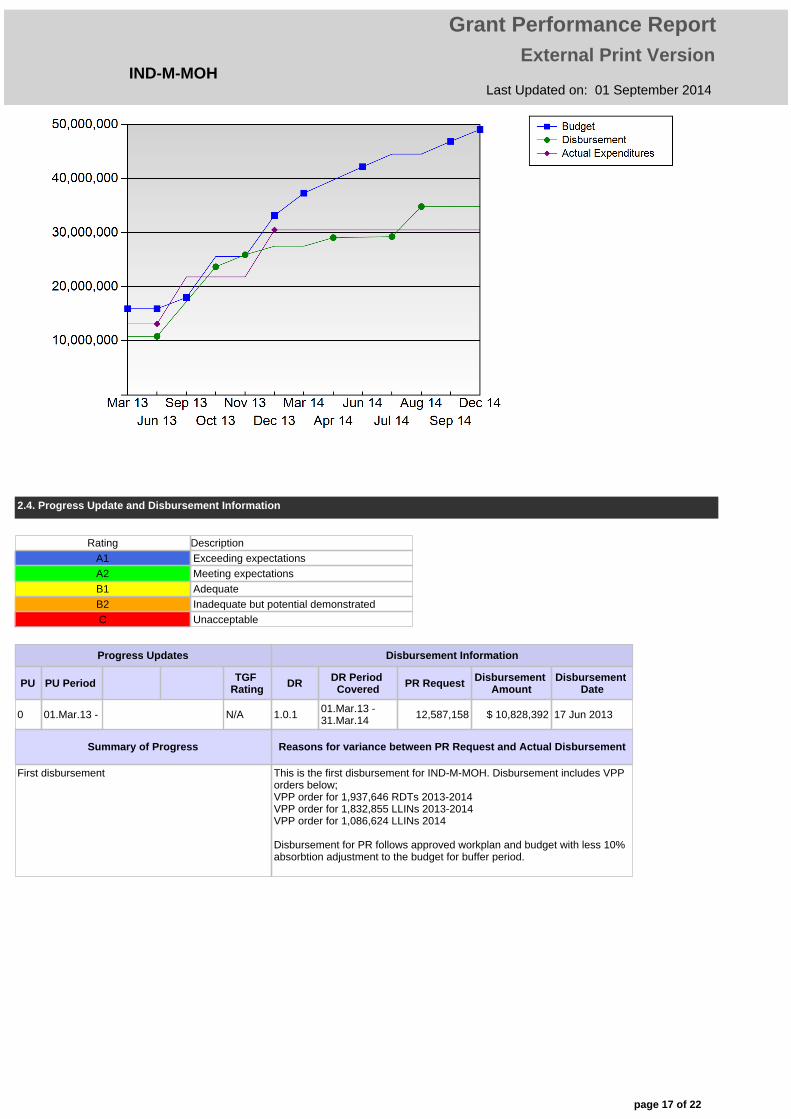
2.3.4. Graph - Cumulative Program Budget, Expenditures and Disbursement to Date
page 2 of 22
IND-M-MOH
Grant Performance ReportExternal Print Version
Last Updated on: 01 September 2014
1. Program Description and Contextual Information
1.1. Grant Summary - Web
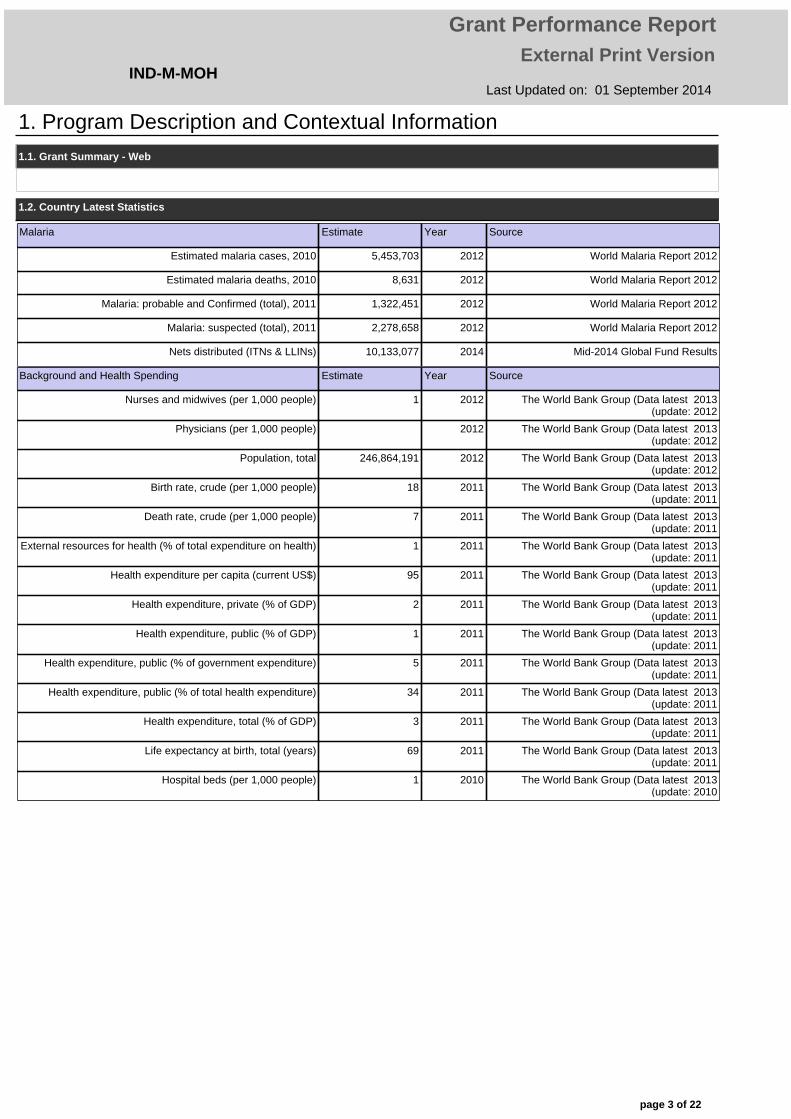
Malaria Estimate Year Source
Estimated malaria cases, 2010 5,453,703 2012 World Malaria Report 2012
Estimated malaria deaths, 2010 8,631 2012 World Malaria Report 2012
Malaria: probable and Confirmed (total), 2011 1,322,451 2012 World Malaria Report 2012
Malaria: suspected (total), 2011 2,278,658 2012 World Malaria Report 2012
Nets distributed (ITNs & LLINs) 10,133,077 2014 Mid-2014 Global Fund Results
Background and Health Spending Estimate Year Source
Nurses and midwives (per 1,000 people) 1 2012 The World Bank Group (Data latest 2013(update: 2012
Physicians (per 1,000 people) 2012 The World Bank Group (Data latest 2013(update: 2012
Population, total 246,864,191 2012 The World Bank Group (Data latest 2013(update: 2012
Birth rate, crude (per 1,000 people) 18 2011 The World Bank Group (Data latest 2013(update: 2011
Death rate, crude (per 1,000 people) 7 2011 The World Bank Group (Data latest 2013(update: 2011
External resources for health (% of total expenditure on health) 1 2011 The World Bank Group (Data latest 2013(update: 2011
Health expenditure per capita (current US$) 95 2011 The World Bank Group (Data latest 2013(update: 2011
Health expenditure, private (% of GDP) 2 2011 The World Bank Group (Data latest 2013(update: 2011
Health expenditure, public (% of GDP) 1 2011 The World Bank Group (Data latest 2013(update: 2011
Health expenditure, public (% of government expenditure) 5 2011 The World Bank Group (Data latest 2013(update: 2011
Health expenditure, public (% of total health expenditure) 34 2011 The World Bank Group (Data latest 2013(update: 2011
Health expenditure, total (% of GDP) 3 2011 The World Bank Group (Data latest 2013(update: 2011
Life expectancy at birth, total (years) 69 2011 The World Bank Group (Data latest 2013(update: 2011
Hospital beds (per 1,000 people) 1 2010 The World Bank Group (Data latest 2013(update: 2010
1.2. Country Latest Statistics
page 3 of 22
IND-M-MOH
Grant Performance ReportExternal Print Version
Last Updated on: 01 September 2014

1.5. Conditions Precedent
CP #
CP Type Condition Precedent Functional Area
Tied To Terminal Date
Is currently met?
Comments
Condition Precedent
1. Condition(s) Precedent to Transfer or Use of Grant Funds for Procurement of Technical and Management Assistance Consultancy Services
The transfer of Grant funds by the Global Fund to the Principal Recipient or use by the Principal Recipient of Grant funds to finance the procurement of technical and management assistance consultancy services, is subject to the delivery by the Principal Recipient to the Global Fund, in form and substance satisfactory to the Global Fund, of terms of reference for each such service and written justification and documentation to support the transparent selection of consultants for such services, including but not limited to the following services:
a. Mapping conversion and data updating,b. Synchronizing data with stakeholder,c. Development of Short Messaging Services (SMS) gateway for Routine Reporting (RR) online,d. Development methods and monitoring tools for HR program quality in prison and community, ande. Financial management.
Others In Progress
The PR had provided the general ToR for the National Consultants (i.e. Vector capacity and insecticide resistance, Surveillance and epidemiology, Malaria Program Management, Drug Efficacy and Resistance, Diagnosis quality, and Procurement and Distribution) for the SSF Grant on 6 February 2013 to TGF prior to grant negotiation and grant signing.
However, the general ToR and timeline submitted by the PR did not merit TGF's approval and hence TGF requested the PR to provide detailed ToR’s for each service.
The PR had sent the revised ToR’s based on TGF's advice via email dated 28 October 2013. TGF has responded PR with comments on 24 January 2014.
The PR has been advised to finalize the ToR based on GF comments by 31 August 2014.
Condition Precedent
STC #1
No later than 31 May 2013, the Principal Recipient shall deliver to the Global Fund, in form and substance satisfactory to the Global Fund written evidence that it has developed a costed national human resource allocation plan, to be submitted as part of the National Strategic Plan for Malaria, with clear timelines and funding sources (including increased commitment from the Government of Indonesia) and which takes into account the current and future needs of the National Malaria Program to demonstrate the sustainability after the end of the Global Fund-supported malaria grants as the country moves towards malaria elimination.
Others 31.May.13 In Progress
The PR already has the National Strategic Plan for year 2010 - 2014. However, it does not contain the required costed national human resources allocation plan as required by TGF. We understand that PR will not change the current NSP for year 2010-2014 considering that this year is the last year of the current NSP.
As the PR is only considering to include the required costed national human resources allocation plan in the National Strategic Plan for year 2015 – 2019, we decide to waive-off this STC.
Condition Precedent
STC #2
No later than 30 June 2013, the Principal Recipient shall deliver to the Global Fund, in form and substance satisfactory to the Global Fund, written evidence that the Principal Recipient’s remuneration scheme is aligned with the Global Fund Budgeting Guidelines.
Finance 30.Jun.13 Not started
The salary survey undertaken by the Hay Group has been completed. However, PR was not able to take any action as the report was not completed based on the agreed ToR. Both CCM and TGF are still discussing with the Hay Group to ensure that the Hay Group re-submits the report based on the agreed ToR. Until then, PR is not able to take any action to address this issue.The STC is, therefore, extended until 30 June 2014.
1.3. Comments on Key Discrepancies between Approved Proposal and Grant
page 4 of 22
IND-M-MOH
Grant Performance ReportExternal Print Version
Last Updated on: 01 September 2014
CP #
CP Type Condition Precedent Functional Area
Tied To Terminal Date
Is currently met?
Comments
Condition Precedent
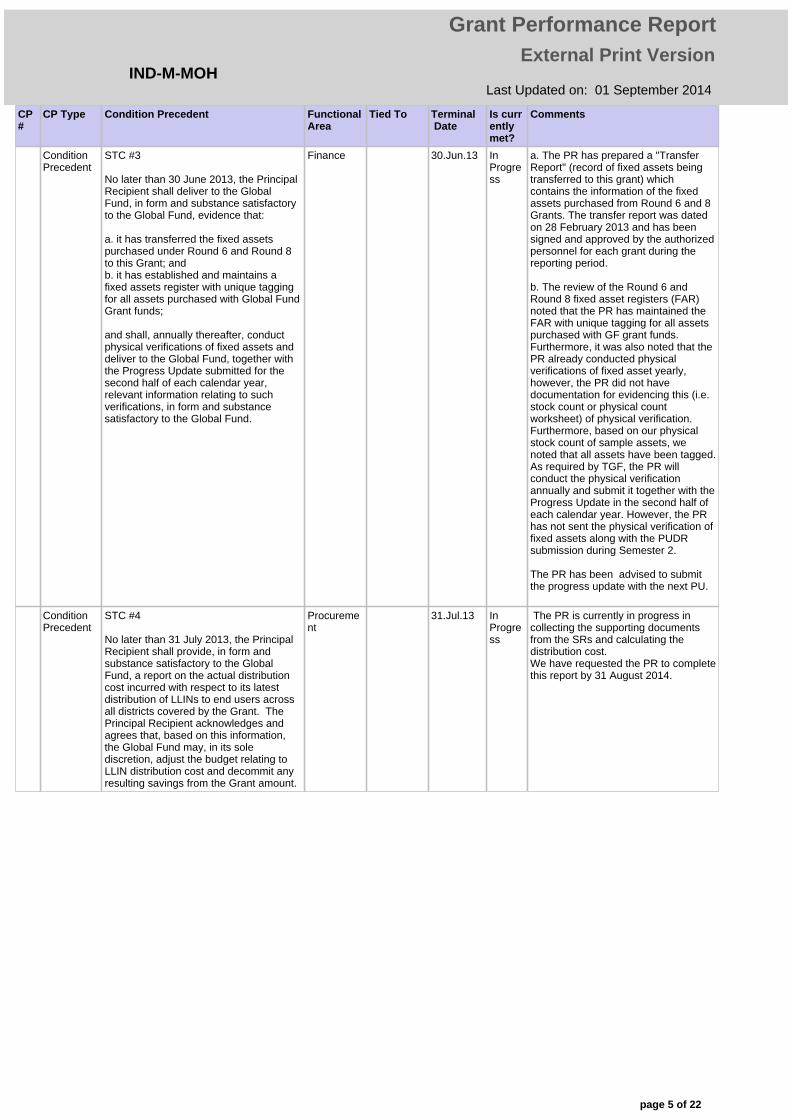
STC #3
No later than 30 June 2013, the Principal Recipient shall deliver to the Global Fund, in form and substance satisfactory to the Global Fund, evidence that:
a. it has transferred the fixed assets purchased under Round 6 and Round 8 to this Grant; andb. it has established and maintains a fixed assets register with unique tagging for all assets purchased with Global Fund Grant funds;
and shall, annually thereafter, conduct physical verifications of fixed assets and deliver to the Global Fund, together with the Progress Update submitted for the second half of each calendar year, relevant information relating to such verifications, in form and substance satisfactory to the Global Fund.
Finance 30.Jun.13 In Progress
a. The PR has prepared a "Transfer Report" (record of fixed assets being transferred to this grant) which contains the information of the fixed assets purchased from Round 6 and 8 Grants. The transfer report was dated on 28 February 2013 and has been signed and approved by the authorized personnel for each grant during the reporting period. b. The review of the Round 6 and Round 8 fixed asset registers (FAR) noted that the PR has maintained the FAR with unique tagging for all assets purchased with GF grant funds. Furthermore, it was also noted that the PR already conducted physical verifications of fixed asset yearly, however, the PR did not have documentation for evidencing this (i.e. stock count or physical count worksheet) of physical verification. Furthermore, based on our physical stock count of sample assets, we noted that all assets have been tagged.As required by TGF, the PR will conduct the physical verification annually and submit it together with the Progress Update in the second half of each calendar year. However, the PR has not sent the physical verification of fixed assets along with the PUDR submission during Semester 2.
The PR has been advised to submit the progress update with the next PU.
Condition Precedent
STC #4
No later than 31 July 2013, the Principal Recipient shall provide, in form and substance satisfactory to the Global Fund, a report on the actual distribution cost incurred with respect to its latest distribution of LLINs to end users across all districts covered by the Grant. The Principal Recipient acknowledges and agrees that, based on this information, the Global Fund may, in its sole discretion, adjust the budget relating to LLIN distribution cost and decommit any resulting savings from the Grant amount.
Procurement
31.Jul.13 In Progress
The PR is currently in progress in collecting the supporting documents from the SRs and calculating the distribution cost. We have requested the PR to complete this report by 31 August 2014.
page 5 of 22
IND-M-MOH
Grant Performance ReportExternal Print Version
Last Updated on: 01 September 2014

CP #
CP Type Condition Precedent Functional Area
Tied To Terminal Date
Is currently met?
Comments
Condition Precedent
STC #5
No later than six months after signing this Agreement, the Principal Recipient shall deliver to the Global Fund, in form and substance satisfactory to the Global Fund:
a. written evidence that the Principal Recipient has implemented a functional system for recording and reporting on patient- and inventory-related information (Management Information System), as assessed by the LFA, including, without limitation, a system for validating, analyzing, and utilizing the reported information in the management of the Malaria program);
b. a revised Standard Operating Procedures Manual reflecting in detail the arrangements for procurement, storage, distribution, recording and reporting, and utilization of information to manage the program with respect to Health Products (including, without limitation, ACTs, LLINs, RDTs), which procedures shall take into account the requirements of the Global Fund’s Procurement Policy, Quality Assurance Policy and the reporting requirements with respect to the PQR system as set forth in the Guide to Global Fund Policies on Procurement and Supply Management of Health Products incorporated by reference in Article 19 of this Agreement (the “Guide”);
c. written evidence of compliance with the Global Fund’s quality assurance policy for diagnostics as set forth in the Guide; and
d. written evidence that storage facilities at the district level conform to internationally recognized minimum standards (Good Storage Practices) (as assessed by the LFA) as referenced in the Guide, for all Health Products procured using Global Fund resources.
Procurement
31.Aug.13 In Progress
a. The PR finalized the SOP for Management Information System (MIS) report signed by the APR on July 2013. However, the PR has not yet delivered the SOP MIS to TGF. The PR has been advised to submit the SOP to the GF by 30 June 2014.
b. The PR has prepared the Logistics SOP that was already reviewed and endorsed by TWG on 12 April 2013 and was submitted initially to TGF on 15 April 2013. However, the PR has not yet revised the Logistics SOP based on TGF recommendations on 24 June 2013. The PR has been advised to submit the revised SOP by 30 June 2014.
c.As the SOP for Logistic and QA RDT have not been endorsed by TWG, therefore, the PR could not provide written evidence for compliance with QA policy. The PR has been requested to submit the required written evidence from TWG by 30 June 2014.
d. The PR has conducted an assessment of the storage facilities at the district level in May 2013. However, as yet, the PR has not completed the report of the storage facility assessment to be submitted to TGF. The PR has been requested to submit the requisite report by 30 June 2014.
Condition Precedent
STC #6
At least one month prior to the transfer of Grant funds by the Global Fund to the Principal Recipient or use by the Principal Recipient of Grant funds to finance training activities to be conducted during the Implementation Period, the Principal Recipient shall deliver to the Global Fund plans, in form and substance satisfactory to the Global Fund, the Training Plan for such training activities (the “Training Plan”). The Training Plan shall include, but will not be limited to, a detailed budget and assumptions for all training activities under the Program, procedures for the Principal Recipient’s financial oversight over expenditures to finance training activities and controls to protect Grant funds for training from the risk of misuse or diversion.
Others 30.Apr.13 Met The Training plan has been approved by TGF on 3 April 2013.
page 6 of 22
IND-M-MOH
Grant Performance ReportExternal Print Version
Last Updated on: 01 September 2014

CP #
CP Type Condition Precedent Functional Area
Tied To Terminal Date
Is currently met?
Comments
Condition Precedent
STC #7
Together with each Progress Update and Disbursement Request, the Principal Recipient shall provide, in form and substance satisfactory to the Global Fund, evidence of best efforts to find alternative domestic sources of funding for the payment of incentives for outreach (cadres, sprayers, etc) and health workers (microscopists). Upon confirmation to the satisfaction of the Global Fund of the availability of alternative domestic sources of funding for such incentives, the Program budget, as reflected in the Summary Budget attached to this Annex A, shall be revised and any resulting savings will be re-allocated towards other high impact interventions at the discretion of the Global Fund.
Finance In Progress
The PR has not been able to identify the portion between state budget and TGF budget due to: (i) local budget in all provinces is the lump sum amounts (ii) some provinces have not submitted the "Proportion Report " (i.e. Laporan Kontribusi) which provides information on the proportion of the incentive payments that covered from the local budget and TGF fund or other donors. The PR expects that this STC will be fulfilled by the end of Year 2014, as the PR will develop new report template that could accommodate information of the proportion incentives. Moreover, the PR will also conduct socialisation to SRs during the monitoring and evaluation activities regarding the implementation on this new report template.
As it seems that the STC cannot be met during this year, the same has been extended until 31 December 2014.
page 7 of 22
IND-M-MOH
Grant Performance ReportExternal Print Version
Last Updated on: 01 September 2014

2.1. Program Impact and Outcome Indicators
Goal 1To reduce morbidity and mortality associated with malaria by reducing malaria transmission to the lowest possible level with epidemiologically appropriate interventions. (target provinces are Kalimantan, Sulawesi, Sumatra and six Provinces of Eastern Indonesia).
Impact indicator Confirmed malaria cases per 1000 persons per year (East Part of Indonesia)
Baselines
Value Year
24.01 2010
Year 1 Year 2 Year 3 Year 4 Year 5 Year 6 Year 7 Year 8 Year 9 Year 10 Year 11 Year 12 Year 13 Year 14 Year 15
Target 23 22
Result
Data source of Results
Impact indicator Confirmed malaria cases per 1000 persons per year (Sumatera, Kalimantan, Sulawesi, and West Nusa Tenggara)
Baselines
Value Year
2.25 2010
Year 1 Year 2 Year 3 Year 4 Year 5 Year 6 Year 7 Year 8 Year 9 Year 10 Year 11 Year 12 Year 13 Year 14 Year 15
Target 2 2
Result
Data source of Results
Impact indicator Percentage of confirmed malaria deaths per total confirmed malaria cases in health facilities
Baselines
Value Year
0.09 2011
Year 1 Year 2 Year 3 Year 4 Year 5 Year 6 Year 7 Year 8 Year 9 Year 10 Year 11 Year 12 Year 13 Year 14 Year 15
Target 0 0
Result
Data source of Results
Outcome indicator Percentage of children U5 sleeping under an ITN (Kalimantan and Sulawesi)
Baselines
Value Year
65% 2011
Year 1 Year 2 Year 3 Year 4 Year 5 Year 6 Year 7 Year 8 Year 9 Year 10 Year 11 Year 12 Year 13 Year 14 Year 15
Target N: D: P: %
N: D: P: 80%
N: D: P: %
N: D: P: %
N: D: P: %
N: D: P: %
N: D: P: %
N: D: P: %
N: D: P: %
N: D: P: %
N: D: P: %
N: D: P: %
N: D: P: %
N: D: P: %
N: D: P: %
Result N: D: P: %
N: D: P: %
N: D: P: %
N: D: P: %
N: D: P: %
N: D: P: %
N: D: P: %
N: D: P: %
N: D: P: %
N: D: P: %
N: D: P: %
N: D: P: %
N: D: P: %
N: D: P: %
N: D: P: %
Data source of Results
Year 1 Year 2 Year 3 Year 4 Year 5 Year 6 Year 7 Year 8 Year 9 Year 10 Year 11 Year 12 Year 13 Year 14 Year 15
2012 2013 2014 2015 2016 2017 2018 2019 2020 2021 2013 2024 2025 2026 2027
2. Key Grant Performance Information
page 8 of 22
IND-M-MOH
Grant Performance ReportExternal Print Version
Last Updated on: 01 September 2014

Outcome indicator Percentage of children U5 sleeping under an ITN (Sumatra and Eastern Part of Indonesia)
Baselines
Value Year
54% 2011
Year 1 Year 2 Year 3 Year 4 Year 5 Year 6 Year 7 Year 8 Year 9 Year 10 Year 11 Year 12 Year 13 Year 14 Year 15
Target N: D: P: 70%
N: D: P: %
N: D: P: %
N: D: P: %
N: D: P: %
N: D: P: %
N: D: P: %
N: D: P: %
N: D: P: %
N: D: P: %
N: D: P: %
N: D: P: %
N: D: P: %
N: D: P: %
N: D: P: %
Result N: D: P: %
N: D: P: %
N: D: P: %
N: D: P: %
N: D: P: %
N: D: P: %
N: D: P: %
N: D: P: %
N: D: P: %
N: D: P: %
N: D: P: %
N: D: P: %
N: D: P: %
N: D: P: %
N: D: P: %
Data source of Results
Outcome indicator Percentage of pregnant women (and other target groups) sleeping under an ITN (Kalimantan and Sulawesi)
Baselines
Value Year
53% 2011
Year 1 Year 2 Year 3 Year 4 Year 5 Year 6 Year 7 Year 8 Year 9 Year 10 Year 11 Year 12 Year 13 Year 14 Year 15
Target N: D: P: %
N: D: P: 80%
N: D: P: %
N: D: P: %
N: D: P: %
N: D: P: %
N: D: P: %
N: D: P: %
N: D: P: %
N: D: P: %
N: D: P: %
N: D: P: %
N: D: P: %
N: D: P: %
N: D: P: %
Result N: D: P: %
N: D: P: %
N: D: P: %
N: D: P: %
N: D: P: %
N: D: P: %
N: D: P: %
N: D: P: %
N: D: P: %
N: D: P: %
N: D: P: %
N: D: P: %
N: D: P: %
N: D: P: %
N: D: P: %
Data source of Results
Outcome indicator Percentage of pregnant women (and other target groups) sleeping under an ITN (Sumatra and Eastern Part of Indonesia)
Baselines
Value Year
45% 2011
Year 1 Year 2 Year 3 Year 4 Year 5 Year 6 Year 7 Year 8 Year 9 Year 10 Year 11 Year 12 Year 13 Year 14 Year 15
Target N: D: P: 70%
N: D: P: %
N: D: P: %
N: D: P: %
N: D: P: %
N: D: P: %
N: D: P: %
N: D: P: %
N: D: P: %
N: D: P: %
N: D: P: %
N: D: P: %
N: D: P: %
N: D: P: %
N: D: P: %
Result N: D: P: %
N: D: P: %
N: D: P: %
N: D: P: %
N: D: P: %
N: D: P: %
N: D: P: %
N: D: P: %
N: D: P: %
N: D: P: %
N: D: P: %
N: D: P: %
N: D: P: %
N: D: P: %
N: D: P: %
Data source of Results
Outcome indicator Percentage of households with at least one ITN (Kalimantan and Sulawesi)
Baselines
Value Year
66% 2012
Year 1 Year 2 Year 3 Year 4 Year 5 Year 6 Year 7 Year 8 Year 9 Year 10 Year 11 Year 12 Year 13 Year 14 Year 15
Target N: D: P: %
N: D: P: 80%
N: D: P: %
N: D: P: %
N: D: P: %
N: D: P: %
N: D: P: %
N: D: P: %
N: D: P: %
N: D: P: %
N: D: P: %
N: D: P: %
N: D: P: %
N: D: P: %
N: D: P: %
Result N: D: P: %
N: D: P: %
N: D: P: %
N: D: P: %
N: D: P: %
N: D: P: %
N: D: P: %
N: D: P: %
N: D: P: %
N: D: P: %
N: D: P: %
N: D: P: %
N: D: P: %
N: D: P: %
N: D: P: %
Data source of Results
page 9 of 22
IND-M-MOH
Grant Performance ReportExternal Print Version
Last Updated on: 01 September 2014

Outcome indicator Percentage of households with at least one ITN (Sumatra and Eastern Part of Indonesia)
Baselines
Value Year
57% 2011
Year 1 Year 2 Year 3 Year 4 Year 5 Year 6 Year 7 Year 8 Year 9 Year 10 Year 11 Year 12 Year 13 Year 14 Year 15
Target N: D: P: 80%
N: D: P: %
N: D: P: %
N: D: P: %
N: D: P: %
N: D: P: %
N: D: P: %
N: D: P: %
N: D: P: %
N: D: P: %
N: D: P: %
N: D: P: %
N: D: P: %
N: D: P: %
N: D: P: %
Result N: D: P: %
N: D: P: %
N: D: P: %
N: D: P: %
N: D: P: %
N: D: P: %
N: D: P: %
N: D: P: %
N: D: P: %
N: D: P: %
N: D: P: %
N: D: P: %
N: D: P: %
N: D: P: %
N: D: P: %
Data source of Results
page 10 of 22
IND-M-MOH
Grant Performance ReportExternal Print Version
Last Updated on: 01 September 2014

2.2.2. Program Objectives, Service Delivery Areas and Indicators
Period 1 Period 2 Period 3 Period 4 Period 5 Period 6 Period 7 Period 8
TargetN: 598,912D: 598,912
P: 100%
N: 1,497,280D: 1,497,280
P: 100%
N: 808,531D: 808,531
P: 100%
N: 1,617,062D: 1,617,062
P: 100%
N: 242,559D: 242,559
P: 100%
N: D:
P: %
N: D:
P: %
N: D:
P: %
ResultN: 619,094D: 598,912
P: 103%
N: 1,659,171D: 1,659,171
P: 100%
N: D:
P: %
N: D:
P: %
N: D:
P: %
N: D:
P: %
N: D:
P: %
N: D:
P: %
YearValue
Baseline Is Top 10 indicator? (Y/N)
Is Training indicator? (Y/N)
No Level 1,996,373
2010 Y N
Indicator 1.1 - Number and percentage of fever cases tested by microscopy and/or RDT
Period 1 Period 2 Period 3 Period 4 Period 5 Period 6 Period 7 Period 8
TargetN: 195,722D: 195,722
P: 100%
N: 489,306D: 489,306
P: 100%
N: 297,958D: 297,958
P: 100%
N: 595,916D: 595,916
P: 100%
N: 97,861D: 97,861
P: 100%
N: D:
P: %
N: D:
P: %
N: D:
P: %
ResultN: 169,759D: 195,722
P: 87%
N: 426,201D: 426,201
P: 100%
N: D:
P: %
N: D:
P: %
N: D:
P: %
N: D:
P: %
N: D:
P: %
N: D:
P: %
YearValue
Baseline Is Top 10 indicator? (Y/N)
Is Training indicator? (Y/N)
No Level 587,167 2010 Y N
Indicator 1.2 - Number and percentage of pregnant women screened by microscope and/or RDT
Treatment: Diagnosis
Period 1 Period 2 Period 3 Period 4 Period 5 Period 6 Period 7 Period 8
Target 128,902 322,255 183,686 367,371 58,167
Result 117,803 306,476
YearValue
Baseline Is Top 10 indicator? (Y/N)
Is Training indicator? (Y/N)
No Level 483,383 2010 Y N
Indicator 1.4 - Number of positive malaria cases (confirmed with microscopy and/or RDTs) treated with ACT (DHP) at MoH health facilities and VMPs in MoH target areas
Treatment: Prompt, effective antimalarial treatment
Objective 1 - Expand access to early, confirmed diagnosis (microscopy/RDTs) and prompt treatment with ACT in malaria endemic areas.
Period 1 Period 2 Period 3 Period 4 Period 5 Period 6 Period 7 Period 8
N/A 01.Mar.1330.Jun.13
01.Jul.1331.Dec.13
01.Jan.1430.Jun.14
01.Jul.1431.Dec.14
01.Jan.1528.Feb.15
01.Mar.1531.Dec.15
01.Jan.1630.Jun.16
01.Jul.1631.Dec.16
2.2.1. Reporting Periods
2.2. Programmatic Performance
page 11 of 22
IND-M-MOH
Grant Performance ReportExternal Print Version
Last Updated on: 01 September 2014
Period 1 Period 2 Period 3 Period 4 Period 5 Period 6 Period 7 Period 8
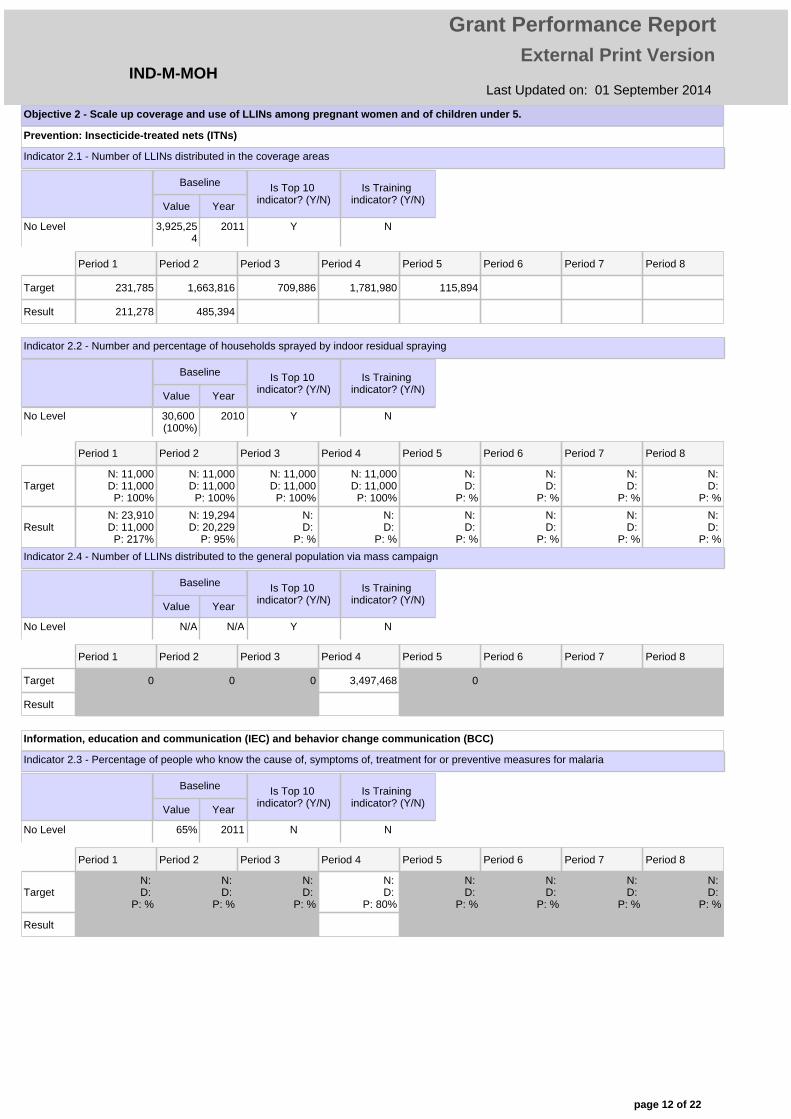
Target 231,785 1,663,816 709,886 1,781,980 115,894
Result 211,278 485,394
YearValue
Baseline Is Top 10 indicator? (Y/N)
Is Training indicator? (Y/N)
No Level 3,925,254
2011 Y N
Indicator 2.1 - Number of LLINs distributed in the coverage areas
Period 1 Period 2 Period 3 Period 4 Period 5 Period 6 Period 7 Period 8
TargetN: 11,000D: 11,000
P: 100%
N: 11,000D: 11,000
P: 100%
N: 11,000D: 11,000
P: 100%
N: 11,000D: 11,000
P: 100%
N: D:
P: %
N: D:
P: %
N: D:
P: %
N: D:
P: %
ResultN: 23,910D: 11,000
P: 217%
N: 19,294D: 20,229
P: 95%
N: D:
P: %
N: D:
P: %
N: D:
P: %
N: D:
P: %
N: D:
P: %
N: D:
P: %
YearValue
Baseline Is Top 10 indicator? (Y/N)
Is Training indicator? (Y/N)
No Level 30,600 (100%)
2010 Y N
Indicator 2.2 - Number and percentage of households sprayed by indoor residual spraying
Period 1 Period 2 Period 3 Period 4 Period 5 Period 6 Period 7 Period 8
Target 0 0 0 3,497,468 0
Result
YearValue
Baseline Is Top 10 indicator? (Y/N)
Is Training indicator? (Y/N)
No Level N/A N/A Y N
Indicator 2.4 - Number of LLINs distributed to the general population via mass campaign
Prevention: Insecticide-treated nets (ITNs)
Period 1 Period 2 Period 3 Period 4 Period 5 Period 6 Period 7 Period 8
TargetN: D:
P: %
N: D:
P: %
N: D:
P: %
N: D:
P: 80%
N: D:
P: %
N: D:
P: %
N: D:
P: %
N: D:
P: %
Result
YearValue
Baseline Is Top 10 indicator? (Y/N)
Is Training indicator? (Y/N)
No Level 65% 2011 N N
Indicator 2.3 - Percentage of people who know the cause of, symptoms of, treatment for or preventive measures for malaria
Information, education and communication (IEC) and behavior change communication (BCC)
Objective 2 - Scale up coverage and use of LLINs among pregnant women and of children under 5.
page 12 of 22
IND-M-MOH
Grant Performance ReportExternal Print Version
Last Updated on: 01 September 2014

Period 1 Period 2 Period 3 Period 4 Period 5 Period 6 Period 7 Period 8
TargetN: 214D: 285
P: 75%
N: 228D: 285
P: 80%
N: 242D: 285
P: 85%
N: 271D: 285
P: 95%
N: 285D: 285
P: 100%
N: D:
P: %
N: D:
P: %
N: D:
P: %
ResultN: 202D: 214
P: 94%
N: 182D: 285
P: 64%
N: D:
P: %
N: D:
P: %
N: D:
P: %
N: D:
P: %
N: D:
P: %
N: D:
P: %
YearValue
Baseline Is Top 10 indicator? (Y/N)
Is Training indicator? (Y/N)
No Level 214 2010 N N
Indicator 3.1 - Number and percentage of districts submitting routine, timely and accurate reporting
HSS: Community Systems Strengthening
Period 1 Period 2 Period 3 Period 4 Period 5 Period 6 Period 7 Period 8
TargetN: 1,334D: 4,003
P: 33%
N: 3,336D: 4,003
P: 83%
N: 2,002D: 4,003
P: 50%
N: 4,003D: 4,003P: 100%
N: 667D: 4,003
P: 17%
N: D:
P: %
N: D:
P: %
N: D:
P: %
ResultN: 1,286D: 1,334
P: 96%
N: 3,338D: 4,003
P: 83%
N: D:
P: %
N: D:
P: %
N: D:
P: %
N: D:
P: %
N: D:
P: %
N: D:
P: %
YearValue
Baseline Is Top 10 indicator? (Y/N)
Is Training indicator? (Y/N)
No Level 4003 (100%)
2010 N N
Indicator 3.2 - Number and percentage of Heath Centers that received feedback report from District Heath Officer after supervisory visits
Period 1 Period 2 Period 3 Period 4 Period 5 Period 6 Period 7 Period 8
TargetN: 3,003D: 4,003
P: 75%
N: 3,202D: 4,003
P: 80%
N: 3,603D: 4,003
P: 90%
N: 4,003D: 4,003P: 100%
N: 4,003D: 4,003P: 100%
N: D:
P: %
N: D:
P: %
N: D:
P: %
ResultN: 2,897D: 3,003
P: 97%
N: 2,565D: 4,003
P: 64%
N: D:
P: %
N: D:
P: %
N: D:
P: %
N: D:
P: %
N: D:
P: %
N: D:
P: %
YearValue
Baseline Is Top 10 indicator? (Y/N)
Is Training indicator? (Y/N)
No Level N N
Indicator 3.3 - Number and percentage of health centers with no stock-outs of nationally recommended first line antimalarial drugs continuously for more than 7 days during the last three months
HSS: Information/monitoring and evaluation - Routine data collection, analysis and use
Objective 3 - Improve routine malaria surveillance and reporting for improved management including epidemic investigation and control so that investigation of reported epidemics is routinely initiated within 24 hours and > 90% of health facilities report on time by 2015.
page 13 of 22
IND-M-MOH
Grant Performance ReportExternal Print Version
Last Updated on: 01 September 2014
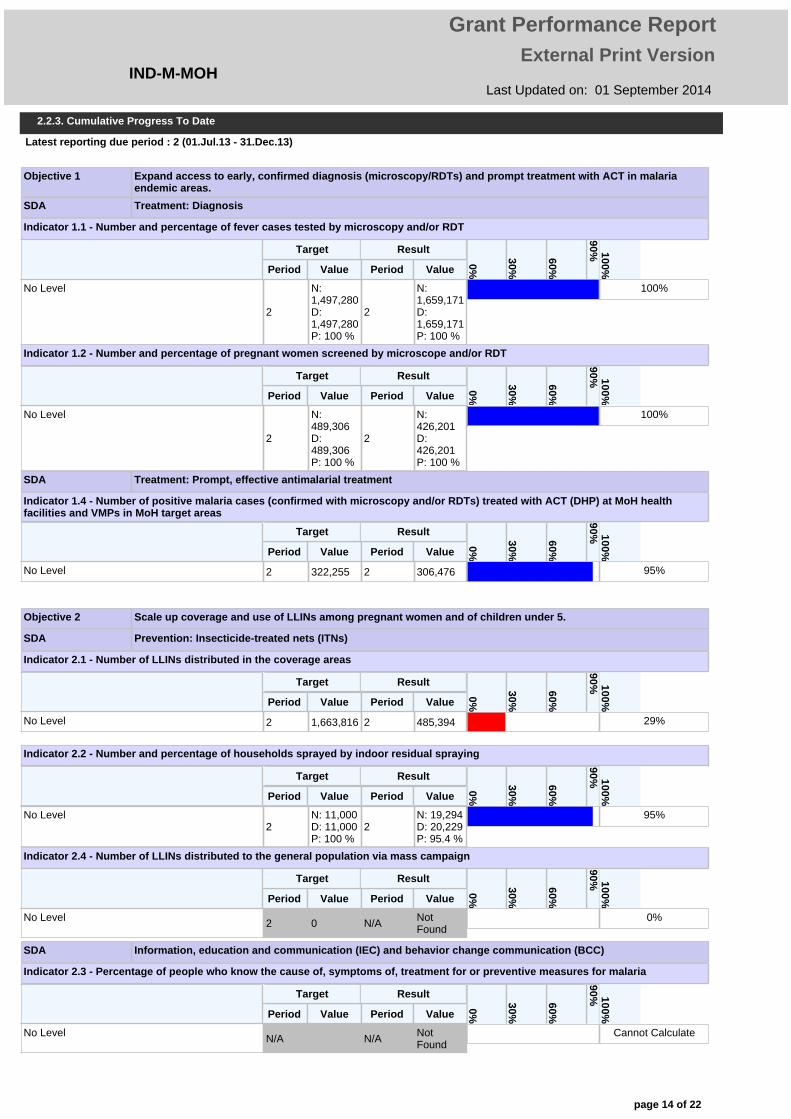
Latest reporting due period : 2 (01.Jul.13 - 31.Dec.13)
Period Value Period Value
Target Result
90%
60%0%
30%
100%
No Level
2
N: 1,497,280D: 1,497,280P: 100 %
2
N: 1,659,171D: 1,659,171P: 100 %
100%
Indicator 1.1 - Number and percentage of fever cases tested by microscopy and/or RDT
Period Value Period Value
Target Result
90%
60%0%
30%
100%
No Level
2
N: 489,306D: 489,306P: 100 %
2
N: 426,201D: 426,201P: 100 %
100%
Indicator 1.2 - Number and percentage of pregnant women screened by microscope and/or RDT
SDA Treatment: Diagnosis
Period Value Period Value
Target Result
90%
60%0%
30%
100%
No Level 2 322,255 2 306,476 95%
Indicator 1.4 - Number of positive malaria cases (confirmed with microscopy and/or RDTs) treated with ACT (DHP) at MoH health facilities and VMPs in MoH target areas
SDA Treatment: Prompt, effective antimalarial treatment
Objective 1 Expand access to early, confirmed diagnosis (microscopy/RDTs) and prompt treatment with ACT in malaria endemic areas.
Period Value Period Value
Target Result
90%
60%0%
30%
100%
No Level 2 1,663,816 2 485,394 29%
Indicator 2.1 - Number of LLINs distributed in the coverage areas
Period Value Period Value
Target Result
90%
60%0%
30%
100%
No Level2
N: 11,000D: 11,000P: 100 %
2N: 19,294D: 20,229P: 95.4 %
95%
Indicator 2.2 - Number and percentage of households sprayed by indoor residual spraying
Period Value Period Value
Target Result
90%
60%0%
30%
100%
No Level 2 0 N/A Not Found
0%
Indicator 2.4 - Number of LLINs distributed to the general population via mass campaign
SDA Prevention: Insecticide-treated nets (ITNs)
Period Value Period Value
Target Result
90%
60%0%
30%
100%
No Level N/A N/A Not Found
Cannot Calculate
Indicator 2.3 - Percentage of people who know the cause of, symptoms of, treatment for or preventive measures for malaria
SDA Information, education and communication (IEC) and behavior change communication (BCC)
Objective 2 Scale up coverage and use of LLINs among pregnant women and of children under 5.
2.2.3. Cumulative Progress To Date
page 14 of 22
IND-M-MOH
Grant Performance ReportExternal Print Version
Last Updated on: 01 September 2014

Period Value Period Value
Target Result
90%
60%0%
30%
100%
No Level2
N: 228D: 285P: 80 %
2N: 182D: 285P: 63.9 %
80%
Indicator 3.1 - Number and percentage of districts submitting routine, timely and accurate reporting
SDA HSS: Community Systems Strengthening
Period Value Period Value
Target Result
90%
60%0%
30%
100%
No Level2
N: 3,336D: 4,003P: 83.3 %
2N: 3,338D: 4,003P: 83.4 %
100%
Indicator 3.2 - Number and percentage of Heath Centers that received feedback report from District Heath Officer after supervisory visits
Period Value Period Value
Target Result
90%
60%0%
30%
100%
No Level2
N: 3,202D: 4,003P: 80 %
2N: 2,565D: 4,003P: 64.1 %
80%
Indicator 3.3 - Number and percentage of health centers with no stock-outs of nationally recommended first line antimalarial drugs continuously for more than 7 days during the last three months
SDA HSS: Information/monitoring and evaluation - Routine data collection, analysis and use
Objective 3 Improve routine malaria surveillance and reporting for improved management including epidemic investigation and control so that investigation of reported epidemics is routinely initiated within 24 hours and > 90% of health facilities report on time by 2015.
page 15 of 22
IND-M-MOH
Grant Performance ReportExternal Print Version
Last Updated on: 01 September 2014

Summary Period Budget: 15,929,730 2,099,687 15,167,018 4,130,728 4,867,088 4,706,545 2,209,049 1,096,219
Budget Period 1
Budget Period 2
Budget Period 3
Budget Period 4
Budget Period 5
Budget Period 6
Budget Period 7
Budget Period 8
Period Covered From: 01.Mar.13 01.Jul.13 01.Oct.13 01.Jan.14 01.Apr.14 01.Jul.14 01.Oct.14 01.Jan.15
Period Covered To: 30.Jun.13 30.Sep.13 31.Dec.13 31.Mar.14 30.Jun.14 30.Sep.14 31.Dec.14 28.Feb.15
Currency: USD USD USD USD USD USD USD USD
Cumulative Budget Through: 15,929,730 18,029,417 33,196,435 37,327,163 42,194,251 46,900,796 49,109,845 50,206,064
Expenditure Categories
Program Activities
Implementing Entities
2.3.2. Program Budget
2.3.4. Cumulative Program Budget, Expenditures and Disbursement to Date
Grant Duration (months) 24 months Grant Amount 40,976,275 $
% Time Elapsed (as of end date of the latest PU) 42% % disbursed by TGF (to date) 98%
Time Remaining (as of end date of the latest PU) 14 months Disbursed by TGF (to date) 40,109,259 $
Expenditures Rate (as of end date of the latest PU) 92% Funds Remaining (to date) 867,016 $
2.3.1. Grant Financial Key Performance Indicators (KPIs)
2.3. Financial Performance
- Comments and additional information
2.3.3. Program Expenditures
Period PU2: 01.Jul.13 - 31.Dec.13 Actual Cash Outflow
Cumulative Budget
Cumulative Cash Outflow Variance
1. Total cash outflow vs. budget $ 17,388,252 $ 33,196,435 $ 30,523,911 $ 2,672,524
1a. PR's Total expenditure $ 14,478,543 $ 26,399,653
1b. Disbursements to sub-recipients $ 2,546,832 $ 3,761,381
1c. Expenditure Adjustments $ 362,877 $ 362,877
2. Pharmaceuticals & Health Product expenditures vs budget $ 13,662,258 $ 25,161,778
2a. Medicines & pharmaceutical products
2b. Health products and health equipment $ 13,662,258 $ 25,161,778
Reason for variance
Adjustment in cumulative cash outflow as per LFA verified PUDR from semester 2 (July-December 2013). From PU 2, the LFA changed the cash outflow reporting method. As per the new approach, the LFA started reporting the cash outflow as PR expenditure + disbursement to SRs , as opposed to SR expenditures in past.
Reason for adjustments
page 16 of 22
IND-M-MOH
Grant Performance ReportExternal Print Version
Last Updated on: 01 September 2014
Rating DescriptionA1 Exceeding expectationsA2 Meeting expectationsB1 AdequateB2 Inadequate but potential demonstratedC Unacceptable
2.4. Progress Update and Disbursement Information
Progress Updates Disbursement Information
PU PU Period TGF Rating DR DR Period
Covered PR Request Disbursement Amount
Disbursement Date
0 01.Mar.13 - N/A 1.0.1 01.Mar.13 - 31.Mar.14 12,587,158 $ 10,828,392 17 Jun 2013
Summary of Progress Reasons for variance between PR Request and Actual Disbursement
First disbursement This is the first disbursement for IND-M-MOH. Disbursement includes VPP orders below; VPP order for 1,937,646 RDTs 2013-2014VPP order for 1,832,855 LLINs 2013-2014VPP order for 1,086,624 LLINs 2014
Disbursement for PR follows approved workplan and budget with less 10% absorbtion adjustment to the budget for buffer period.
page 17 of 22
IND-M-MOH
Grant Performance ReportExternal Print Version
Last Updated on: 01 September 2014

Progress Updates Disbursement Information
PU PU Period TGF Rating DR DR Period
Covered PR Request Disbursement Amount
Disbursement Date
0 01.Mar.13 - N/A 1.1.1 01.Mar.13 - 31.Mar.14 15,206,422 $ 12,873,574 07 Oct 2013
Summary of Progress Reasons for variance between PR Request and Actual Disbursement
First disbursement This is a revision in the annual disbursement decision due to a recent increase in grant amount of USD 15,302,925 for IND-M-MoH under the New Funding model interim applicant mechanism. The original ADMF was processed on 30 May 2013 for a total amount of USD 18,859,968. Out of this, USD 14,311,609 has been disbursed to date with USD 4,548,349 remaining to be disbursed under the originally scheduled cash transfers.The current modification of the annual disbursement decision updates the annual forecast for 1-Mar-13 to 31-Mar-14 to take into account the updated grant budget for the period. As a result of the updated budget and forecast, the annual disbursement decision is increased by USD 13,855,339 of which USD 12,873,574.49 will go to VPP for procurement of LLINs and USD 981,765 will be disbursed to the PR in addition to the originally scheduled cash transfers under the ADMF processed in May 2013.Revised Annual Disbursement Recommendation 32,715,296.99Less disbursements already made to PR and VPP in June2013 14,311,609U.S10DRevised amount for annual disbursement USD 18,403,687.89
Progress Updates Disbursement Information
PU PU Period TGF Rating DR DR Period
Covered PR Request Disbursement Amount
Disbursement Date
0 01.Mar.13 - N/A 1.1.2 01.Mar.13 - 31.Mar.14 15,206,422 $ 2,225,531 06 Nov 2013
Summary of Progress Reasons for variance between PR Request and Actual Disbursement
First disbursement This is a release of first cash tranche under the annual disbursement decision. The updated cash balance (PR+SR) as of 25-Oct-13 is $2,385,541. Of this cash balance, $1,146,907 relate to distribution costs for LLINs (central to district and district to end user), which the PR is expecting to arrive in December 2013. Considering that the cash balance is still relatively high, however also acknowledging that a large portion of it will be needed for the distribution of LLINs starting in December, the Country team recommends release of the scheduled cash transfer -$2,225,531.40 This cash transfer itself also includes funds for LLIN distribution - $436,769 per budget, which will be needed upon the delivery of the LLINs in country. Last but not least, this recommendation is also a precaution to avoid possible shortage of cash and programmatic set-back towards end of the year and beginning of 2014, when release of disbursements will not be possible due to end of year financial closure. If absorption by the end of the year remains low, the extra cash will be deducted from the subsequent cash tranche in Q1 of 2014.
page 18 of 22
IND-M-MOH
Grant Performance ReportExternal Print Version
Last Updated on: 01 September 2014

Progress Updates Disbursement Information
PU PU Period TGF Rating DR DR Period
Covered PR Request Disbursement Amount
Disbursement Date
0 01.Mar.13 - N/A 1.1.2 01.Mar.13 - 31.Mar.14 15,206,422 $ 3,163,862 01 Apr 2014
Summary of Progress Reasons for variance between PR Request and Actual Disbursement
First disbursement The release of the last cash transfer under this ADMF covering period Jan-Mar 2013 and originally scheduled for 10-Jan-14 has been delayed due to relatively high cash balance in country. The Country Team has been monitoring the cash balance on a monthly basis. According to latest update, as at 15-Mar-14 the PR+SR cash balance was $1,670,234. Against this, the PR reports $1,188,899 obligated budget related mostly to custom clearance and distribution of 1st badge of LLINs and RDTs. In addition, $519,633 is tied to on-going bidding process for custom clearance, distribution and warehousing of 2nd badge of LLINs and RDTs. As a result, effectively the entire cash in country is linked to payments which will need to be settled fairly soon to avoid delays in the distribution of LLINs and RTD. In the meantime, the PR will have to continue will a few other critical procurements related to the Q1 budget, namely lab supplies, quality assurance and custom clearance of 3rd badge of LLINs and RDTs totalling $3,125,564. Therefore, considering that the next ADMF will not be processed before end April/ early May in order to avoid programmatic delays and setback, the CT recommends processing cash transfer in the amount of $3,163,862 = ($1,188,899+$519,633 +$3,125,564 -$1,670,234 )
Progress Updates Disbursement Information
PU PU Period TGF Rating DR DR Period
Covered PR Request Disbursement Amount
Disbursement Date
1 01.Mar.13 - 30.Jun.13 A2 N/A
Summary of Progress Reasons for variance between PR Request and Actual Disbursement
Out of 10 indicators, the PR has achieved the intended target for 7 indicators, 1 indicator is under achieved and 2 indicators are not applicable during the period.
The CT thinks that A2 accurately reflects the overall performance of the PR. Out of 5 unmet STCs, 2 STCs are not entirely within the control of the PR (1 and 2) and need to be postponed, so this should not affect their performance rating. Expenditure absorption of 82% in the first period of this new grant is also not concerning. Also, outstanding management actions are not severe enough to downgrade rating of the grant.
page 19 of 22
IND-M-MOH
Grant Performance ReportExternal Print Version
Last Updated on: 01 September 2014

Progress Updates Disbursement Information
PU PU Period TGF Rating DR DR Period
Covered PR Request Disbursement Amount
Disbursement Date
2 01.Jul.13 - 31.Dec.13 A2 2 01.Jan.14 -
31.Mar.15 16,004,277 $ 189,129 08 Jul 2014
Summary of Progress Reasons for variance between PR Request and Actual Disbursement
Following the analysis of the overall performance of the Program, including the implementation of activities, completion of conditions and management actions, as well as program management from 1 July – 31 December 2013, the Global Fund has decided to give the Principal Recipient an A2 rating.
This represents an upgrade to the PR’s programmatic rating of B1. The programmatic performance during previous semester was A2 and current decrease in the achievement is due to underperformance against a top ten indicator related to LLINs distribution in the coverage areas.
The Country Team has decided to upgrade the rating to A2 in view of the fact that the PR began the VPP order process in April 2013, which was within 1 month of grant signing. We note that the PR worked effectively with the Procurement Agent to try to get earliest possible delivery of the LLINs. The fact that delivery was not possible in time to meet the Period 2 distribution target was beyond the PRs control. LLINs have since been delivered and we hope that PR will be able to fully catch up the distribution target during the current semester.
The PR is advised to urgently resolve new and previous management issues – a slow progress in resolving these issues could potentially lead to a downgrade in the programmatic rating.
The disbursement of USD 8,403,799 has been approved according to the grant approved budget and workplan. The disbursement has been calculated as per following details:
Annual Disbursement Recommendation:Approved budget January - December 2013 USD 15,913,410
Buffer period (Jan – March 2015): $0, since NFM grant is planned to start 1 –Jan-15 USD 0Commitments USD 394,527Carry-forward activities at PR level USD 186,257Less anticipated savings at PR level USD -1,827,799Carry forward activities at SR level USD 643,324Less anticipated savings at SR level USD -1,049,948Less 3 % absorption adjustment on carry-forward activities USD -24,367 Total forecast USD 14,235,404 Less cash balance at PR level USD -2,003,304 Less cash balance at SR level USD -664,439 Less cash in transit USD - 3,163,862Disbursement amount USD 8,403,799 The disbursement forecast is explained as below:
• Savings due to FX gain are as a result of significant appreciation of the Indonesian Rupiah. The budget rate is 1USD=9,000 IDR whereas the forecast has been re-valued to the average rate of the past six months – 1USD=11,162 IDR• Commitments at PR level relate to handling costs for RDTs and LLINs• Carry-forward activities at PR level are for RDT handling costs, QA cost, and media campaign including radio/TV spots• Carry-forward budget at SR level is mostly related to LLIN distribution costs
Of the total forecast of $ 14,235,404, 50% will be spent on health product procurement and distribution costs, 25% - HR and administrative costs and the rest on supervision and other program related costs.
In accordance with the Global Fund’s policy on Annual Disbursement Decisions, the disbursement will be transferred to the PR in tranches depending on verification of cash balance. The estimated timing of tranche release is as follows:
Jan-Jun forecast $8,683,679 Less PR cash balance -$2,003,304)Less SR cash -$ 664,439)Less cash in transit -$3,163,862)Total disbursement $2,852,074, Disbursement to VPP for RDTs procurement $1,056,145 (upon receipt of quotes)
1st cash transfer to PR USD 1,795,929 to be made in June 2014
July-December forecast: $5,551,725 equal to 2nd cash tranche to be disbursed in August 2014
page 20 of 22
IND-M-MOH
Grant Performance ReportExternal Print Version
Last Updated on: 01 September 2014

Title Explanatory Notes
2.5. Contextual Information
Progress Updates Disbursement Information
PU PU Period TGF Rating DR DR Period
Covered PR Request Disbursement Amount
Disbursement Date
2 01.Jul.13 - 31.Dec.13 A2 6 01.Jan.14 -
31.Mar.15 16,004,277 $ 5,551,725 25 Aug 2014
Summary of Progress Reasons for variance between PR Request and Actual Disbursement
Following the analysis of the overall performance of the Program, including the implementation of activities, completion of conditions and management actions, as well as program management from 1 July – 31 December 2013, the Global Fund has decided to give the Principal Recipient an A2 rating.
This represents an upgrade to the PR’s programmatic rating of B1. The programmatic performance during previous semester was A2 and current decrease in the achievement is due to underperformance against a top ten indicator related to LLINs distribution in the coverage areas.
The Country Team has decided to upgrade the rating to A2 in view of the fact that the PR began the VPP order process in April 2013, which was within 1 month of grant signing. We note that the PR worked effectively with the Procurement Agent to try to get earliest possible delivery of the LLINs. The fact that delivery was not possible in time to meet the Period 2 distribution target was beyond the PRs control. LLINs have since been delivered and we hope that PR will be able to fully catch up the distribution target during the current semester.
The PR is advised to urgently resolve new and previous management issues – a slow progress in resolving these issues could potentially lead to a downgrade in the programmatic rating.
Release of second cash tranche under the annual disbursement decision.
Time-bound Actions
Issues Description
2.6. Phase 2/ Periodic Review Grant Renewal
Performance Rating Recommendation Category
Rationale for Phase 2/ Periodic Review Recommendation Category
Rationale for Phase 2/ Periodic Review Recommendation Amount
page 21 of 22
IND-M-MOH
Grant Performance ReportExternal Print Version
Last Updated on: 01 September 2014
page 22 of 22
IND-M-MOH
Grant Performance ReportExternal Print Version
Last Updated on: 01 September 2014