Embed Size (px)
Citation preview

NORTHERN ARIZONA UNIVERSITY CLIMATE SCIENCE & SOLUTIONS PROGRAM
2011
Authored by: Chase Waddell, Annikki Chamberlain, Erin Henry, Nevin Kohler
Grand Canyon Railway
Greenhouse Gas Inventory Report
2008-2010

1
Gra
nd
Ca
nyo
n R
ailw
ay
| 4
/1
1/2
01
1
Grand Canyon Railway
Greenhouse Gas Inventory Report
Table of Contents:
Table of Contents 1
List of Tables and Figures 3
Executive Summary 5
Introduction 7
Methodology 8
Scope 8
Inventory Results 10
Section 1: Locomotive Shop Emissions 10
1.1 Electricity Related Emissions 10
1.2 Welding Gas Consumption Emissions 11
1.3 Propane Consumption Emissions 11
1.4 Locomotive Shop Emissions 12
1.5 HVAC Maintenance Emissions 12
Section 2: Locomotive Diesel Emissions 14
2.1 Diesel Consumption Emissions 14
2.2 Waste Vegetable Oil Consumption Emissions 14
Section 3: Summary of GCR Operations Total Emissions 2008-2010 16
3.1 Locomotive Shop Total Emissions 16
3.2 Locomotive Total Direct Emissions 17
3.3 GCR Operations Total Emissions 18
Section 4: Emissions Scenarios 19
4.1 Scenario 1 – Baseline Emissions 19
4.2 Scenario 2 – Current Emissions & Realized Emissions Reductions 19
4.3 Scenario 3 – Future Emissions & Planned Reductions 22
Section 5: Transportation Comparison Analysis 24

2
Gra
nd
Ca
nyo
n R
ailw
ay
| 4
/1
1/2
01
1
5.1 Road Travel 24
5.2 GCR Travel 24
5.3 Break Even Passenger Counts 25
5.4 CO2 Intensity Ratios 25
5.5 Emissions Savings 26
5.6 Estimated Annual CO2 Emissions Savings 26
Recommended Actions 28
6.1 CFC Refrigerant Phase-out 28
6.2 Increased Data Collection and Periodic Review 29
Appendix A 30
Appendix B 32
Appendix C 34
Appendix D 35
Appendix E 39

3
Gra
nd
Ca
nyo
n R
ailw
ay
| 4
/1
1/2
01
1
List of Tables and Figures:
Figure 1.1 Total Electricity Related GHG Emissions for Locomotive Shop Operations 2008-2010
10
Table 1.1 Contributions to Total GHG Emissions from Each GHG for Electricity Consumption 2008-2010
11
Figure 1.2 GHG Emissions from Welding Gas Consumption 2010 11
Table 1.2 Contributions to Total GHG Emissions from Each GHG for Welding Gas Consumption 2010
11
Figure 1.3 Total GHG Emissions from Propane Combustion, 2008-2010 11
Table 1.3 Contributions to Total GHG Emissions from Each GHG for Propane Combustion 2008-2010
12
Table 1.4 Contributions to Total GHG Emissions from Each GHG for Locomotive Shop Heaters 2010
12
Figure 1.5.1 GHG Emissions from HVAC Operations 2008-2010 12
Figure 1.5.2 Contribution of PFCs and CFCs to Total HVAC Emissions 2008-2010 13
Figure 2.1 Total GHG Emissions from Locomotive Diesel Fuel Combustion 2008-2010 14
Table 2.1 Contributions to Total GHG Emissions from Each GHG for Locomotive Diesel Fuel Combustion 2008-2010
14
Figure 2.2 Total GHG Emission from Locomotive Waste Vegetable Oil Combustion 2009-2010
14
Table 2.2 Contributions to Total GHG Emissions from Each GHG for Locomotive Waste Vegetable Oil Combustion 2009-2010
15
Figure 3.1.1 Contribution to Total Locomotive Shop GHG Emissions by Gas 2010 16
Figure 3.1.2 Contribution to Total Locomotive Shop GHG Emissions by Operation 2010 16
Table 3.1 Total Locomotive Shop GHG Emissions by Operation 2008-2010 17
Figure 3.2.1 Contribution to Total Locomotive Direct GHG Emissions by Gas 2010 17
Figure 3.2.2 Contribution to Total Locomotive Direct GHG Emissions by Fuel 2010 17
Table 3.2 Total Direct Locomotive GHG Emissions by Fuel 2008-2010 17
Figure 3.3.1 Contribution to Total GHG Emission for GCR Operations by Gas 2008-2010 18
Figure 3.3.2 Contribution to GCR Total GHG Emissions by Operation 2010 18
Table 3.3 Total Locomotive Shop GHG Emission by Operation 2008-2010 18
Figure 4.1 2008 GHG Emissions by Operation (metric tons CO2e)—Baseline Scenario 19
Figure 4.2 2010 GHG Emissions by Operation (metric tons CO2e)—Current Scenario 19
Table 4.2 Realized Emissions Reductions from Baseline Scenario 20

4
Gra
nd
Ca
nyo
n R
ailw
ay
| 4
/1
1/2
01
1
Figure 4.3.1 Potential Reduction in GHG Emissions Resulting from PV System Installation 22
Figure 4.3.2 Percent of Electricity Supply by Source After PV System Installation 22
Figure 4.3.3 Reduction in GHG Emissions from the GCR from PV System Installation 22
Table 5.3 Fuel Efficiency Estimates, CO2 Intensity, and Break Even Passenger Counts for Road Travel
25
Table 5.4 CO2 Intensity Ratios for GCR to Road Travel Under Various Occupancy Scenarios 25
Figure 5.5 Estimated Total CO2 Emissions Savings from GCR Travel vs. Road Travel Under Various Occupancy and Vehicle Fuel Economy Scenarios for a One Way 65 Mile Trip
26
Table 5.6 Estimated Annual Emissions Savings from GCR Travel vs Road Travel Under Various Fuel Economy Scenarios 2009
27
Figure 6.1 Potential GHG Reduction from Replacing R-22 with R-134a 28

5
Gra
nd
Ca
nyo
n R
ailw
ay
| 4
/1
1/2
01
1
Executive Summary
The Grand Canyon Railway (GCR), located in Williams, AZ, is owned and operated by Xanterra Parks and
Resorts. The main attraction of the GCR is a 130 mile round trip train ride from Williams to the South Rim
of Grand Canyon National Park. The GCR initiated the International Organization for Standardization
(ISO) 14001 Environmental Management System (EMS) in 2008 and earned certification in 2009. The ISO
EMS is a voluntary, third party verified process adopted to ensure environmental protection, regulatory
compliance, continual improvement, and pollution prevention. Implementation of the ISO EMS resulted in
significant reductions in waste generation, water use, and greenhouse gas emissions at the GCR. This
report assesses GHG emissions reductions in locomotive operations between 2008 and 2010 according to
the international standard ISO 14064-1 and the climate registry greenhouse gas reporting protocol. In
addition, this report provides an analysis of per capita GHG emissions resulting from locomotive transport
into the Grand Canyon National Park compared to personal vehicle transport and concludes with
recommendations.
Overall GHG emissions from the Grand Canyon Railway locomotive operations decreased from 5,037.2
metric tons CO2e in 2008 to 2,572.6 metric tons CO2e in 2010, a 49% reduction. Greenhouse gas
emissions resulting from electricity consumption decreased from 328.0 metric tons CO2e in 2008 to 219.8
metric tons CO2e, a 33% reduction. Propane consumption decreased by 68% between 2008 and 2010,
from 60.5 metric tons CO2e to 19.2 metric tons CO2e. Emissions from the heating, ventilation, and air
conditioning decreased from 73.9 metric tons CO2e to 20.1 metric tons CO2e between 2008 and 2010, a
72% reduction. Data for welding gas operations and waste oil consumption in the locomotive shop heaters
were only available for 2010 and totaled 0.3 metric tons CO2e and 110.4 metric tons CO2e, respectively.
The largest reduction in direct greenhouse gas emissions occurred from a change in locomotive operation
procedures and resulted in an emission reduction of 4464.1 metric tons CO2e in 2008 to 2122.1 metric
tons CO2e in 2010. This is a 52% reduction in GHG emissions. In 2009 the GCR switched the steam engine
locomotives fuel from diesel fuel to 100% waste vegetable oil. Emissions from WVO are considered carbon
neutral due to the biogenic nature of the fuel and, therefore, represent a decrease in fossil fuel derived
emissions. Each metric ton of CO2e emissions resulting from WVO use eliminates 1.05 metric tons of
CO2e emissions that would have occurred from diesel fuel consumption. Emissions associated with WVO
use increased from 61.3 metric tons CO2e in 2009 to 81.2 metric tons CO2e in 2009.

6
Gra
nd
Ca
nyo
n R
ailw
ay
| 4
/1
1/2
01
1
A comparison of the CO2 emissions resulting from Park visitors traveling to the South Rim via the GCR
verses visitors traveling by personal vehicle concluded that train travel is more efficient and results in a net
CO2 emissions savings. Estimated CO2 emissions savings from train travel range from 244 metric tons CO2e
annually to 2,483 metric tons CO2e annually, depending on the type of vehicle fleet considered in the
comparison.
We recommend that the Grand Canyon Railway phase out the use of refrigerants containing HCFCs per the
Montreal Protocol, increase data collection, and conduct periodic reviews of the data in order to refine
calculation of emissions estimations and reductions.
-§-

7
Gra
nd
Ca
nyo
n R
ailw
ay
| 4
/1
1/2
01
1
Introduction
The Grand Canyon Railway (GCR), owned and operated by Xanterra Parks and Resorts, is located in
Williams, AZ. The GCR operates both diesel and steam engine locomotives to transport passengers from
Williams to the South Rim of the Grand Canyon National Park. The 130 mile round trip to the Grand
Canyon is made daily by one of 12 diesel locomotives, transporting over 200,000 passengers annually, and
several times a year one of the two GCR steam engines are engaged for the trip. The Grand Canyon
Railway complex has a number of different operations including a hotel, RV park, kennel, and train depot;
however, the facilities directly associated with the locomotive operations consist of locomotives and the
locomotive shop, which is used for all locomotive maintenance.
In 2008, the GCR initiated the International Standards Organization (ISO) 14001 certification process,
which required the implementation of an Environmental Management System (EMS), and achieved
certification in August 2009. The ISO EMS is a voluntary, third party verified process adopted to ensure
environmental protection, regulatory compliance, continual improvement, and pollution prevention.
Implementation of the EMS at the GCR has resulted in many environmental performance improvements
such as a greater than 99% reduction in hazardous waste generation (49+ tons), implementation of a
property-wide recycling program, and a 35 % decrease in water consumption1.
To reflect the impact of the ISO EMS, this report quantifies the greenhouse gas (GHG) emissions for the
GCR locomotive shop and locomotives according to three separate scenarios:
Scenario 1: ―Baseline‖ operations prior to implementation of current operating conditions.
Outlining this scenario allows for quantification of the GHG reductions already realized due to
changes in operating procedure.
Scenario 2: ―Current‖ operations of GCR. This scenario is based on actual GHG emissions data for
the most recent year of operations (2010) and will incorporate all environmentally sustainable
practices currently in effect.
Scenario 3: ―Planned‖ operations of GCR. This scenario allows for an estimation of GHG emission
reductions that will be realized by operational changes that are planned for the near future. Such
changes outlined by GCR include: fuel switching for heating units in the maintenance shop
1 For more information on The Grand Canyon Railway ISO 14001 Environmental Management System, please visit: www.thetrain.com

8
Gra
nd
Ca
nyo
n R
ailw
ay
| 4
/1
1/2
01
1
(petroleum oil to waste vegetable oil), installation of a photovoltaic system on the maintenance
shop, and fuel switching the diesel locomotives to a waste vegetable oil blend.
In addition to a standard inventory of GHG emissions, this report provides a comparison of per capita GHG
emissions resulting from locomotive transport and personal vehicle transport for a trip to the South Rim of
Grand Canyon National Park.
Methodology
Greenhouse gas emissions were calculated using the following:
The Climate Registry General Reporting Protocol for the Voluntary Reporting Program Version
1.1 (TCR-GRP).
International Organization for Standardization (ISO) 14064:2006
Scope
Each of the greenhouse gases regulated under the Kyoto Protocol are quantified individually and then
converted to carbon dioxide equivalent units (CO2e). These GHG’s are as follows:
carbon dioxide (CO2),
methane (CH4),
nitrous oxide (N2O),
hydrofluorocarbons (HFCs),
perfluorocarbons (PFCs), and
sulfur hexafluoride (SF6).
The Grand Canyon Railway’s GHG emissions were evaluated according to direct GHG emissions (Scope 1)
and indirect GHG emissions (Scope 2). A general breakdown of emission sources is as follows:
Scope 1 evaluation includes the following direct emission source types located within the GCRs
operational boundaries (locomotives and locomotive shop): stationary combustion, mobile
combustion, physical and chemical processes, and fugitive sources.
Scope 2 evaluation includes indirect emissions that are not released within the operational
boundaries of the GCR but are attributable to consumption within the GCR boundaries (i.e.

9
Gra
nd
Ca
nyo
n R
ailw
ay
| 4
/1
1/2
01
1
electricity use).
The locomotive shop and the locomotives were evaluated separately for a more comprehensive
understanding of GHG sources. GHG emissions resulting from WVO are considered separately to account
for net emissions adjustment due to their biogenic origins.
- § -

10
Gra
nd
Ca
nyo
n R
ailw
ay
| 4
/1
1/2
01
1
Inventory Results
Results are first presented by operations group (Section 1: Locomotive Shop Emissions and Section 2:
Locomotive Direct Emissions) with a breakdown of individual emissions sources. Total operation emissions
for years 2008-2010 (Section 3) and emissions for Scenarios 1 through 3 follow (Section 4).
Section 1: Locomotive Shop Emissions
GHG emissions from operations contained within the locomotive shop are attributable to five categories:
electricity consumption for general operations and water heating; welding gas consumption for welding
operations; propane consumption for overhead space heaters; waste oil consumption for shop heaters; and
losses of refrigerant in heating, cooling and ventilation maintenance (HVAC) operations. Inventory results
and calculation details for each category are found below.
1.1 Electricity Related Emissions
GHG emissions related to electricity
consumption result from combustion of
fossil fuels at power generation facilities.
Consumption of electricity for the GCR
operations consists of all electricity
consumed at the locomotive shop.
Consumption data, provided by Xanterra,
was taken from historic meter billing
information and regional emissions factors
for the Southwest were employed in
emissions calculations (Appendix A, Box 1.1). Electricity related GHG emissions for the GCR locomotive
shop decreased from 328.0 metric tons CO2e in 2008 to 219.3 metric tons CO2e in 2009 followed by a
slight increase in 2010 to 219.8 metric tons CO2e (Figure 1.1). Contributions to total GHG emissions for
each combustion gas are detailed in Table 1.1.
0
50
100
150
200
250
300
350
20082009
2010
328.0
219.3 219.8
Me
tric
to
n C
O2e
FIGURE 1.1 TOTAL ELECTRICITY RELATED GHG EMISSIONS FOR LOCOMOTIVE
SHOP OPERATIONS 2008-2010

11
Gra
nd
Ca
nyo
n R
ailw
ay
| 4
/1
1/2
01
1
Table 1.1) Contributions to Total GHG Emissions from Each GHG for Electricity Consumption 2008-2010
Year Individual GHG Emissions (Metric Tons CO2e)
CO2 CH4 N2O Total
2008 326.5 0.1 1.4 328.0
2009 218.3 0.07 0.9 219.3
2010 218.8 0.07 0.9 219.8
1.2 Welding Gas Consumption Emissions
Welding gas consumption data for the locomotive shop,
provided by Xanterra, was taken from annual purchase
receipts and annual purchases were assumed to be equal
to annual consumption (i.e. all gas purchased was
consumed during the year). Two welding gases utilized
in shop operations result in GHG emissions: direct CO2
emissions from Praxair StarGoldTM CO2/Ar shielding
gas mix, and CO2 emissions from acetylene combustion. Calculations for welding gas emissions are shown
in Appendix A, Box 1.2. Welding gas emissions were available for 2010 only and totaled 0.32 metric tons
CO2e (Figure 1.2).
Table 1.2) Contributions to Total GHG Emissions from Each GHG for Welding Gas Consumption in 2010.
Year Individual GHG Emissions (Metric Tons CO2e)
CO2 CH4 N2O Total
2010 0.3 0 0 0.3
1.3 Propane Consumption Emissions
GHG emissions from propane consumption for the
locomotive shop result from onsite combustion.
Propane consumption data, provided by Xanterra,
was taken from historic meter billing information.
Calculations for propane consumption emissions are
0.0
0.1
0.2
0.3
0.4
AcetyleneStarGold C-25
0.3
0.02
Me
tric
To
n C
O2e
FIGURE 1.2 GHG EMISSIONS FROM WELDING GAS CONSUMPTION IN 2010
0
10
20
30
40
50
60
70
20082009
2010
60.5
12.5 18.7
Me
tric
to
ns
CO
2e
FIGURE 1.3 TOTAL GHG EMISSIONS FROM PROPANE
COMBUSTION 2008-2010

12
Gra
nd
Ca
nyo
n R
ailw
ay
| 4
/1
1/2
01
1
shown in Appendix A, Box 1.3. GHG emissions from propane use decreased from 60.5 metric tons CO2e
in 2008 to 12.5 metric tons CO2e with a slight increase to 18.7 metric tons CO2e in 2010 (Figure 1.3).
Contributions to total GHG emissions for each combustion gas are detailed in Table 1.3.
Table 1.3) Contributions to Total GHG Emissions from Each GHG for Propane Combustion 2008-2010
Year Individual GHG Emissions (Metric Tons CO2e)
CO2 CH4 N2O Total
2008 60.0 0.2 0.2 60.5
2009 12.4 0.04 0.04 12.5
2010 18.5 0.07 0.06 18.7
1.4 Locomotive Shop Heater Emissions
GHG emissions from operation of locomotive shop heaters result from onsite combustion of waste oil
collected from the locomotives. Data was provided by Xanterra and taken from heater fuel usage logs.
Emissions calculations for the heaters are shown in Appendix A, Box 1.4. Data on fuel use was available for
2010 only with associated GHG emissions totaling 110.4 metric tons CO2e. Contributions to total GHG
emissions for each combustion gas are detailed in Table 1.4.
Table 1.4) Contributions to Total GHG Emissions from Each GHG for Locomotive Shop Heaters 2010
Year Individual GHG Emissions (Metric Tons CO2e)
CO2 CH4 N2O Total
2010 109.0 0.2 1.3 110.4
1.5 HVAC Maintenance Emissions
GHG emissions from HVAC maintenance operations
in the locomotive shop result from leakage of
refrigerant equipment associated with the
locomotives. Data for refrigerant leakage was
calculated from HVAC maintenance logs. All
refrigerant added to equipment in an annual period
0
10
20
30
40
50
60
70
80
20082009
2010
73.9
23.1 20.1
Me
tric
to
ns
CO
2e
FIGURE 1.5.1 GHG EMISSIONS FROM HVAC OPERATIONS 2008-2010

13
Gra
nd
Ca
nyo
n R
ailw
ay
| 4
/1
1/2
01
1
was assumed to be equal to the amount of
refrigerant lost in that period. In 2008
through 2010, three separate refrigerants
were used in HVAC maintenance
operations: R-22, R-134A, and MP-39. R-
22 and MP-39 are HCFCs and are not
required to be reported by the TCR-GRP;
however, they were included in this report
because they are a significant source of
GHG emissions. R-134A is an HFC, and
represents the only HFC emissions for the covered time period. Emissions calculations for HVAC
maintenance operations are shown in Appendix A, Box 1.5. HVAC GHG emissions totaled 73.9 metric
tons CO2e in 2008, dropped sharply to 23.1 metric tons CO2e in 2009 and decreased slightly to 20.1
metric tons CO2e in 2010 (Figure 1.5.1). The contribution to total HVAC emissions from HCFCs is
greater than HFCs (Figure 1.5.2).
- § -
FIGURE 1.5.2 CONTRIBUTION OF CFCS AND HCFCS TO TOTAL
HVAC EMISSIONS
0.0
10.0
20.0
30.0
40.0
50.0
60.0
70.0
80.0
20082009
2010
73.6
12.5 14.8
0.3
10.6 5.3
Me
tric
To
ns
CO
2e
HFC
HCFC

14
Gra
nd
Ca
nyo
n R
ailw
ay
| 4
/1
1/2
01
1
Section 2: Locomotive Emissions GHG emissions from locomotive operations result from combustion of both diesel fuel and waste vegetable
oil in the locomotive engines. Inventory results and calculation details for each fuel are found below.
2.1 Diesel Consumption Emissions GHG emissions from diesel consumption in the
locomotive operations result from combustion of
diesel fuel in both passenger and supporting
locomotive engines. Data for diesel consumption
were provided by Xanterra and taken from total fuel
consumption logs. Calculations for diesel
combustion emissions are shown in Appendix A, Box
2.1. GHG emissions for diesel combustion totaled
4,464.1 metric tons CO2e in 2008, dropped by
roughly half to 2,238.4 metric tons CO2e in 2009 and dipped slightly to 2,122.1 metric tons CO2e in 2010
(Figure 2.1). Contributions to total GHG emissions for each combustion gas are detailed in Table 2.1.
Table 2.1) Contributions to Total GHG Emissions from Each GHG for Locomotive Diesel Fuel Combustion 2008-2010.
Year Individual GHG Emissions (Metric Tons CO2e)
CO2 CH4 N2O Total
2008 4421.9 7.3 34.9 4464.1
2009 2217.3 3.6 17.5 2238.4
2010 2102.0 3.5 16.6 2122.1
2.2 Waste Vegetable Oil Consumption Emissions
GHG emissions from waste vegetable oil (WVO)
consumption in the locomotive operations result from
combustion of the oil in the steam locomotive engines.
The CO2 emissions are biogenic in nature due to the
biological origins of WVO and are considered separately
from the fossil fuel derived CO2e emissions. Data for
0
20
40
60
80
100
20092010
61.3
81.2
Me
tric
to
ns
CO
2e
0
1000
2000
3000
4000
5000
20082009
2010
4464.1
2238.4 2122.1
Me
tric
to
ns
CO
2e
FIGURE 2.1 TOTAL GHG EMISSIONS FROM LOCOMOTIVE D IESEL
FUEL COMBUSTION 2008-2010
FIGURE 2.2 TOTAL GHG EMISSION FROM LOCOMOTIVE
WASTE VEGETABLE OIL COMBUSTION 2009-2010

15
Gra
nd
Ca
nyo
n R
ailw
ay
| 4
/1
1/2
01
1
WVO consumption was provided by Xanterra and taken from total fuel consumption logs. Calculations for
WVO emissions are shown in Appendix A, Box 2.2. GHG emissions for WVO combustion totaled 61.3
metric tons CO2e in 2009 and rose modestly to 81.2 metric tons CO2e in 2010 (Figure 2.2). Contributions
to total GHG emissions for each combustion gas are detailed in Table 2.2.
Table 2.2) Contributions to Total GHG Emissions from Each GHG for Locomotive Waste Vegetable Oil Combustion 2009-2010
Year Individual GHG Emissions (Metric Tons CO2e)
CO2 CH4 N2O Total
2009 60.7 0.1 0.5 61.3
2010 80.4 0.1 0.7 81.2
- § -

16
Gra
nd
Ca
nyo
n R
ailw
ay
| 4
/1
1/2
01
1
Section 3: Summary of GCR Operations Total Emissions 2008-2010
GHG emissions from individual operations were aggregated to acquire total values for all GCR operations.
Below, these totals are first aggregated into locomotive shop (3.1) and locomotive direct emissions totals
(3.2), and then combined for all GCR operations (3.3). Contributions to total emissions are given both by
individual GHG’s and individual operations to allow for comparison. Data for welding gas emissions and
shop heater emissions were available for 2010 only; therefore, 2010 data was used to estimate emissions for
the 2008 and 2009. It is assumed that consumption of fuel for shop heaters and welding gas did not vary
substantially from 2008 to 2010. Data used for all totals and contributions are presented in tabular form in
Appendix C.
3.1 Locomotive Shop Total Emissions
Table 3.1 shows the trend in shop emissions from
2008 to 2010. Contributions of each GHG to
total emissions for 2010 are detailed in Figure
3.1.1. As can be seen, emissions were dominated
by CO2 (94%). Total CO2e emissions decreased
from 573.1 metric tons CO2e in 2008 to 365.6 in
2009. This decline is due mainly to reduced
electricity consumption at the locomotive shop, although propane and HVAC emissions also decreased
slightly. Emissions increased slightly in 2010 to 369.3 metric tons CO2e due to an increase in propane
consumption (electricity consumption was essentially the same). Contributions to total locomotive shop
GHG emissions from the individual operations in the shop are detailed for 2010 in Figure 3.1.2. Welding
gas emissions constitute a very small
portion of shop GHG emissions
(0.088%), with electricity dominating
the emissions profile (60%).
FIGURE 3.1.1 CONTRIBUTION TO TOTAL LOCOMOTIVE SHOP GHG EMISSIONS BY GAS, 2010
60%
30%
5%
5% 0.083%
0.005%
Electric
Shop Heaters
HVAC
Propane
Acetylene
StarGold C-25
FIGURE 3.1.2 CONTRIBUTION TO TOTAL LOCOMOTIVE SHOP GHG EMISSIONS
94%
0.08% 0.61% 4.01%
1.44%
6%
CO2
CH4
N2O
HCFC
HFC

17
Gra
nd
Ca
nyo
n R
ailw
ay
| 4
/1
1/2
01
1
Table 3.1) Total Locomotive Shop GHG Emissions by Operation 2008-2010
Year
Operation
Electric Shop Heaters HVAC Propane Acetylene StarGold
C-25 Total
2008 328.0 110.4 73.9 60.5 0.3 0.02 573.1
2009 219.3 110.4 23.1 12.5 0.3 0.02 365.6
2010 219.8 110.4 20.1 18.7 0.3 0.02 346.6
3.2 Locomotive Total Direct Emissions
Table 3.2 shows the trend in locomotive direct
emissions from 2008 to 2010. Contributions of
each GHG to total emissions for 2010 are
detailed in Figure 3.2.1., the majority of which
are from CO2 (99%). Total CO2e emissions
decreased from 4464.1 metric tons CO2e in
2008 to 2299.7 in 2009. Emissions decreased
slightly in 2010 to 2203.2 metric tons CO2e due
to a decrease in diesel consumption.
Contributions to total locomotive direct GHG
emissions from both diesel and WVO are
detailed for 2010 in Figure 3.2.2. WVO
emissions constituted a small portion of
locomotive GHG emissions (4%), with diesel
dominating the emissions profile (96%).
Table 3.2) Total Direct Locomotive GHG Emissions by Fuel 2008-2010
Year Fuel Diesel WVO Total
2008 4,464.1 0 4,464.1
2009 2,238.4 61.3 2,299.7
2010 2,122.1 81.2 2,203.2
99%
0.16%
0.78%
1%
CO2
CH4
N2O
FIGURE 3.2.1 CONTRIBUTION TO TOTAL LOCOMOTIVE D IRECT
GHG EMISSIONS BY GAS, 2010
96%
4%
Diesel
WVO
FIGURE 3.2.2 CONTRIBUTION TO TOTAL DIRECT
LOCOMOTIVE GHG EMISSIONS BY FUEL 2010

18
Gra
nd
Ca
nyo
n R
ailw
ay
| 4
/1
1/2
01
1
3.3 GCR All Operations Total
Emissions: Table 3.3. shows the trend in
total GHG emissions for all GCR operations
from 2008 to 2010. Contributions of each
GHG to total emissions for 2010 are
detailed in Figure 3.3.1. Total emissions
were dominated by CO2 (98%). Total
CO2e emissions decreased from 5,037.2
metric tons CO2e in 2008 to 2,665.9 in
2009. Emissions decreased slightly in 2010 to 2572.6 metric tons CO2e due to the decrease in locomotive
diesel consumption. Contributions to total GHG emissions from GCR for each operation are detailed for
2010 in Figure 3.3.2. Locomotive shop operations as a whole constituted 14% of all GCR emissions, with
locomotive direct emissions representing 86% of the emissions profile. Diesel fuel consumed by the
locomotives themselves represents 84% of all
GCR GHG emissions. The next largest
contributor to GHG emissions was electricity
consumption at the locomotive shop (8.5%).
All other shop operations represented small
portions of the emissions profile. These results
demonstrate that the locomotives themselves are
the primary source of GHG emissions at GCR.
Table 3.3) Total Locomotive Shop GHG Emissions by Operation 2008-2010 Year Operation
Electric Shop Heaters HVAC Propane Acetylene StarGold C-25
Diesel WVO Total
2008 328.0 110.4 73.9 60.5 0.3 0.02 4,464.1 0 5,037.2
2009 219.3 110.4 23.1 12.5 0.3 0.02 2,238.4 61.3 2,665.9
2010 219.8 110.4 20.1 18.7 0.3 0.02 2,122.1 81.2 2,572.6
- § -
FIGURE 3.3.1 CONTRIBUTION TO TOTAL GCR OPERATIONS GHG
EMISSIONS BY GAS, 2010
82.5%
3.2%
8.5%
4.3% 0.8%
0.7%
0.001%
0.012%
14.4%
Diesel
WVO
Electric
Shop Heaters
HVAC
Propane
Acetylene
StarGold C-25
FIGURE 3.3.2 CONTRIBUTION TO GCR TOTAL GHG EMISSIONS BY
OPERATION 2010
98%
0.15%
0.76%
0.58%
0.21%
2%
CO2
CH4
N2O
HCFC
HFC

19
Gra
nd
Ca
nyo
n R
ailw
ay
| 4
/1
1/2
01
1
Section 4: Emissions Scenarios
Xanterra has implemented environmental improvement programs for all operations at the GCR in an effort
to reduce GHG emissions for the entire complex. In order to assist Xanterra in quantifying achieved and
potential emissions reductions, three emissions scenarios have been developed and are presented here.
4.1 Scenario 1—Baseline
Emissions: In order to quantify
the emissions reductions
achieved by Xanterra, 2010
emissions must be compared to a
baseline scenario. Given that
2008 was the year preceding
implementation of the EMS,
quantifying reductions between
then and 2010 allowed for
quantification of the improvements made by implementation of the EMS. As discussed previously, data for
welding gases and shop heater fuel consumption were not available for 2008; therefore, 2010 data are
assumed to be representative of consumption for these operations and are substituted for 2008 data in this
scenario. All 2008 data are presented earlier in the report and are summarized in Figure 4.1.
4.2 Scenario 2—Current
Emissions & Realized
Emissions Reductions: 2010
emissions represent the current
emissions scenario. 2010
emissions data are presented
earlier in the report, and are
summarized in Figure 4.2.
Table 4.2 displays the
reductions achieved between 2008 and 2010 and a discussion follows.
4464.1
328.0
110.4
73.9
60.5 0.31
0.02
Diesel
Electric
Shop Heaters
HVAC
Propane
Acetylene
StarGold C-25
FIGURE 4.1 2008 GHG EMISSIONS BY OPERATION (METRIC TONS CO2e) - BASELINE SCENARIO
2122.1
81.2
219.8
110.4
20.1
18.7 0.31
0.020
Diesel
WVO
Electric
Shop Heaters
HVAC
Propane
Acetylene
StarGold C-25
FIGURE 4.2 2010 GHG EMISSIONS BY OPERATION (METRIC TONS CO2e) - CURRENT SCENARIO

20
Gra
nd
Ca
nyo
n R
ailw
ay
| 4
/1
1/2
01
1
Table 4.2) Realized Emissions Reductions from Baseline Scenario (metric tons CO2e)
Operation 2008 Baseline
Emissions 2010 Current
Emissions Reduction Achieved
% of Baseline Emissions Reduced
Diesel 4464.1 2122.1 2342.0 52
WVO 0.0 81.2 n/a n/a
Electric 328.0 219.8 108.2 33
Shop Heaters 110.4 110.4 0.0 0
HVAC 73.9 20.1 53.8 73
Propane 60.5 18.7 41.8 69
Acetylene 0.3 0.3 0.0 0
StarGold C-25 0.02 0.020 0.0 0
Diesel Reductions: the 52% reduction in diesel related emissions is due to reduced diesel consumption for the
locomotives. Xanterra enacted two strategies to reduce emissions from the GCR. The first was switching
from steam locomotives to modern diesel locomotives which saved 200,000 gallons of diesel fuel a year
(roughly equivalent to 2,050 metric tons CO2e per year). The second strategy was the elimination of the
historic practice of idling locomotive engines when not in use, which saved 18,000 gallons of diesel fuel per
year (roughly equivalent to 185 metric tons CO2e per year). Based on the information provided, it was not
possible to attribute the observed 2,342 metric ton reduction to these two potential sources. Further
refinement of data collection and analysis will shed light on the relative contributions of the two sources.
WVO Reductions: phasing in of WVO for locomotive operations has the effect of displacing diesel fuel.
Reductions from baseline for WVO cannot be interpreted in the same way as for the other operations. An
increase in emission from WVO actually represents a decrease in fossil fuel derived emissions, which is a
positive consequence. The biogenic nature of WVO implies these emissions are actually carbon neutral;
therefore, when WVO replaces diesel, the equivalent diesel emissions are displaced from the total GHG
emissions of GCR. For every gallon of WVO that replaces a gallon of diesel, 10.21 kg of CO2 are removed
from the GHG emissions profile. The 81.2 metric tons of CO2 from WVO actually represent a larger
reduction in diesel CO2 emissions as WVO results in 9.76 kg CO2 per gallon combusted. The ratio of
emissions factors for the two fuels can be used to quantify the larger emissions offset of WVO:

21
Gra
nd
Ca
nyo
n R
ailw
ay
| 4
/1
1/2
01
1
The ratio of 1.05 indicates that for every ton of CO2 emitted from WVO use, 1.05 tons of CO2 emissions
from diesel fuel are eliminated. Therefore, at a substitution ration of one gallon of WVO for one gallon of
diesel, the 81.2 metric tons of CO2 emitted from WVO represents a reduction in diesel emissions of 85.3
metric tons.
Electricity Reductions: Xanterra has audited their electricity consumption for operations in the locomotive
shop and taken steps to reduce consumption and related emissions. For example, solvent degreasing tanks
have been placed on automatic timers to avoid power consumption from heaters and recirculation pumps
during non-business hours. Along with other efficiency efforts, this change in operations led to a 33%
reduction in emissions from baseline.
Shop Heaters: data was not available for 2008. 2010 data was substituted leading to a reduction from
baseline of 0.
HVAC: HVAC emissions were not precisely accounted for. Consumption of refrigerant in a single year was
assumed to be equal to the amount of new refrigerant added. Losses of refrigerant occur over time periods
that may extend past the year in which refrigerant was added. Addition of refrigerant in a single year,
therefore, is not truly indicative of operations in that year. Reductions noted above should be viewed with
this uncertainty in mind. If GCR moves to reduce the amount and type of refrigerant used in operations, a
more precise inventory would allow for more accurate accounting of true emissions and emissions
reductions.
Propane: the primary consumption of propane is for space heaters in the locomotive shop. Xanterra has
made a concerted effort to reduce this function and related emissions. The 69% reductions from baseline
emissions reflect this effort.
Welding Gases: data was not available for 2008. 2010 data was substituted leading to a reduction from
baseline of 0.

22
Gra
nd
Ca
nyo
n R
ailw
ay
| 4
/1
1/2
01
1
4.3 Scenario 3—Future Emissions & Planned
Reductions: planned operational changes at GCR
were analyzed for the future emissions scenario.
Two major changes are currently in progress for
operations at GCR: the installation of a photovoltaic
power generating system on the locomotive shop
and the potential phase-in of WVO for use in the
diesel locomotives and the shop heaters.
Photovoltaic Power System: the GCR has plans to install
a 128 kW Photovoltaic (PV) system on the
locomotive shop roof in the summer of 2011. The
expected electricity generation the first year is
249,000 kWh which will result in a reduction of
approximately 142 metric tons of CO2e. If
electricity usage in 2011 were the same as 2010
usage, the PV system would result in a reduction of
GHG emissions from 219.8 to 77.7 metric tons
CO2e, or roughly 65% (Figures 4.3.1 and 4.3.2).
The GHG emissions savings from the PV installation
translate into a 6% reduction in total GHG
emissions from all GCR operations (Figure 4.3.3).
WVO Substitution: as discussed above, every gallon of
WVO used to replace a gallon of diesel results in
reductions of CO2 emissions at a ratio of 1.05. With
locomotive diesel combustion accounting for 82% of
total GHG emissions, any reductions that can be
made in this area of operations will have substantial
effects on the total emissions profile of the GCR.
While it may not be feasible to replace 100% of
diesel consumption in the locomotives with WVO,
0
50
100
150
200
250
20102011
219.8
77.7
Me
tric
to
ns
CO
2e
FIGURE 4.3.1 POTENTIAL REDUCTION IN GHG EMISSIONS RESULTING
FROM PV SYSTEM INSTALLATION
65%
35%
PV System Electricity Supply
Utility Electricity Supply
FIGURE 4.3.2 PERCENT OF ELECTRICITY SUPPLY BY SOURCE AFTER PV SYSTEM INSTALLATION
0
500
1000
1500
2000
2500
3000
2010 GHGEmissions Potential reduction
due to PV system
2572.6 2430.5
Me
tric
to
ns
CO
2e
FIGURE 4.3.3 REDUCTION IN GHG EMISSIONS FROM THE GCR
DUE TO SOLAR INSTALLATION.

23
Gra
nd
Ca
nyo
n R
ailw
ay
| 4
/1
1/2
01
1
substituting 20% of total diesel consumption with WVO would result in emissions reductions greater than
all locomotive shop operations emissions combined. This perspective can be informative when comparing
cost effectiveness of emissions reductions options. Potential reductions in emissions for WVO substitution
represent the total emissions from diesel fuel (2,122 metric tons); however, exact reductions realized can
only be quantified after substitution has occurred.
- § -

24
Gra
nd
Ca
nyo
n R
ailw
ay
| 4
/1
1/2
01
1
Section 5: Transportation Comparison Analysis
At the request of Xanterra, emissions resulting from travel into the Grand Canyon via GCR locomotive
were compared to emissions resulting from automobile travel. This comparison was framed in the context
of various travel scenarios in an effort to estimate the CO2 intensity of both travel options. The unit chosen
for analysis was kg CO2/Passenger Mile, which allows for direct comparison of the per passenger CO2
emissions resulting from travel for each option. The following is a summary of the Transportation
Comparison Analysis (calculation methodology and assumptions are located in Appendix D).
5.1 Automobile Travel: Two pieces of data were necessary for calculation of average CO2 intensity for
road travel. The first was an estimate of US road fleet fuel economy (miles/gallon) and the second was an
estimate of the average number of passengers that occupy a single vehicle while traveling to Grand Canyon
National Park.
To estimate US fleet fuel economy, three scenarios were utilized to represent a high/medium/low fuel
economy framework. The low fuel economy scenario was taken from US motor vehicle fleet (including
light trucks, buses and motorcycles) fuel economy estimations. Medium fuel economy was taken from US
passenger car fleet fuel economy estimations. Actual data for the low and medium scenarios was only
available up to 2008; hence, the 2008 values were used. For the high fuel economy scenario, the US new
passenger car fleet fuel economy estimations for year 2010 were used. These estimates of fuel economy are
17.4 miles/gallon, 22.6 miles/gallon, and 33.7 miles/gallon, respectively (Table 5.3).
Data available through the National Park Service Public Use Statistics Office allowed for estimation of the
average number of passengers per vehicle (PPV) that enter the South Rim of Grand Canyon National Park.
The mean of monthly average was 2.8 PPV.
5.2 GCR Travel: An average value of CO2 intensity per train mile was calculated and used to derive
multiple passenger occupancy scenarios. The annual travel distance of 47,450 miles was used to estimate
travel for the GCR operation each year (see Appendix D for assumption and explanation). All diesel fuel
consumed in GCR operations was attributed to passenger transport train travel and WVO was excluded
from the analysis due to its biogenic origins. Calculations for train fuel economy yielded an estimate of
0.224 gallons/mile (see Appendix D).

25
Gra
nd
Ca
nyo
n R
ailw
ay
| 4
/1
1/2
01
1
5.3 Break Even Passenger Counts: the first results presented for the comparison analysis present the
minimum number of passengers that must ride the GCR in order for the GCR to be equally CO2 intensive
to road travel (Table 5.3). For the low fuel economy estimate, only 251 passengers must occupy the GCR
in order for the GCR to be equally CO2 intensive. For the high fuel economy estimate, 486 passengers
would be necessary for the GCR to be equally CO2 intensive. In 2009, each 65 mile one way trip to the
canyon averaged 541 passengers. As can be seen, even under the most conservative scenario, the GCR is
less CO2 intensive than road travel.
Table 5.3) Fuel Efficiency Estimates, CO2 Intensity, and Break Even Passenger Counts for Road Travel
Estimated Vehicle Fuel Efficiency Group
Estimated Fuel Efficiency
(miles/gallon)
Per Passenger CO2 Intensity of Vehicle
Travel
Train Passengers Necessary for Equal Per Passenger CO2
Intensity
US Motor Vehicle Fleet (2008)
17.4 0.18 251
US Passenger Vehicle Fleet (2008)
22.6 0.14 326
US New Passenger Vehicle Fleet (2010)
33.7 0.09 486
5.4 CO2 Intensity Ratios: as was discussed above, per passenger CO2 intensity of GCR travel depends on
occupancy. Table 2 displays the per passenger CO2 intensity of GCR travel under various occupancy
scenarios. Also shown in Table 5.4 is the ratio of GCR per passenger CO2 intensity to per passenger CO2
intensity for road travel under the low and high fuel economy scenarios. Presentation of the data in this
form allows for ready comparison of the two modes of travel. For instance, with an occupancy of 750
passengers, GCR travel emits 31%-61% of the emissions from road travel, depending on which fuel
economy scenario one chooses to compare to.
Table 5.4) CO2 Intensity Ratios for GCR to Road Travel Under Various Occupancy Scenarios
Number of Train Passengers
Per Passenger CO2 Intensity of Train Travel
Ratio of Intensity to US New Passenger Vehicle
Fleet (2010)
Ratio of Intensity to US Motor Vehicle Fleet
(2008)
250 0.17 1.83 0.92
500 0.08 0.92 0.46
750 0.06 0.61 0.31
1000 0.04 0.46 0.23
1250 0.033 0.37 0.18
1500 0.028 0.31 0.15

26
Gra
nd
Ca
nyo
n R
ailw
ay
| 4
/1
1/2
01
1
5.5 CO2 Emissions Savings: Travel into the South Rim of Grand Canyon National Park via a CGR
locomotive, instead of a road vehicle, results in a savings of CO2 emissions. Again, the magnitude of savings
is dependent on the occupancy of the GCR and the fuel economy scenario chosen for comparison. These
relationships are summarized in Figure 5.5, where savings are expressed in total metric tons CO2 saved per
65 mile trip depending on locomotive occupancy.
FIGURE 5.5 ESTIMATED TOTAL CO2 EMISSIONS SAVINGS FROM GCR TRAVEL VS. ROAD TRAVEL UNDER VARIOUS OCCUPANCY AND
VEHICLE FUEL ECONOMY SCENARIOS FOR A ONE WAY 65 MILE TRIP (NEGATIVE VALUES INDICATE GCR EMISSIONS H IGHER THAN
ROAD EMISSIONS)
5.6 Estimated Annual CO2 Emissions Savings: as with the preceding calculations, similar methodology
can be employed to estimate total annual CO2 emissions savings that result from GCR locomotive travel
instead of road travel. Estimated savings are displayed in Table 5.6, below (see Appendix D for a
description of calculations and assumptions).
-4.0
-2.0
0.0
2.0
4.0
6.0
8.0
10.0
12.0
14.0
16.0
250 500 750 1000 1250 1500
Em
issi
on
s Sa
vin
gs
pe
r 65
mi
Tri
p
(Me
tric
To
ns
CO
2e)
Passengers Per Trip
2008 Motor Fleet
2008 Pass Fleet
2010 New Pass Fleet

27
Gra
nd
Ca
nyo
n R
ailw
ay
| 4
/1
1/2
01
1
Table 5.6) Estimated Annual Emissions Savings from GCR Travel vs Road Travel Under Various Fuel Economy Scenarios 2009
Estimated Vehicle Fuel Efficiency Group Estimated Annual CO2 Emissions Savings
(metric tons)
US Motor Vehicle Fleet (2008) 2483
US Passenger Vehicle Fleet (2008) 1418
US New Passenger Vehicle Fleet (2010) 244
- § -

28
Gra
nd
Ca
nyo
n R
ailw
ay
| 4
/1
1/2
01
1
Section 6: Recommended Actions
Xanterra’s EMS has done an excellent job of identifying areas for environmental improvement. Additional
GHG emissions reductions could occur by phasing out the refrigerant R-22. Increased data collection and
periodic review could also help refine calculation of emissions estimations and reductions.
6.1 HCFC-22 Refrigerant Phase-out: the Montreal Protocol, in 1987, established requirements for the
worldwide phase-out of ozone-depleting chlorofluorocarbons (CFCs). In 1992, amendments were added to
establish a schedule for the phase-out of hydrochlorofluorocarbons (HCFCs). HCFCs are less damaging to
the ozone layer than CFCs, but still contain ozone-destroying chlorine. HCFC-22 (also known as R-22) is
the most used refrigerant for residential heat pump and air-conditioning systems in the U.S. R-22, with a
Global Warming Potential (GWP) of 1700, is a greenhouse gas that significantly contributes to global
warming. The Montreal Protocol requires the U.S. to reduce its consumption of HCFCs to 90% below the
U.S. baseline by 2015 (U.S. EPA, 2010). By 2020, the U.S. must reduce its consumption of HCFCs by
99.5% below the U.S. baseline. Refrigerants that have been recovered, recycled, or reclaimed will be
allowed beyond 2020 to service existing systems, but chemical manufacturers will no longer be able to
produce R-22.
Non-ozone-depleting alternative refrigerants are being introduced and the U.S. EPA has compiled a
list of acceptable substitutes (Appendix E, Table E-1). Two of the U.S. EPA’s HCFC substitutes, HFC-
134A and blend R-404A, are currently being used by Xanterra Railroad as coolant for their train cars and
service automobiles. Between 2008-2010, 188.3 lbs. of R-134A was used (Appendix E, Table E-2).
Compared to the 965.52 lbs of R-22 used during that same time, it is clear that Xanterra relies primarily on
this refrigerant. With the impending phase out of R-22, it is recommended that Xanterra look into
increasing the usage of alternative refrigerants. R-404A is currently being used by Xanterra, however, a
high GWP (~3260) would not be the best choice in refrigerant for lowering annual CO2e emissions. The
best alternative refrigerant for Xanterra Railroad is R-134A, because of its relatively low GWP (~1300).
This refrigerant is already currently being used by the facility that would make for an easier transition.
Potential reductions for this transition are displayed in Figure 6.1.
6.2 Increased Data Collection and Periodic Review: gaps in available data and low precision have
been highlighted throughout the report. If greater accuracy and precision in emissions estimations are
desired, these gaps could be filled in preparation for a second review of the emissions profile. For instance,

29
Gra
nd
Ca
nyo
n R
ailw
ay
| 4
/1
1/2
01
1
per passenger emissions estimations for the GCR could be calculated on a monthly basis using precise data
for occupancy and fuel consumption for each trip taken to Grand Canyon National Park. Comparison to
road travel could also be conducted on a monthly basis using available data from the National Park Service,
as well. Another area for potential improvement would be a refined inventory of refrigerants used in shop
HVAC operations; where emissions due to refrigerant leakage could be attributed to individual HVAC units
and time periods. For estimation of emissions for WVO, a full life cycle assessment of emissions for WVO
production and transport could be conducted to more accurately account for fossil fuel CO2 emissions
embodied in WVO as delivered to GCR. Likewise, the inventory could be expanded to incorporate Scope
3 emissions; which would include emissions associated with employee commuting to GCR and waste
disposal from locomotive operations. All emissions estimations would benefit from a periodic review
procedure, in which Xanterra could recalculate GHG emissions estimates on a quarterly or semi-annual
basis. Such a periodic review would allow for greater refinement in estimations of emissions reductions
achieved by the GCR, and allow Xanterra to take full credit for emissions reductions achieved.
- § -

30
Gra
nd
Ca
nyo
n R
ailw
ay
| 4
/1
1/2
01
1
Appendix A: GHG Emissions Calculations
Section 1: Locomotive Shop Emissions
Box 1.1) GHG Emissions Calculations for Locomotive Shop Electricity Consumption (kWh)
( )
( )
( )
Box 1.2) Total GHG Emissions Calculations for Welding Gas Consumption (units as reported)
Praxair StarGoldTM C-252
( )
Acetylene
( )
Box 1.3) GHG Emissions Calculations for Propane Combustion (gal)
( )
( )
( )
Box 1.4) GHG Emissions Calculation for Locomotive Shop Heaters
( )
( )
( )
2 StarGold™ C-25 is a welding gas composed of 75% Argon and 25% Carbon dioxide, by volume. No emission factor for the welding gas was available through TCR. The emissions factor used was calculated based on the density of CO2 at 70˚ F, and 1 atm. The derivation is as follows: 1/0.547m3kg-1 CO2 x 0.25 v/v = 0.4570 kg CO2m
-3.
31
Gra
nd
Ca
nyo
n R
ailw
ay
| 4
/1
1/2
01
1
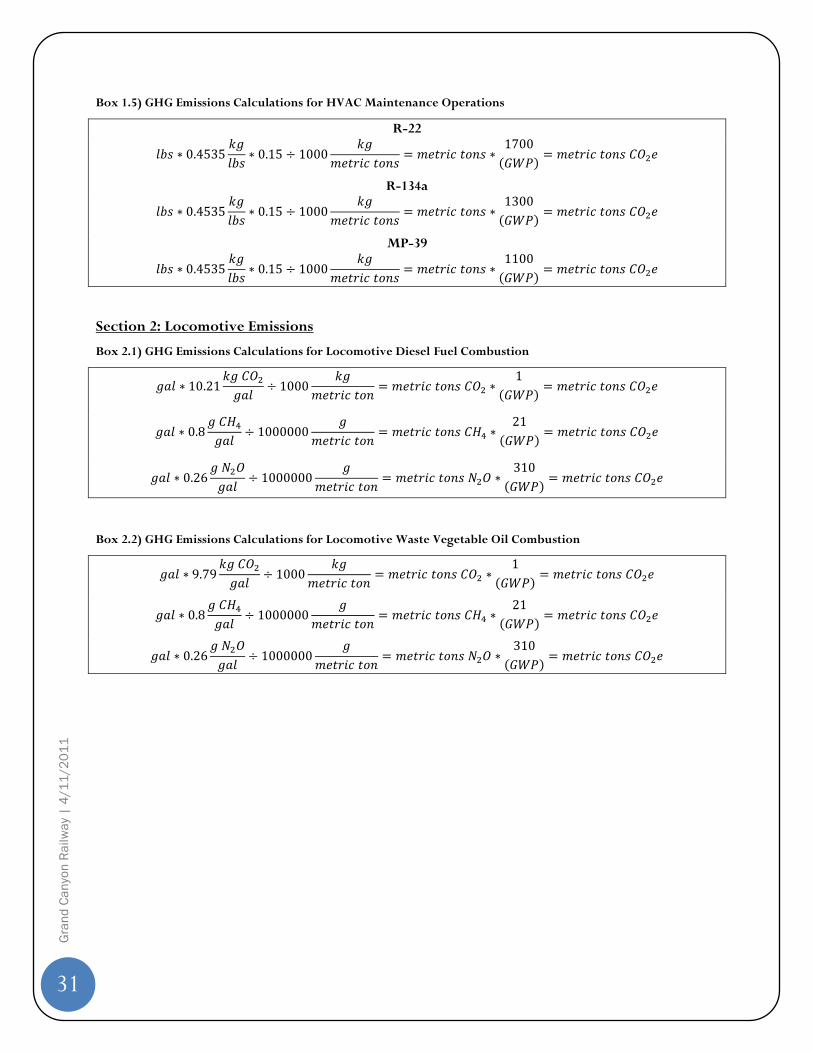
Box 1.5) GHG Emissions Calculations for HVAC Maintenance Operations
R-22
( )
R-134a
( )
MP-39
( )
Section 2: Locomotive Emissions
Box 2.1) GHG Emissions Calculations for Locomotive Diesel Fuel Combustion
( )
( )
( )
Box 2.2) GHG Emissions Calculations for Locomotive Waste Vegetable Oil Combustion
( )
( )
( )

32
Gra
nd
Ca
nyo
n R
ailw
ay
| 4
/1
1/2
01
1
Appendix B: Total Annual GHG Emissions by Operation, Group and GCR Grand Total 2008-2010
Table B.1.1 Year GHG Propane Electric Shop Heaters Welding Gas Diesel WVO HVAC
2008 CO2 60.0 326.5 109.0 0.3 4421.9 N/A 0
CH4 0.2 0.1 .2 0 7.3 N/A 0
N2O 0.2 1.4 1.3 0 34.9 N/A 0
HCFC 0 0 0 0 0 0 73.6
HFC 0 0 0 0 0 0 0.3
Total 60.5 328.0 110.4 0.3 4464.1 0 73.9
Table B.1.2 Year GHG Locomotive Shop Locomotive GRC Grand Total
2008 CO2 495.9 4421.9 4917.8
CH4 0.5 7.3 7.8
N2O 2.9 34.9 37.8
HCFC 73.6 0 73.6
HFC 0.3 0 0.3
Total 573.12 4464.1 5037.25
Table B.2.1 Year GHG Propane Electric Shop Heaters Welding Gas Diesel WVO HVAC
2009 CO2 12.4 218.3 109.0 0.3 2217.3 60.7 0
CH4 0.2 0.1 .2 0 3.6 0.1 0
N2O 0.2 0.9 1.3 0 17.5 0.5 0
HCFC 0 0 0 0 0 0 73.6
HFC 0 0 0 0 0 0 0.3
Total 60.5 328.0 110.4 0.3 2238.4 61.3 73.9

33
Gra
nd
Ca
nyo
n R
ailw
ay
| 4
/1
1/2
01
1
Table B.2.2 Year GHG Locomotive Shop Locomotive GRC Grand Total
2009 CO2 340.0 2278.0 2618.0
CH4 0.3 3.8 4.0
N2O 2.2 18.0 20.2
HCFC 12.5 0 12.5
HFC 11.2 0 11.2
Total 366.2 2299.7 2665.9
Table B.3.1 Year GHG Propane Electric Shop Heaters Welding Gas Diesel WVO HVAC
2010 CO2 18.5 218.8 109.0 0.3 2102.0 80.4 0
CH4 0.07 0.07 0.2 0 3.5 0.2 0
N2O 0.06 0.9 1.3 0 16.6 0.7 0
HCFC 0 0 0 0 0 0 14.8
HFC 0 0 0 0 0 0 5.3
Total 18.7 219.8 110.5 0.3 2122.1 81.2 20.10
Table B.3.2 Year GHG Locomotive Shop Locomotive GRC Grand Total
2010 CO2 2182.4 346.6 2529.0
CH4 3.6 0.3 3.9
N2O 17.3 2.3 19.5
HCFC 0 14.8 14.8
HFC 0 5.3 5.3
Total 2203.2 369.31 2572.6

34
Gra
nd
Ca
nyo
n R
ailw
ay
| 4
/1
1/2
01
1
Appendix C: Total Annual Consumption Values by Operation 2008-2010
Table C.1
Year Propane (gallons) Electricity (kWh) Acetylene (ft3) Praxair StarGoldTMC-25
(m3)
2008 10,743 581,920 no data no data
2009 2,214 384,920 no data no data
2010 3,318 385,096 2904 43.2
Table C.2
Year Waste Oil
(gallons) R-22 (lbs)
R-134a
(lbs)
MP-39
(lbs) Diesel (gallons) WVO (gallons)
2008 no data 611.06 3.31 3.56 433,009 N/A
2009 no data 226.52 125 2 217,165 6200
2010 10672.7 102.89 60 0 205,880 8208

35
Gra
nd
Ca
nyo
n R
ailw
ay
| 4
/1
1/2
01
1
Appendix D: Transportation Comparison Analysis Methodology
Section 5: Transportation Comparison Analysis
The basic data necessary to compare emissions from GCR locomotive travel to road vehicle travel was fuel
consumption, passenger occupancy, and fuel-mileage economy of the two travel options. Comparison of
the two modes of travel was accomplished through derivation of a standard CO2 intensity unit: kg
CO2/passenger mile. Train fuel usage data were not available at high resolution and in recognition of the
high variability of both GCR occupancy and US road vehicle fleet composition and data constraints, average
values for both travel options were employed at low resolution. Throughout the analysis assumptions were
employed to intentionally bias results in favor of road travel. This was done to increase transparency and
confidence in findings that show the GCR to be less carbon intensive than road travel.
5.1 Road Travel
The low fuel economy scenario values were calculated by the Research and Innovative Technology
Administration (RITA), Bureau of Transportation Statistics (BTS) and made available in the collection of
National Transportation Statistics (Table 4-9: Motor Vehicle Fuel Consumption and Travel.) Medium fuel
economy was taken from RITA-BTS Table 4-23: Average Fuel Efficiency of U.S. Passenger Cars and Light
Trucks. These economy values present an overestimation of actual fuel economy because it does not
include SUV’s, light trucks, or buses. The high fuel economy scenario values were taken from RITA-BTS
Table 4-29.; however, this estimate of US fleet fuel economy represents a gross overestimation of fuel
economy and is included for comparison to a highly road-travel-biased perspective. All vehicles are
assumed to combust gasoline in the analysis; which, again, biases the results in favor of road travel (diesel is
more CO2 intensive than gasoline).
Data for PPV of vehicles entering the park ranged from 2.4 to 3.3 on a monthly average basis for
2010 (including buses and passenger vehicles.) The mean of monthly averages was 2.8 PPV (median of
2.6). 2.8 PPV was chosen as a conservative estimate of annual mean PPV value, seeing as it was higher than
the median and included bus travel. Again, this value was chosen to intentionally bias the results of the
analysis in favor of road travel. Calculations for CO2 intensity of road travel for the three scenarios are
displayed in Box 1.

36
Gra
nd
Ca
nyo
n R
ailw
ay
| 4
/1
1/2
01
1
Box 1) Calculations for CO2 Intensity of Road Travel Scenarios
5.2 GCR Travel: due to varying occupancy of the GCR, a single value for CO2 intensity per person was
not calculated. Instead, an average value of CO2 intensity per train mile was calculated and used to derive
multiple passenger occupancy scenarios. In order to calculate the CO2 intensity of train travel, two values
were needed: total annual train miles traveled and annual fuel consumption for all train travel.
In 2009 and 2010 the GCR completed one single round trip to Grand Canyon National Park each
day, and continues to operate on this schedule. The travel distance of the trip is 65 miles one way, or 130
miles round trip. 365 round trips at 130 miles per trip results in 47,450 miles of travel for the entire GCR
operation each year. Actual train miles traveled (as reported by Xanterra) exceeded this value. In the
analysis the value of 47,450 miles of actual passenger transport was used to derive fuel economy
information for the GCR; again, in an expressed effort to bias analysis result in favor of road travel. Use of
this mileage allows for attribution of emissions from all train activities directly to the passenger transport
function of the train (i.e. emissions from maintenance and non-passenger transport travel of the trains is
attributed to passenger travel, making the analysis more conservative.)
In keeping with the conservative nature of the analysis, all diesel fuel consumed in GCR operations
was attributed to passenger transport train travel. This is an overestimate, as discussed above, because fuel
consumption related to maintenance and other activities is included in the analysis. The analysis accounts
for only fossil fuel consumption in travel. In 2010, WVO emissions represented only 3.8% of diesel
emissions; making the contribution minor with respect to the conservative nature of the analysis. GCR
total diesel fuel consumption was averaged for 2009 and 2010 to obtain the estimated train fuel economy.
Calculations for train fuel economy yielded an estimate of 0.224 gals/miles when all fuel for GCR
operations is attributed to passenger transport travel. CO2 intensity calculations for train travel are
displayed in Box 2.
Box 2) Calculations for Average Annual CO2 Intensity of Train Travel
( )
( )

37
Gra
nd
Ca
nyo
n R
ailw
ay
| 4
/1
1/2
01
1
5.3 Break Even Passenger Counts:
Calculations for the break even passenger count are displayed in Box 3. The low fuel economy estimate is
the most realistic while the high fuel economy estimates are extremely unrealistic and biased in favor of
road travel. The calculations for Break Even passenger counts are displayed in Box 3.
Box 3) Calculations for Break Even Passenger Counts
[
] [
]⁄
5.4 CO2 Intensity Ratios: Calculations for per passenger CO2 intensity for the GRC and ratios to road
travel are displayed in Box 4.
Box 4) Calculations for Per Passenger CO2 Intensity for GCR and Ratios to Road Travel
Per Passenger CO2 Intensity for GCR
[
] ⁄
Ratio of Per Passenger CO2 Intensity for GCR and Road Travel
([
] ⁄ ) [
]
⁄
5.5 CO2 Emissions Savings: CO2 emissions savings are expressed in total metric tons CO2 saved per 65
mile trip because occupancy of the GCR is rarely the same over an entire 130 mile round trip (i.e.
northbound passenger counts differ from southbound passenger counts.) Calculations for emissions savings
are presented in Box 5.
Box 5) Calculations for CO2 Emissions Savings for GCR Travel.
([
] [
])

38
Gra
nd
Ca
nyo
n R
ailw
ay
| 4
/1
1/2
01
1
5.6 Estimated Annual CO2 Emissions Savings: In order to estimate annual CO2 emissions savings
resulting from locomotive travel instead of road vehicle travel, average annual occupancy of the GCR had
to be obtained (541.1 passengers per trip). Passenger data provided by Xanterra is expressed in passengers
per 65 mile trip, and this unit is used in calculations of annual emissions savings. The calculations for annual
emissions savings are shown in Box 6.
Box 6) Calculations for Average Annual CO2 Emissions Savings for GCR Travel
Average Annual Occupancy
(([
] [
]⁄ ) [
])

39
Gra
nd
Ca
nyo
n R
ailw
ay
| 4
/1
1/2
01
1
Appendix E: R-22 Phaseout Information
Table E-1: Acceptable Substitutes for HCFCs (class II ODS) in Household & Light Commercial AC (U.S. EPA,
2010)
Substitute (Name Used in the Federal Register)
Trade Name Refrigerant Being Replaced
Retrofit/ New
HFC-134a 22, blends containing 22 and/or 142b
N
THR-03 22 N NOTE: this determination applies ONLY to
window-unit residential AC, and not to central AC systems.
ISCEON 59, NU-22, R-417A ISCEON 59, NU-22
22, blends containing 22 and/or 142b
R, N
R-410A AZ-20, Suva 9100, Puron
22 and blends containing HCFCs
N
R-410B 22, blends containing 22 and/or 142b
N
R-407C Suva 9000, Klea 66
22 and blends containing HCFCs
R, N
R-507, R-507A AZ-50 22 and blends containing HCFCs
R, N
Ammonia Absorption 22, blends containing 22 and/or 142b
N
Evaporative Cooling 22, blends containing 22 and/or 142b
N
Desiccant Cooling 22, blends containing 22 and/or 142b
N
R-404A HP62 22 and blends containing HCFCs
R, N
R-125/134a/600a (28.1/70.0/1.9)
NU-22 old composition
22, blends containing 22 and/or 142b
R, N
RS-44 (2003 formulation) RS-44 (2003 formulation)
22, blends containing 22 and/or 142b
R, N
R-421A Choice R421A 22, blends containing 22 and/or 142b
R, N
R-422D ISCEON MO29 22, blends containing 22 and/or 142b
R, N

40
Gra
nd
Ca
nyo
n R
ailw
ay
| 4
/1
1/2
01
1
R-424A RS-44 22, blends containing 22 and/or 142b
R, N
R-125/290/134a/600a (55.0/1.0/42.5/1.5)
ICOR AT-22 22, blends containing 22 and/or 142b
R, N
R-422C ICOR XLT1 22, blends containing 22 and/or 142b
R, N
R-422B ICOR XAC1, NU-22B
22, blends containing 22 and/or 142b
R, N
KDD5, R-438A ISCEON MO99 22, blends containing 22 and/or 142b
R, N
R-434A RS-45 22, blends containing 22 and/or 142b
R, N
R-407A KLEA 60, KLEA 407A
22 and blends containing HCFCs
R, N
R-427A Forane 427A 22, blends containing 22 and/or 142b
R
R-437A ISCEON MO49 Plus
22, blends containing 22 and/or 142b
R, N
Key: R = Retrofit Uses, N = New Uses
Table E-2: Xanterra Railroad Total Annual Refrigerant Use by Train and Service Automobiles (lbs)
2007 2008 2009 2010 2011
R-22 (GWP-1700) 12.3 611 226.52 128 49
R-134A (GWP= 1300) - 3.31 125 60 -
MP-39 (GWP=1100) 3.38 3.56 2 - -
R404A (GWP= 3260) 4 - - - -