Embed Size (px)
Citation preview

Grain Boundary Assisted Crevice Corrosionin CoCrMo Alloys
Emily E. Hoffman,* Alex Lin,* Yifeng Liao,*,** and Laurence D. Marks‡,*
ABSTRACT
Cobalt chromium molybdenum alloys have been extensivelyused for biomedical implants, but are susceptible to grainboundary corrosion resulting from local chromium depletion,which is called sensitization. This work extended the under-standing of chromium depleted zones in CoCrMo alloys andtheir role in corrosion to the nanoscale. Selected boundarieswere analyzed from the millimeter to the nanometer scale inorder to link the chemical composition and crystallographicstructure to the observed local corrosion properties. The shapeand severity of grain boundary corrosion crevices were mea-sured, linked with the coincidence site lattice geometry.Additionally, direct high-resolution energy dispersive x-rayspectroscopy maps of chromium depleted zones at the grainboundaries were measured to completely characterize the grainboundary properties. Chromium depleted zones were foundin 100% of corroded grain boundaries, yet were too small tofollow classical models of sensitization. Nanoscale regions ofchromium depletion were found to have significant effects oncorrosion initiation. This led to a grain boundary crevicecorrosion model connecting the chemical composition withelectrochemical driving forces that control crevice corrosionpropagation. The conclusions and model presented can be usedto better develop processing techniques for CoCrMo and otheralloys.
KEY WORDS: biocorrosion, chromium, cobalt, grain segregation,microstructure, sensitization, transmission electron microscopy
INTRODUCTION
As the “baby boom” generation ages and as patientscontinue to live longer and have more active lives, thedemand for hip replacements has risen. Injury andosteoarthritis often result in a patient’s need for a hip orknee replacement. For total hip arthroplasties, thenumber of implants in the United States is expected togrow from 2005 by at least 174% to 572,000 implantsby 2030.1-2
Beginning in the 1970s, cobalt chromiummolybdenum (CoCrMo) alloys have been approved asimplantable biomedical materials for hip replace-ments.3 Advantages of this metal alloy include the goodbulk mechanical properties, which can be predictablymodified by various processing techniques such ascasting, annealing, hot forging, and cold working.4-8
Of the different articulating joint interfaces available forhip implants, metal-on-metal (MoM) is known to haveone of the lowest wear rates compared to systems withthe polymer polyethylene.3,9 The MoM implants,however, have generated serious clinical concerns as aresult of metal wear products being released into thesurrounding tissues.10 One of the major degradationprocesses that affect all metallic implants in vivo iscorrosion.11-13 While CoCrMo alloys have good tribo-logical properties and are especially corrosion resis-tant resulting from the formation of a passive oxide film,cobalt and chromium cations and nanoparticles havebeen detected in patients with implants.7,14-17 Com-plications observed clinically as a result of corrodingCoCrMo alloys include metal hypersensitivity, metal-losis (metallic staining of the surrounding tissue),
Submitted for publication: April 7, 2016. Revised and accepted: June27, 2016. Preprint available online: June 28, 2016, http://dx.doi.org/10.5006/2108.
‡
Corresponding author. E-mail: [email protected].* Department of Materials Science and Engineering, NorthwesternUniversity, 2220 Campus Drive, Cook Hall Rm 2036, Evanston, IL60208.
** Current address: Dow Corning Corporation, Midland, MI.
CORROSION—Vol. 72, No. 11ISSN 0010-9312 (print), 1938-159X (online)
16/000217/$5.00+$0.50/0 © 2016, NACE International 1445
CORROSION SCIENCE SECTION
excessive periprosthetic fibrosis, and adverse localtissue responses (which can include extensivenecrosis of periprosthetic tissues), all of which havecontributed to CoCrMo falling out of favor at present.While there are developments with new alloys andincreasing use of materials other than CoCrMo alloyssuch as titanium for the primary mechanical supportsin implants, many CoCrMo alloys still continue to beused and currently exist in millions of patients world-wide. It is medically unreasonable (and detrimental toa patient’s health) to remove an implant that is notdisplaying any signs of unfavorable physiologicalreactions. Considering the millions of MoM hip repla-cements in use worldwide, a better understanding ofthe fundamental processes of grain boundary corrosionin these alloys is needed. Beyond the medical appli-cations, understanding corrosion of CoCrMo alloys isimportant for naval and industrial applications.
In all forms of CoCrMo alloys, with variations incarbon concentrations, precipitates, and microstruc-tures, the dominant corrosion protection comes fromthe formation of a chromium oxide thin film at thesurface. In many cases of extended corrosion, there isnot a constant mass loss per unit area, rather, prefer-ential mass loss at grain boundaries, carbide phases,or defects. A particularly important contribution to thein vivo corrosion is the more rapid mass loss near theintersection of grain boundaries of themetallic alloy andthe protective oxide. This is often called “grainboundary sensitization” and the alloys that easilycorrode after certain heat treatments are described assensitized.18-20 For alloys that include chromium, themost common explanation of local sensitization is alocal reduction in the chromium concentration.7,18,21-22
Failed implants have been explanted and studied forintergranular corrosion. The attack can occur on allmodular parts of the implant, and the degradation isthe result of both electrochemical dissolution andphysical wear.11,19,23 Scanning electron micrographs(SEMs) proved specific attacks at grain boundaries andcarbide phases, often penetrating deep into themicrostructure and causing grain fallout.23 In CoCrMoalloys, these particles and ions generated from thegrain boundary attack play a pathogenic role in osteo-lysis and aseptic loosening, which can lead to theneed for a revision surgery.23-24 As will be discussed inmore detail later, the majority of the evidence forboundary attack is based upon rather large-scalesegregation at the 0.1 μm to 10 μm scale, which leavesopen the question of what takes place with much finer-scale segregation at the nanoscale.
In this work, the nanoscale structure and seg-regation in CoCrMo alloys that has often been over-looked in microscale carbide precipitate analysis isinvestigated. Through analysis of carbide phases andchemical compositions at grain boundaries, grainboundary properties are connected to the occurrenceof local grain boundary corrosion attack.
High-resolution characterization techniques, includingtransmission electron microscopy (TEM) and energydispersive x-ray spectroscopy (EDS), show the chemicalsegregation that occurs at the nanoscale. Bymodelingthe grain boundary energies, it was possible to predictthe grain boundary corrosion and obtain insights intodeveloping the next generation of CoCrMo alloys.
The structure of this paper is as follows. First, abackground on sensitization is presented to clarifyterms used in literature and establish the field asrelevant to CoCrMo alloys. Next, the various techniquesused to characterize the CoCrMo corroded alloy aredescribed and the TEM images, composition data, andsummary statistics are presented. Based upon theEDS quantitative composition data, a model, grainboundary assisted crevice corrosion (GACC), is pre-sented, which combines the energy of coincidence sitelattice and sensitized grains to explain the shape ofcrevice corrosion observed at the grain boundaries.Finally, this paper is concluded by connecting theseresults to future designs of CoCrMo alloys for biomed-ical or other uses.
GRAIN BOUNDARY SENSITIZATION
A brief overview of grain boundary sensitizationas currently understood in the literature is provided as aprelude to the nanoscale results described later.
The term sensitization, as currently used in theliterature, is the change in an alloy’s corrosion prop-erties as result of heat treatments.11-12,20,25-28 For avariety of chromium-containing alloys and others suchas magnesium-containing alloys, sensitization iswidely used to describe the basic cause of intergranularcorrosion (IGC) and intergranular stress corrosioncracking (IGSCC).29-36 The most general use of sensi-tization refers to a local reduction of the concentrationof a protective alloying element. While this may not bethe only possible reason for preferential corrosion atgrain boundaries, it is the most commonly invokedsource. For the specific case of CoCrMo alloys herein,the term sensitization will be used as it is applied toother chromium-containing alloys, with “grainboundary sensitization” referring to the formation ofchromium depleted zones (CDZ) adjacent to grainboundaries resulting from the presence of chromium-rich carbides.18,37 For chromium-containing steel,nickel, and cobalt alloys, it is known that during alloyprocessing, annealing, and heat treatments,chromium-rich carbides precipitate primarily at thegrain boundaries, and the growth of these carbidesleads to depleted regions in the immediate surround-ings.18,38-39 The understanding of corrosion causesand prevention has motivated over 90,000 publishedstudies, as avoiding grain boundary sensitization iscritical for high performance alloys.
This chemical segregation along the grainboundary has been most commonly studied in stainless
1446 CORROSION—NOVEMBER 2016
CORROSION SCIENCE SECTION

steels, with fewer studies focusing on nickel or cobaltalloys. Often for stainless steels, the goal is to developmaps of carbon content, chromium content, alloyingtime, and alloying temperature and thereby directengineers to safe, corrosion resistant alloys.29,40-42
Various heat treatments have been studied to reducethe volume fraction of chromium carbides, attempt-ing to ensure that chromium is even throughout thematrix, and promote the formation of protective oxidein order to control the corrosion resistance of ametal.25-26,32 In general, the samples were analyzedfor corrosion resistance by a range of methods generallyat the mesoscale, with the target of comparing severaldifferent alloys and microstructures and their relativecorrosion rates.
The effects of sensitization were often demon-strated through accelerated corrosion testing, andthen measured through electrochemical tests, in-cluding potentiodynamic tests, potentiostatic tests,and electrochemical potentiokinetic reactivationtests.18,38,43-46 The term “degree of sensitization” (DoS)is widely used and loosely defined, and it usuallyrefers to the intensity and size of the CDZ at the grainboundaries.22,30,39,47-48 The DoSwas usually inferredfrom electrochemical tests or fit using a model, rarelydirectly measured. The chromium depleted zoneswere linked to corrosion, as they were reported to leavethe alloy unable to form the necessary Cr2O3 pro-tective oxide in that region.7,20,25-26,49-51
It is widely considered in the literature thatcarbides play a major role in grain boundary sensiti-zation, as the formation of chromium carbides at thegrain boundary leaves nearby zones of chromium de-pletion.28,43,47-48,52-53 This was based upon obser-vations at the microscale, often observing materials thatform extensive carbide phases along an entireboundary.28,38,43 As shown in Figure 1, the carbidecoverage can be a complete phase along a grainboundary as in (a), can be micrometer scale precipitatesas in (b), or can have unnoticed nanoscale precipi-tates as in (c). In CoCrMo alloys, only carbides such asthose in Figures 1(a) and (b) have been observed todate with light or scanning electron microscopy. Often
the presence of carbides was enough to conclude thata CDZ was present, and it was assumed that grainboundary sensitization was the cause of the corro-sion.20,26,44 Some chemical profiles have indicated thecomposition of the carbides to be chromium carbide(Cr23C6) and that in CoCrMo alloys some carbides weremolybdenum carbides (Mo6C).
22,25,52,54 Even in-cluding stainless steel, sensitization has only beenstudied down to hundreds of nanometers. It is un-known if carbides and CDZs of smaller length scalesaffect corrosion properties.
In addition to chemical composition of carbidesand the CDZ, the geometric organization of a grainboundary lattice can also affect carbide formation andtherefore sensitization.31,42-43,55 Grain boundaryorientation is typically quantified using the coinci-dence site lattice (CSL) approach, where grainboundaries are classified as having a repeating matchalong the boundary (described by a Σ value).Boundaries with low CSL have been found to inhibitthe depletion of soluble chromium in the vicinity ofthe grain boundary and therefore resist the formationof carbides and CDZs, leading to improved corrosionresistance.43,56-57 For example, in nickel, grainboundaries with Σ < 29 were considered to have“special” properties.21,56 In heat treated CoCrMoalloys, grain boundaries below Σ9 were immune tocorrosion.57 Additionally, boundaries with intrinsicdislocations along the boundaries have been dem-onstrated to act as sinks for solutes, i.e., formingchromium carbides. Intergranular boundary defectscan act as preferential sites for breakdown of theprotective oxide film, and with increasing chromiumdepletion, the barrier to initiate corrosion at thesesites is reduced.21 The goal of understanding therole of CSL in corrosion is to enable engineering of thegrain boundary orientations to favor boundariesthat resist corrosion in order to improve the bulkcorrosion resistance.55,58-61
Models have been developed to predict the extentof sensitization, focusing primarily on stainless steelsand on the length and temperature of the heattreatment.22,30,47-48 Proposed models have used three
10 μm
(b) (c)(a)
FIGURE 1. Carbide presence at a grain boundary may take the form of (a) a complete network along the grain boundary,(b) micrometer scale precipitates along some parts of the boundary, or (c) nanoscale precipitates unable to be seen atthe micrometer scale.
CORROSION—Vol. 72, No. 11 1447
CORROSION SCIENCE SECTION

parameters to characterize CDZ: coverage, width, anddepth.38,43 Coverage is the proportion of the grainboundary lengthcoveredbyCDZs.Width is thedepletedzone perpendicular to the grain boundary. Depth is theminimum level of chromium in the depleted zone.Additionally, previous work has attempted to link thewidth of sensitization to the width of the crevice cor-rosion observed, but it was always shown that the creviceis much larger than the sensitized region in themodel.30,38 Width was always found to be narrower thanthe electrochemically corroded area and not a predictorof corrosion intensity.
The stainless steel models have used thermody-namic calculations to analyze the equilibrium concen-tration of chromium in the matrix at the carbide/matrix interface.28,30,62 The quantitative composition ofsensitization reported for stainless steel often citesStawstrom and Hillert, where sensitization was said tooccur at less than 13 at% Cr for a width greater than20 nm at the grain boundary.30 It was reported instainless steels that when the level of chromium in thedepletion falls below 12 at% to 13 at%, the passive filmover the depleted region becomes easily breached toinitiate corrosion and degradation,28,30 leading to moststainless steel models having a composition around19 at% Cr and assuming sensitization around 13 at%Cr.48,63-65 These models for sensitization have notbeen expanded to cobalt alloys, and involvedprecipitates on a scale of 100 s of nanometers tomicrometers, without consideration of nanoscaleprecipitates.
Much less is known about CoCrMo alloys com-pared to stainless steels. In steels, some studies havedone EDS line scans on the range of 100s of nan-ometers to directly measure CDZ, and then linked thecomposition data to predictive models. These models,however, were often for micrometer-sized carbides withlarge CDZs. In CoCrMo alloys, the scale of investi-gation has also focused on micrometer-sized carbidesand extensive carbide phases along an entireboundary.20,49 The majority of the sensitization con-clusions were made after electrochemical measure-ments were taken. Previous studies have at most takenpoint compositions or coarse micrometer scale linescans across carbides and CDZs, often presenting onlyone composition profile scan.25-26,52 Some studieshave characterized the nanoscale compositions of var-ious carbides,66 but not in relation to heat treatmentor corrosion, and there are studies which looked at CSL,heat treatment, and corrosion, but did not considercomposition.21,57,67
To summarize this section, grain boundarysensitization resulting from mesoscale segregation isfairly well understood in many steels, but less so inCoCrMo alloys. The extent that grain boundary sensi-tization concepts at this large scale can or should beused for segregation at the nanoscale is a rather openquestion.
METHODS
CoCrMo AlloyThe CoCrMo alloy used was a high-carbon (HC)
wrought alloy from ATI Allvac with a composition cor-responding to ASTM F1537-08.68 The composition isgiven in Table 1. The samples’ heat treatments, micro-structure, and electrochemical treatment have beendescribed in previous work by Panigrahi, et al.57 For thisstudy, a HC wrought pin annealed at 1,230°C for 24 hwas used, as this anneal was most successful inreducing overall corrosion rate and localizing corro-sion to grain boundaries.57 After the anneal, the samplewas quenched in water.
Electrochemical Corrosion TestingThe sample of CoCrMo alloyed used in this work
was previously studied by Panigrahi, et al.,57 and thesample’s electrochemical corrosion testing andproperties are described in detail in the previous pub-lication. To summarize, the samples were mechani-cally polished immediately prior to electrochemicalcorrosion testing. The sample was then corroded in acustom four-chamber electrochemical cell that servedas a working electrode, along with a graphite counterelectrode and a saturated calomel electrode referenceelectrode. The corrosion cell was filled with 10 mL ofbovine calf serum (BCS) with a protein content of30 g/L, buffered to a basic pH of 7.4, and placed in ahot water bath maintained at 37°C to mimic physio-logical conditions. Buffering a biological solutiontypically involves adding phosphate-buffered saline,NaCl, or NaOH.
A standard protocol was used for the electro-chemical tests. The tests beganwith a potentiostatic testto standardize the surface, then an electrochemicalimpedance spectroscopy test was conducted. A poten-tiodynamic (cyclical polarization) test was performedto corrode the sample and measure the curate at eachapplied potential. The samples were anodically po-larized from −0.8 V to 1.8 V at a scan rate of 2 mV/s andthen reversed back down to −0.8 V at the same rate.Using the corrosion current from the results of Pani-grahi, et al., and Faraday’s equation, the dissolutionrate was calculated to be 2.98 × 10⁻³ mm/y. Based onthe previous study, congruent dissolution isassumed.
Electron Backscatter DiffractionElectron backscatter diffraction (EBSD) methods
were used to create orientational image maps (OIMs) of
TABLE 1Composition of the High-Carbon CoCrMo Alloy
at% Co Cr Mo C Mn Si Ni Fe
Balance 30.3 3.6 1.14 0.73 1.34 0.17 0.14
1448 CORROSION—NOVEMBER 2016
CORROSION SCIENCE SECTION

selected regions of the annealed CoCrMo sample. AnFEI Quanta ESEM† with an EBSD detector was used toacquire and index diffraction patterns for multiple 2Darrays on the sample surface. An accelerating voltage of20 kV and a step size of 0.5 μm were used, as theseconditions supplied enough resolution and signal tomap the CSLs of relevant grain boundaries. Orien-tational indexing from the Kikuchi patterns wasperformed using the commercially available OxfordAZtec† EBSD processing software, assuming a singleface-centered cubic (fcc)-Co matrix phase. Using theOxford Tango† software, noise reduction was performedto minimize the role of the roughness of the corrodedsurface, and misorientation matrices for each grainboundary were calculated from the Euler angles.Each grain boundary was mapped as a high-angle or alow-angle grain boundary. For the high-angleboundaries (>15° misorientation angle), the BrandonCriterion69 was used to determine the reciprocal CSLdensity Σ based on the geometric 3Dmisorientation withlattice coincidence for fcc crystals.
White Light InterferometryA Bruker Contour GT-K† 3D optical microscope
equipped with a Mirau interferometer objective lens wasused to quantitatively measure the topography of thecorroded grain boundaries. The white light interferom-eter had a lateral resolution limited by the wavelengthof light and a finer z-axis resolution limited by thesensitivity of the light intensity detector.70 Thistechnique was used to measure the width of corrodedgrain boundaries and depth of corroded regions withrespect to the surrounding surface.
A magnification of 40× was used to capture theprofile of the corroded surface in a 2D projection ofapproximately 250 μm in length and 300 μm in width.In total, 25 grain boundaries, 13 CSL boundaries, and12 non-CSL boundaries were characterized for theirdepth and width. For each individual grain boundary,15 to 20 depth and width measurements were col-lected along the boundary. On average, a single depthmeasurement was acquired per 0.5 μm to 1.0 μmalong the boundary. The width of the corrodedboundary was acquired by measuring the distancebetween the two edges of the corroded crevice at theboundary. The mean of the depth and width mea-surements were computed, along with the range to a95% confidence level.
Focused Ion BeamAn FEI NanoLab† dual-beam focused ion beam
(FIB) system was used to prepare lamellar TEM samplesfrom the annealed CoCrMo alloy. The FIB used ascanning electron imaging beam operated at 5 kV and1.4 nA and a focused ion milling beam orientated at52° to the electron beam operating at 30 kV from 9.2 nA
to 48 nA. Specific grain boundaries were identifiedfrom the OIM data and a cross section of the boundarywas made into a ∼100 nm thick, electron-transparentTEM sample for further analysis. The lamellar samplecreated was a cross section of the grain boundary,approximately 5 μm on either side of the boundary and5 μm deep below the bulk surface (see Figure 2).Twenty-two grain boundary FIB samples were prepared.Twelve corroded boundaries and 10 immuneboundaries were prepared and imaged, including 10non-CSL corroded grain boundaries, 2 CSL corrodedboundaries, 5 non-CSL immune boundaries, and 5 CSLimmune boundaries.
FIB was also used to prepare grain boundarysamples for use in local-electrode atom-probe (LEAP)tomography. The samples were prepared by the lift outprocess and sharpened by milling, with specialattention paid to orienting a grain boundary through thearea of the sharpened tip.71 A platinum protectivelayer and a final milling at 5 kV were used to prevent ionimplantation in the region of interest.
Transmission Electron Microscopy and EnergyDispersive X-Ray Spectroscopy
TEM was performed to analyze the structure andcomposition of the grain boundary FIB samples tocompare between corroded and immune boundaries.A JEOL 2100† TEM was used for bright field, dark field,diffraction, and high-resolution imaging, and EDSchemical analysis. The EDS on the TEM had a 1 nmprobe size, with most analysis confined to line scansfor minimum noise, and processed through Inca†
software.TEM was also performed on a JEOL ARM200CF†
with a windowless EDS detector for high-resolution EDSmapping of four selected grain boundary FIB sam-ples. The aberration corrected microscope provided anEDS analysis probe size of approximately 0.13 nm.For carbide composition quantification, measurementswere taken from two to four carbides per boundary foreach sample. The EDS quantification spectra weretaken from three regions of each carbide—the car-bide, the CDZ, and the matrix—indicated in the maps.The maps were collected and analyzed using theOxford AZtec† TEM software.
Atom Probe TomographyAtom probe tomography (APT) analysis was
performed using a LEAP tomograph manufactured byImago Scientific Instruments. The analysis wasformed at a specimen temperature of 25 K, a pulserepetition frequency of 500 kHz, a laser energy of40 pJ, and a detection rate of 0.01%. Reconstructionwas done by means of IVAS 3.6.8† using SEM profilesof the tips for the shape reference. Line scans weregenerated using 2D regions of interest and normal-ized to remove gallium atoms from the composition.† Trade name.
CORROSION—Vol. 72, No. 11 1449
CORROSION SCIENCE SECTION

RESULTS
The annealed and corroded alloy was firstexamined with EBSD to determine relevant grainboundaries for representative TEM samples. TheEBSD OIM produced three maps for each scannedregion: the SEM image, OIM image, and the labeledCSL boundaries image, as shown in Figure 3. The sameregions mapped in EBSD were later found in the FIBSEM, and known CSL and non-CSL samples wereprepared for TEM analysis.
White light interferometry characterized themorphology of corroded boundaries that were bothCSL and non-CSL. From the depth and width charac-terization of corroded crevices, it was determined thatCSL boundaries corroded 0.18 μm to 0.96 μm in depthand 1.73 μm to 5.47 μm in width. For non-CSLboundaries, the corrosion depth ranged from 0.38 μm to3.05 μm and the width ranged from 2.36 μm to4.91 μm, as summarized in Figure 4. The corrosiondepth upper-threshold was observed to be about
1.0 μm in CSL boundaries, whereas non-CSL depthobservations showed a much larger and deeper rangeof crevice depth. The 3D profilometry results indicatedthat the widths of the corroded grain boundaries weretwo to five times larger than the corresponding depths.
The initial examination of corroded and immunesamples in bright field TEM showed that the corrodedboundaries had a wavy structure, later determined to bea result of chromium-rich carbides, whereas immuneboundaries were straight without deviations. Repre-sentative examples of both are seen in Figure 5. UsingEDSmaps and line scans in the TEM, the features alongthe corroded grain boundary were determined to bechromium enhancements, as seen in an exampleboundary in Figure 6. As shown in Figure 7, thecarbide structure was confirmed through diffraction ofthe two grains and the carbide in between, showingthat the intergranular carbides have the expectedM23C6
composition. To summarize the standard TEM anal-ysis, all 10 of the corroded boundaries containedchromium-rich carbides dotted along the grain
Grain 1 Grain 2
Grain boundary
5 μm
50 μm
2 μm
Carbide
Chromium depleted zone
Pt FIB coating
(d)(c)
(b)(a)
FIGURE 2. (a) SEM image showing a single grain boundary being cut from the bulk sample, (b) the lamellar viewed in SEMcomprising the two grains with the grain boundary, indicated by the dotted line down the middle, (c) a sample viewed in TEMagain with the dotted line on the grain boundary, and (d) layout of a typical corroded sample.
1450 CORROSION—NOVEMBER 2016
CORROSION SCIENCE SECTION

boundaries, while all five of the CSL immune bound-aries did not show carbides, and four of the fiveimmune boundaries did not show carbides. The resultsof the 22 grain boundary samples are summarized inthe chart of Figure 8. The one immune boundary withcarbides showed that the carbides were on a size scalearound <50 nm, less than half of the size of the othercorroded boundaries’ carbides.
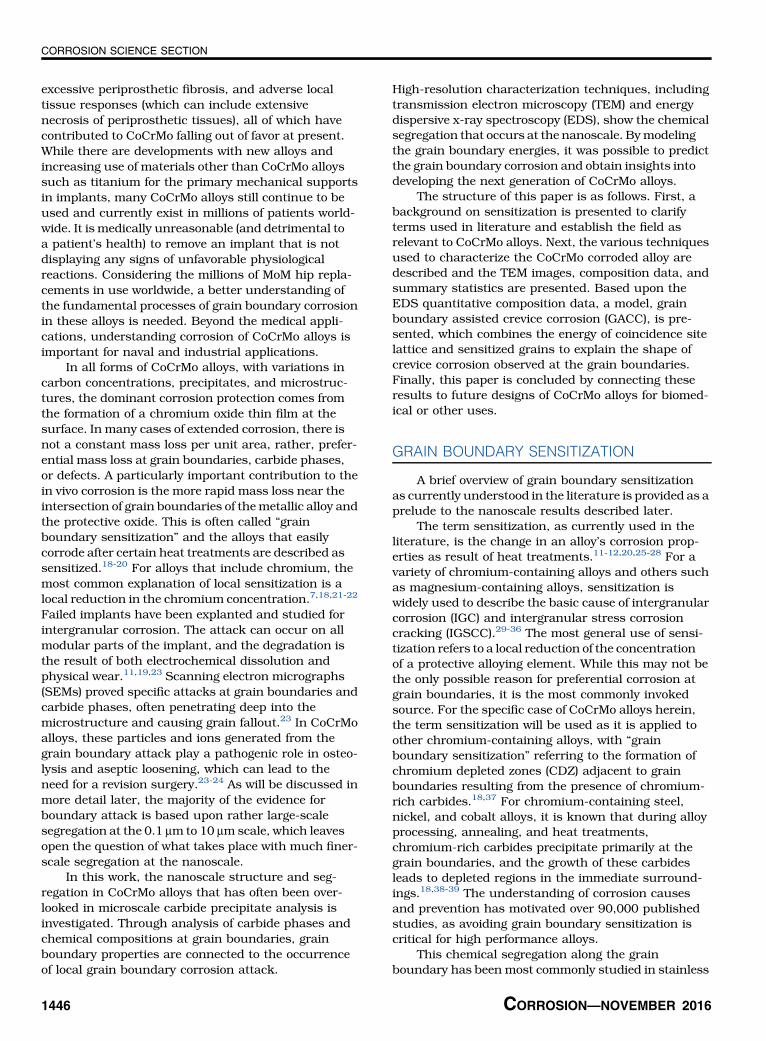
The chromium-rich carbides were lens shaped andshared epitaxial alignment with the grain on theconcave side of the carbides seen in an exampleboundary in Figures 9 and 10. Figure 9(a) shows abright field TEM image and Figure 9(b) shows a high-resolution image with the carbide epitaxy to grain 1.Figure 10 shows the same sample, confirming thecarbide epitaxy through dark field TEM. In dark field,a particular diffraction spot can be selected and only thegrains of that orientation will appear bright. Thebump out feature of the carbide was shown when thecrystallographic orientation of grain 1 was selected indark field, in Figure 10(a). When the crystallographicorientation of grain 2 was selected, in Figure 10(b), thecarbide feature was dark like the rest of grain 1. Thisimplied that the carbide has the same orientation asgrain 1. Comparable carbide shape and evolution hasbeen previously modeled for a copper indium alloy, asdiagrammed in Figure 11.72 The driving force for car-bides to segregate during the initial casting was thereduction of the surface energy between the bulk grainsand the grain boundary, replacing a high-energyboundary, α/α′, with a lower one, α/β and α′/β. Thesecarbides formed on the disordered, high-energyboundary, agreeing with other sensitization and CSLmodels.21,67,72
A representative annular dark field (ADF) and high-resolution EDS map, in Figure 12, shows the lens-shaped chromium-rich carbide at the grain boundary ofthe CoCrMo alloy. The clearest EDS signal showed theprimary elements of the composition, Co, Cr, andMo, asmaps and with a quantized chart from key regions in
(a) (b) (c)
100 μm
Black – High angle (general)Red – Σ3 (twin)Color – CSL between Σ5 - Σ49
FIGURE 3. The EBSD generated (a) SEM images, (b) OIM images, and (c) labeled CSL boundaries of the scanned region,later identified in the FIB/SEM for TEM sample preparation.
0.0
1.0
2.0
3.0
4.0
1.0 2.0 3.0 4.0 5.0 6.0
Dep
th (
μμm)
Width (μm)
Non-CSL boundaries
CSL boundaries
FIGURE 4. Depth and width measurements collected from 3Dprofilometry showed that the corrosion width was approximately twoto five times larger than its corresponding depth. With square as CSLand diamond as non-CSL, each point represents a single boundary,where the arrows represent the range of the multiple measurementsalong that boundary.
(a) (b)
200 nm 100 nm
FIGURE 5. The initial examination in bright field TEM showed (a) thecorroded boundaries have a wavy structure, where each bend was acarbide feature at the boundary, whereas (b) immune boundarieswere straight and featureless.
CORROSION—Vol. 72, No. 11 1451
CORROSION SCIENCE SECTION

Table 2. The area around the carbide was a CDZ, i.e., thechromium composition was reduced around thecarbide and along the grain boundary. The depletedzone normal to the grain boundary plane was at thesame length scale as the width of the carbides, about∼10 nm, seen in the line scan in Figure 12(b). Foranother carbide map in Figure 13, the CDZ extendedalong the grain boundary with a comparable lengthscale to the length of the carbide, with compositions at
these regions quantized in Table 3. This is seen in themaps, but was confirmed through the quantified EDSregions. For the four samples examined in high-resolution EDS, scans were taken along two to fivecarbides of each sample, with the average carbidecomposition, matrix composition, and depleted zonecompositions shown in Table 4. For the singularimmune sample with carbides, the <50 nm carbideswere included in the EDS scans. For these carbides,
0
0.2
0.4
0.6
0.8
0 10 20 30 40 50
No
rmal
ized
Inte
nsi
ty
Distance (nm)
0
0.2
0.4
0.6
0.8
0 10 20 30 40 50
No
rmal
ized
Inte
nsi
ty
Distance (nm)
B
C
(c)
(b)(a)
Co
Cr
Mo
50 nm
FIGURE 6. (a) Bright field TEM image with an EDS map, Co = green, Cr = red, and Mo = blue. The dotted line indicates thegrain boundary, with a chromium enhancement. Line scans (b) and (c) indicate the change in concentration at the carbide.
Cr23C6
Grain 1
Grain 2
(b)
(a)
(c) (d)
10 1/nm
50 nm
10 1/nm10 1/nm
220
111
220202
FIGURE 7. (a) Bright field image of a grain boundary showing the chromium-rich carbide feature. (b) Diffraction pattern ofgrain 1, (c) diffraction pattern of the feature showing a M23C6 carbide grain structure, and (d) diffraction pattern of grain 2.
1452 CORROSION—NOVEMBER 2016
CORROSION SCIENCE SECTION

the chromium depletion, i.e., the difference in thematrix chromium composition and the chromiumcomposition along the grain boundary, was less than2 at%, shown in Figure 14 and composition in Table 5.This size of carbide hit a threshold to no longer cause atrue CDZ, which left that grain boundary without aCDZ and therefore immune.
Note that the size/volume fraction of the carbidesscales approximately corresponded with the chro-mium depletion near them; larger carbides caused
larger chromium depletion. This indicates that therewas a local “chromium conservation” in regions 20 nmto 40 nm on either side of the grain boundaries and nolong-range diffusion of chromium, at least for the con-ditions used to make the samples.
APT complemented the EDS results; a regioncontaining a grain boundary and a carbide is shown inFigure 15. The shape of the carbide was ∼60 nm alongthe boundary by ∼10 nm wide, with a similar lens shapeto those observed via electron microscopy. A line scan
Corroded Immune
Non
-CS
L bo
unda
ry
Carbides (N = 10)No carbides (N = 0)
Carbides (N = 1)No carbides (N = 4)
CS
L bo
unda
ry
Carbides (N = 2)No carbides (N = 0)
Carbides (N = 0)No carbides (N = 5)
100 nm 20 nm
100 nm200 nm
FIGURE 8. The chart summarizes the samples measured in each category and if carbides were present. The boundary can be either CSL or non-CSL, and either be corroded or immune. The proportion of samples in each category represents the approximate frequency seen in the bulksample.
(a) (b)
Grain 1 Grain 2
50 nm 5 nm
FIGURE 9. (a) The lens shape of the chromium-rich carbide with (b) the high-resolution transmission electron microscopeshowing the shared epitaxial alignment with the concave grain.
CORROSION—Vol. 72, No. 11 1453
CORROSION SCIENCE SECTION
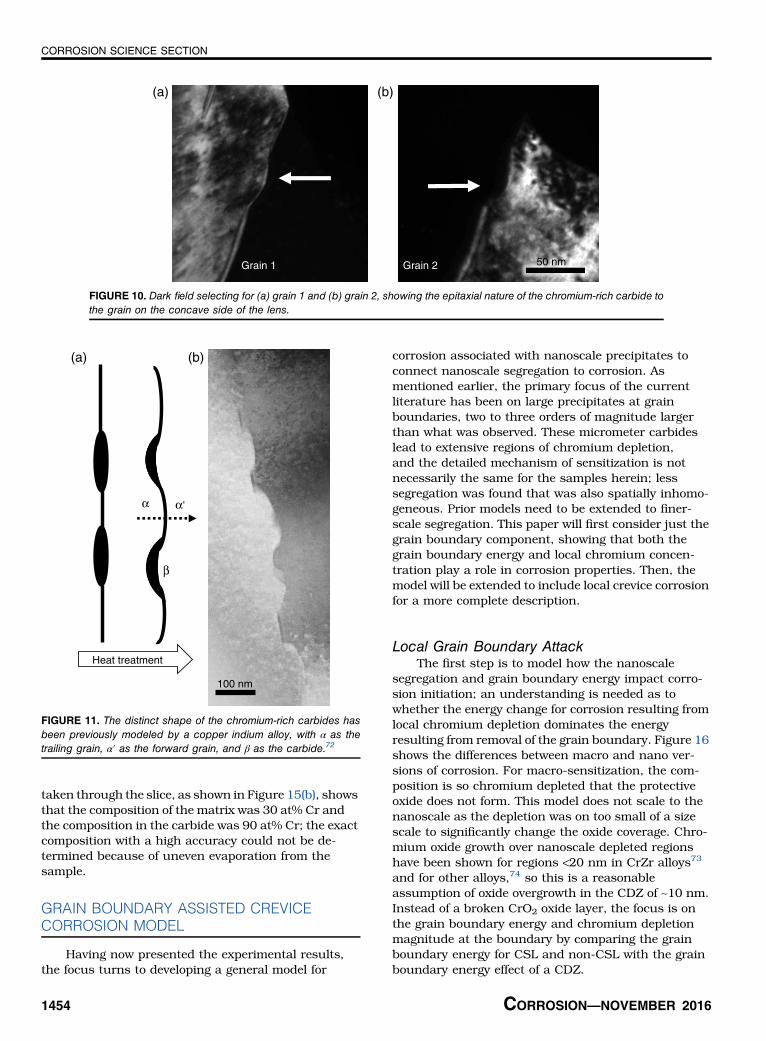
taken through the slice, as shown in Figure 15(b), showsthat the composition of the matrix was 30 at% Cr andthe composition in the carbide was 90 at% Cr; the exactcomposition with a high accuracy could not be de-termined because of uneven evaporation from thesample.
GRAIN BOUNDARY ASSISTED CREVICECORROSION MODEL
Having now presented the experimental results,the focus turns to developing a general model for
corrosion associated with nanoscale precipitates toconnect nanoscale segregation to corrosion. Asmentioned earlier, the primary focus of the currentliterature has been on large precipitates at grainboundaries, two to three orders of magnitude largerthan what was observed. These micrometer carbideslead to extensive regions of chromium depletion,and the detailed mechanism of sensitization is notnecessarily the same for the samples herein; lesssegregation was found that was also spatially inhomo-geneous. Prior models need to be extended to finer-scale segregation. This paper will first consider just thegrain boundary component, showing that both thegrain boundary energy and local chromium concen-tration play a role in corrosion properties. Then, themodel will be extended to include local crevice corrosionfor a more complete description.
Local Grain Boundary AttackThe first step is to model how the nanoscale
segregation and grain boundary energy impact corro-sion initiation; an understanding is needed as towhether the energy change for corrosion resulting fromlocal chromium depletion dominates the energyresulting from removal of the grain boundary. Figure 16shows the differences between macro and nano ver-sions of corrosion. For macro-sensitization, the com-position is so chromium depleted that the protectiveoxide does not form. This model does not scale to thenanoscale as the depletion was on too small of a sizescale to significantly change the oxide coverage. Chro-mium oxide growth over nanoscale depleted regionshave been shown for regions <20 nm in CrZr alloys73
and for other alloys,74 so this is a reasonableassumption of oxide overgrowth in the CDZ of ∼10 nm.Instead of a broken CrO2 oxide layer, the focus is onthe grain boundary energy and chromium depletionmagnitude at the boundary by comparing the grainboundary energy for CSL and non-CSL with the grainboundary energy effect of a CDZ.
Grain 1 Grain 2 50 nm
(a) (b)
FIGURE 10. Dark field selecting for (a) grain 1 and (b) grain 2, showing the epitaxial nature of the chromium-rich carbide tothe grain on the concave side of the lens.
α'α
100 nm
(a) (b)
β
Heat treatment
FIGURE 11. The distinct shape of the chromium-rich carbides hasbeen previously modeled by a copper indium alloy, with α as thetrailing grain, α′ as the forward grain, and β as the carbide.72
1454 CORROSION—NOVEMBER 2016
CORROSION SCIENCE SECTION

To be specific, the difference in composition betweenthe chromium depleted and matrix compositionsleads to a difference in the corrosion potentials that
affected the dissolution of the CoCrMo alloy. Themaincomposition change was a CDZ next to a chromium-richM23C6 carbide. There is an enhancement of Mo in theM23C6 carbide, a common result of alloys with both Moand Cr in the M23C6 carbides, but no difference in theCDZ. TheMo concentration does not change in the CDZ,so the average composition of the matrix and CDZ isrenormalized to be just Co and Cr.
It has been previously shown that as the chro-mium content of an alloy decreases the corrosionpotential increases,75-76 and here it can be
MoCrCo
0
25
(b)
(c) (d) (e)
(a)
50
75
0 50 100 150 200
Co
mp
osi
tio
n (
at%
)
Distance (nm)100 nm
Co
Cr
Mo
FIGURE 12. The chromium depleted region around a chromium-rich carbide, with (a) the ADF image, (b) an extracted linescan to show the CDZ, (c) cobalt, (d) chromium, and (e) molybdenum. The arrow indicates where the line scan was taken,and the circles indicate where the EDS spectra were quantized, reported in Table 2.
TABLE 2EDS Quantification, Figure 12 Carbide
Co (at%) Cr (at%) Mo (at%)
Matrix 62.5 33.6 2.9Carbide 18.7 73.8 8.0CDZ 68.3 23.0 5.1
Co Cr Mo50 nm
(a) (b) (c) (d)
FIGURE 13. The chromium depleted region between two chromium-rich carbides, with (a) the ADF image, (b) cobalt, (c)chromium, and (d) molybdenum. The chromium depletion is measured along a 150 nm section of grain boundary betweentwo carbides and found to be sensitized by 2%. The circles indicate where the EDS spectra were quantized in Table 3.
CORROSION—Vol. 72, No. 11 1455
CORROSION SCIENCE SECTION

approximated that the CoCrMo alloy would follow asimilar trend. In Kelly, et al.,75 an Fe-Cr alloy with20 at% Cr corrodes at −370 mVSCE and the alloy with14 at% Cr corrodes at −310 mVSCE. At this level ofchromium depletion, the corrosion potential increases10 mV per 1 at% Cr decrease. Using the EDS data ofthe quantified chromium depletion zone, the chromiumreduction on average was 7.1 at% Cr. The change incorrosion potential from the matrix to the CDZ would be71 mV, designated as Δμ.
Δμ=μmatrix − μCDZ (1)
Δμ= −71 mV (2)
The electrochemical difference was converted tojoules using a weighted average for composition for thecharge unit of Co and Cr.
Δμ= −71 mV × 2.3e= −0.1633 eV (3)
Δμ=2.61 × 10⁻²⁰ J (4)
With the electrochemical potential difference ofthe matrix and the CDZ, the difference in grainboundary energy between these two compositionswas calculated. The parameters considered for themodel are shown in Figure 17, with L the width of the
CDZ, a the distance between atoms along the grainboundary, b the distance between atoms perpendic-ular to the grain boundary, and d the depth of corrosionset to one monolayer. The energy of the grainboundary ΔEGB and energy lost as a result of thechromium depleted zone ΔECDZ per unit length ofboth were defined as:
ΔEGB = −γGBd (5)
ΔECDZ =ΔμLab
(6)
The interfacial grain boundary energy was approx-imated using the molecular dynamics results of aFe-Cr system with 30 at% Cr, as Fe and Co have thesame surface energy values as pure materials.77-78
The weighted average of the atomic diameters of Co andCr is 0.382 nm, and this value was used for a, b, andd. The γGB of the CoCrMo grain boundaries varies from0.4 J/m2 to 1.4 J/m2. The average chromiumdepletion change was found to be 7.1 at%, and lessextreme areas were found with Cr reduction as low as3 at% (Δμ = −30 mV), so this range can be used as aconservative estimation. The width of the CDZ rangedfrom 5 nm to 10 nm. Therefore, the grain boundaryenergy and the depletion energy reduction rangeswere calculated as:
ΔEGB = −1.53 × 10⁻⁷ mJm
to −5.35 × 10⁻⁷ mJm
(7)
ΔECDZ = −3.78 × 10⁻⁷ mJm
to −17.9 × 10⁻⁷ mJm
(8)
As these ranges overlap, the model indicates thatboth the intrinsic grain boundary energy as well as thelocal chromium depletion are relevant, unlike the
TABLE 3EDS Quantification, Figure 13 Carbide
Co (at%) Cr (at%) Mo (at%)
Matrix 62.5 31.1 4.2Carbide 37.5 53.7 6.7CDZ 64.3 29.1 4.2
TABLE 4Summary of Averaged EDS Quantifications
Co (at%) Cr (at%) Mo (at%)
Matrix 62.9±1.5 30.6±1.4 4.4±0.7Carbide 29.6±7.8 62.4±8.9 7.8±1.2CDZ 69.2±2.7 23.8±2.19 4.2±0.9
Co Cr Mo50 nm
(a) (b) (c) (d)
FIGURE 14. Carbides less than ∼50 nm did not show measurable chromium depletion, with (a) the ADF image, (b) cobalt,(c) chromium, and (d) molybdenum. The circles indicate where the EDS spectra were quantized in Table 5.
TABLE 5EDS Quantification, Figure 14 Carbide
Co (at%) Cr (at%) Mo (at%)
Matrix 64.5 31.5 3.9Carbide 56.5 39.0 4.5CDZ 67.0 30.0 3.3
1456 CORROSION—NOVEMBER 2016
CORROSION SCIENCE SECTION

case for very large precipitates as mentioned earlier.High-energy boundaries without chromium depletionwould show preferential attack, as would low-angleboundaries with some level of depletion. However, as
indicated in the experimental results section, the pre-cipitates occur more at the high-energy boundaries. Itis concluded that for the nanoscale precipitates hereinboth factors influenced corrosion sensitivity.
0
20
40
60
80
100
0 5 10 15 20 25Ato
mic
Co
nce
ntr
atio
n (
%)
Distance (nm)
Co %
Cr %
Mo %
(a) (b)
(c) (d)
–30
–30
–20
–10
010
2030
–20 –10 0
x
y
–30
–20
–10
010
2030
y
–30
–20
–10
010
2030
y
10 20 30 –30 –20 –10 0
x
10 20 30–30 –20 –10 0
x
10 20 30
FIGURE 15. (a) A 10-nm thick slice of LEAP acquisition that intersected with a grain boundary and a carbide.(b) Composition profile through the edge of the carbide showing the chromium segregation. (c) The gallium present fromFIB thinning segregated to the boundaries in the sample (black), which leaves a track of where the grain boundary islocated. (d) The chromium concentration evaporating mainly at the grain boundaries of the carbide with a patch of unevenevaporation on the edge.
Grain 1 Grain 2
Grain boundary
100 nm
Oxide layer
Grain 1 Grain 2
Grain 1 Grain 2
10 nm
Macro-view of sensitization Nano-view of sensitization
Grain boundaryOxide layer
100 nm
FIGURE 16. The macro-view of sensitization has large regions of chromium depletion, leading to incomplete oxide formationaround the sensitized boundary. In nanoscale sensitization, the oxide is not significantly diminished. The chromium depletionis on a nanometer scale along the boundary.
CORROSION—Vol. 72, No. 11 1457
CORROSION SCIENCE SECTION
Including the Role of Crevice CorrosionThe compositional depletion and the energy gain
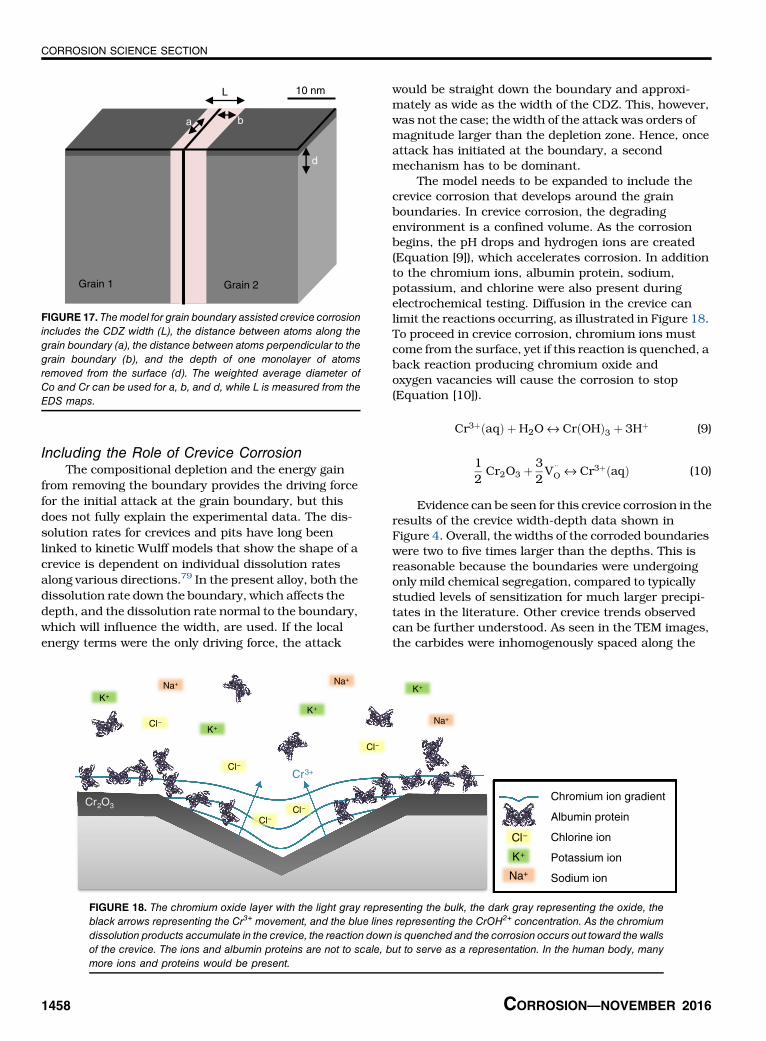
from removing the boundary provides the driving forcefor the initial attack at the grain boundary, but thisdoes not fully explain the experimental data. The dis-solution rates for crevices and pits have long beenlinked to kinetic Wulff models that show the shape of acrevice is dependent on individual dissolution ratesalong various directions.79 In the present alloy, both thedissolution rate down the boundary, which affects thedepth, and the dissolution rate normal to the boundary,which will influence the width, are used. If the localenergy terms were the only driving force, the attack
would be straight down the boundary and approxi-mately as wide as the width of the CDZ. This, however,was not the case; the width of the attack was orders ofmagnitude larger than the depletion zone. Hence, onceattack has initiated at the boundary, a secondmechanism has to be dominant.
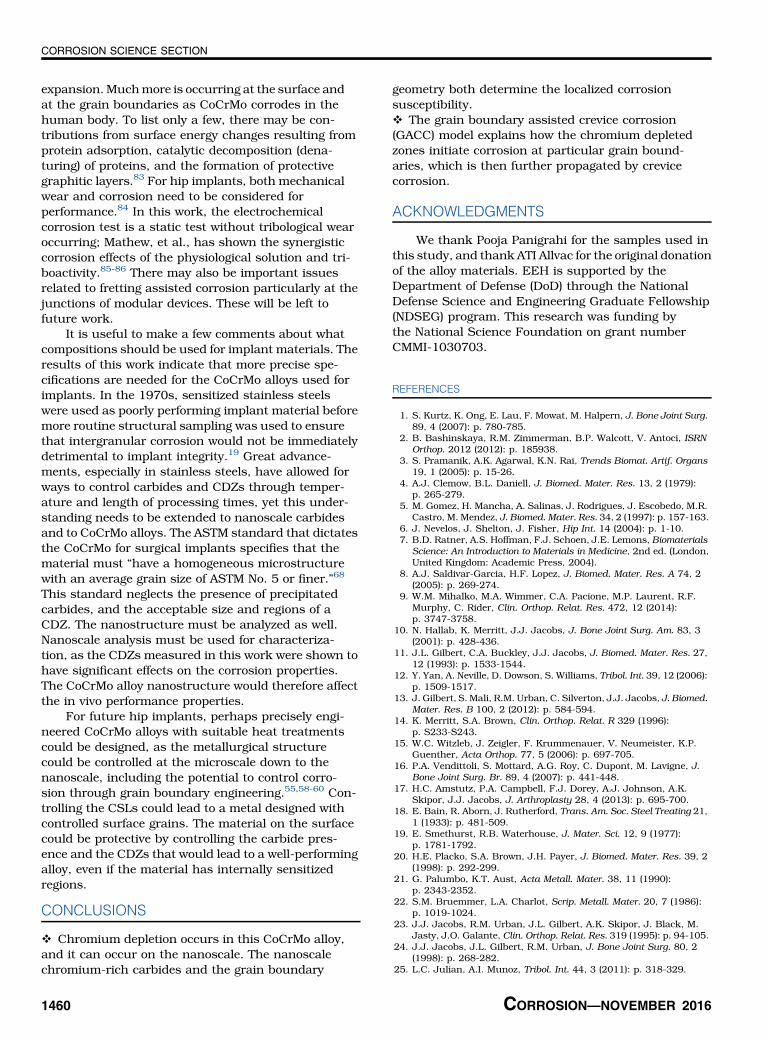
The model needs to be expanded to include thecrevice corrosion that develops around the grainboundaries. In crevice corrosion, the degradingenvironment is a confined volume. As the corrosionbegins, the pH drops and hydrogen ions are created(Equation [9]), which accelerates corrosion. In additionto the chromium ions, albumin protein, sodium,potassium, and chlorine were also present duringelectrochemical testing. Diffusion in the crevice canlimit the reactions occurring, as illustrated in Figure 18.To proceed in crevice corrosion, chromium ions mustcome from the surface, yet if this reaction is quenched, aback reaction producing chromium oxide andoxygen vacancies will cause the corrosion to stop(Equation [10]).
Cr3þðaqÞ þH2O ↔ CrðOHÞ3 þ 3Hþ (9)
12Cr2O3 þ
32V ¨
O ↔ Cr3þðaqÞ (10)
Evidence can be seen for this crevice corrosion in theresults of the crevice width-depth data shown inFigure 4. Overall, the widths of the corroded boundarieswere two to five times larger than the depths. This isreasonable because the boundaries were undergoingonly mild chemical segregation, compared to typicallystudied levels of sensitization for much larger precipi-tates in the literature. Other crevice trends observedcan be further understood. As seen in the TEM images,the carbides were inhomogenously spaced along the
Grain 1
10 nmL
d
Grain 2
ba
FIGURE 17. Themodel for grain boundary assisted crevice corrosionincludes the CDZ width (L), the distance between atoms along thegrain boundary (a), the distance between atoms perpendicular to thegrain boundary (b), and the depth of one monolayer of atomsremoved from the surface (d). The weighted average diameter ofCo and Cr can be used for a, b, and d, while L is measured from theEDS maps.
Cr3+
Cr2O3Chromium ion gradient
Albumin protein
Chlorine ion
Potassium ion
Sodium ion
Cl–
Cl–
Cl–
Cl–
K+
K+
K+
K+
Cl–
K+
Na+
Na+ Na+
Cl–
Na+
FIGURE 18. The chromium oxide layer with the light gray representing the bulk, the dark gray representing the oxide, theblack arrows representing the Cr3+ movement, and the blue lines representing the CrOH2+ concentration. As the chromiumdissolution products accumulate in the crevice, the reaction down is quenched and the corrosion occurs out toward the wallsof the crevice. The ions and albumin proteins are not to scale, but to serve as a representation. In the human body, manymore ions and proteins would be present.
1458 CORROSION—NOVEMBER 2016
CORROSION SCIENCE SECTION

boundaries. With local grain boundary nucleation fol-lowed by crevice corrosion, the model predicts that,depending on the local carbide concentration, therewould be fluctuations in both the depth and widthcorrosion driving forces. As confirmed in the data, for allboundaries there were large local fluctuations in thewidth and depth, represented by the arrows’ ranges ofeach data point in Figure 4. Differences in carbideconcentrations were also observed for corroded CSLsand non-CSLs, with corroded CSLs containingsmaller and fewer carbides. The model predicts thatnon-CSLs would have lower width to depth ratios,and indeed that is seen in the width-depth data. Thiswas also seen in the depth data, as most CSLs onlycorrode to about 1 μm, with widths from 2 μm to 5 μm.Non-CSLs, on the other hand, corroded down to 3 μm,with widths from 3 μm to 5 μm. The carbides provided alarger driving force down the boundary in these non-CSL cases, consistent with the model.
By combining grain boundary sensitization andthe crevice corrosion into the GACCmodel, it is possibleto link the depth and width driving forces for corro-sion to understand the behavior observed in theCoCrMo alloy grain boundaries with the nanoscaleprecipitates.
DISCUSSION
It has been demonstrated herein that chromiumdepletion in these CoCrMo alloys occurs at the nano-scale. The nanoscale chromium-rich carbides com-bine with the grain boundary properties to affect thelocalized corrosion susceptibility. The precipitates bythemselves are not the full story, unlike in the case withconventional and more macroscopic precipitationstudies present in the literature. With the GACC model,it is interpreted that the CDZ led to the start of acrevice at the grain boundary, which then led to run-away corrosion at that location. The GACC modelaccounts for why some higher level CSLs were seen tocorrode: if they had a carbide sensitizing one region ofthe exposed boundary, it was enough to initiate corro-sion. This paper has only reported on high-anglesemi-random grain boundaries; in a future publication,additional details on lower energy grain boundarieswill be described.
Other models have recognized the differencebetween the CDZ and the actual corroded crevice.30,63
For this paper’s CoCrMo alloys, the depletion ofchromium was ∼1 nm to 10 nm in width, while thecrevice on top of the trenchwas as wide as 5 μm.Whileprevious models did not link these two results, thewidth-depth ratio data were linked to the width dis-solution rate and the basic diffusion in the crevice.Using the width-depth measurements across manycrevices, it was concluded that the width corrosion wasa result of the quenched depth corrosion, causingboth driving forces to occur, but with stronger width
corrosion. This width-depth ratio data providedcross-verification of the GACC model.
To compare with the existing literature, estab-lished minimum chromium composition levels aresought. For CoCr bimetallics, the minimum Cr toprevent corrosion is not well established, reported at20% or 30% Cr.80-81 Stainless steel was reviewed for amore thoroughly studied material for comparison. Instainless steel models, it was known that stainlesssteel has a composition around 19 at% Cr and a sen-sitization with CDZs around 13 at% Cr.30,48,63-65 Thisdrop is a 6 at% composition drop or a 32% reduction inchromium. This can be compared to the EDS data ofthe matrix and CDZ of the samples. The matrix com-positions across the CoCrMo alloy samples matchedthe expected values for the composition, with a standarddeviation of 1.3 at%, approximately equal to the 1%expected error with EDS. The largest standard deviationcame from the carbide cobalt and chromium values,which was not surprising as the thickness of the car-bides and the thickness of the sample above andbelow the carbide varied. Therefore, the EDS spectrameasured an uncontrolled ratio of the carbide and thematrix, causing a large variance of the carbide compo-sitions. The CDZ mapping showed an average com-position of 23.8 at% Cr, a 6.8 at% composition drop of a22% decrease in chromium from the matrix compo-sition of 30.6 at% Cr. The results for chromium deple-tion measurements suggested that a smaller changethan the 32% reduction proposed for stainless steelshas an effect on the corrosion performance in CoCrMoalloys.
While these comparisons are useful, it needs tobe noted that to come close to physiological conditionsthe corrosion tests were performed in a BCS with aprotein content of 30 g/L, buffered to a basic pH of 7.4solution with phosphate-buffered saline. This is anaccepted approximation for the conditions in vivo, and itis well established that one cannot simply use, forinstance, salt solutions and obtain physiologically rel-evant results. The BCS solution contains albuminproteins, sodium, potassium, and chlorine ions as wellas lipids, vitamins, amino acids, attachment factors,growth factors, hormones, and other components es-sential for cell growth. It is certainly far from a simpleelectrolytic solution, so there may well be substantialdifferences in the detailed electrochemical processestaking place. The solution may also be evolving in time,as previous studies have shown the roles of proteinsand molybdates in the electrochemical properties ofCoCrMo alloys and their metal oxide behavior;82
within those experiments indications that molybdatesreleased from the metal were leading to cross-linkingof the proteins.
The idea of comparing orientational grainboundary energy and electrochemical energy differ-ences based on the differences in corrosion potentialof the compositions is an initial model that needs
CORROSION—Vol. 72, No. 11 1459
CORROSION SCIENCE SECTION
expansion. Muchmore is occurring at the surface andat the grain boundaries as CoCrMo corrodes in thehuman body. To list only a few, there may be con-tributions from surface energy changes resulting fromprotein adsorption, catalytic decomposition (dena-turing) of proteins, and the formation of protectivegraphitic layers.83 For hip implants, both mechanicalwear and corrosion need to be considered forperformance.84 In this work, the electrochemicalcorrosion test is a static test without tribological wearoccurring; Mathew, et al., has shown the synergisticcorrosion effects of the physiological solution and tri-boactivity.85-86 There may also be important issuesrelated to fretting assisted corrosion particularly at thejunctions of modular devices. These will be left tofuture work.
It is useful to make a few comments about whatcompositions should be used for implant materials. Theresults of this work indicate that more precise spe-cifications are needed for the CoCrMo alloys used forimplants. In the 1970s, sensitized stainless steelswere used as poorly performing implant material beforemore routine structural sampling was used to ensurethat intergranular corrosion would not be immediatelydetrimental to implant integrity.19 Great advance-ments, especially in stainless steels, have allowed forways to control carbides and CDZs through temper-ature and length of processing times, yet this under-standing needs to be extended to nanoscale carbidesand to CoCrMo alloys. The ASTM standard that dictatesthe CoCrMo for surgical implants specifies that thematerial must “have a homogeneous microstructurewith an average grain size of ASTM No. 5 or finer.”68
This standard neglects the presence of precipitatedcarbides, and the acceptable size and regions of aCDZ. The nanostructure must be analyzed as well.Nanoscale analysis must be used for characteriza-tion, as the CDZs measured in this work were shown tohave significant effects on the corrosion properties.The CoCrMo alloy nanostructure would therefore affectthe in vivo performance properties.
For future hip implants, perhaps precisely engi-neered CoCrMo alloys with suitable heat treatmentscould be designed, as the metallurgical structurecould be controlled at the microscale down to thenanoscale, including the potential to control corro-sion through grain boundary engineering.55,58-60 Con-trolling the CSLs could lead to a metal designed withcontrolled surface grains. The material on the surfacecould be protective by controlling the carbide pres-ence and the CDZs that would lead to a well-performingalloy, even if the material has internally sensitizedregions.
CONCLUSIONS
v Chromium depletion occurs in this CoCrMo alloy,and it can occur on the nanoscale. The nanoscalechromium-rich carbides and the grain boundary
geometry both determine the localized corrosionsusceptibility.v The grain boundary assisted crevice corrosion(GACC) model explains how the chromium depletedzones initiate corrosion at particular grain bound-aries, which is then further propagated by crevicecorrosion.
ACKNOWLEDGMENTS
We thank Pooja Panigrahi for the samples used inthis study, and thank ATI Allvac for the original donationof the alloy materials. EEH is supported by theDepartment of Defense (DoD) through the NationalDefense Science and Engineering Graduate Fellowship(NDSEG) program. This research was funding bythe National Science Foundation on grant numberCMMI-1030703.
REFERENCES
1. S. Kurtz, K. Ong, E. Lau, F. Mowat, M. Halpern, J. Bone Joint Surg.89, 4 (2007): p. 780-785.
2. B. Bashinskaya, R.M. Zimmerman, B.P. Walcott, V. Antoci, ISRNOrthop. 2012 (2012): p. 185938.
3. S. Pramanik, A.K. Agarwal, K.N. Rai, Trends Biomat. Artif. Organs19, 1 (2005): p. 15-26.
4. A.J. Clemow, B.L. Daniell, J. Biomed. Mater. Res. 13, 2 (1979):p. 265-279.
5. M. Gomez, H. Mancha, A. Salinas, J. Rodrigues, J. Escobedo, M.R.Castro, M. Mendez, J. Biomed. Mater. Res. 34, 2 (1997): p. 157-163.
6. J. Nevelos, J. Shelton, J. Fisher, Hip Int. 14 (2004): p. 1-10.7. B.D. Ratner, A.S. Hoffman, F.J. Schoen, J.E. Lemons, Biomaterials
Science: An Introduction to Materials in Medicine, 2nd ed. (London,United Kingdom: Academic Press, 2004).
8. A.J. Saldivar-Garcia, H.F. Lopez, J. Biomed. Mater. Res. A 74, 2(2005): p. 269-274.
9. W.M. Mihalko, M.A. Wimmer, C.A. Pacione, M.P. Laurent, R.F.Murphy, C. Rider, Clin. Orthop. Relat. Res. 472, 12 (2014):p. 3747-3758.
10. N. Hallab, K. Merritt, J.J. Jacobs, J. Bone Joint Surg. Am. 83, 3(2001): p. 428-436.
11. J.L. Gilbert, C.A. Buckley, J.J. Jacobs, J. Biomed. Mater. Res. 27,12 (1993): p. 1533-1544.
12. Y. Yan, A. Neville, D. Dowson, S. Williams, Tribol. Int. 39, 12 (2006):p. 1509-1517.
13. J. Gilbert, S. Mali, R.M. Urban, C. Silverton, J.J. Jacobs, J. Biomed.Mater. Res. B 100, 2 (2012): p. 584-594.
14. K. Merritt, S.A. Brown, Clin. Orthop. Relat. R 329 (1996):p. S233-S243.
15. W.C. Witzleb, J. Zeigler, F. Krummenauer, V. Neumeister, K.P.Guenther, Acta Orthop. 77, 5 (2006): p. 697-705.
16. P.A. Vendittoli, S. Mottard, A.G. Roy, C. Dupont, M. Lavigne, J.Bone Joint Surg. Br. 89, 4 (2007): p. 441-448.
17. H.C. Amstutz, P.A. Campbell, F.J. Dorey, A.J. Johnson, A.K.Skipor, J.J. Jacobs, J. Arthroplasty 28, 4 (2013): p. 695-700.
18. E. Bain, R. Aborn, J. Rutherford, Trans. Am. Soc. Steel Treating 21,1 (1933): p. 481-509.
19. E. Smethurst, R.B. Waterhouse, J. Mater. Sci. 12, 9 (1977):p. 1781-1792.
20. H.E. Placko, S.A. Brown, J.H. Payer, J. Biomed. Mater. Res. 39, 2(1998): p. 292-299.
21. G. Palumbo, K.T. Aust, Acta Metall. Mater. 38, 11 (1990):p. 2343-2352.
22. S.M. Bruemmer, L.A. Charlot, Scrip. Metall. Mater. 20, 7 (1986):p. 1019-1024.
23. J.J. Jacobs, R.M. Urban, J.L. Gilbert, A.K. Skipor, J. Black, M.Jasty, J.O. Galante, Clin. Orthop. Relat. Res. 319 (1995): p. 94-105.
24. J.J. Jacobs, J.L. Gilbert, R.M. Urban, J. Bone Joint Surg. 80, 2(1998): p. 268-282.
25. L.C. Julian, A.I. Munoz, Tribol. Int. 44, 3 (2011): p. 318-329.
1460 CORROSION—NOVEMBER 2016
CORROSION SCIENCE SECTION

26. C.V. Vidal, A.I. Munoz, Electrochim. Acta 54, 6 (2009):p. 1798-1809.
27. M. Hernandez-Rodriguez, R. Mercado-Solis, A. Perez-Unzueta,D. Martinez-Delgado, M. Cantú-Sifuentes, Wear 259, 7 (2005):p. 958-963.
28. E.L. Hall, C.L. Briant, Metall. Trans. A 15, 5 (1984): p. 793-811.29. C.L. Briant, P.L. Andresen, Metall. Trans. A 19, 3 (1988):
p. 495-504.30. C. Stawstrom, M. Hillert, J. Iron Steel Inst. 207 (1969): p. 77-85.31. V.Y. Gertsman, S.M. Bruemmer, Acta Mater. 49, 9 (2001):
p. 1589-1598.32. C.L. Briant, Metall. Trans. A 18, 4 (1987): p. 691-699.33. G. Song, A. Atrens, Adv. Eng. Mater. 9, 3 (2007): p. 177-183.34. G.L. Song, A. Atrens, Adv. Eng. Mater. 5, 12 (2003): p. 837-858.35. N. Winzer, A. Atrens, G.L. Song, E. Ghali, W. Dietzel, K.U. Kainer,
N. Hort, C. Blawert, Adv. Eng. Mater. 7, 8 (2005): p. 659-693.36. M.C. Zhao, M. Liu, G.L. Song, A. Atrens, Corros. Sci. 50, 7 (2008):
p. 1939-1953.37. R. Houdremont, H. Bennek, Stahl Eisen 52 (1932): p. 660.38. V. Kain, R.C. Prasad, P.K. De, Corrosion 58, 1 (2002): p. 15-37.39. W. Clarke, R. Cowan, W. Walker, Intergranular Corrosion of
Stainless Alloys, ASTM STP 656 (West Conshohocken, PA: ASTMInternational, 1978), p. 99.
40. R. Singh, S.G. Chowdhury, B.R. Kumar, S.K. Das, P.K. De, I.Chattoraj, Scrip. Mater. 57, 3 (2007): p. 185-188.
41. R. Singh, B. Ravikumar, A. Kumar, P.K. Dey, I. Chattoraj, Metall.Mater. Trans. A 34, 11 (2003): p. 2441-2447.
42. Y. Zhou, K.T. Aust, U. Erb, G. Palumbo, Scrip. Mater. 45, 1 (2001):p. 49-54.
43. E.A. Trillo, L.E. Murr, J. Mater. Sci. 33, 5 (1998): p. 1263-1271.44. E. Almanza, L.E. Murr, J. Mater. Sci. 35, 13 (2000): p. 3181-3188.45. A. Pardo, M. Merino, A. Coy, F. Viejo, M. Carboneras, R. Arrabal,
Acta Mater. 55, 7 (2007): p. 2239-2251.46. R. Leiva-Garcia, M.J. Munoz-Portero, J. Garcia-Anton, Corros. Sci.
51, 9 (2009): p. 2080-2091.47. S.M. Bruemmer, Corrosion 42, 1 (1986): p. 27-35.48. S.M. Bruemmer, L.A. Chariot, B.W. Arey, Corrosion 44, 6 (1988):
p. 328-333.49. A. Lewis, M. Kilburn, I. Papageorgiou, G. Allen, C. Case, J. Biomed.
Mater. Res. A 73, 4 (2005): p. 456-467.50. C. Valero-Vidal, L. Casabán-Julián, I. Herraiz-Cardona,
A. Igual-Munoz, Mater. Sci. Eng. C 33, 8 (2013): p. 4667-4676.51. W.C. Rodrigues, L.R. Broilo, L. Schaeffer, G. Knornschild, F.R.M.
Espinoza, Powder Technol. 206, 3 (2011): p. 233-238.52. E. Bettini, T. Eriksson, M. Boström, C. Leygraf, J. Pan, Electrochim.
Acta 56, 25 (2011): p. 9413-9419.53. S.M. Bruemmer, B.W. Arey, L.A. Charlot, Corrosion 48, 1 (1992):
p. 42-49.54. C. Montero-Ocampo, A. Salinas Rodriguez, J. Biomed. Mater. Res.
29, 4 (1995): p. 441-453.55. S.M. Schlegel, S. Hopkins, M. Frary, Scrip. Mater. 61, 1 (2009):
p. 88-91.56. P. Lin, G. Palumbo, U. Erb, K.T. Aust, Scrip. Metall. Mater. 33, 9
(1995): p. 1387-1392.57. P. Panigrahi, Y. Liao, M.T. Mathew, A. Fischer, M.A. Wimmer, J.J.
Jacobs, L.D. Marks, J. Biomed. Mater. Res. B 102, 4 (2014):p. 850-859.
58. V. Randle, Acta Mater. 52, 14 (2004): p. 4067-4081.59. V. Randle, Mater. Character. 47, 5 (2001): p. 411-416.
60. E.M. Lehockey, A.M. Brennenstuhl, I. Thompson, Corros. Sci. 46,10 (2004): p. 2383-2404.
61. M. Shimada, H. Kokawa, Z.J. Wang, Y.S. Sato, I. Karibe, ActaMater. 50, 9 (2002): p. 2331-2341.
62. C.S. Tedmon, D.A. Vermilye, J.H. Rosolows, J. Electrochem. Soc.118, 2 (1971): p. 192-202.
63. B.W. Bennett, H.W. Pickering, Metall. Trans. A 18, 6 (1991):p. 1117-1124.
64. M. Povich, Corrosion 34, 2 (1978): p. 60-65.65. H. Sahlaoui, K. Makhlouf, H. Sidhom, J. Philibert, Mater. Sci. Eng.
A 372, 1-2 (2004): p. 98-108.66. P. Stemmer, R. Pourzal, Y.F. Liao, L. Marks, M. Morlock, J.J.
Jacobs, M.A. Wimmer, A. Fischer,Am. Soc. Test Mater. 1560 (2013):p. 251-267.
67. G. Palumbo, K.T. Aust, E.M. Lehockey, U. Erb, P. Lin, Scrip. Mater.38, 11 (1998): p. 1685-1690.
68. ASTM F1537-11, “Standard Specification for Wrought Cobalt-28Chromium-6Molybdenum Alloys for Surgical Implants (UNSR31537, UNS R31538, and UNS R31539)” (West Conshohocken,PA: ASTM International, 2011).
69. D. Brandon, Acta Metall. 14, 11 (1966): p. 1479-1484.70. R.T. Blunt, “White Light Interferometry–A Production Worthy
Technique for Measuring Surface Roughness on SemiconductorWafers,” Proceedings of CS MANTECH Conference 2006 (Beaver-ton, OR: CS MANTECH, 2006), p. 59-62.
71. M.K. Miller, K.F. Russell, K. Thompson, R. Alvis, D.J. Larson,Microsc. Microanal. 13, 6 (2007): p. 428-436.
72. R. Fournelle, J. Clark, Metall. Trans. 3, 11 (1972): p. 2757-2767.73. M. Mehmood, B.-P. Zhang, E. Akiyama, H. Habazaki,
A. Kawashima, K. Asami, K. Hashimoto, Corros. Sci. 40, 1 (1998):p. 1-17.
74. A.M. Lucente, J.R. Scully, Corros. Sci. 49, 5 (2007): p. 2351-2361.75. W.K. Kelly, R.N. Iyer, H.W. Pickering, J. Electrochem. Soc. 140, 11
(1993): p. 3134-3140.76. R. Frankenthal, H. Pickering, J. Electrochem. Soc. 120, 1 (1973):
p. 23-26.77. J.A. Alonso, N.H. March, Electrons in Metals and Alloys (San Diego,
CA: Elsevier Science, 2012).78. Y. Shibuta, S. Takamoto, T. Suzuki, Comput. Mater. Sci. 44, 4
(2009): p. 1025-1029.79. K. Sangwal, Etching of Crystals: Theory, Experiment and Applica-
tion (Amsterdam, The Netherlands: Elsevier Science, 2012).80. U.K. Chatterjee, S.K. Bose, S.K. Roy, Environmental Degradation of
Metals, Corrosion Technology Series/14 (New York, NY: Taylor &Francis, 2001).
81. G.C. Wood, I.G. Wright, T. Hodgkiess, D.P. Whittle, Mater. Corros.21, 11 (1970): p. 900-910.
82. E.J. Martin, R. Pourzal, M.T. Mathew, K.R. Shull, Langmuir 29, 15(2013): p. 4813-4822.
83. Y. Liao, R. Pourzal, M.A. Wimmer, J.J. Jacobs, A. Fischer, L.D.Marks, Science 334, 6063 (2011): p. 1687-1690.
84. A. Neville, J. Hesketh, A.R. Beadling, M.G. Bryant, D. Dowson, Proc.Inst. Mech. Eng. H 230, 5 (2016): p. 406-420.
85. M.T. Mathew, J.J. Jacobs, M.A. Wimmer, Clin. Orthop. Relat. Res.470, 11 (2012): p. 3109-3117.
86. M. Wimmer, M. Mathew, M. Laurent, C. Nagelli, Y. Liao, L. Marks,R. Pourzal, A. Fischer, J. Jacobs, Tribochemical Reactions inMetal-on-Metal Hip Joints Influence Wear and Corrosion (WestConshohocken, PA: ASTM International, 2013), p. 18.
CORROSION—Vol. 72, No. 11 1461
CORROSION SCIENCE SECTION


![Ivyspring Nanotheranosticsthe implant surface becomes rough after contact with saliva [36]. Further electrochemical corrosion of titanium and its alloys causes crevice corrosion, and](https://img.dokumen.tips/doc/110x75/6129297eaa74fe673144c6d7/ivyspring-nanotheranostics-the-implant-surface-becomes-rough-after-contact-with.jpg)


![Design and fabrication of CoCrMo alloy based novel structures8].pdf · Design and fabrication of CoCrMo alloy based novel structures for load bearing implants using laser engineered](https://img.dokumen.tips/doc/110x75/5f0bf3837e708231d4330686/design-and-fabrication-of-cocrmo-alloy-based-novel-8pdf-design-and-fabrication.jpg)