Embed Size (px)
Citation preview
The SSIP is supported by
SENIOR SECONDARY PROGRAMME 201
GRADE 12
MATHEMATICAL LITERACY
TEACHER NOTES
(c) Gauteng Department of Education, 2013
1
TABLE OF CONTENTS
TEACHER NOTES
SESSION TOPIC PAGE
3 1. Drawing graphs of real life situations
2: Drawing and interpreting more than one graph on
a system of axes
4
5
1: Grids, maps, compass
2: Use and interpret scale drawings, build scale
models
Self Study
1. Compare, summarise and display data –
describe
trends
2. Probability and misuse of statistics in society
(c) Gauteng Department of Education, 2013
2
GAUTENG DEPARTMENT OF EDUCATION SENIOR SECONDARY INTERVENTION PROGRAMME
MATHEMATICAL LITERACY GRADE 12 SESSION 3 (TEACHER NOTES)
SESSION 3: TOPIC 1: GRAPHS IN REAL LIFE SITUATIONS
Teacher Note: When learners scan through a newspaper, there are many pages that have
graphs to illustrate visually the information that the articles are about. It is important for
learners to grasp the concept of graphs in real life situations. Sketching and reading graphs is
the key to understanding the information around you.
LESSON OVERVIEW:
1. Introduce session: 5 minutes 2. Typical exam questions: 30 minutes 3. Review/solutions/memo: 25 minutes
QUESTION 1
A cell phone contract is set up such that the subscriber has to pay R2,80 per minute.
a. Complete the table of values for the above contract. (2)
Minutes 1 2 3 4 5 6
Cost 2.80 5.60 11.20 14
b. Sketch a graph showing the cost of the contract. (5) c. Set up an equation that represents the above relationship. (3)
[10]
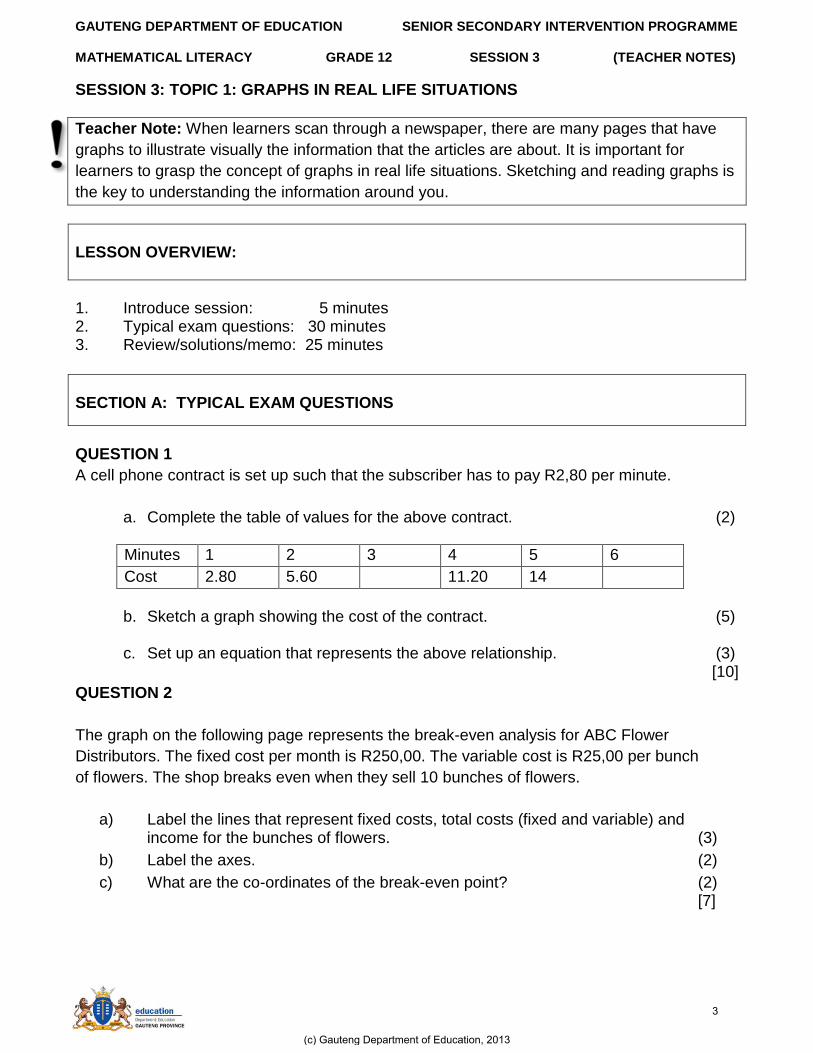
QUESTION 2
The graph on the following page represents the break-even analysis for ABC Flower
Distributors. The fixed cost per month is R250,00. The variable cost is R25,00 per bunch
of flowers. The shop breaks even when they sell 10 bunches of flowers.
a) Label the lines that represent fixed costs, total costs (fixed and variable) and income for the bunches of flowers. (3)
b) Label the axes. (2)
c) What are the co-ordinates of the break-even point? (2) [7]
SECTION A: TYPICAL EXAM QUESTIONS
(c) Gauteng Department of Education, 2013
3
GAUTENG DEPARTMENT OF EDUCATION SENIOR SECONDARY INTERVENTION PROGRAMME
MATHEMATICAL LITERACY GRADE 12 SESSION 3 (TEACHER NOTES)
250.00
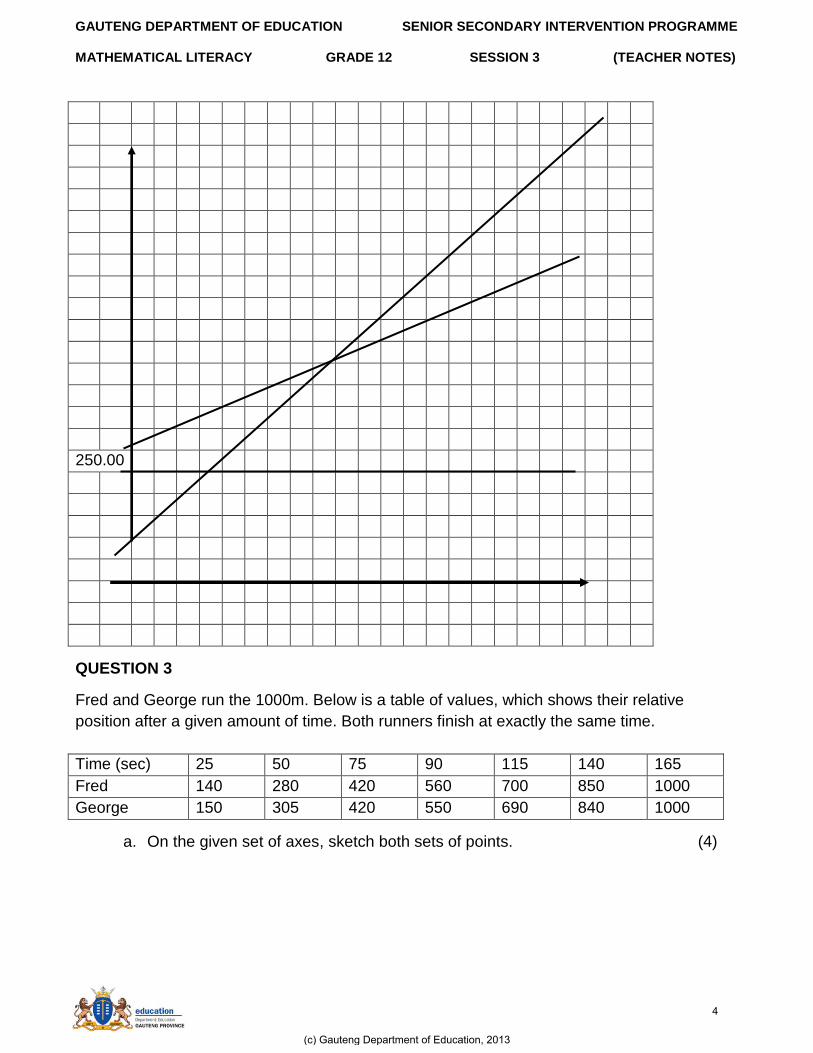
QUESTION 3
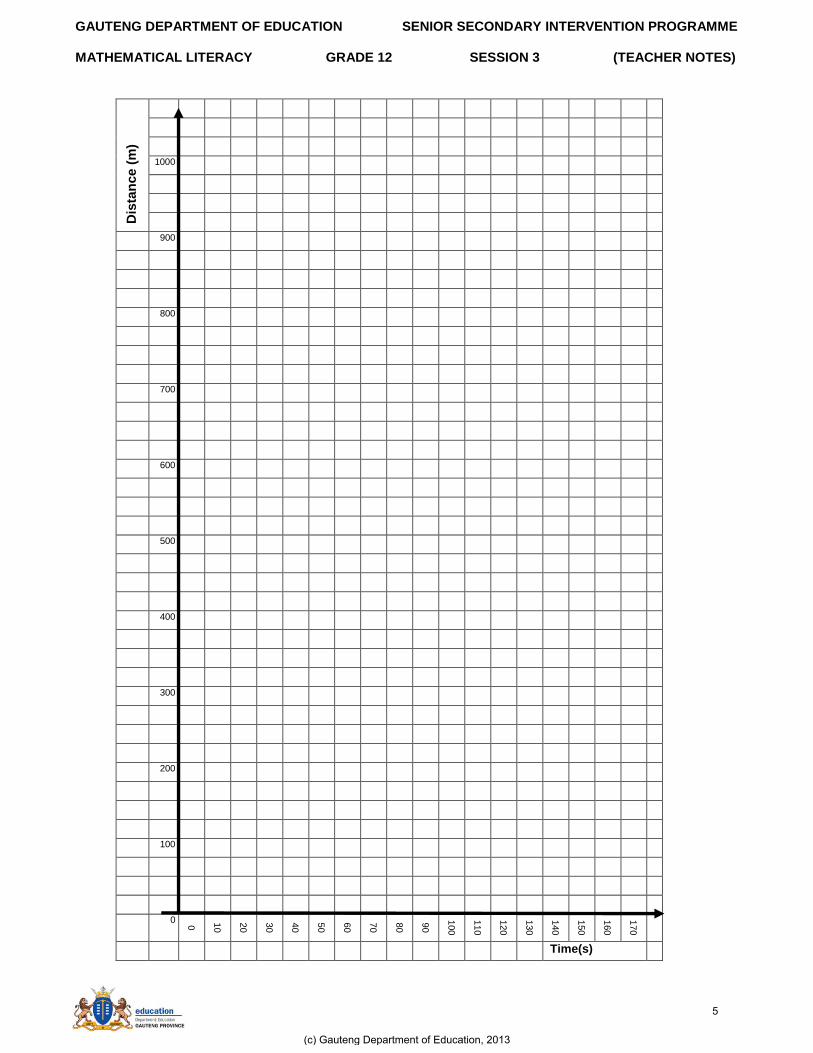
Fred and George run the 1000m. Below is a table of values, which shows their relative
position after a given amount of time. Both runners finish at exactly the same time.
Time (sec) 25 50 75 90 115 140 165
Fred 140 280 420 560 700 850 1000
George 150 305 420 550 690 840 1000
a. On the given set of axes, sketch both sets of points. (4)
(c) Gauteng Department of Education, 2013
4
GAUTENG DEPARTMENT OF EDUCATION SENIOR SECONDARY INTERVENTION PROGRAMME
MATHEMATICAL LITERACY GRADE 12 SESSION 3 (TEACHER NOTES)
Dis
tan
ce
(m
)
1000
900
800
700
600
500
400
300
200
100
0 0
10
20
30
40
50
60
70
80
90
100
110
120
130
140
150
160
170
Time(s)
(c) Gauteng Department of Education, 2013
5
GAUTENG DEPARTMENT OF EDUCATION SENIOR SECONDARY INTERVENTION PROGRAMME
MATHEMATICAL LITERACY GRADE 12 SESSION 3 (TEACHER NOTES)
b) During which time is Fred ahead of George. Indicate on the graph? (2) c) At what distance other than the start or the finish have the two boys docked the
same time? Indicate on your graph where you got your reading. Label this point A. (2)
onds
metersspeed
sec
d) Use the formula above to calculate George‟s speed for the first 75 seconds. (2)
e) During which interval did Fred run the fastest? (2) [12]
SECTION B: SOLUTIONS AND HINTS
QUESTION 1
a) The complete table:
Minutes 1 2 3 4 5 6
Cost 2.80 5.60 8.40 11.20 14 16.8
(Note: Learners must look at the top value and multiply it by the R2,80) (2)
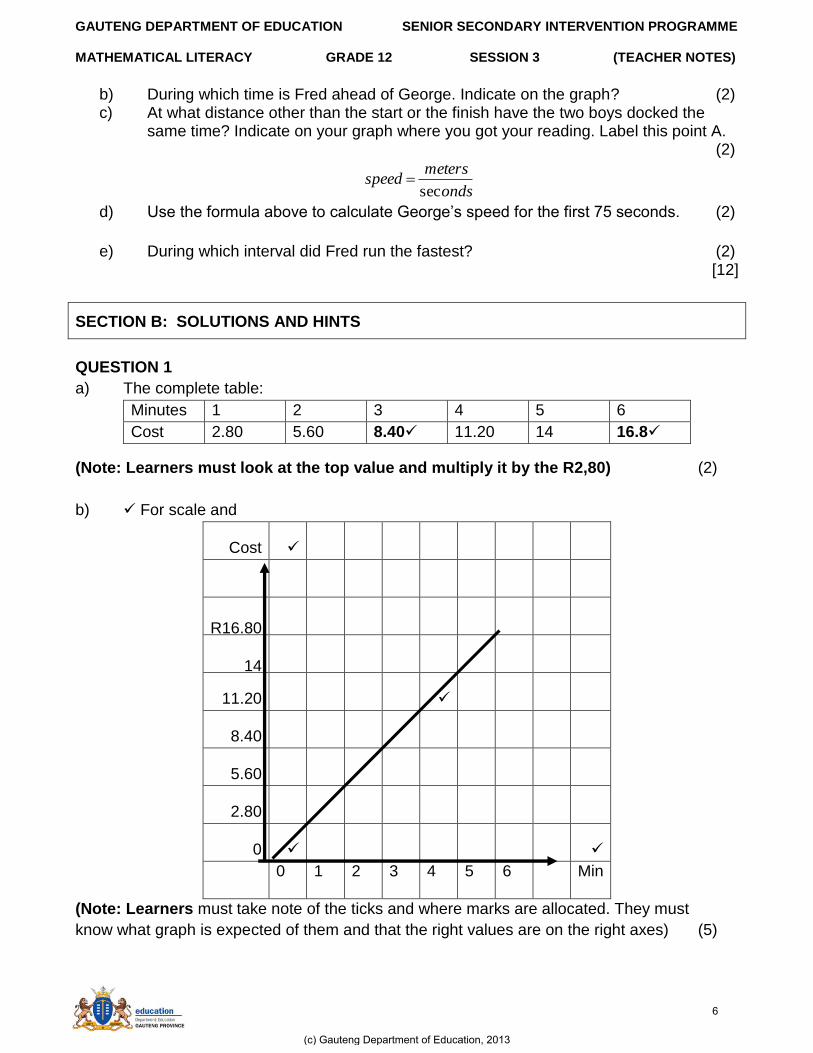
b) For scale and
Cost
R16.80
14
11.20
8.40
5.60
2.80
0
0 1 2 3 4 5 6 Min
(Note: Learners must take note of the ticks and where marks are allocated. They must
know what graph is expected of them and that the right values are on the right axes) (5)
(c) Gauteng Department of Education, 2013
6
GAUTENG DEPARTMENT OF EDUCATION SENIOR SECONDARY INTERVENTION PROGRAMME
MATHEMATICAL LITERACY GRADE 12 SESSION 3 (TEACHER NOTES)
c) 12
12
xx
yym
(Or cost per minute); c = 0
Thus, y = m*x + c becomes y = 2.80x (3)
[10]
QUESTION 2
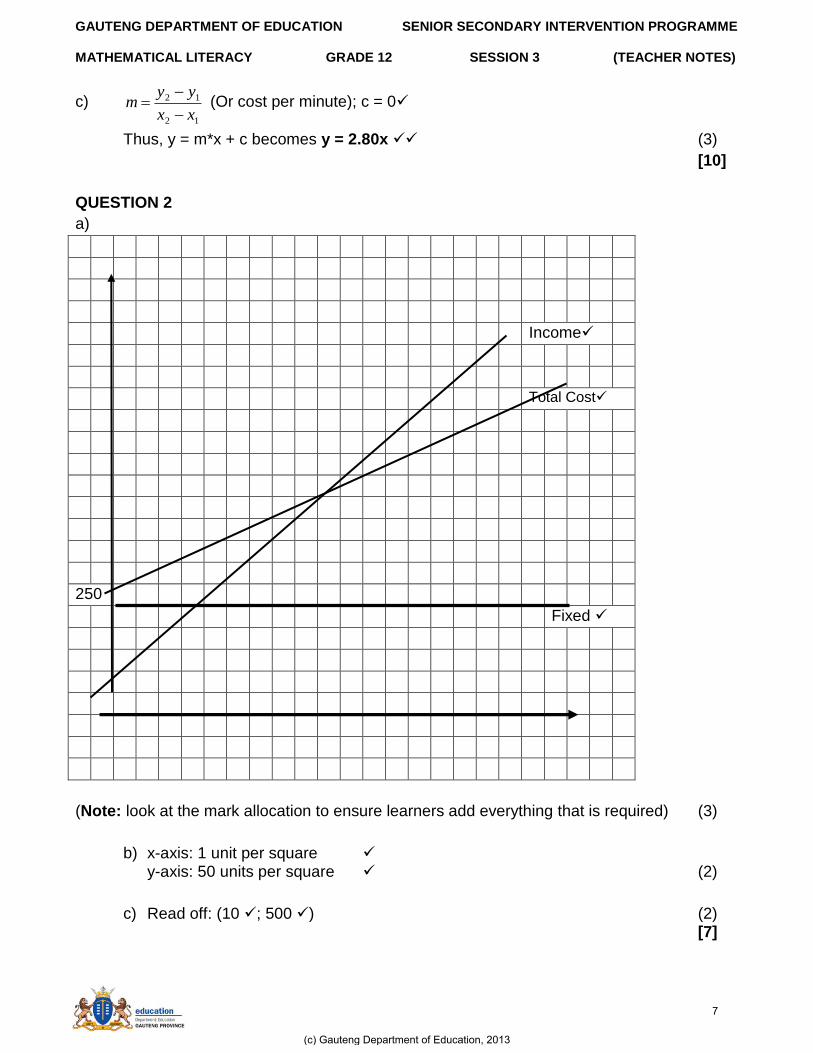
a)
Income
Total Cost
250
Fixed
(Note: look at the mark allocation to ensure learners add everything that is required) (3)
b) x-axis: 1 unit per square y-axis: 50 units per square (2)
c) Read off: (10 ; 500 ) (2) [7]
(c) Gauteng Department of Education, 2013
7
GAUTENG DEPARTMENT OF EDUCATION SENIOR SECONDARY INTERVENTION PROGRAMME
MATHEMATICAL LITERACY GRADE 12 SESSION 3 (TEACHER NOTES)
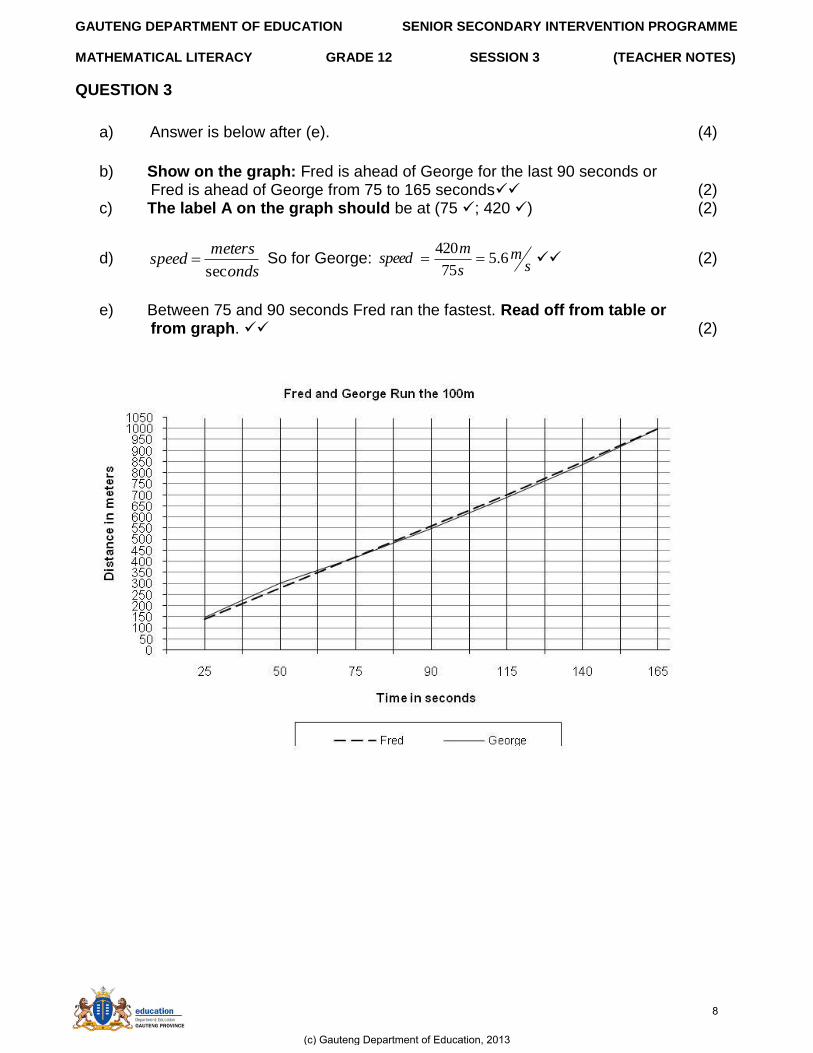
QUESTION 3
a) Answer is below after (e). (4)
b) Show on the graph: Fred is ahead of George for the last 90 seconds or Fred is ahead of George from 75 to 165 seconds (2) c) The label A on the graph should be at (75 ; 420 ) (2)
d) onds
metersspeed
sec So for George:
sm
s
mspeed 6.5
75
420 (2)
e) Between 75 and 90 seconds Fred ran the fastest. Read off from table or from graph. (2)
(c) Gauteng Department of Education, 2013
8
GAUTENG DEPARTMENT OF EDUCATION SENIOR SECONDARY INTERVENTION PROGRAMME
MATHEMATICAL LITERACY GRADE 12 SESSION 3 (TEACHER NOTES)
Teacher Note: As the learners attempt the homework, they must look at the mark allocations
and time themselves to ensure they can answer the questions in the given time. If they
cannot, or get the answers wrong, the learners must attempt the homework again as this is
good practice.
QUESTION 1: 10 minutes
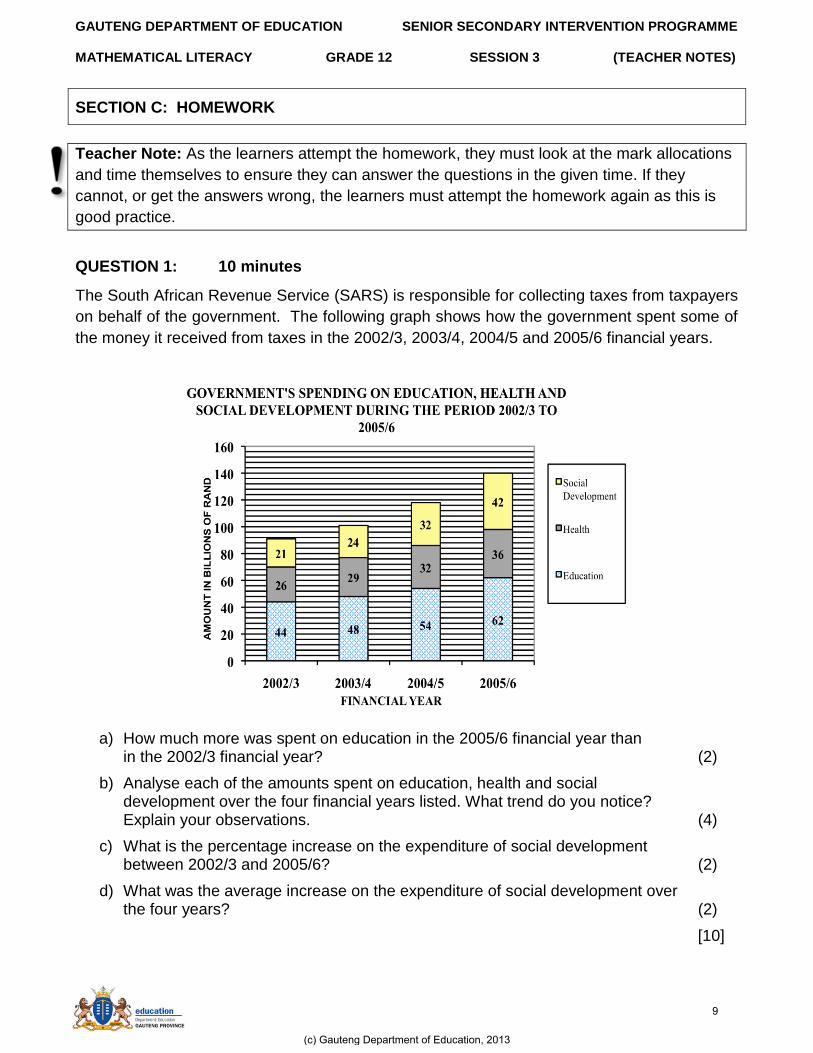
The South African Revenue Service (SARS) is responsible for collecting taxes from taxpayers
on behalf of the government. The following graph shows how the government spent some of
the money it received from taxes in the 2002/3, 2003/4, 2004/5 and 2005/6 financial years.
a) How much more was spent on education in the 2005/6 financial year than in the 2002/3 financial year? (2)
b) Analyse each of the amounts spent on education, health and social development over the four financial years listed. What trend do you notice? Explain your observations. (4)
c) What is the percentage increase on the expenditure of social development between 2002/3 and 2005/6? (2)
d) What was the average increase on the expenditure of social development over the four years? (2)
[10]
SECTION C: HOMEWORK
(c) Gauteng Department of Education, 2013
9
GAUTENG DEPARTMENT OF EDUCATION SENIOR SECONDARY INTERVENTION PROGRAMME
MATHEMATICAL LITERACY GRADE 12 SESSION 3 (TEACHER NOTES)
QUESTION 2: 25 minutes
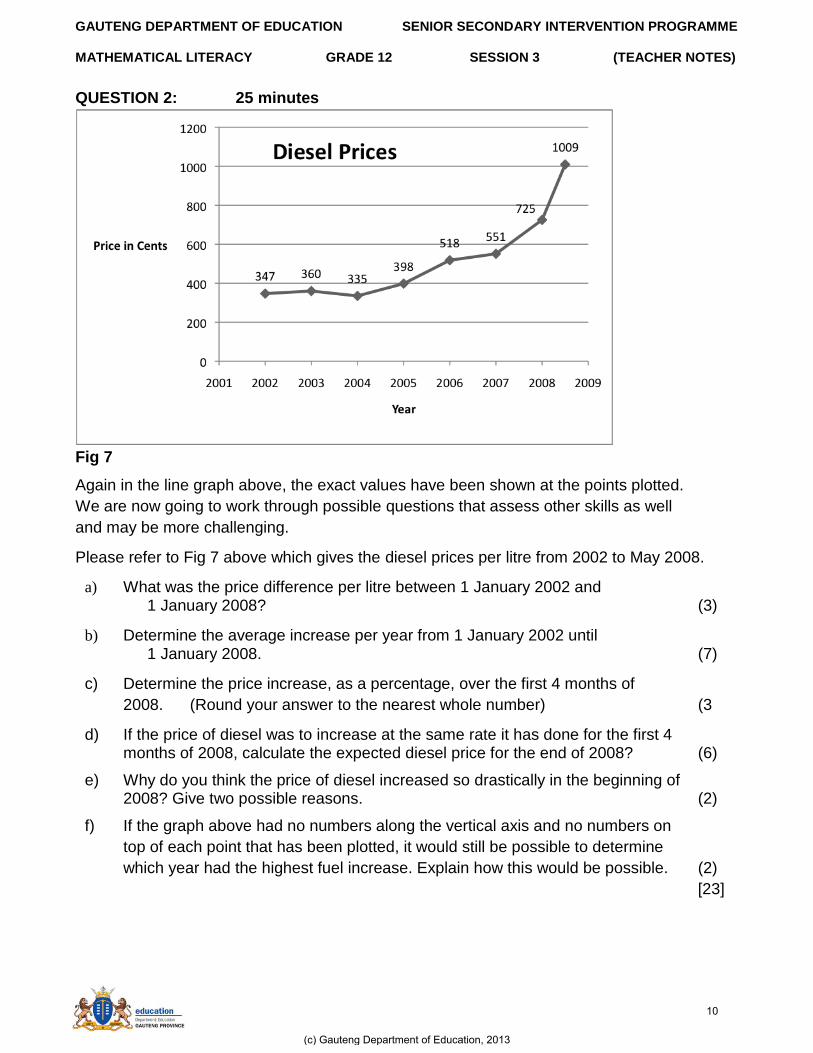
Fig 7
Again in the line graph above, the exact values have been shown at the points plotted.
We are now going to work through possible questions that assess other skills as well
and may be more challenging.
Please refer to Fig 7 above which gives the diesel prices per litre from 2002 to May 2008.
a) What was the price difference per litre between 1 January 2002 and 1 January 2008? (3)
b) Determine the average increase per year from 1 January 2002 until 1 January 2008. (7)
c) Determine the price increase, as a percentage, over the first 4 months of
2008. (Round your answer to the nearest whole number) (3
d) If the price of diesel was to increase at the same rate it has done for the first 4 months of 2008, calculate the expected diesel price for the end of 2008? (6)
e) Why do you think the price of diesel increased so drastically in the beginning of 2008? Give two possible reasons. (2)
f) If the graph above had no numbers along the vertical axis and no numbers on
top of each point that has been plotted, it would still be possible to determine
which year had the highest fuel increase. Explain how this would be possible. (2)
[23]
(c) Gauteng Department of Education, 2013
10
GAUTENG DEPARTMENT OF EDUCATION SENIOR SECONDARY INTERVENTION PROGRAMME
MATHEMATICAL LITERACY GRADE 12 SESSION 3 (TEACHER NOTES)
QUESTION 1
a) R62 – 44 billion = R18 billion b) More is spent each year with the most being spent on social development. This is
probably due to funds being spent on developing sport in previously disadvantaged areas.
c) (42 – 21) = 21 X 100 = 100 % d) Average increase = 3 + 8 + 10 = 7 Billion per year
3
QUESTION 2 a. This is an easy question. (Read off from the graph and subtract the values) 725 – 327 = 398 cents = R3,98 (3)
b. Here we have to work out the increase for each year, i.e. subtract the values given for each year, then find the average of these values.
360 – 347 = 13 335 – 360 = -25 Note: price went down. It is important to include the
negative sign 398 – 335 = 63 518 – 398 = 120 551 – 518 = 33
725 – 551 = 174
Now average these amounts: 13 -25 + 63 + 120 + 33 + 174 6 = 378 = 63 cents per year. 6 (7)
c. Do you remember how to work out percentage increase?
Final price – original price X 100 = 1009 – 725 X 100 Original price 725 = 39% (3)
SECTION E: SOLUTIONS TO HOMEWORK
(c) Gauteng Department of Education, 2013
11
GAUTENG DEPARTMENT OF EDUCATION SENIOR SECONDARY INTERVENTION PROGRAMME
MATHEMATICAL LITERACY GRADE 12 SESSION 3 (TEACHER NOTES)
d. According to the previous answer the price increases by 39% in 4 months. To reach the end of the year it must thus go through another TWO 4 month periods, increasing by 39% twice. May - Aug 1009 X 39 ÷100 = 393,51 1009 + 393,51 = 1402,51 Sept - Dec 1402,51 X 39 ÷100 = 546,98 546,98 + 1402,51 = 1950 cents
Therefore, the expected diesel price, would have been R19,50 at the end of 2008. Note: only round off the FINAL answer to be more accurate. If number of decimals is not specified, keep to the same as in the question. (6)
e. Here you are giving your own opinion, but of course it must make sense. (2)
f. Yes, it would be the highest value point on the graph, i.e. where the graph peaks. (2) [23]
(c) Gauteng Department of Education, 2013
12
GAUTENG DEPARTMENT OF EDUCATION SENIOR SECONDARY INTERVENTION PROGRAMME
MATHEMATICAL LITERACY GRADE 12 SESSION 3 (TEACHER NOTES)
SESSION 3: TOPIC 2: DRAWING AND INTERPRET MORE THAN ONE GRAPH ON A
SYSTEM OF AXES
Teacher Note: Learners must ensure that they understand the basic concepts of graphs
before trying to interpret them.
1. Introduce session: 5 minutes 2. Typical exam questions: 30 minutes 3. Review/solutions/memo: 25 minutes
SECTION A: TYPICAL EXAM QUESTIONS
QUESTION 1: 5 minutes (From Cluster Prelim Exam 2008)
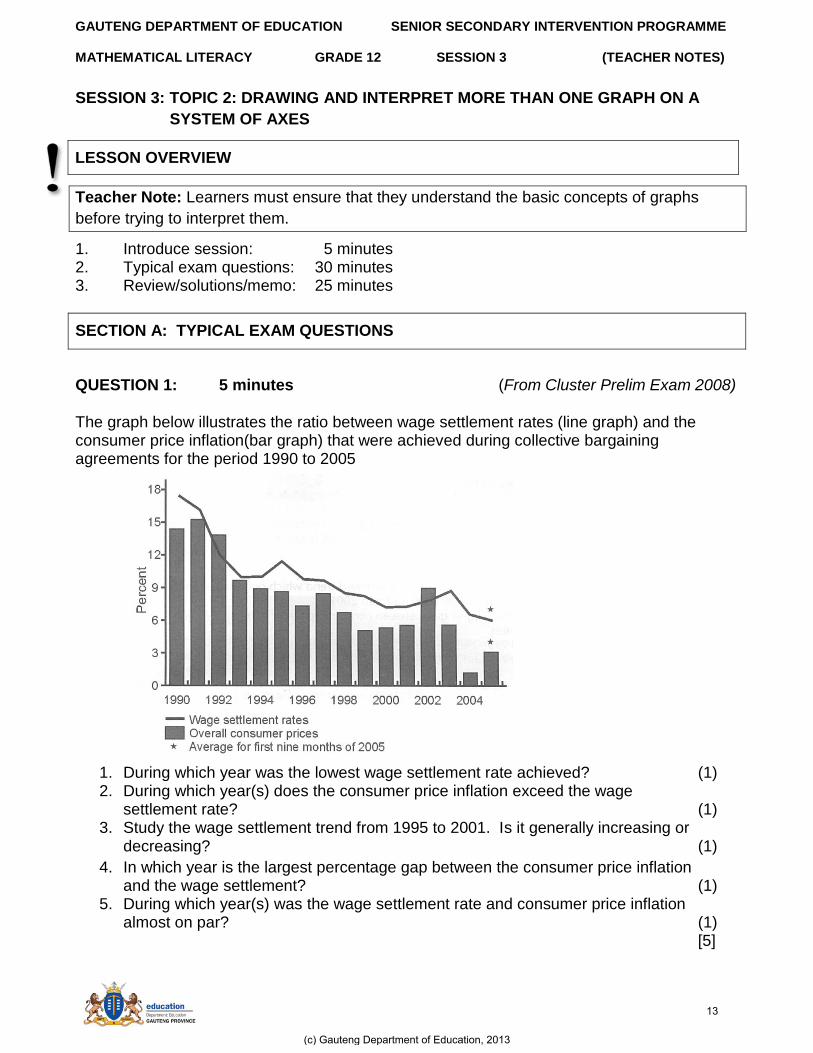
The graph below illustrates the ratio between wage settlement rates (line graph) and the consumer price inflation(bar graph) that were achieved during collective bargaining agreements for the period 1990 to 2005
1. During which year was the lowest wage settlement rate achieved? (1) 2. During which year(s) does the consumer price inflation exceed the wage settlement rate? (1) 3. Study the wage settlement trend from 1995 to 2001. Is it generally increasing or
decreasing? (1)
4. In which year is the largest percentage gap between the consumer price inflation and the wage settlement? (1) 5. During which year(s) was the wage settlement rate and consumer price inflation almost on par? (1)
[5]
LESSON OVERVIEW
(c) Gauteng Department of Education, 2013
13
GAUTENG DEPARTMENT OF EDUCATION SENIOR SECONDARY INTERVENTION PROGRAMME
MATHEMATICAL LITERACY GRADE 12 SESSION 3 (TEACHER NOTES)
QUESTION 2: 15 minutes (From June Examination 2008)
NOTE: Learners must look at how negative values are interpreted.
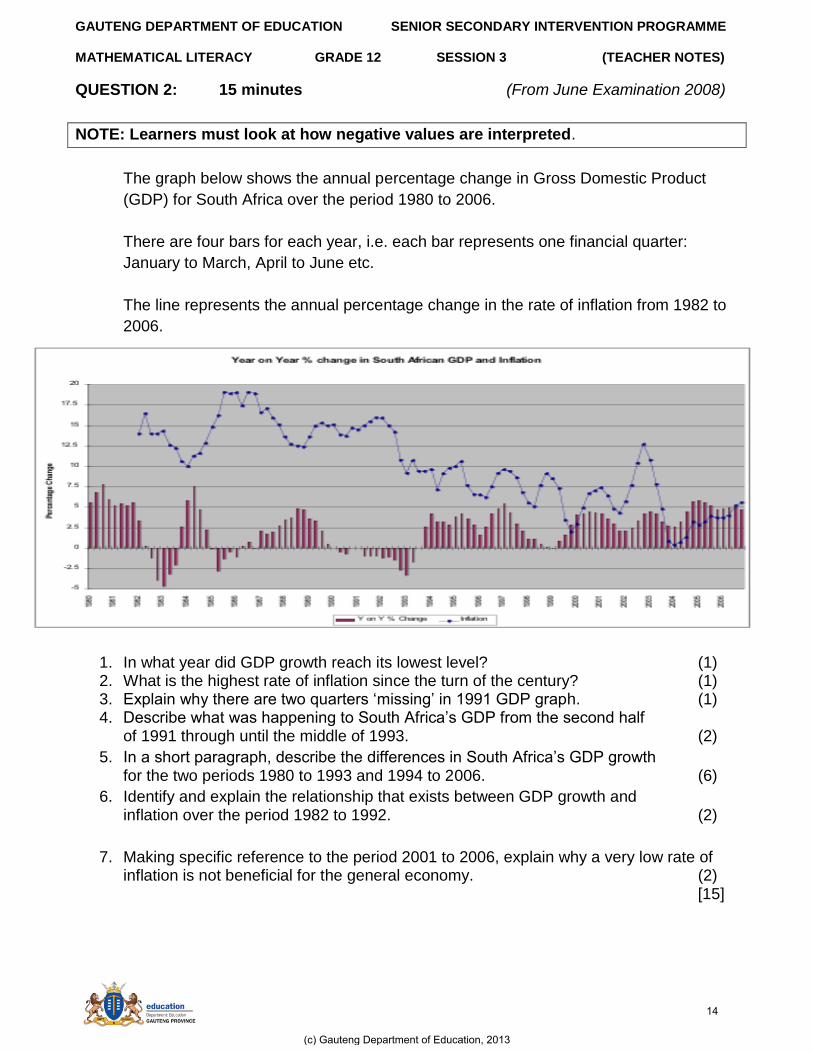
The graph below shows the annual percentage change in Gross Domestic Product
(GDP) for South Africa over the period 1980 to 2006.
There are four bars for each year, i.e. each bar represents one financial quarter:
January to March, April to June etc.
The line represents the annual percentage change in the rate of inflation from 1982 to
2006.
1. In what year did GDP growth reach its lowest level? (1) 2. What is the highest rate of inflation since the turn of the century? (1) 3. Explain why there are two quarters „missing‟ in 1991 GDP graph. (1) 4. Describe what was happening to South Africa‟s GDP from the second half
of 1991 through until the middle of 1993. (2)
5. In a short paragraph, describe the differences in South Africa‟s GDP growth for the two periods 1980 to 1993 and 1994 to 2006. (6)
6. Identify and explain the relationship that exists between GDP growth and inflation over the period 1982 to 1992. (2)
7. Making specific reference to the period 2001 to 2006, explain why a very low rate of inflation is not beneficial for the general economy. (2) [15]
(c) Gauteng Department of Education, 2013
14
GAUTENG DEPARTMENT OF EDUCATION SENIOR SECONDARY INTERVENTION PROGRAMME
MATHEMATICAL LITERACY GRADE 12 SESSION 3 (TEACHER NOTES)
QUESTION 3: 10 minutes
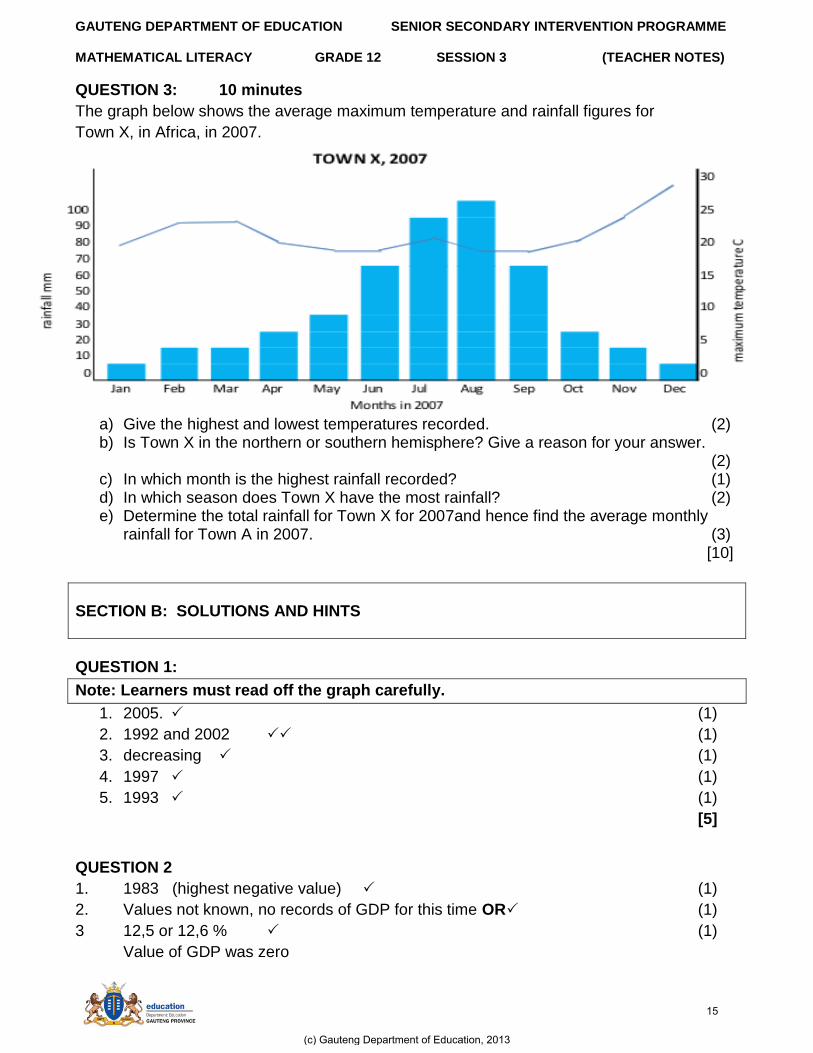
The graph below shows the average maximum temperature and rainfall figures for
Town X, in Africa, in 2007.
a) Give the highest and lowest temperatures recorded. (2) b) Is Town X in the northern or southern hemisphere? Give a reason for your answer.
(2) c) In which month is the highest rainfall recorded? (1) d) In which season does Town X have the most rainfall? (2) e) Determine the total rainfall for Town X for 2007and hence find the average monthly
rainfall for Town A in 2007. (3) [10]
SECTION B: SOLUTIONS AND HINTS
QUESTION 1:
Note: Learners must read off the graph carefully.
1. 2005. (1)
2. 1992 and 2002 (1)
3. decreasing (1)
4. 1997 (1)
5. 1993 (1)
[5]
QUESTION 2
1. 1983 (highest negative value) (1)
2. Values not known, no records of GDP for this time OR (1)
3 12,5 or 12,6 % (1)
Value of GDP was zero
(c) Gauteng Department of Education, 2013
15
GAUTENG DEPARTMENT OF EDUCATION SENIOR SECONDARY INTERVENTION PROGRAMME
MATHEMATICAL LITERACY GRADE 12 SESSION 3 (TEACHER NOTES)
4. There was negative growth in GDP i.e. the GDP decreased steadily during this
period to approx -2,6 % in first quarter of 1993 and then took a turn to end up at
zero growth in middle of 1993. (2)
5. 1980-93 Growth fluctuated - upwards followed by downwards, periods of
negative growth 1994 -2006 All positive growth, general upwards trend
possible reason end of apartheid and sanction against SA) (6)
6. As inflation increases, GDP growth decreases - As prices increase, less is
spent and GDP growth decreases. (2)
7. During this period, inflation was low in comparison to earlier and as it dropped
so did GDP growth. As it increased so did GDP growth. (2)
[15]
QUESTION 3
a) Highest temp – 29 degrees C, lowest temp 18 degrees C (2) b) Southern H, close to the equator. Temperatures are hot. (2)
c) August (1)
d) Winter (2)
e) ) 5 + 15 + 14 + 25 + 35 + 62 + 98 + 105 + 62 +22 + 12 + 5 (1M for adding all the
temperatures)
12 (1M for dividing by 12)
= 460
12
= 38,33 (3)
[10]
SECTION C: HOMEWORK
QUESTION 1
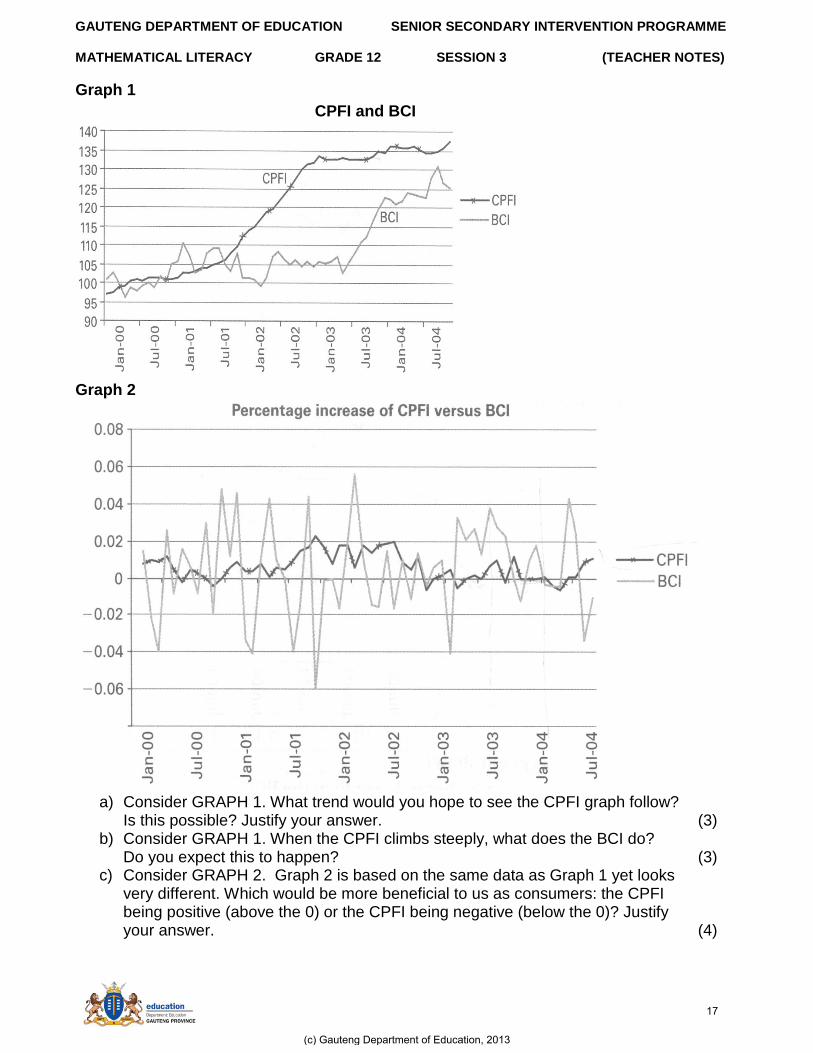
The CPFI (Consumer Price Food Index) is a measure of the inflation rate of our country.
The BCI (Business Confidence Indicator) is a measure of the level of confidence that
businesses (both local and foreign) have in the economy of our country.
Local businesses need to feel confident about our country‟s economy if they are to spend
money on expansion (growing bigger).
Foreign businesses also need to feel confident about our country‟s economy if they are to
invest their money in our country. They will only do so if they feel that our country‟s economy
is healthy and growing. If not, they would rather invest their money elsewhere.
(c) Gauteng Department of Education, 2013
16
GAUTENG DEPARTMENT OF EDUCATION SENIOR SECONDARY INTERVENTION PROGRAMME
MATHEMATICAL LITERACY GRADE 12 SESSION 3 (TEACHER NOTES)
Graph 1
CPFI and BCI
Graph 2
a) Consider GRAPH 1. What trend would you hope to see the CPFI graph follow? Is this possible? Justify your answer. (3) b) Consider GRAPH 1. When the CPFI climbs steeply, what does the BCI do? Do you expect this to happen? (3) c) Consider GRAPH 2. Graph 2 is based on the same data as Graph 1 yet looks very different. Which would be more beneficial to us as consumers: the CPFI being positive (above the 0) or the CPFI being negative (below the 0)? Justify your answer. (4)
(c) Gauteng Department of Education, 2013
17
GAUTENG DEPARTMENT OF EDUCATION SENIOR SECONDARY INTERVENTION PROGRAMME
MATHEMATICAL LITERACY GRADE 12 SESSION 3 (TEACHER NOTES)
d) A foreign business is considering investing in our country, but he needs some convincing. Use, and refer to each of the graphs, to discuss how you would convince foreign investors to invest in South Africa. (4)
[14]
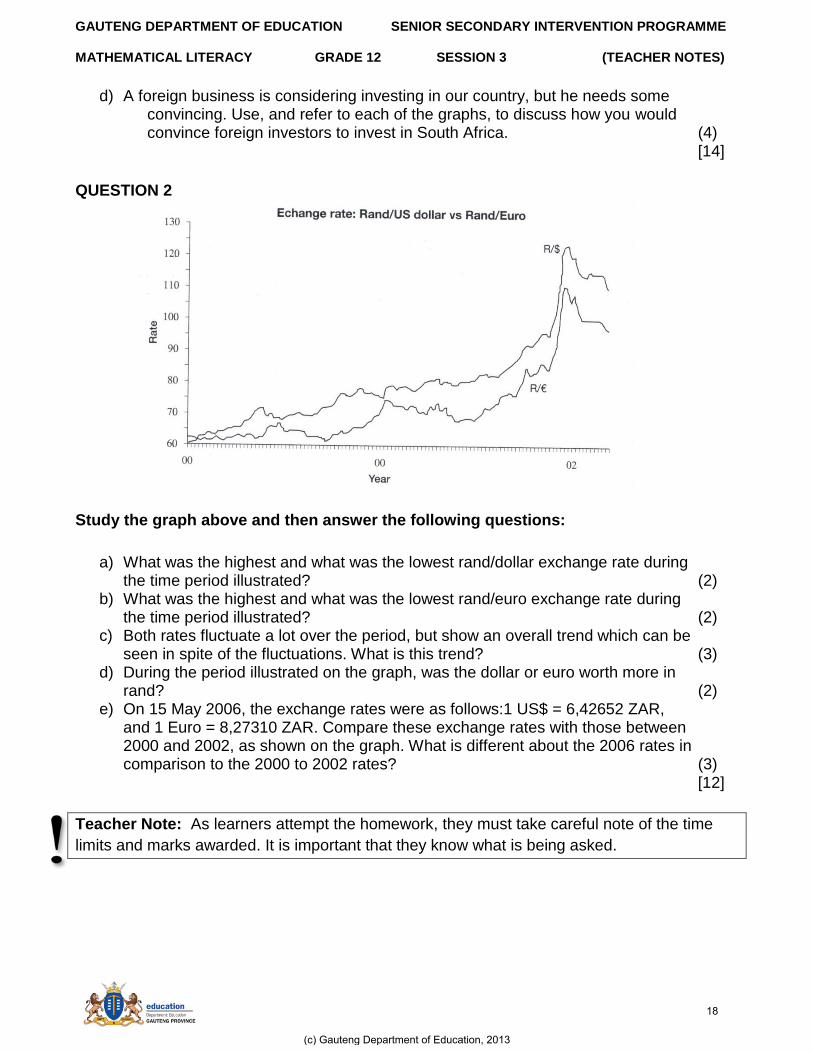
QUESTION 2
Study the graph above and then answer the following questions:
a) What was the highest and what was the lowest rand/dollar exchange rate during the time period illustrated? (2) b) What was the highest and what was the lowest rand/euro exchange rate during the time period illustrated? (2) c) Both rates fluctuate a lot over the period, but show an overall trend which can be seen in spite of the fluctuations. What is this trend? (3) d) During the period illustrated on the graph, was the dollar or euro worth more in rand? (2) e) On 15 May 2006, the exchange rates were as follows:1 US$ = 6,42652 ZAR, and 1 Euro = 8,27310 ZAR. Compare these exchange rates with those between 2000 and 2002, as shown on the graph. What is different about the 2006 rates in comparison to the 2000 to 2002 rates? (3)
[12]
Teacher Note: As learners attempt the homework, they must take careful note of the time
limits and marks awarded. It is important that they know what is being asked.
(c) Gauteng Department of Education, 2013
18
GAUTENG DEPARTMENT OF EDUCATION SENIOR SECONDARY INTERVENTION PROGRAMME
MATHEMATICAL LITERACY GRADE 12 SESSION 3 (TEACHER NOTES)
QUESTION 1
a) Trend – CPFI be low and remain low Is possible if food prices remain low. (3)
b) BCI increases as the CPFI increases. Expect this to happen because it shows that the economy is growing (3)
c) The CPFI would be beneficial if it was above the line as this shows that the economy is growing and businesses would invest (4) d) Graph 1 – Since Jan „03, CPFI has stabilised and BCI has grown steadily. That trend is likely to continue Graph 2 – Whenever the graph shows that there is a positive increase in CPFI, foreign investment increases rapidly. The graph tends towards the positive towards the end. (4)
[14]
QUESTION 2 a) Highest R125 / dollar
Lowest R62 / dollar (2) b) Highest R111 / euro
Lowest R60 / euro (2)
c) Both exchange rates increase gradually. There was a rapid increase at end of 2001 with a peak in 2002. There after the exchange rates decrease. (3)
d) In 2001, 2002 a person was receiving more rands per dollar than rand per euro and in 2006 a person is receiving more rands per euro than rands per dollar. (2) e) Both rates are substantially less in 2006, which means that the rand has become
stronger. (3) [12]
SECTION D: SOLUTIONS TO HOMEWORK
(c) Gauteng Department of Education, 2013
19
GAUTENG DEPARTMENT OF EDUCATION SENIOR SECONDARY INTERVENTION PROGRAMME MATHEMATICAL LITERACY GRADE 12 SESSION 4 (TEACHER NOTES)
SESSION 4: TOPIC 1: GRIDS, MAPS AND THE COMPASS - LOCATION AND RELATIVE
POSITION
Teacher Note: Make sure learners know and understand how to (a) use grids to locate places (b) read and use maps (c) use a compass to determine bearing and direction. Make sure learners know how to use a grid, map and / or compass to locate and describe the relative position of a place.
LESSON OVERVIEW
1. Introduce session: 5 minutes 2. Typical exam questions: 55 minutes 3. Review/solutions/memo: 30 minutes
SECTION A: TYPICAL EXAM QUESTIONS
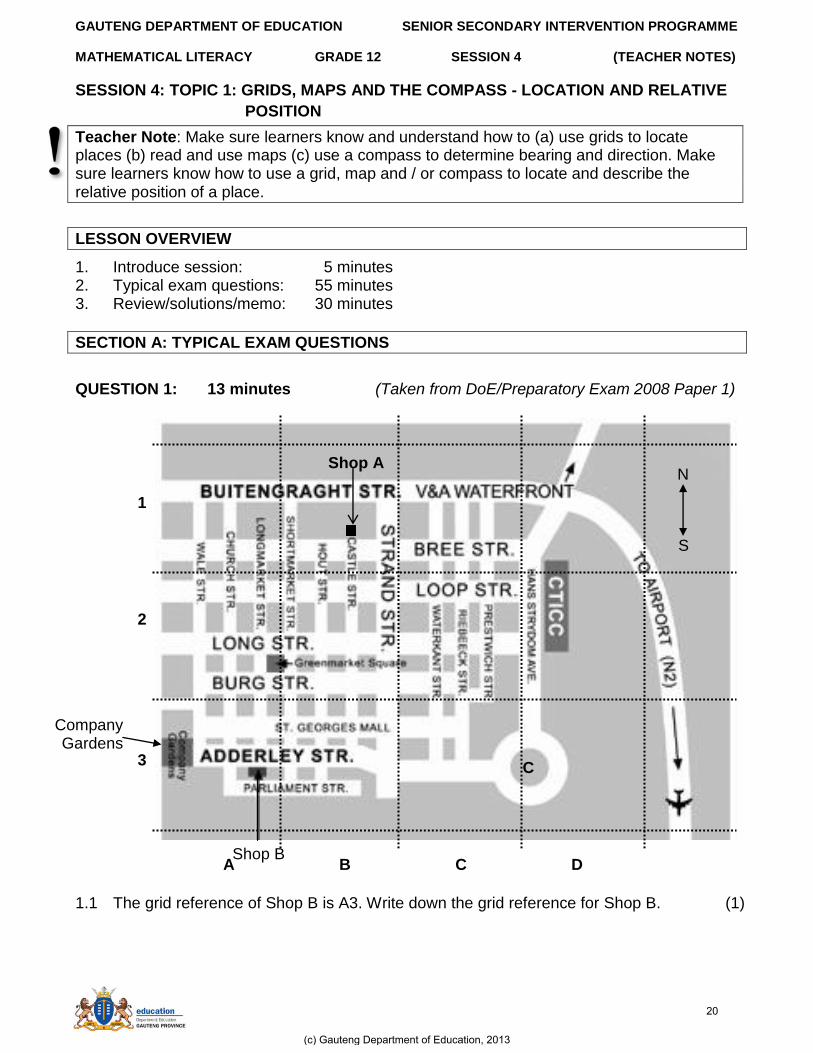
QUESTION 1: 13 minutes (Taken from DoE/Preparatory Exam 2008 Paper 1) 1.1 The grid reference of Shop B is A3. Write down the grid reference for Shop B. (1)
Shop B
Shop A
1
2
3
A B C D
N
S
Company Gardens
C
(c) Gauteng Department of Education, 2013
20
GAUTENG DEPARTMENT OF EDUCATION SENIOR SECONDARY INTERVENTION PROGRAMME MATHEMATICAL LITERACY GRADE 12 SESSION 4 (TEACHER NOTES)
1.2 If a truck drives from Shop B in a northerly direction in Longmarket Street 1.2.1 In which street should the truck turn east in order to reach Shop A? (2)
1.2.2 The scale of the map is 1 : 70 000. Calculate the distance, in km, the truck travels from Shop A to Shop B as described above. (3)
1.3 In which direction should one travel from Shop B in order to reach the Company Gardens (grid reference A3)? (1)
1.4 Peter walks in a northerly direction from Shop B. At Burg Street he turns right and continues in an easterly direction until he reaches Prestwich Street. At Prestwich Street he turns and continues his journey in a northerly direction. He crosses one road and at the second road he turns right. He continues to the end of this road and reaches his destination straight ahead. What is his destination? (2)
In what direction would you have to travel from the V&A Waterfront to get to the airport?(2)
1.5 Complete the following : „The traffic circle (marked C on the map) lies ______________ of Shop A on a bearing of ______________ (4)
[15]
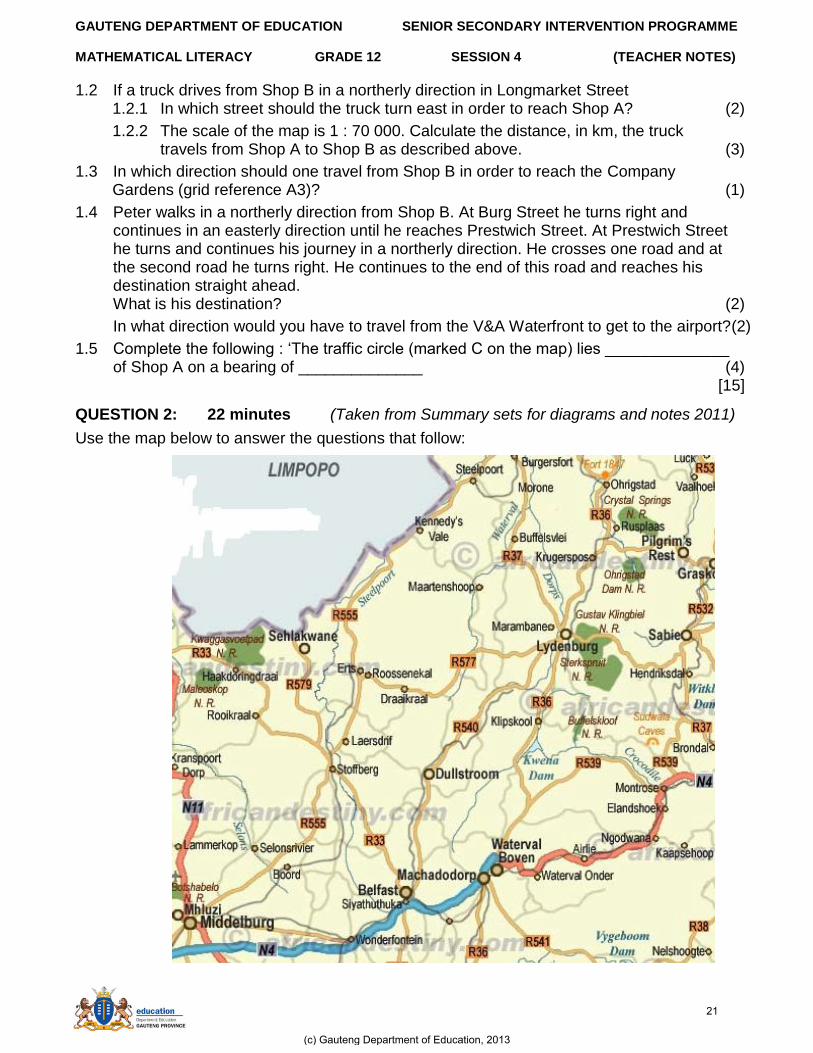
QUESTION 2: 22 minutes (Taken from Summary sets for diagrams and notes 2011)
Use the map below to answer the questions that follow:
(c) Gauteng Department of Education, 2013
21
GAUTENG DEPARTMENT OF EDUCATION SENIOR SECONDARY INTERVENTION PROGRAMME MATHEMATICAL LITERACY GRADE 12 SESSION 4 (TEACHER NOTES)
2.1 Estimate the direction of the following towns in relation to Machadodorp: 2.1.1 Middelburg (2) 2.1.2 Lydenburg (2) 2.1.3 Draaikraal (2) 2.1.4 Waterval Onder (2)
2.2 Determine the bearing of the following towns from Machadorp: 2.2.1 Middelburg (2) 2.2.2 Lydenburg (2) 2.2.3 Draaikraal (2) 2.2.4 Waterval Onder (2) 2.2.5 Identify the two main roads / highways on this map. (2)
2.3 Which towns, travelling on the R540 in a northerly direction, do you pass through on the way to Lydenburg? (2)
2.3.1 Which province lies north of Middelburg? (2)
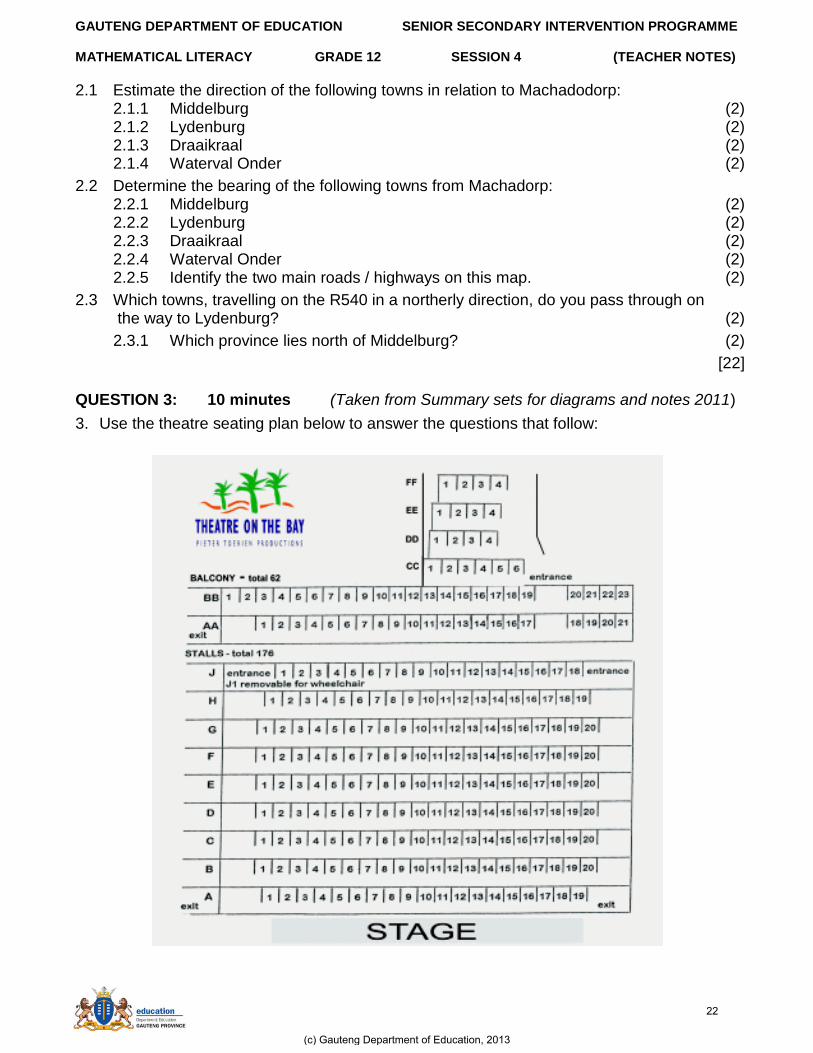
[22] QUESTION 3: 10 minutes (Taken from Summary sets for diagrams and notes 2011)
3. Use the theatre seating plan below to answer the questions that follow:
(c) Gauteng Department of Education, 2013
22
GAUTENG DEPARTMENT OF EDUCATION SENIOR SECONDARY INTERVENTION PROGRAMME MATHEMATICAL LITERACY GRADE 12 SESSION 4 (TEACHER NOTES)
3.1. Without counting, determine the number of seats in the theatre. Show your working out. (3)
3.2. How does the seating plan differentiate between the seats on the balcony and the seats in the stalls? (2)
3.3. The stalls are downstairs whilst the balcony is upstairs. Which seats in the stalls do you think are the most expensive? Why do you say so? (2) 3.4. If you are in a wheelchair, which „seat‟ (you will be sitting in your wheelchair) will you be sitting in? (1) 3.5. Why do you think the balcony only has one exit while the stalls have two? (2) 3.6. How many seats do the majority of the rows in the stalls have? (1)
[11]
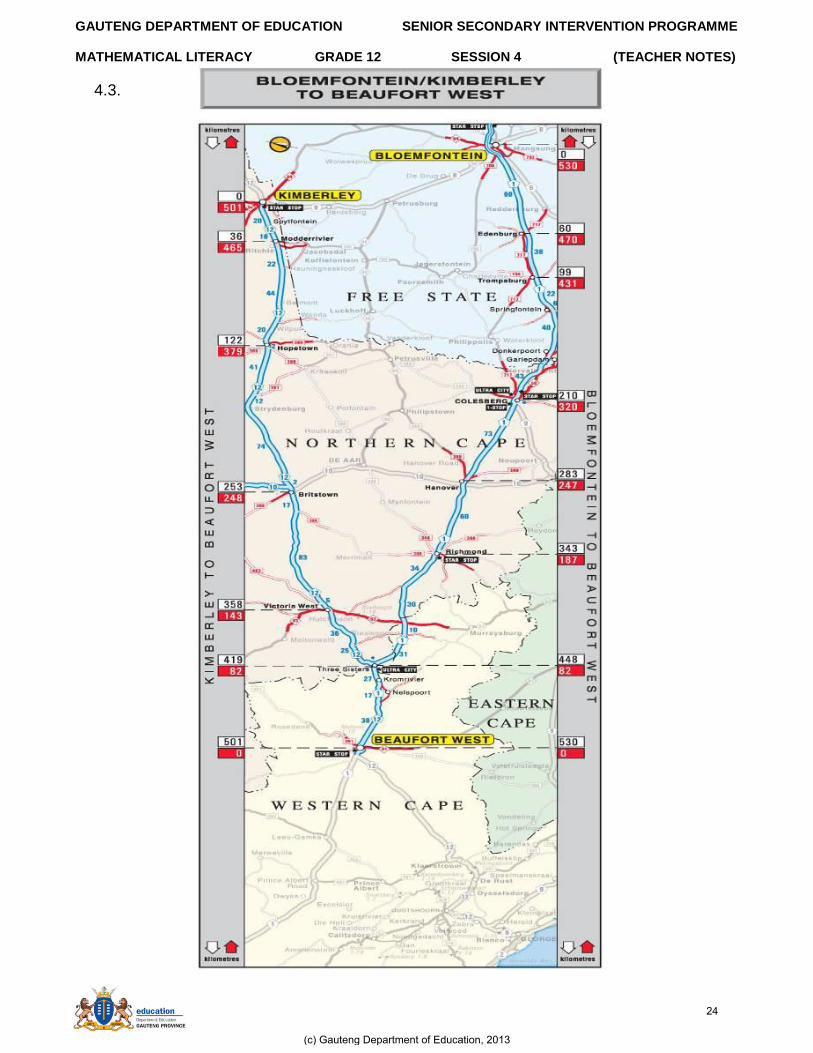
QUESTION 4: 10 minutes (Taken from Summary sets for diagrams and notes 2011)
4. Consider the route map shown on the next page. This map, found on the AA website (www.aa.co.za), shows the route that can be travelled between Bloemfontein and
Beaufort West, or between Kimberley and Beaufort West.
4.1. If one were to follow the route provided by the AA, then determine: 4.1.1. the distance between Bloemfontein and Colesberg. (2) 4.1.2. the distance between Three Sisters and Victoria West. (2) 4.1.3. the provinces one would travel in when going from Bloemfontein to Beaufort West. (3)
4.2. When asked the distance between Kimberley and Bloemfontein, Thiresha said it was 29km. Explain how she obtained her answer. Is she correct? (3)
[10]
(c) Gauteng Department of Education, 2013
23
GAUTENG DEPARTMENT OF EDUCATION SENIOR SECONDARY INTERVENTION PROGRAMME MATHEMATICAL LITERACY GRADE 12 SESSION 4 (TEACHER NOTES)
4.3.
(c) Gauteng Department of Education, 2013
24
GAUTENG DEPARTMENT OF EDUCATION SENIOR SECONDARY INTERVENTION PROGRAMME MATHEMATICAL LITERACY GRADE 12 SESSION 4 (TEACHER NOTES)
SECTION B: SOLUTIONS AND HINTS TO SECTION A
QUESTION 1: 13 minutes (Taken from DoE/Preparatory Exam 2008 Paper 1)
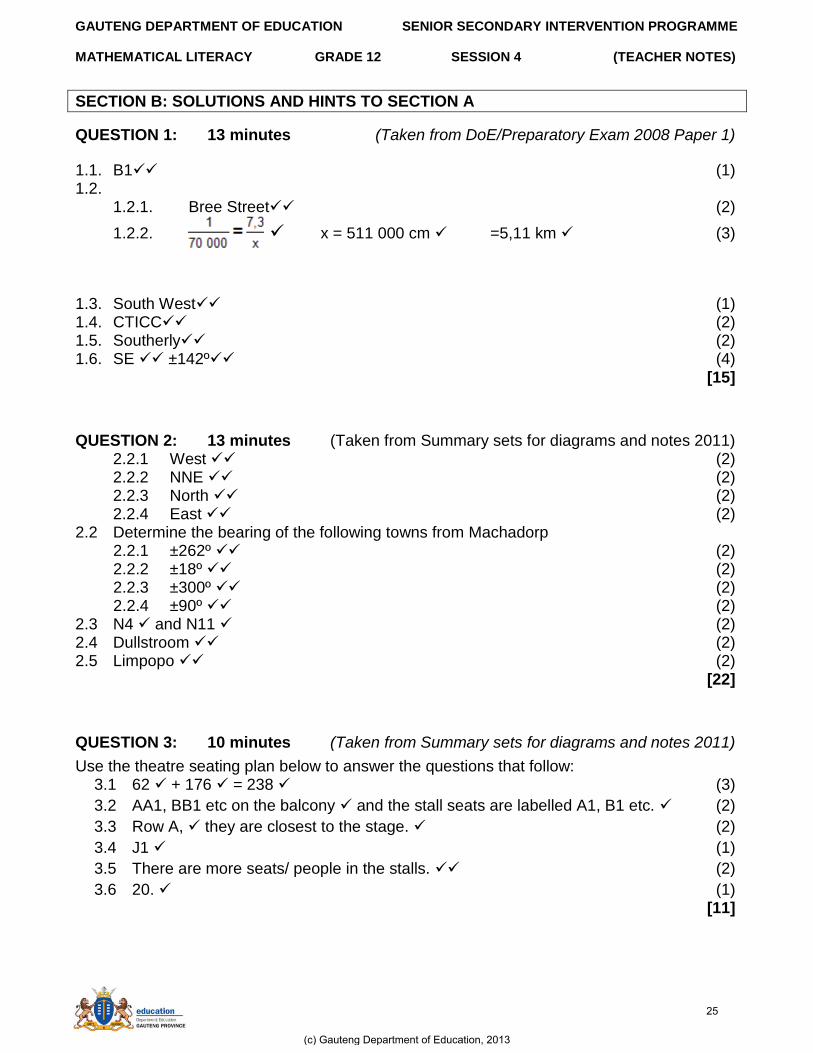
1.1. B1 (1) 1.2.
1.2.1. Bree Street (2)
1.2.2. x = 511 000 cm =5,11 km (3)
1.3. South West (1) 1.4. CTICC (2) 1.5. Southerly (2) 1.6. SE ±142º (4) [15]
QUESTION 2: 13 minutes (Taken from Summary sets for diagrams and notes 2011) 2.2.1 West (2) 2.2.2 NNE (2) 2.2.3 North (2) 2.2.4 East (2)
2.2 Determine the bearing of the following towns from Machadorp 2.2.1 ±262º (2) 2.2.2 ±18º (2) 2.2.3 ±300º (2) 2.2.4 ±90º (2)
2.3 N4 and N11 (2) 2.4 Dullstroom (2) 2.5 Limpopo (2) [22]
QUESTION 3: 10 minutes (Taken from Summary sets for diagrams and notes 2011)
Use the theatre seating plan below to answer the questions that follow: 3.1 62 + 176 = 238 (3)
3.2 AA1, BB1 etc on the balcony and the stall seats are labelled A1, B1 etc. (2)
3.3 Row A, they are closest to the stage. (2)
3.4 J1 (1)
3.5 There are more seats/ people in the stalls. (2)
3.6 20. (1) [11]
(c) Gauteng Department of Education, 2013
25
GAUTENG DEPARTMENT OF EDUCATION SENIOR SECONDARY INTERVENTION PROGRAMME MATHEMATICAL LITERACY GRADE 12 SESSION 4 (TEACHER NOTES)
QUESTION 4: 10 minutes (Taken from Summary sets for diagrams and notes 2011) 4.1.1 210 km (2) 4.1.2 105 km (2) 4.1.3 Western Cape, Northern Cape and Free State. (3) 4.1.4 She took the readings from the bars on the right hand side and left hand side and
subtracted them. 530 – 501 = 29. She is not correct as these bars show vertical distances and not horizontal distances (3)
[10]
SECTION C: HOMEWORK
QUESTION 1: 20 minutes (Taken from DoE Feb Exam 2009 Paper 2)
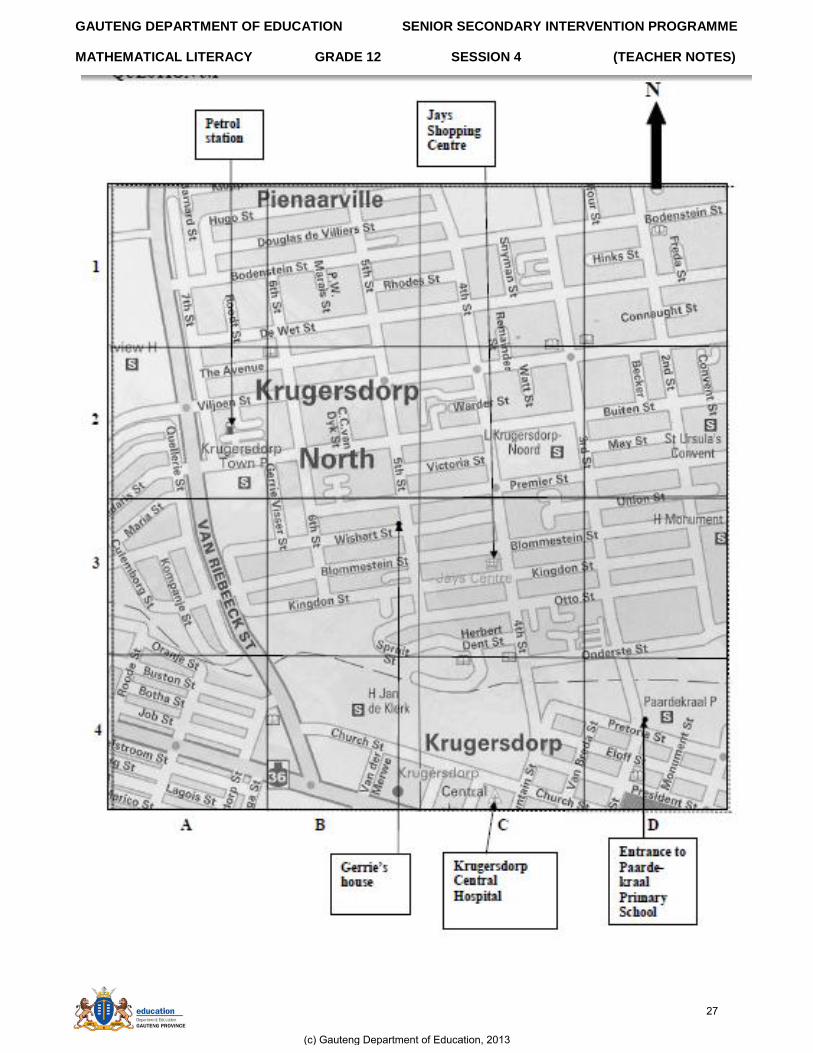
1.1. On the next page is the map of part of Krugersdorp. Use it to answer the questions that follow.
(c) Gauteng Department of Education, 2013
26
GAUTENG DEPARTMENT OF EDUCATION SENIOR SECONDARY INTERVENTION PROGRAMME MATHEMATICAL LITERACY GRADE 12 SESSION 4 (TEACHER NOTES)
(c) Gauteng Department of Education, 2013
27
GAUTENG DEPARTMENT OF EDUCATION SENIOR SECONDARY INTERVENTION PROGRAMME MATHEMATICAL LITERACY GRADE 12 SESSION 4 (TEACHER NOTES)
1.1.1. Give a grid reference for the Jays Shopping Centre where Gerrie and his mother do their weekly grocery shopping. (2) 1.1.2. Gerrie's grandmother lives with them and goes to the hospital for her medication once a month.
a) What is the relative position of Krugersdorp Central Hospital with respect to Gerrie's home? (2)
b) What is the bearing of the hospital from Gerrie‟s home? (2) 1.1.3. Gerrie's father drives from Jays Shopping Centre to the petrol station to buy
petrol for his car. Describe his route if the exit from Jays Shopping Centre is in 4th
Street. (3) 1.1.4. Every morning at 07:00, Gerrie takes the following route from home:
Crossing 5th
Street and walking in an easterly direction along Wishart Street until he reaches the T-Junction.
He turns right and walks in a southerly direction along 4th
Street
He turns left and walks in an easterly direction along Onderste Street until he reaches 3rd Street.
He turns right and walks in a southerly direction.
He reaches his destination on the corner of 3rd Street and Pretoria Street. a) Where does Gerrie go? (2) b) How old do you think he is? Give a reason for your answer. (2)
1.1.5. The school's entrance is on the corner of 3rd
Street and Pretoria Street. a) Measure the total walking distance on the map between Gerrie's house
and the Paardekraal Primary School in centimetres. (3) b) Use the scale 1:11 000 to calculate the actual distance Gerrie walks to
school. Give your answer in kilometres. (4) [20]
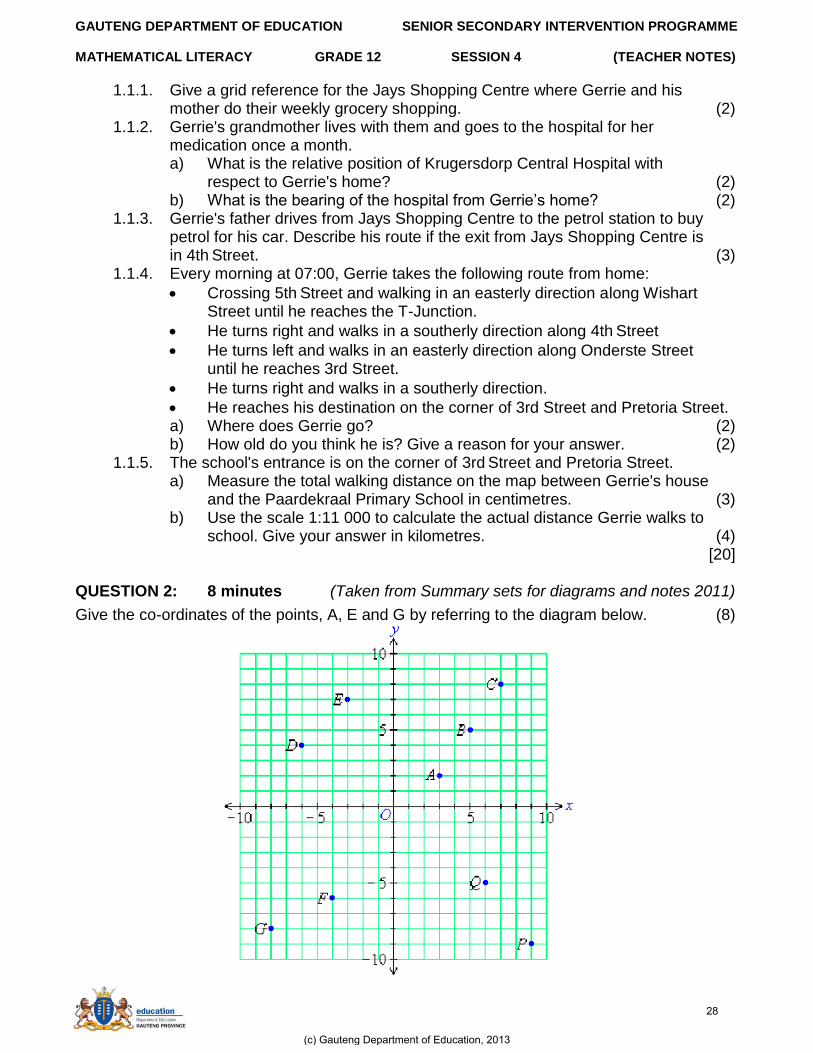
QUESTION 2: 8 minutes (Taken from Summary sets for diagrams and notes 2011)
Give the co-ordinates of the points, A, E and G by referring to the diagram below. (8)
(c) Gauteng Department of Education, 2013
28
GAUTENG DEPARTMENT OF EDUCATION SENIOR SECONDARY INTERVENTION PROGRAMME MATHEMATICAL LITERACY GRADE 12 SESSION 4 (TEACHER NOTES)
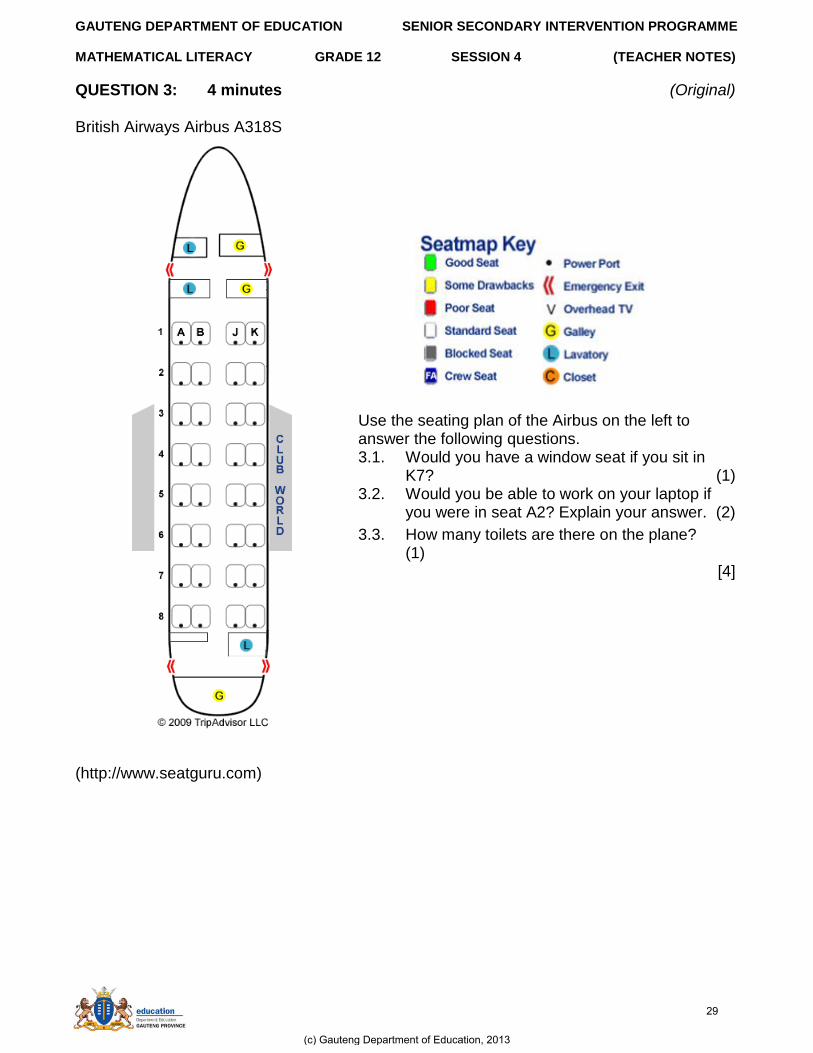
QUESTION 3: 4 minutes (Original) British Airways Airbus A318S
Use the seating plan of the Airbus on the left to answer the following questions. 3.1. Would you have a window seat if you sit in
K7? (1) 3.2. Would you be able to work on your laptop if
you were in seat A2? Explain your answer. (2)
3.3. How many toilets are there on the plane? (1)
[4]
(http://www.seatguru.com)
(c) Gauteng Department of Education, 2013
29
GAUTENG DEPARTMENT OF EDUCATION SENIOR SECONDARY INTERVENTION PROGRAMME MATHEMATICAL LITERACY GRADE 12 SESSION 4 (TEACHER NOTES)
SECTION D: SOLUTIONS TO HOMEWORK
QUESTION 1: 32 minutes (Taken from DoE/Preparatory Exam 2008 Paper 1)
1.1. C3 (2) 1.2. (a) South East (2)
(b) 160º (2)
1.3. Turn left into 4th
Street. Turn left into Buiten Street. After passing Gerrie Visser Street, turn right into the next street. You will see the petrol station ahead of you. (3)
OR
Turn left into 4th
Street Turn left into Wishart Street Turn right into Gerrie Visser Street Turn left into Buiten Street At the next street turn right. You will see the petrol station ahead of you. (3)
OR
Turn in a northerly direction along 4th
Street. Turn in a westerly direction along Buiten Street. After passing Gerrie Visser Street, turn in a northerly direction into the next street you come to. You will see the petrol station ahead of you. (3)
1.4. (a) Paardekraal Primary School. (2) (b) Between 6 and 14 because he is at primary school. (2)
1.5. The school's entrance is on the corner of 3rd
Street and Pretoria Street. a) Measure the total walking distance on the map between Gerrie's house and the
Paardekraal Primary School in centimetres. (3) b) Use the scale 1:11 000 to calculate the actual distance Gerrie walks to school.
Give your answer in kilometres. (4) [20]
QUESTION 2: 8 minutes (Taken from Summary sets for diagrams and notes 2011)
A = ( 3 ; 2 ) E = ( -3 ; 7 ) G = ( -8 ; -8 ) Q = ( 6 ; -5 ) (8)
[8]
QUESTION 3: 4 minutes (Original)
Use the seating plan of the Airbus on the left to answer the following questions.
3.4. Yes. (1)
3.5. Yes, each seat has a power port. (2)
3.6. 3 (1)
[4]
(c) Gauteng Department of Education, 2013
30
GAUTENG DEPARTMENT OF EDUCATION SENIOR SECONDARY INTERVENTION PROGRAMME MATHEMATICAL LITERACY GRADE 12 SESSION 4 (TEACHER NOTES)
SESSION 5: TOPIC 2: USE AND INTERPRET SCALE DRAWINGS. BUILD SCALE MODELS
Teacher Note: Make sure learners know and understand how to (a) determine the scale of a diagram or map if the dimensions are given (b) use scale to find dimensions in reality and on paper (c) use scale to build models
LESSON OVERVIEW
1. Introduce session: 5 minutes 2. Typical exam questions: 10 minutes 3. Building a model in groups: 45 minutes 4. Review/solutions/memo: 30 minutes
SECTION A: TYPICAL EXAM QUESTIONS
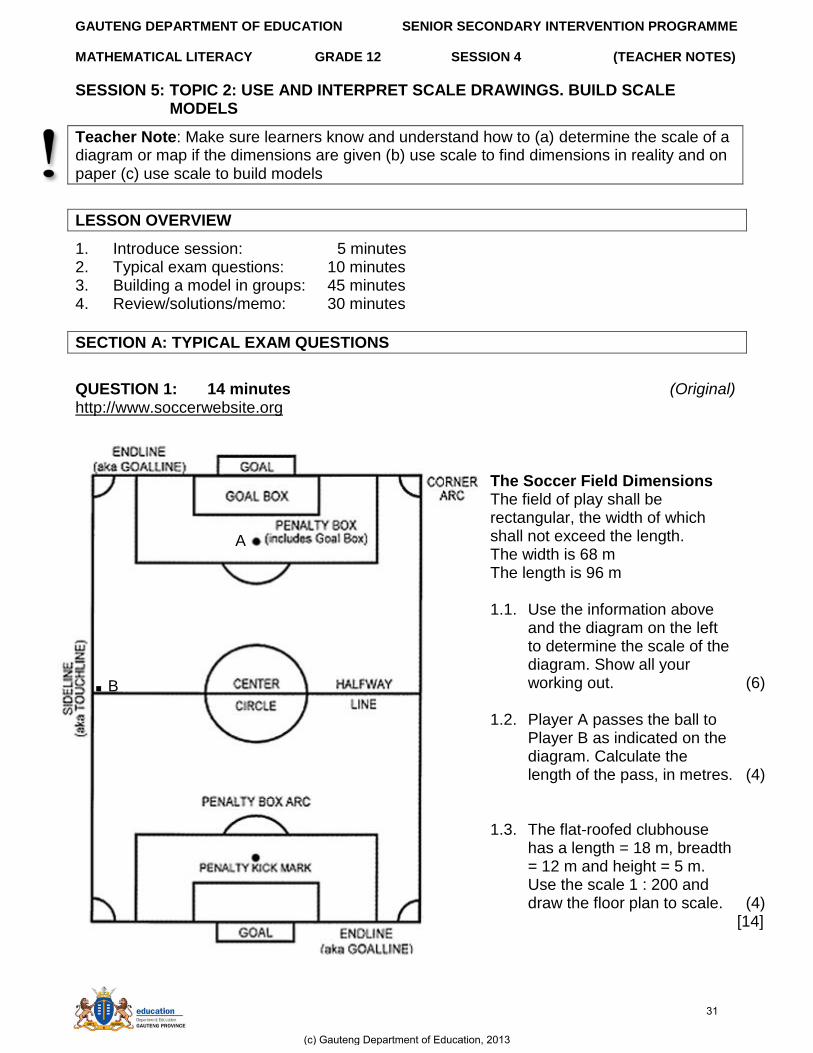
QUESTION 1: 14 minutes (Original) http://www.soccerwebsite.org
The Soccer Field Dimensions The field of play shall be rectangular, the width of which shall not exceed the length. The width is 68 m The length is 96 m 1.1. Use the information above
and the diagram on the left to determine the scale of the diagram. Show all your working out. (6)
1.2. Player A passes the ball to
Player B as indicated on the diagram. Calculate the length of the pass, in metres. (4)
1.3. The flat-roofed clubhouse
has a length = 18 m, breadth = 12 m and height = 5 m. Use the scale 1 : 200 and draw the floor plan to scale. (4)
[14]
A
. B
(c) Gauteng Department of Education, 2013
31
GAUTENG DEPARTMENT OF EDUCATION SENIOR SECONDARY INTERVENTION PROGRAMME MATHEMATICAL LITERACY GRADE 12 SESSION 4 (TEACHER NOTES)
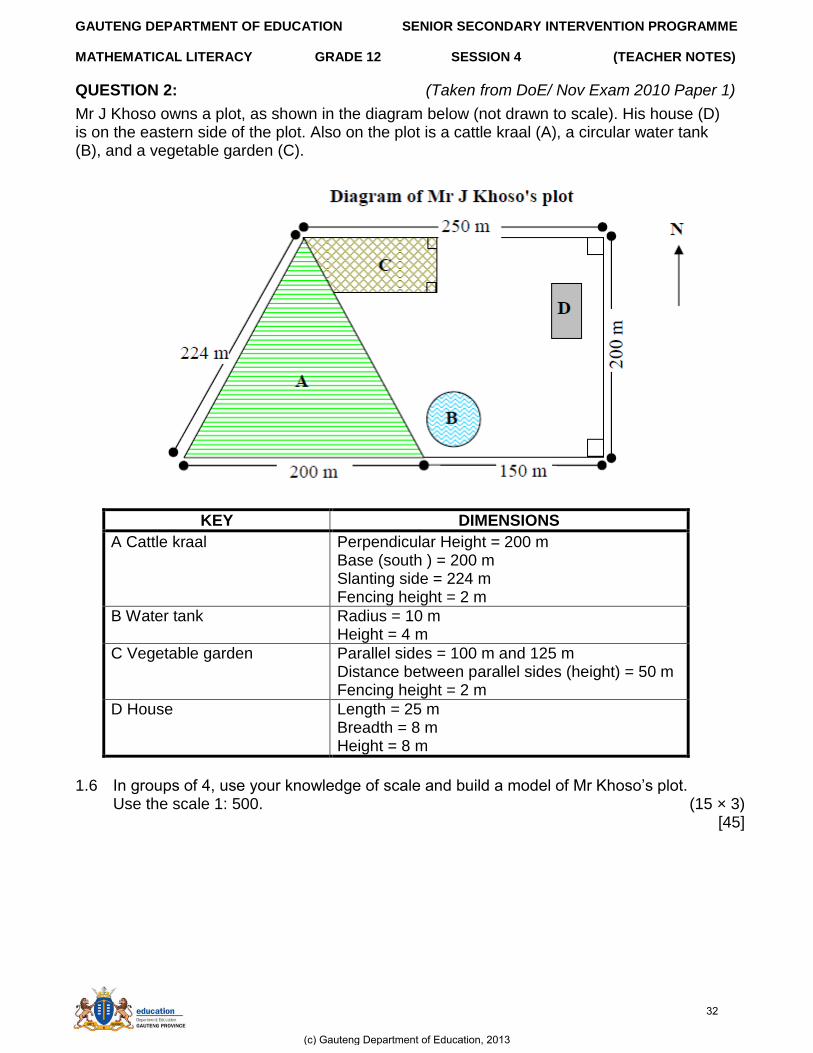
QUESTION 2: (Taken from DoE/ Nov Exam 2010 Paper 1)
Mr J Khoso owns a plot, as shown in the diagram below (not drawn to scale). His house (D) is on the eastern side of the plot. Also on the plot is a cattle kraal (A), a circular water tank (B), and a vegetable garden (C).
KEY DIMENSIONS
A Cattle kraal Perpendicular Height = 200 m Base (south ) = 200 m Slanting side = 224 m Fencing height = 2 m
B Water tank Radius = 10 m Height = 4 m
C Vegetable garden Parallel sides = 100 m and 125 m Distance between parallel sides (height) = 50 m Fencing height = 2 m
D House Length = 25 m Breadth = 8 m Height = 8 m
1.6 In groups of 4, use your knowledge of scale and build a model of Mr Khoso‟s plot.
Use the scale 1: 500. (15 × 3) [45]
(c) Gauteng Department of Education, 2013
32
GAUTENG DEPARTMENT OF EDUCATION SENIOR SECONDARY INTERVENTION PROGRAMME MATHEMATICAL LITERACY GRADE 12 SESSION 4 (TEACHER NOTES)
SECTION B: SOLUTIONS AND HINTS TO SECTION A
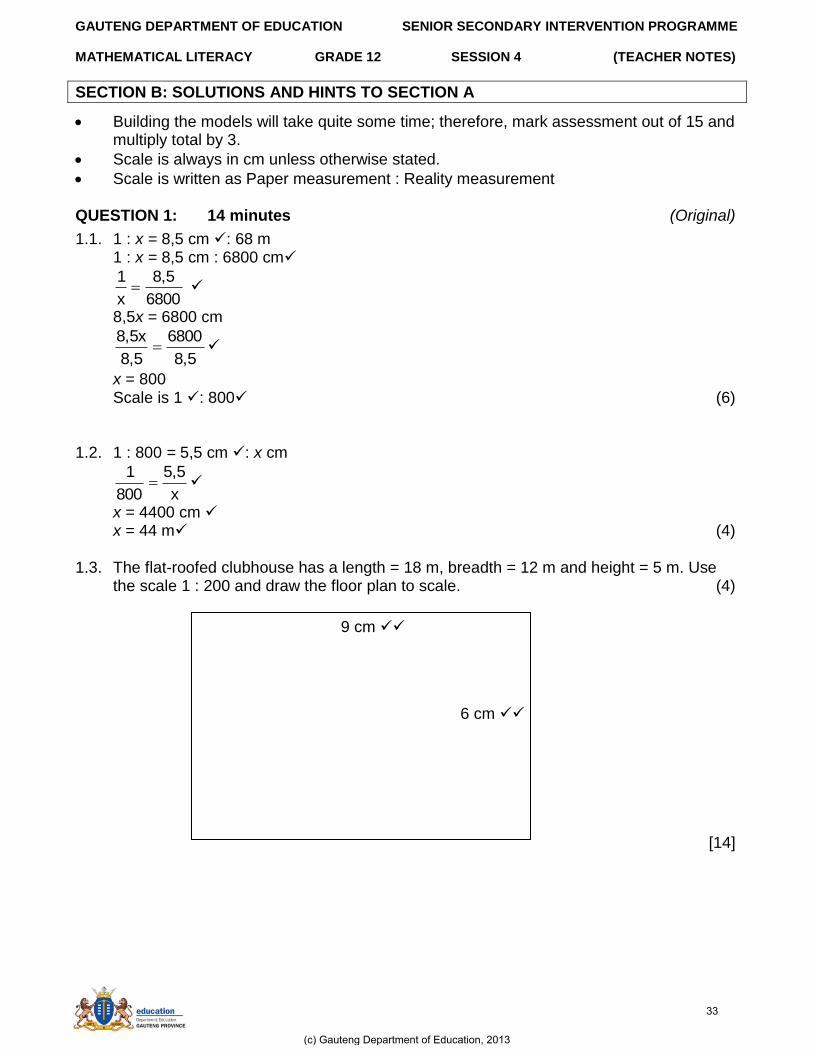
Building the models will take quite some time; therefore, mark assessment out of 15 and multiply total by 3.
Scale is always in cm unless otherwise stated.
Scale is written as Paper measurement : Reality measurement QUESTION 1: 14 minutes (Original)
1.1. 1 : x = 8,5 cm : 68 m 1 : x = 8,5 cm : 6800 cm
6800
8,5
x
1
8,5x = 6800 cm
8,5
6800
8,5
8,5x
x = 800 Scale is 1 : 800 (6)
1.2. 1 : 800 = 5,5 cm : x cm
x
5,5
800
1
x = 4400 cm x = 44 m (4)
1.3. The flat-roofed clubhouse has a length = 18 m, breadth = 12 m and height = 5 m. Use the scale 1 : 200 and draw the floor plan to scale. (4)
[14]
9 cm
6 cm
(c) Gauteng Department of Education, 2013
33
GAUTENG DEPARTMENT OF EDUCATION SENIOR SECONDARY INTERVENTION PROGRAMME MATHEMATICAL LITERACY GRADE 12 SESSION 4 (TEACHER NOTES)
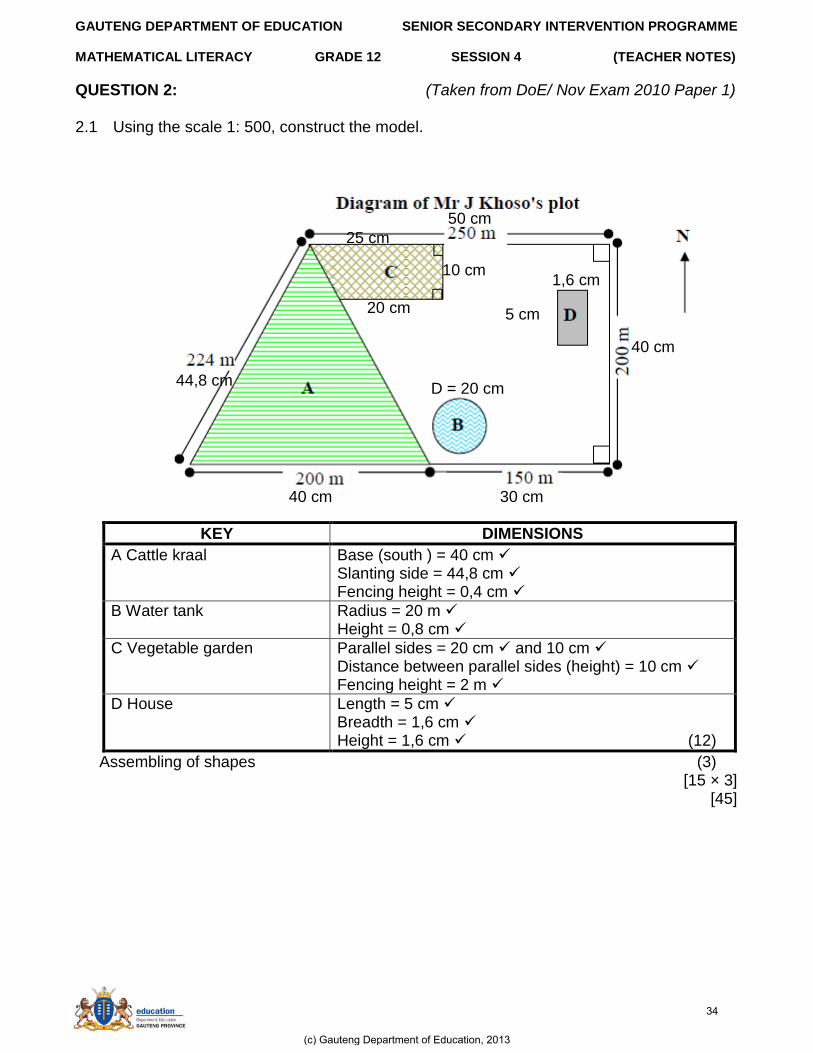
QUESTION 2: (Taken from DoE/ Nov Exam 2010 Paper 1)
2.1 Using the scale 1: 500, construct the model.
KEY DIMENSIONS
A Cattle kraal Base (south ) = 40 cm Slanting side = 44,8 cm Fencing height = 0,4 cm
B Water tank Radius = 20 m Height = 0,8 cm
C Vegetable garden Parallel sides = 20 cm and 10 cm Distance between parallel sides (height) = 10 cm Fencing height = 2 m
D House Length = 5 cm Breadth = 1,6 cm Height = 1,6 cm (12)
Assembling of shapes (3) [15 × 3] [45]
50 cm
44,8 cm
40 cm 30 cm
40 cm
25 cm
D = 20 cm
5 cm
1,6 cm 10 cm
20 cm
(c) Gauteng Department of Education, 2013
34
GAUTENG DEPARTMENT OF EDUCATION SENIOR SECONDARY INTERVENTION PROGRAMME MATHEMATICAL LITERACY GRADE 12 SESSION 4 (TEACHER NOTES)
SECTION C: HOMEWORK
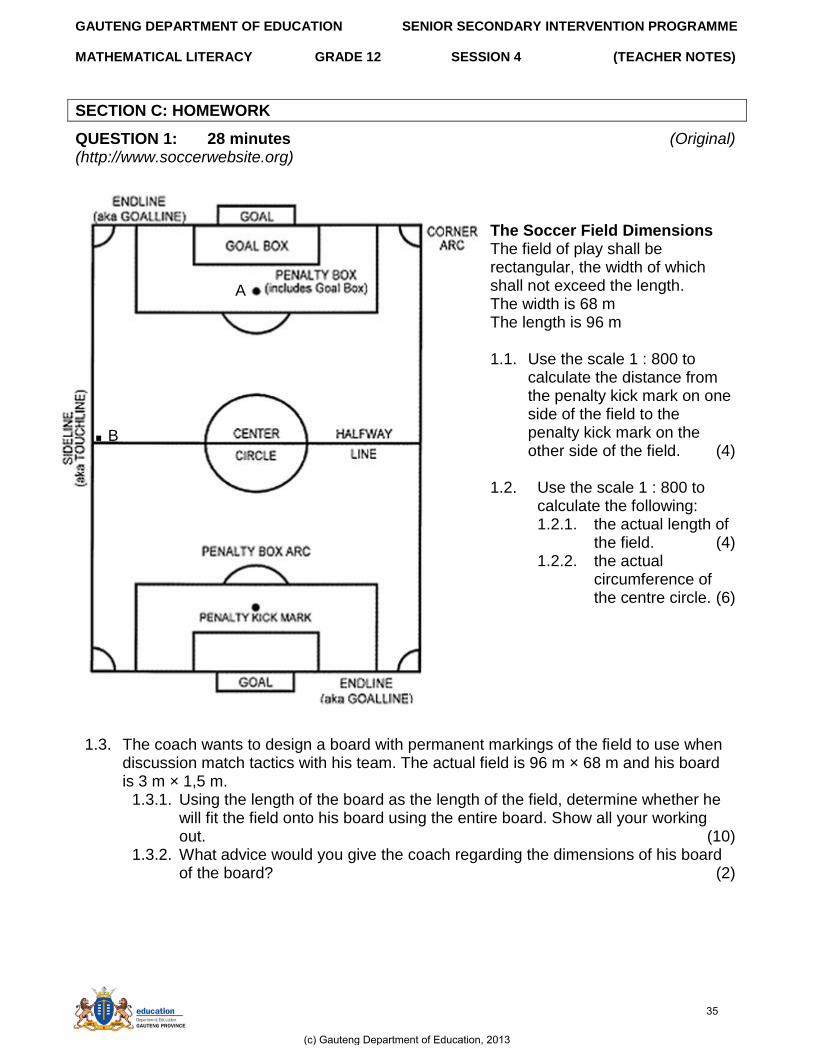
QUESTION 1: 28 minutes (Original) (http://www.soccerwebsite.org)
The Soccer Field Dimensions The field of play shall be rectangular, the width of which shall not exceed the length. The width is 68 m The length is 96 m 1.1. Use the scale 1 : 800 to
calculate the distance from the penalty kick mark on one side of the field to the penalty kick mark on the other side of the field. (4)
1.2. Use the scale 1 : 800 to
calculate the following: 1.2.1. the actual length of
the field. (4) 1.2.2. the actual
circumference of the centre circle. (6)
1.3. The coach wants to design a board with permanent markings of the field to use when discussion match tactics with his team. The actual field is 96 m × 68 m and his board is 3 m × 1,5 m.
1.3.1. Using the length of the board as the length of the field, determine whether he will fit the field onto his board using the entire board. Show all your working out. (10)
1.3.2. What advice would you give the coach regarding the dimensions of his board of the board? (2)
A
. B
(c) Gauteng Department of Education, 2013
35

GAUTENG DEPARTMENT OF EDUCATION SENIOR SECONDARY INTERVENTION PROGRAMME MATHEMATICAL LITERACY GRADE 12 SESSION 4 (TEACHER NOTES)
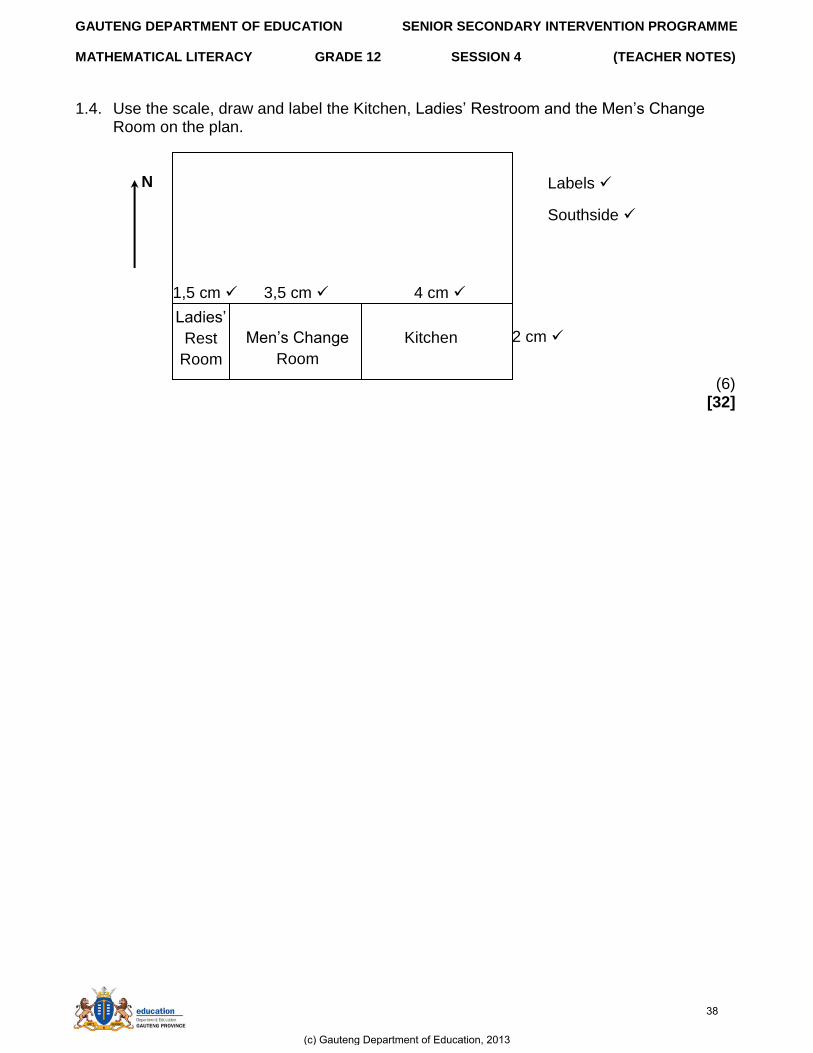
1.4 The flat-roofed clubhouse has a length = 18 m, breadth = 12 m and height = 5 m. The scale 1 : 200. On the south side of the clubhouse are the Kitchen (8 m × 4 m), the Ladies‟ Rest Room (3m × 2 m) and the Men‟s Change Room (7 m × 4 m). Use the scale, draw and label the Kitchen, Ladies‟ Restroom and the Men‟s Change Room on the plan below. (6)
[32]
SECTION D: SOLUTIONS TO HOMEWORK
QUESTION 1: 28 minutes (Original) (http://www.soccerwebsite.org) 1.1. 1 : 800 = 8,2 cm : x cm
x
8,2
800
1
x = 6560 cm x = 65,6 m (4)
1.2. Use the scale 1 : 800 to calculate the following:
1.2.1. the actual length of the field. 1 : 800 = 11,5 cm : x cm
x
11,5
800
1
x = 9200 cm x = 92 m (4)
N
(c) Gauteng Department of Education, 2013
36
GAUTENG DEPARTMENT OF EDUCATION SENIOR SECONDARY INTERVENTION PROGRAMME MATHEMATICAL LITERACY GRADE 12 SESSION 4 (TEACHER NOTES)
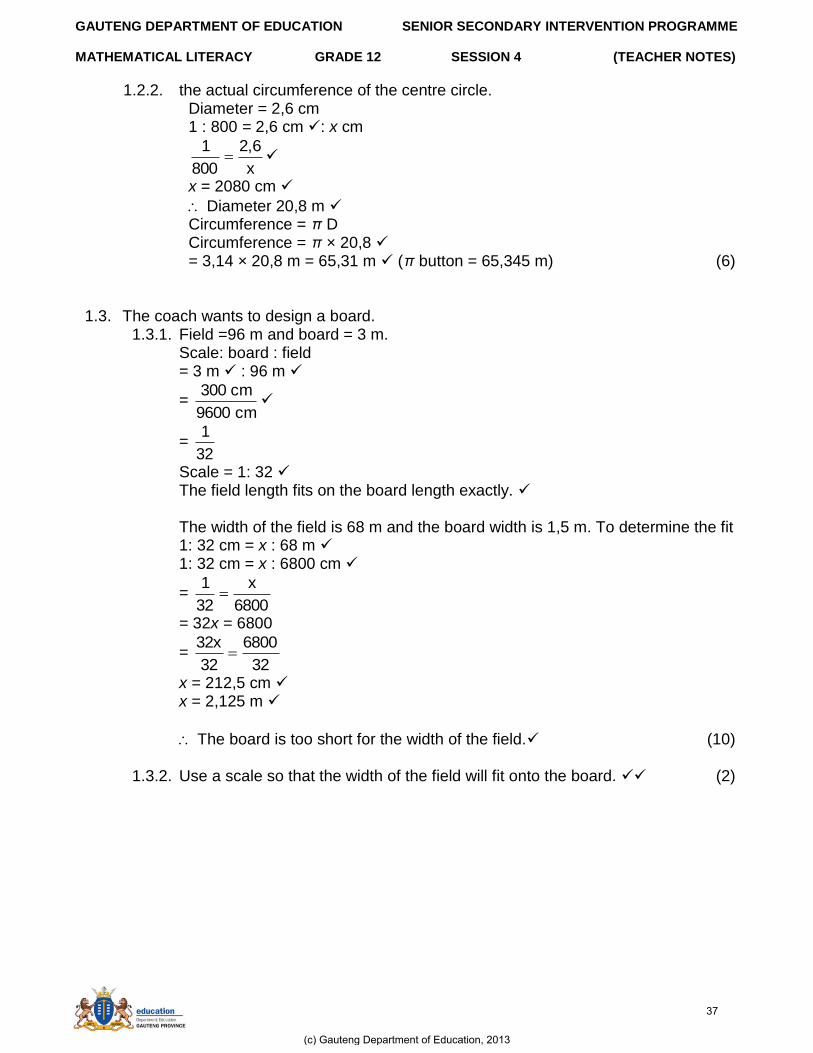
1.2.2. the actual circumference of the centre circle. Diameter = 2,6 cm 1 : 800 = 2,6 cm : x cm
x
2,6
800
1
x = 2080 cm
Diameter 20,8 m Circumference = π D Circumference = π × 20,8 = 3,14 × 20,8 m = 65,31 m (π button = 65,345 m) (6)
1.3. The coach wants to design a board. 1.3.1. Field =96 m and board = 3 m.
Scale: board : field = 3 m : 96 m
= cm 9600
cm 300
= 32
1
Scale = 1: 32 The field length fits on the board length exactly. The width of the field is 68 m and the board width is 1,5 m. To determine the fit 1: 32 cm = x : 68 m 1: 32 cm = x : 6800 cm
= 6800
x
32
1
= 32x = 6800
= 32
6800
32
32x
x = 212,5 cm x = 2,125 m
The board is too short for the width of the field. (10)
1.3.2. Use a scale so that the width of the field will fit onto the board. (2)
(c) Gauteng Department of Education, 2013
37
GAUTENG DEPARTMENT OF EDUCATION SENIOR SECONDARY INTERVENTION PROGRAMME MATHEMATICAL LITERACY GRADE 12 SESSION 4 (TEACHER NOTES)
1.4. Use the scale, draw and label the Kitchen, Ladies‟ Restroom and the Men‟s Change
Room on the plan.
N
(6) [32]
Kitchen Men‟s Change
Room
Ladies‟
Rest
Room
2 cm
3,5 cm 1,5 cm 4 cm
Labels
Southside
(c) Gauteng Department of Education, 2013
38
GAUTENG DEPARTMENT OF EDUCATION SENIOR SECONDARY INTERVENTION PROGRAMME MATHEMATICAL LITERACY GRADE 12 SESSION 5 SELF STUDY (TEACHER NOTES)
SESSION 5 SELF STUDY: TOPIC 1: COMPARE, SUMMARISE AND DISPLAY DATA –
DESCRIBE TRENDS.
Teacher Note: Ensure that learners: a) are able to draw and interpret line and broken line graphs, histograms, bar graphs
(multiple/compound bar graphs) and pie charts. b) know, understand and are able to use tally and frequency tables. c) know and understand the differences between continuous and discrete data and how to
display each. d) know how to use the five-point summary to analyse two or more sets of data.
SECTION A: TYPICAL EXAM QUESTIONS
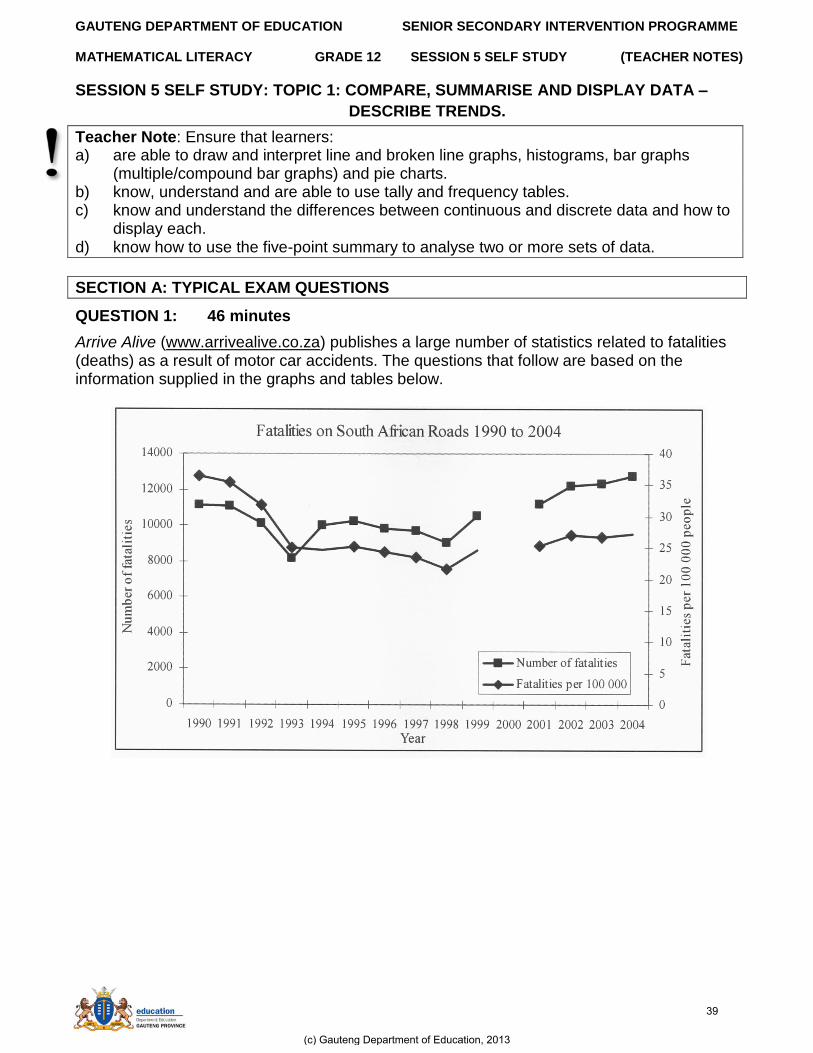
QUESTION 1: 46 minutes
Arrive Alive (www.arrivealive.co.za) publishes a large number of statistics related to fatalities (deaths) as a result of motor car accidents. The questions that follow are based on the information supplied in the graphs and tables below.
(c) Gauteng Department of Education, 2013
39
GAUTENG DEPARTMENT OF EDUCATION SENIOR SECONDARY INTERVENTION PROGRAMME MATHEMATICAL LITERACY GRADE 12 SESSION 5 SELF STUDY (TEACHER NOTES)
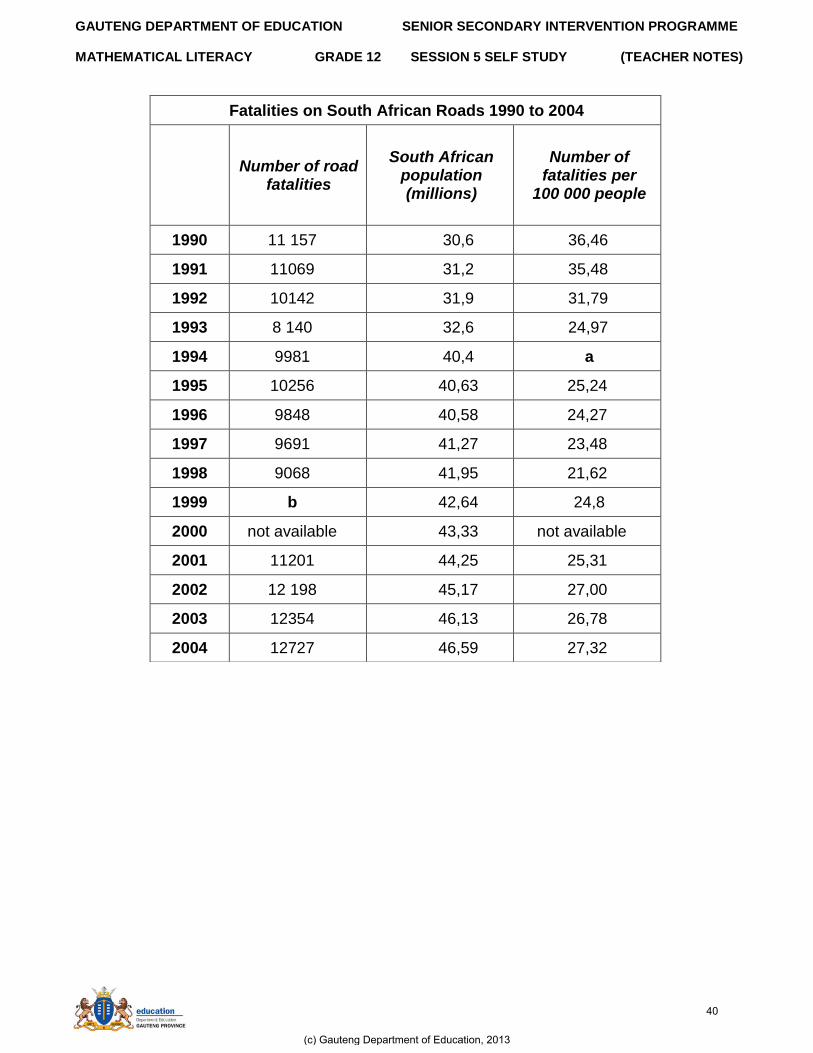
Fatalities on South African Roads 1990 to 2004
Number of road
fatalities
South African population (millions)
Number of fatalities per
100 000 people
1990 11 157 30,6 36,46
1991 11069 31,2 35,48
1992 10142 31,9 31,79
1993 8 140 32,6 24,97
1994 9981 40,4 a
1995 10256 40,63 25,24
1996 9848 40,58 24,27
1997 9691 41,27 23,48
1998 9068 41,95 21,62
1999 b 42,64 24,8
2000 not available 43,33 not available
2001 11201 44,25 25,31
2002 12 198 45,17 27,00
2003 12354 46,13 26,78
2004 12727 46,59 27,32
(c) Gauteng Department of Education, 2013
40
GAUTENG DEPARTMENT OF EDUCATION SENIOR SECONDARY INTERVENTION PROGRAMME MATHEMATICAL LITERACY GRADE 12 SESSION 5 SELF STUDY (TEACHER NOTES)
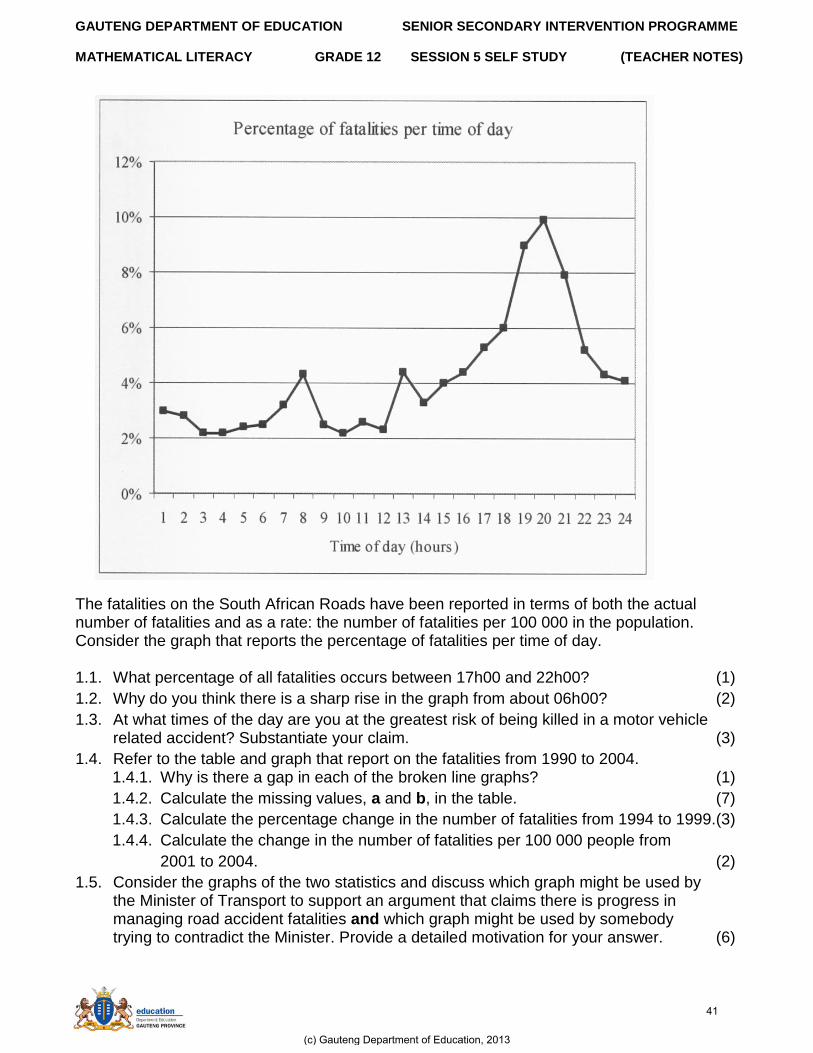
The fatalities on the South African Roads have been reported in terms of both the actual number of fatalities and as a rate: the number of fatalities per 100 000 in the population. Consider the graph that reports the percentage of fatalities per time of day. 1.1. What percentage of all fatalities occurs between 17h00 and 22h00? (1)
1.2. Why do you think there is a sharp rise in the graph from about 06h00? (2)
1.3. At what times of the day are you at the greatest risk of being killed in a motor vehicle related accident? Substantiate your claim. (3)
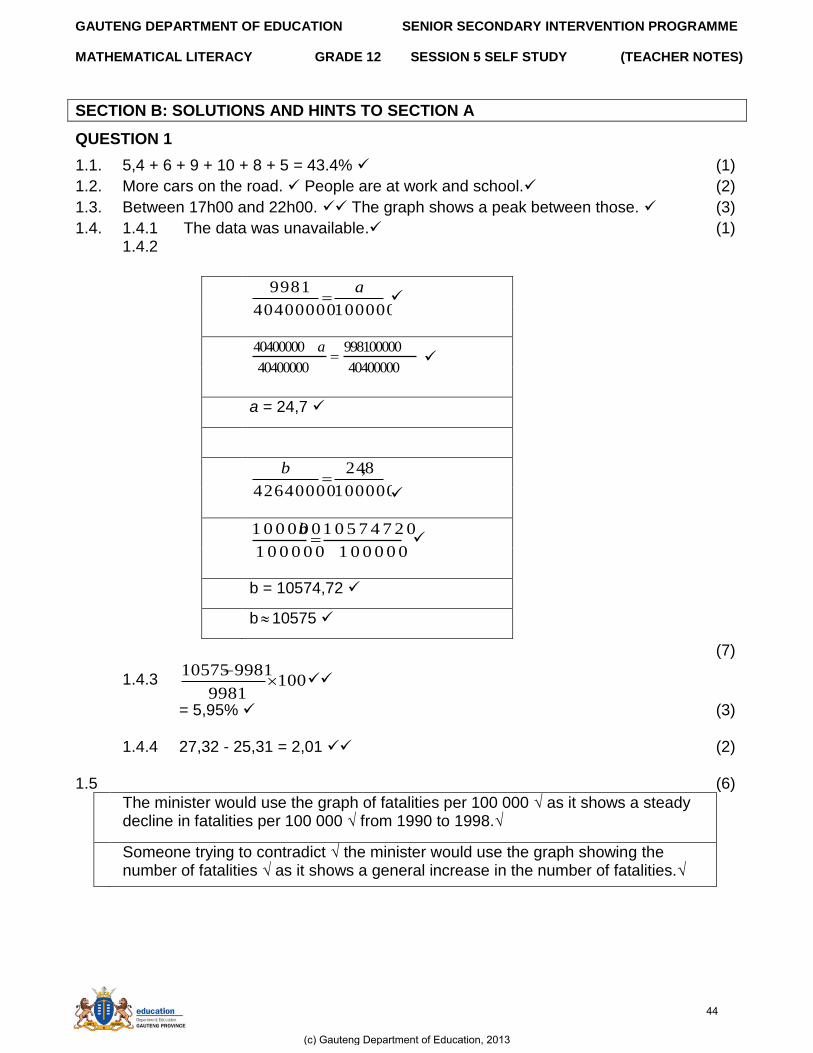
1.4. Refer to the table and graph that report on the fatalities from 1990 to 2004. 1.4.1. Why is there a gap in each of the broken line graphs? (1)
1.4.2. Calculate the missing values, a and b, in the table. (7)
1.4.3. Calculate the percentage change in the number of fatalities from 1994 to 1999.(3)
1.4.4. Calculate the change in the number of fatalities per 100 000 people from
2001 to 2004. (2)
1.5. Consider the graphs of the two statistics and discuss which graph might be used by the Minister of Transport to support an argument that claims there is progress in
managing road accident fatalities and which graph might be used by somebody trying to contradict the Minister. Provide a detailed motivation for your answer. (6)
(c) Gauteng Department of Education, 2013
41
GAUTENG DEPARTMENT OF EDUCATION SENIOR SECONDARY INTERVENTION PROGRAMME MATHEMATICAL LITERACY GRADE 12 SESSION 5 SELF STUDY (TEACHER NOTES)
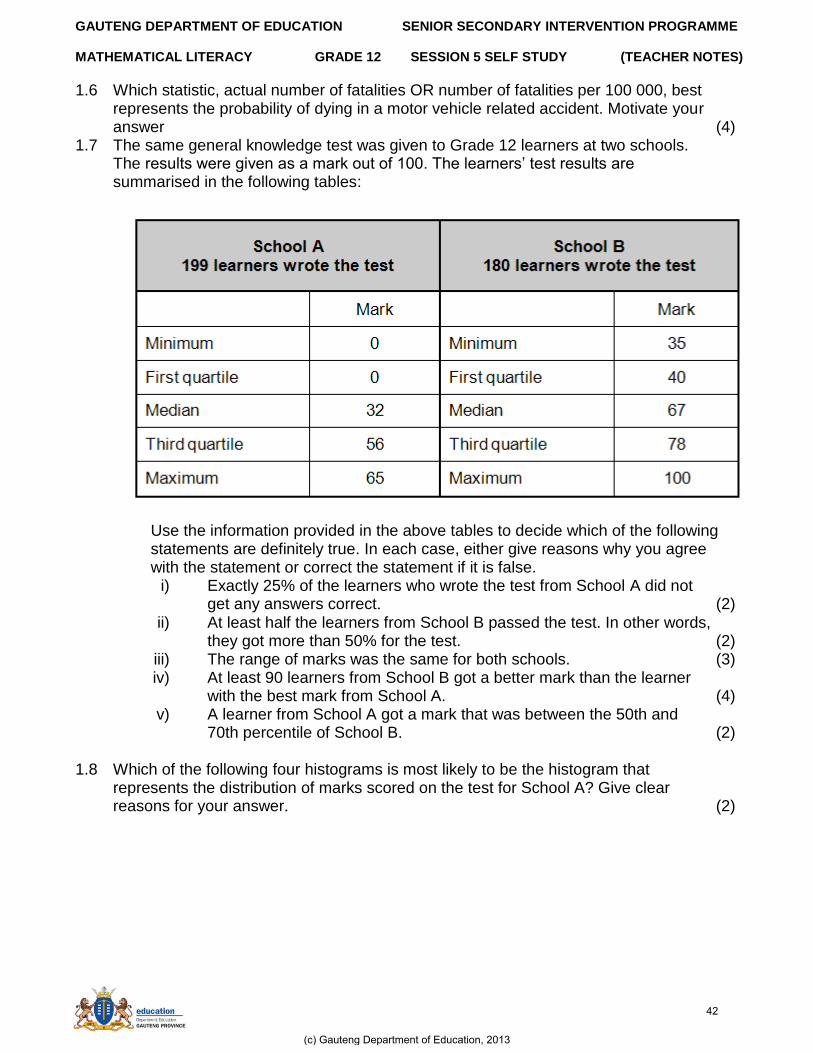
1.6 Which statistic, actual number of fatalities OR number of fatalities per 100 000, best represents the probability of dying in a motor vehicle related accident. Motivate your
answer (4) 1.7 The same general knowledge test was given to Grade 12 learners at two schools. The results were given as a mark out of 100. The learners‟ test results are summarised in the following tables:
Use the information provided in the above tables to decide which of the following statements are definitely true. In each case, either give reasons why you agree with the statement or correct the statement if it is false.
i) Exactly 25% of the learners who wrote the test from School A did not get any answers correct. (2)
ii) At least half the learners from School B passed the test. In other words, they got more than 50% for the test. (2)
iii) The range of marks was the same for both schools. (3) iv) At least 90 learners from School B got a better mark than the learner
with the best mark from School A. (4) v) A learner from School A got a mark that was between the 50th and
70th percentile of School B. (2)
1.8 Which of the following four histograms is most likely to be the histogram that represents the distribution of marks scored on the test for School A? Give clear reasons for your answer. (2)
(c) Gauteng Department of Education, 2013
42
GAUTENG DEPARTMENT OF EDUCATION SENIOR SECONDARY INTERVENTION PROGRAMME MATHEMATICAL LITERACY GRADE 12 SESSION 5 SELF STUDY (TEACHER NOTES)
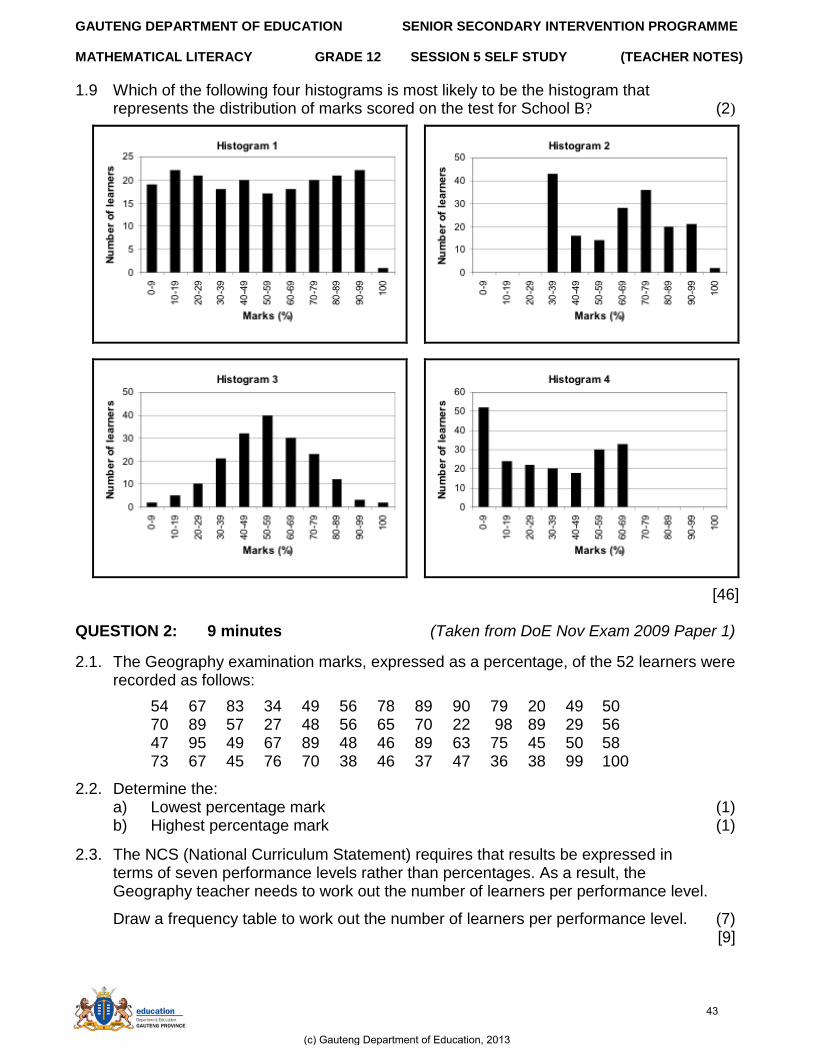
1.9 Which of the following four histograms is most likely to be the histogram that represents the distribution of marks scored on the test for School B? (2)
[46] QUESTION 2: 9 minutes (Taken from DoE Nov Exam 2009 Paper 1)
2.1. The Geography examination marks, expressed as a percentage, of the 52 learners were recorded as follows:
54 67 83 34 49 56 78 89 90 79 20 49 50 70 89 57 27 48 56 65 70 22 98 89 29 56 47 95 49 67 89 48 46 89 63 75 45 50 58 73 67 45 76 70 38 46 37 47 36 38 99 100
2.2. Determine the: a) Lowest percentage mark (1) b) Highest percentage mark (1)
2.3. The NCS (National Curriculum Statement) requires that results be expressed in terms of seven performance levels rather than percentages. As a result, the Geography teacher needs to work out the number of learners per performance level.
Draw a frequency table to work out the number of learners per performance level. (7) [9]
(c) Gauteng Department of Education, 2013
43
GAUTENG DEPARTMENT OF EDUCATION SENIOR SECONDARY INTERVENTION PROGRAMME MATHEMATICAL LITERACY GRADE 12 SESSION 5 SELF STUDY (TEACHER NOTES)
SECTION B: SOLUTIONS AND HINTS TO SECTION A
QUESTION 1
1.1. 5,4 + 6 + 9 + 10 + 8 + 5 = 43.4% (1)
1.2. More cars on the road. People are at work and school. (2)
1.3. Between 17h00 and 22h00. The graph shows a peak between those. (3)
1.4. 1.4.1 The data was unavailable. (1) 1.4.2
(7)
1.4.3 1009981
998110575
= 5,95% (3) 1.4.4 27,32 - 25,31 = 2,01 (2)
1.5 (6)
The minister would use the graph of fatalities per 100 000 √ as it shows a steady decline in fatalities per 100 000 √ from 1990 to 1998.√
Someone trying to contradict √ the minister would use the graph showing the number of fatalities √ as it shows a general increase in the number of fatalities.√
10000040400000
9981 a
40400000
998100000
40400000
40400000
a
a = 24,7
100000
8,24
42640000
b
1 0 0 0 0 0
1 0 5 7 4 7 2 0 0 0
1 0 0 0 0 0
1 0 0 0 0 0
b
b = 10574,72
b10575
(c) Gauteng Department of Education, 2013
44
GAUTENG DEPARTMENT OF EDUCATION SENIOR SECONDARY INTERVENTION PROGRAMME MATHEMATICAL LITERACY GRADE 12 SESSION 5 SELF STUDY (TEACHER NOTES)
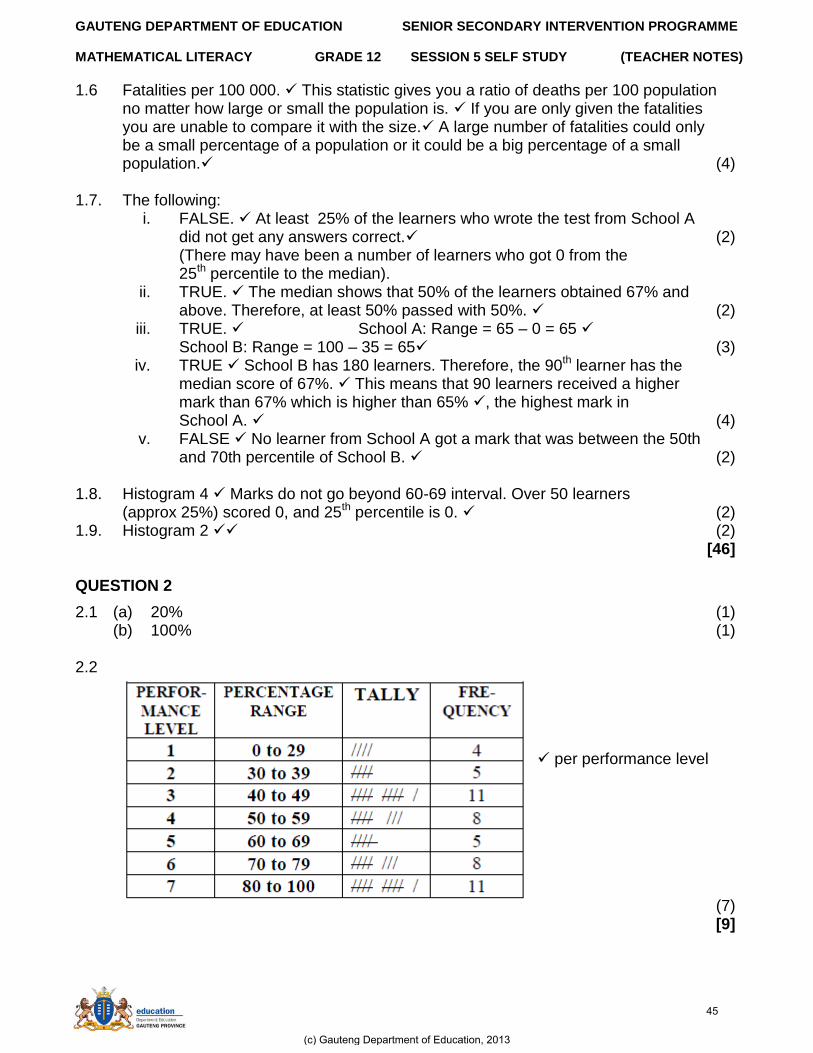
1.6 Fatalities per 100 000. This statistic gives you a ratio of deaths per 100 population no matter how large or small the population is. If you are only given the fatalities
you are unable to compare it with the size. A large number of fatalities could only be a small percentage of a population or it could be a big percentage of a small
population. (4) 1.7. The following:
i. FALSE. At least 25% of the learners who wrote the test from School A did not get any answers correct. (2)
(There may have been a number of learners who got 0 from the 25th percentile to the median).
ii. TRUE. The median shows that 50% of the learners obtained 67% and above. Therefore, at least 50% passed with 50%. (2)
iii. TRUE. School A: Range = 65 – 0 = 65 School B: Range = 100 – 35 = 65 (3)
iv. TRUE School B has 180 learners. Therefore, the 90th learner has the median score of 67%. This means that 90 learners received a higher
mark than 67% which is higher than 65% , the highest mark in School A. (4)
v. FALSE No learner from School A got a mark that was between the 50th and 70th percentile of School B. (2)
1.8. Histogram 4 Marks do not go beyond 60-69 interval. Over 50 learners (approx 25%) scored 0, and 25th percentile is 0. (2) 1.9. Histogram 2 (2)
[46] QUESTION 2
2.1 (a) 20% (1) (b) 100% (1)
2.2
per performance level (7) [9]
(c) Gauteng Department of Education, 2013
45
GAUTENG DEPARTMENT OF EDUCATION SENIOR SECONDARY INTERVENTION PROGRAMME MATHEMATICAL LITERACY GRADE 12 SESSION 5 SELF STUDY (TEACHER NOTES)
SECTION C: HOMEWORK
QUESTION 1: 13 minutes
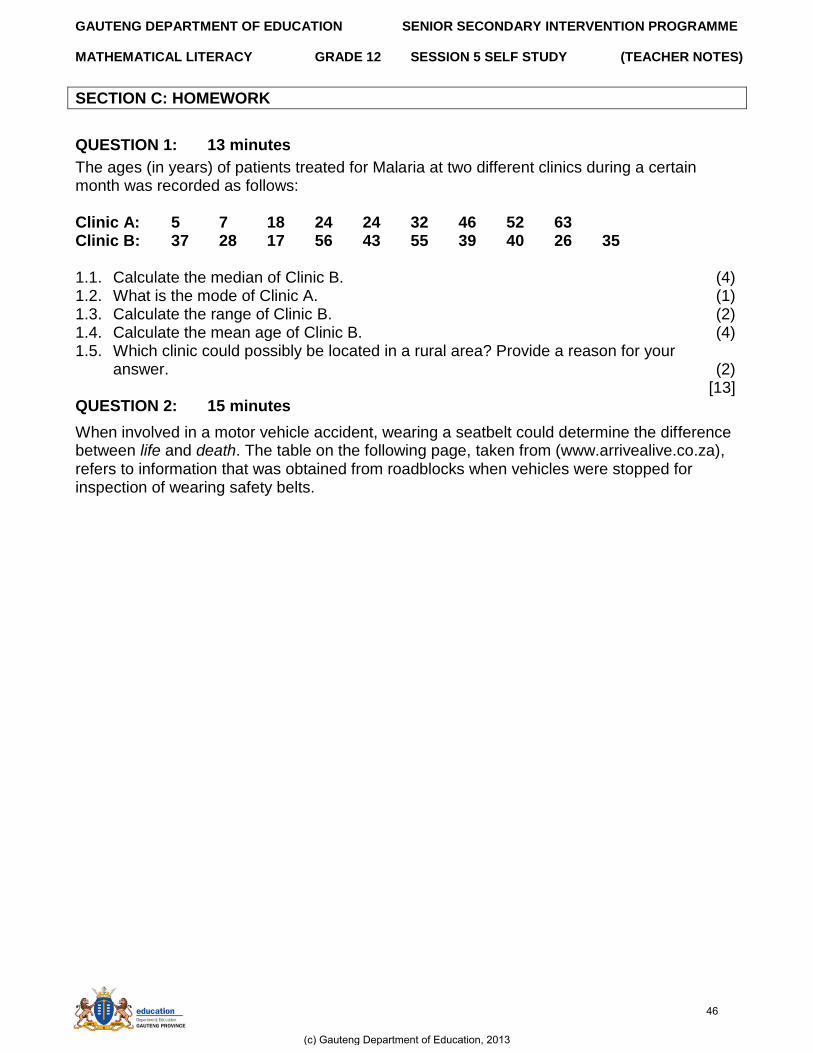
The ages (in years) of patients treated for Malaria at two different clinics during a certain month was recorded as follows: Clinic A: 5 7 18 24 24 32 46 52 63 Clinic B: 37 28 17 56 43 55 39 40 26 35 1.1. Calculate the median of Clinic B. (4) 1.2. What is the mode of Clinic A. (1) 1.3. Calculate the range of Clinic B. (2) 1.4. Calculate the mean age of Clinic B. (4) 1.5. Which clinic could possibly be located in a rural area? Provide a reason for your
answer. (2) [13]
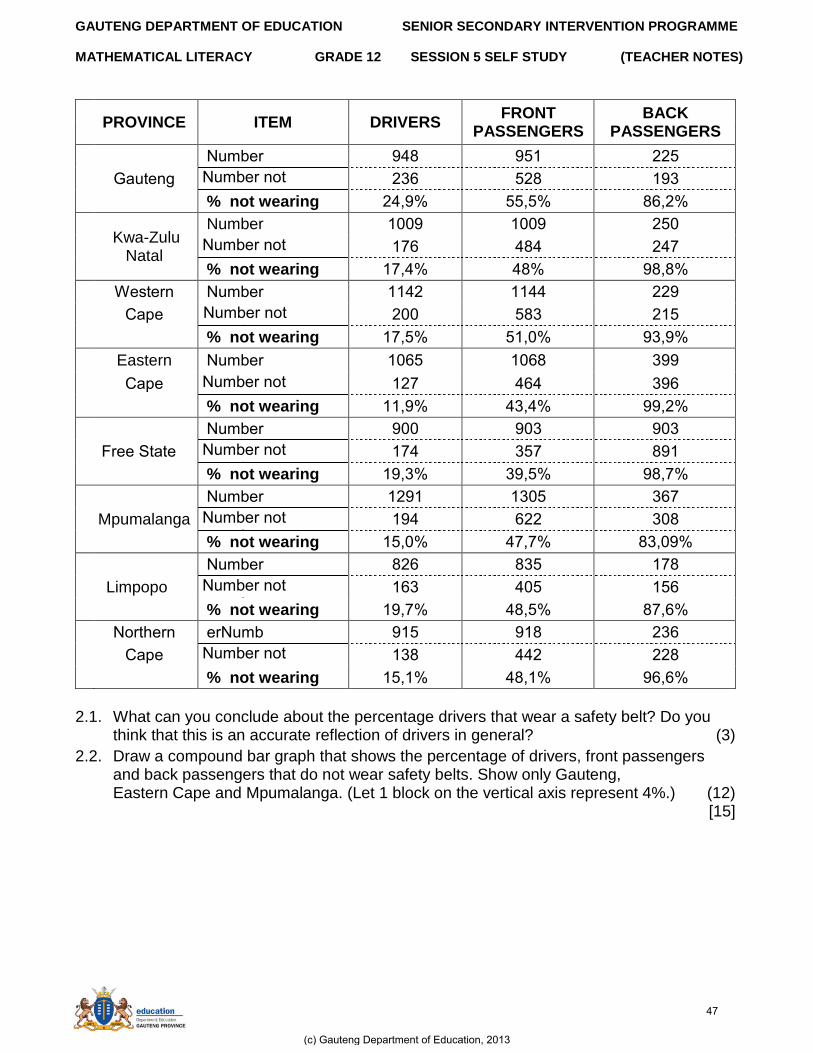
QUESTION 2: 15 minutes
When involved in a motor vehicle accident, wearing a seatbelt could determine the difference between life and death. The table on the following page, taken from (www.arrivealive.co.za), refers to information that was obtained from roadblocks when vehicles were stopped for inspection of wearing safety belts.
(c) Gauteng Department of Education, 2013
46
GAUTENG DEPARTMENT OF EDUCATION SENIOR SECONDARY INTERVENTION PROGRAMME MATHEMATICAL LITERACY GRADE 12 SESSION 5 SELF STUDY (TEACHER NOTES)
PROVINCE ITEM DRIVERS
FRONT PASSENGERS
BACK PASSENGERS
rebmuN 948 959 225
gnetuaG rebmuNNamtNgunNaaG
236 528 993
% not wearing 2449% 5545% 8642%
NKwa-Zulu
Natal
Number 9009 9009 250
rebmuNNamtNgunNaaG
976 484 247
% not wearing 9744% 48% 9848%
nuetuNa rebmuN 9942 9944 229
enau rebmuNNamtNgunNaaG
200 583 295
% not wearing 9745% 5940% 9349%
Eastern rebmuN 9065 9068 399
enau rebmuNNamtNgunNaaG
927 464 396
% not wearing 9949% 4344% 9942%
rebmuN 900 903 903
eNuuN tntu rebmuNNamtNgunNaaG
974 357 899
% not wearing 9943% 3945% 9847%
rebmuN 9299 9305 367
Mpumalanga rebmuNNamtNgunNaaG
994 622 308
% not wearing 9540% 4747% 83409%
Limpopo
rebmuN 826 835 978
rebmuNNamtNgunNaaG
963 405 956
% not wearing 9947% 4845% 8746%
rmNttuNa rebmuN 995 998 236
enau rebmuNNamtNgunNaaG
938 442 228
% not wearing 9549% 4849% 9646%
2.1. What can you conclude about the percentage drivers that wear a safety belt? Do you
think that this is an accurate reflection of drivers in general? (3)
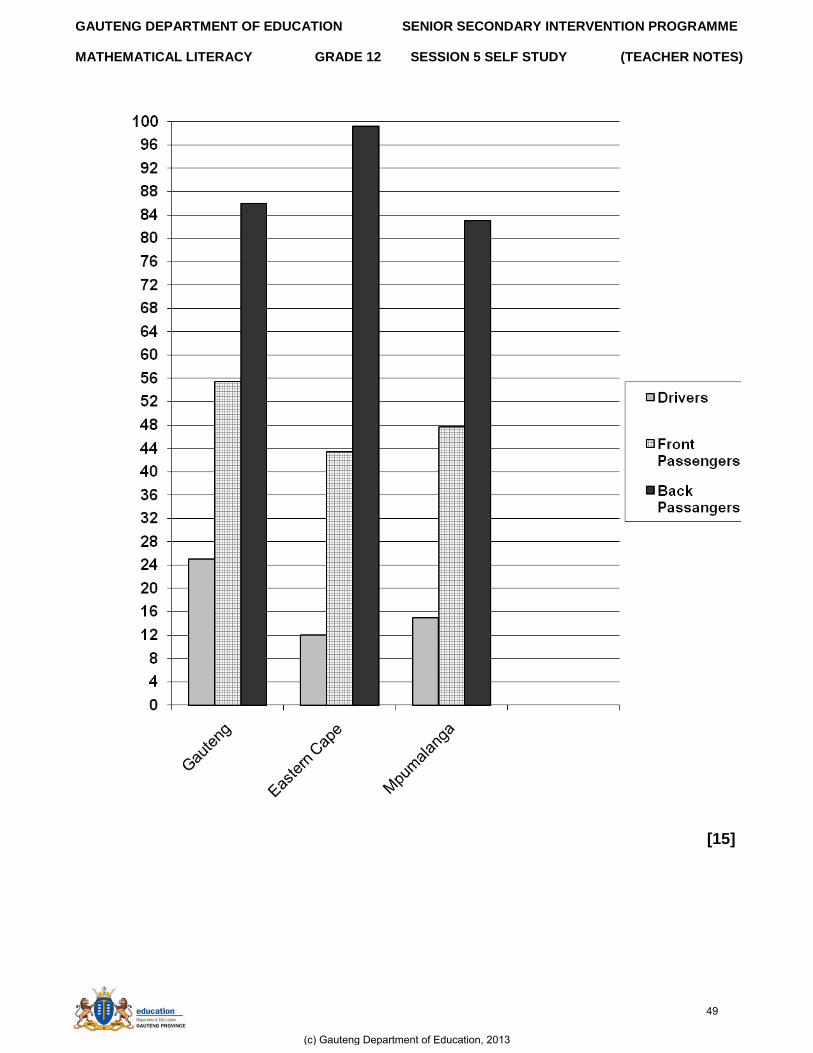
2.2. Draw a compound bar graph that shows the percentage of drivers, front passengers and back passengers that do not wear safety belts. Show only Gauteng,
Eastern Cape and Mpumalanga. (Let 1 block on the vertical axis represent 4%.) (12) [15]
(c) Gauteng Department of Education, 2013
47
GAUTENG DEPARTMENT OF EDUCATION SENIOR SECONDARY INTERVENTION PROGRAMME MATHEMATICAL LITERACY GRADE 12 SESSION 5 SELF STUDY (TEACHER NOTES)
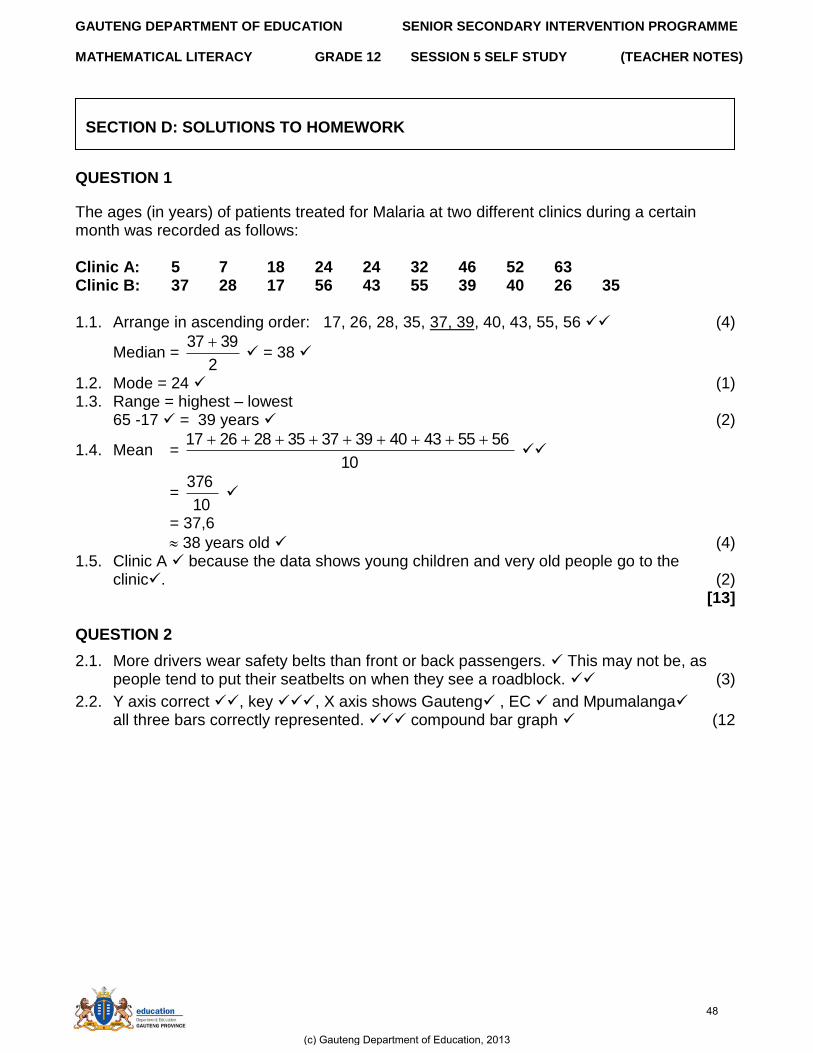
QUESTION 1
The ages (in years) of patients treated for Malaria at two different clinics during a certain month was recorded as follows: Clinic A: 5 7 18 24 24 32 46 52 63 Clinic B: 37 28 17 56 43 55 39 40 26 35
1.1. Arrange in ascending order: 17, 26, 28, 35, 37, 39, 40, 43, 55, 56 (4)
Median = 2
3937 = 38
1.2. Mode = 24 (1) 1.3. Range = highest – lowest
65 -17 = 39 years (2)
1.4. Mean = 10
56554340393735282617
= 10
763
= 37,6
38 years old (4) 1.5. Clinic A because the data shows young children and very old people go to the
clinic. (2) [13]
QUESTION 2
2.1. More drivers wear safety belts than front or back passengers. This may not be, as people tend to put their seatbelts on when they see a roadblock. (3)
2.2. Y axis correct , key , X axis shows Gauteng , EC and Mpumalanga all three bars correctly represented. compound bar graph (12
SECTION D: SOLUTIONS TO HOMEWORK
(c) Gauteng Department of Education, 2013
48
GAUTENG DEPARTMENT OF EDUCATION SENIOR SECONDARY INTERVENTION PROGRAMME MATHEMATICAL LITERACY GRADE 12 SESSION 5 SELF STUDY (TEACHER NOTES)
[15]
(c) Gauteng Department of Education, 2013
49

GAUTENG DEPARTMENT OF EDUCATION SENIOR SECONDARY INTERVENTION PROGRAMME MATHEMATICAL LITERACY GRADE 12 SESSION 5 SELF STUDY (TEACHER NOTES)
SESSION 6 SELF STUDY: TOPIC 2: PROBABILITY AND MISUSE OF STATISTICS IN SOCIETY
Teacher Note: Make sure learners know and understand: (a) that probability is the mathematical term for „chance‟. It refers to the chance that
something will take place (b) that probability is measured on a scale from 0 to 1 and can be written as a fraction, a
decimal fraction or as a percentage. (c) how to draw and analyse tree diagrams.
LESSON OVERVIEW
1. Introduce session: 5 minutes 2. Typical exam questions: 52 minutes 3. Review/solutions/memo: 33 minutes
SECTION A: TYPICAL EXAM QUESTIONS
QUESTION 1: 12 minutes
A dressmaker has 48 white buttons, 39 green buttons and 33 blue buttons in a tin. 1.1 (a) If she takes a button from the tin without looking, what is the probability that the
button is blue? (4) (b) She replaces the button because she realises that a green one would be more
suitable for the mending she is doing. What are the chances that when she takes a button from the tin without looking, that it will be green? (4) (c) She used the green button and an additional three green ones before she finished her mending. Thereafter she had to finish the white blouse she started last week. She had to sew the white buttons on. What is the probability that when she next takes a button out of the tin without looking, that it will be white. (4)
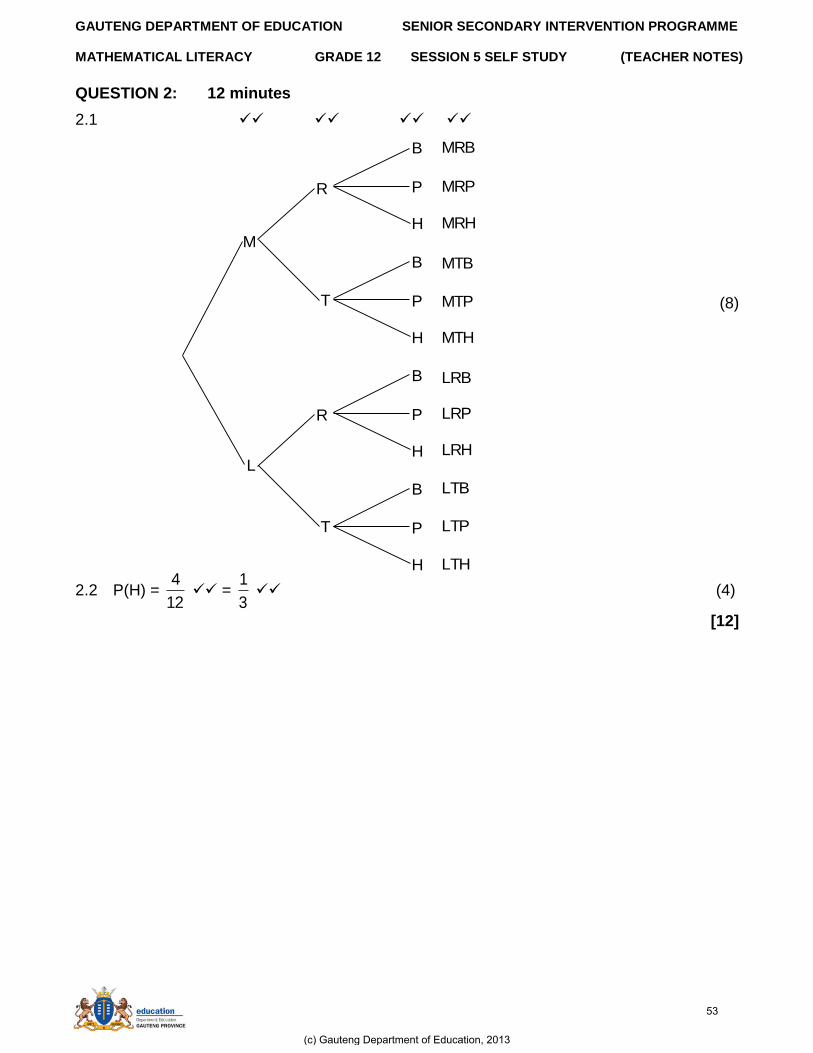
[12] QUESTION 2: 12 minutes
Pizza is everyone‟s favourite. The following choices are available.
Size Base Topping
Medium (M) Regular (R) Bacon (B)
Large (L) Thick (T) Pineapple (P)
Ham (H)
2.1. Draw a tree diagram to find all the possible combinations for the pizza choices above.(8) 2.2. What is the probability that a pizza with ham topping will be ordered? (4)
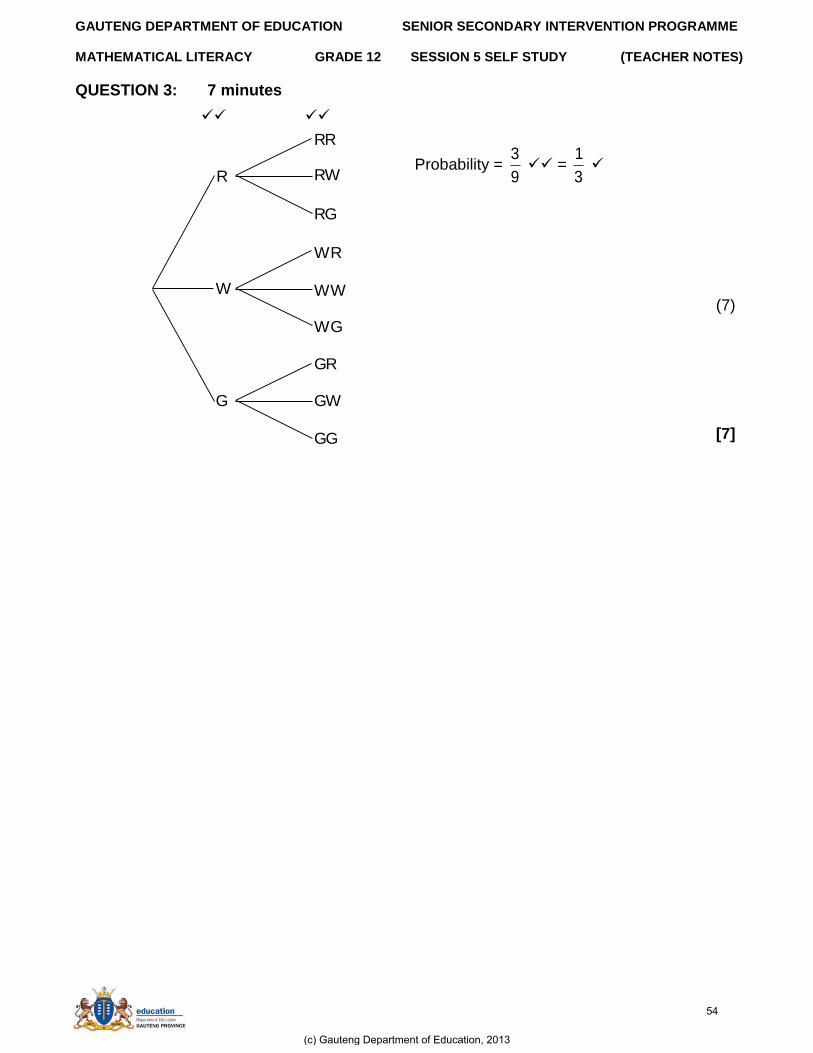
[12] QUESTION 3: 7 minutes
A box has two red, two green and two white balls inside it. If you choose two balls without looking, what is the probability of getting two balls of the same colour i.e. red, red (RR) or green, green (GG) or white, white (WW). Use a tree diagram to identify all the possible outcomes. (7)
(c) Gauteng Department of Education, 2013
50
GAUTENG DEPARTMENT OF EDUCATION SENIOR SECONDARY INTERVENTION PROGRAMME MATHEMATICAL LITERACY GRADE 12 SESSION 5 SELF STUDY (TEACHER NOTES)
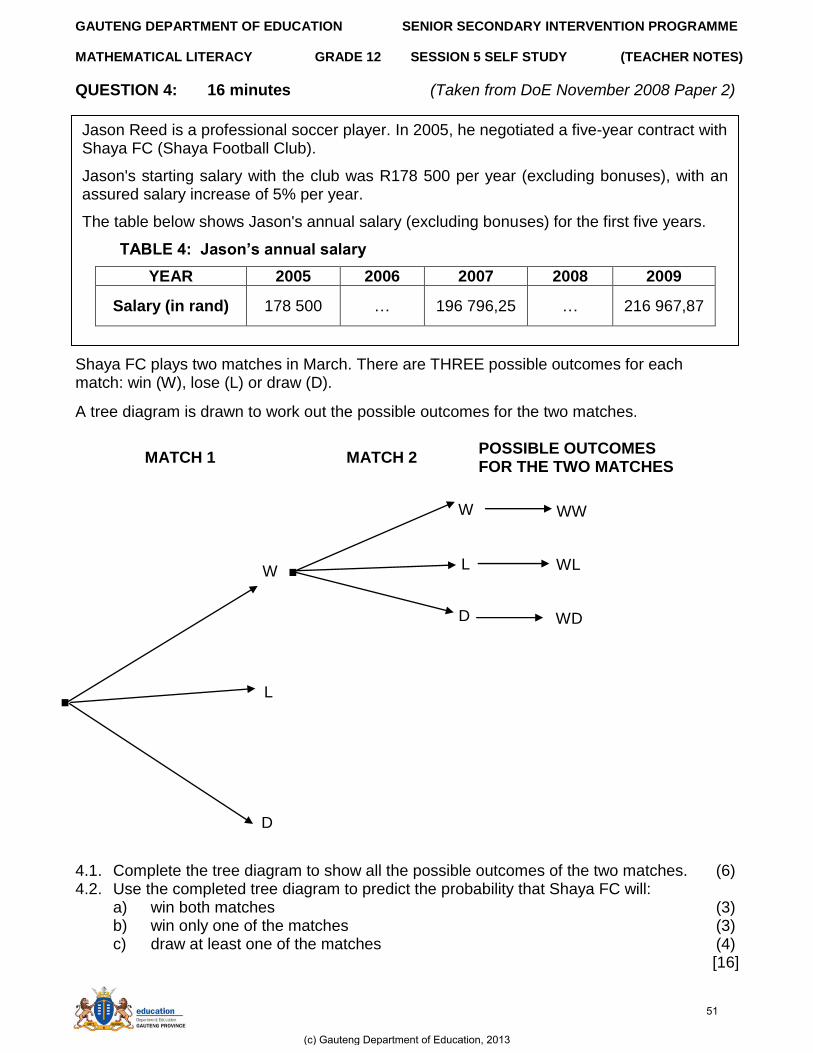
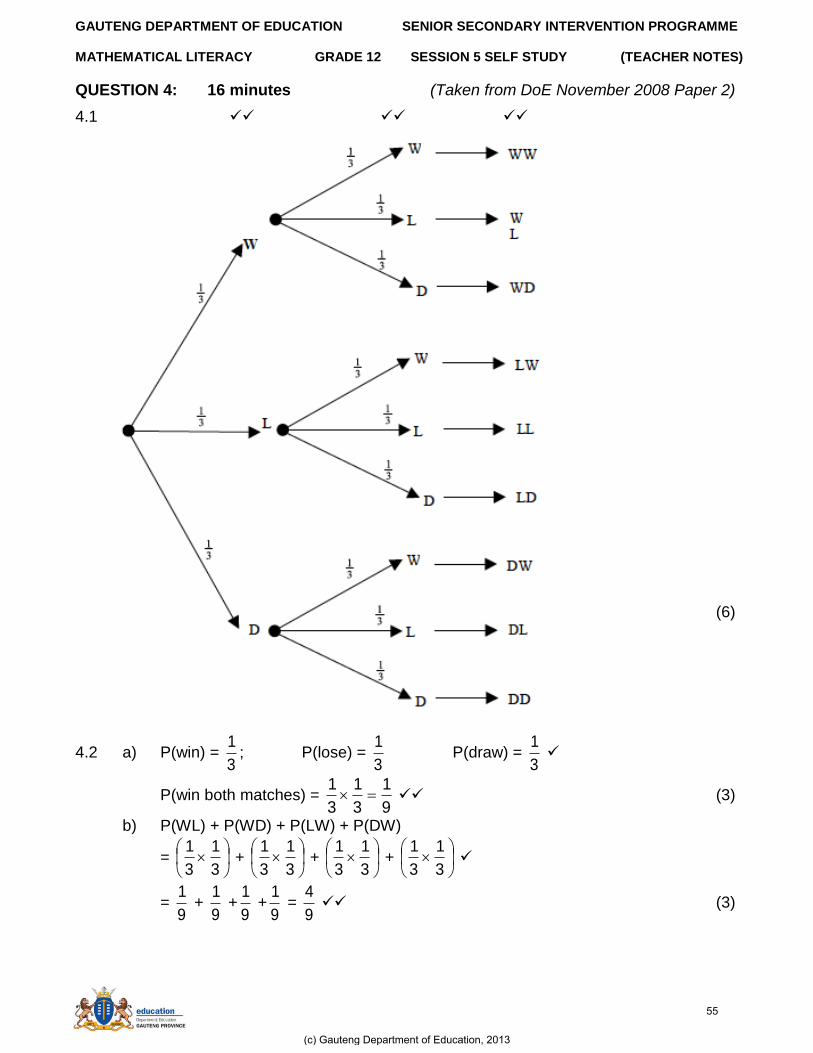
QUESTION 4: 16 minutes (Taken from DoE November 2008 Paper 2)
Shaya FC plays two matches in March. There are THREE possible outcomes for each match: win (W), lose (L) or draw (D).
A tree diagram is drawn to work out the possible outcomes for the two matches.
MATCH 1 MATCH 2 POSSIBLE OUTCOMES FOR THE TWO MATCHES
4.1. Complete the tree diagram to show all the possible outcomes of the two matches. (6) 4.2. Use the completed tree diagram to predict the probability that Shaya FC will:
a) win both matches (3) b) win only one of the matches (3) c) draw at least one of the matches (4)
[16]
WW
WL
WD
.
W
L
D
.
W
L
D
Jason Reed is a professional soccer player. In 2005, he negotiated a five-year contract with Shaya FC (Shaya Football Club).
Jason's starting salary with the club was R178 500 per year (excluding bonuses), with an assured salary increase of 5% per year.
The table below shows Jason's annual salary (excluding bonuses) for the first five years.
TABLE 4: Jason’s annual salary
YEAR 2005 2006 2007 2008 2009
Salary (in rand)
178 500 … 196 796,25 … 216 967,87
(c) Gauteng Department of Education, 2013
51
GAUTENG DEPARTMENT OF EDUCATION SENIOR SECONDARY INTERVENTION PROGRAMME MATHEMATICAL LITERACY GRADE 12 SESSION 5 SELF STUDY (TEACHER NOTES)
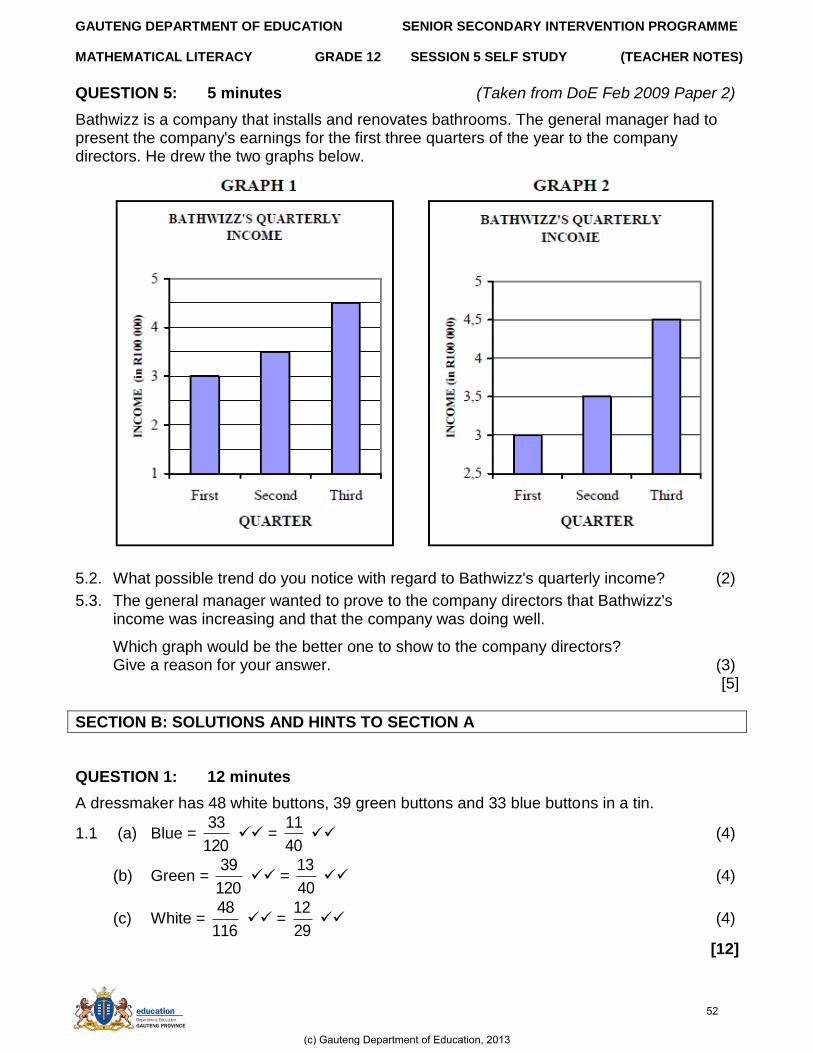
QUESTION 5: 5 minutes (Taken from DoE Feb 2009 Paper 2)
Bathwizz is a company that installs and renovates bathrooms. The general manager had to present the company's earnings for the first three quarters of the year to the company directors. He drew the two graphs below. 5.2. What possible trend do you notice with regard to Bathwizz's quarterly income? (2)
5.3. The general manager wanted to prove to the company directors that Bathwizz's income was increasing and that the company was doing well.
Which graph would be the better one to show to the company directors? Give a reason for your answer. (3)
[5]
SECTION B: SOLUTIONS AND HINTS TO SECTION A
QUESTION 1: 12 minutes
A dressmaker has 48 white buttons, 39 green buttons and 33 blue buttons in a tin.
1.1 (a) Blue = 120
33 =
40
11 (4)
(b) Green = 120
39 =
40
13 (4)
(c) White = 116
48 =
29
12 (4)
[12]
(c) Gauteng Department of Education, 2013
52
GAUTENG DEPARTMENT OF EDUCATION SENIOR SECONDARY INTERVENTION PROGRAMME MATHEMATICAL LITERACY GRADE 12 SESSION 5 SELF STUDY (TEACHER NOTES)
QUESTION 2: 12 minutes
2.1
(8)
2.2 P(H) = 12
4 =
3
1 (4)
[12]
MRB
R
T
R
T
M
L
MRP
B
P
H
B
P
H
B
P
H
B
P
H
MRH
MTB
MTH
MTP
LRB
LRP
LRH
LTB
LTP
LTH
(c) Gauteng Department of Education, 2013
53
GAUTENG DEPARTMENT OF EDUCATION SENIOR SECONDARY INTERVENTION PROGRAMME MATHEMATICAL LITERACY GRADE 12 SESSION 5 SELF STUDY (TEACHER NOTES)
QUESTION 3: 7 minutes
Probability = 9
3 =
3
1
(7)
[7]
RR
RW
RG
WR
WW
WG
GR
GW
GG
R
W
G
(c) Gauteng Department of Education, 2013
54
GAUTENG DEPARTMENT OF EDUCATION SENIOR SECONDARY INTERVENTION PROGRAMME MATHEMATICAL LITERACY GRADE 12 SESSION 5 SELF STUDY (TEACHER NOTES)
QUESTION 4: 16 minutes (Taken from DoE November 2008 Paper 2)
4.1
(6)
4.2 a) P(win) = 3
1; P(lose) =
3
1 P(draw) =
3
1
P(win both matches) = 9
1
3
1
3
1 (3)
b) P(WL) + P(WD) + P(LW) + P(DW)
=
3
1
3
1 +
3
1
3
1 +
3
1
3
1 +
3
1
3
1
= 9
1 +
9
1 +
9
1 +
9
1 =
9
4 (3)
(c) Gauteng Department of Education, 2013
55
GAUTENG DEPARTMENT OF EDUCATION SENIOR SECONDARY INTERVENTION PROGRAMME MATHEMATICAL LITERACY GRADE 12 SESSION 5 SELF STUDY (TEACHER NOTES)
c) P(WD) + P(LD) + P(DW) + P(DL) + P(DD)
=
3
1
3
1 +
3
1
3
1 +
3
1
3
1 +
3
1
3
1 +
3
1
3
1
= 9
1 +
9
1 +
9
1 +
9
1 +
9
1 =
9
5 (4)
[16]
QUESTION 5: 5 minutes (Taken from DoE Feb 2009 Paper 2)
5.1. There is a steady increase in income OR any other suitable explanation of trend. (2)
5.2. Graph 2. The vertical scale starts at 2,5 and gives the impression that the quarterly increase is larger than it actually is. (3)
[5]
SECTION C: HOMEWORK
QUESTION 1: 20 minutes
A dressmaker has 48 white buttons, 39 green buttons and 33 blue buttons in a tin. 1.1 If she takes a button from the tin without looking, what is the probability that the button
is: a) red? (3) b) not white (3) c) green or blue (4)
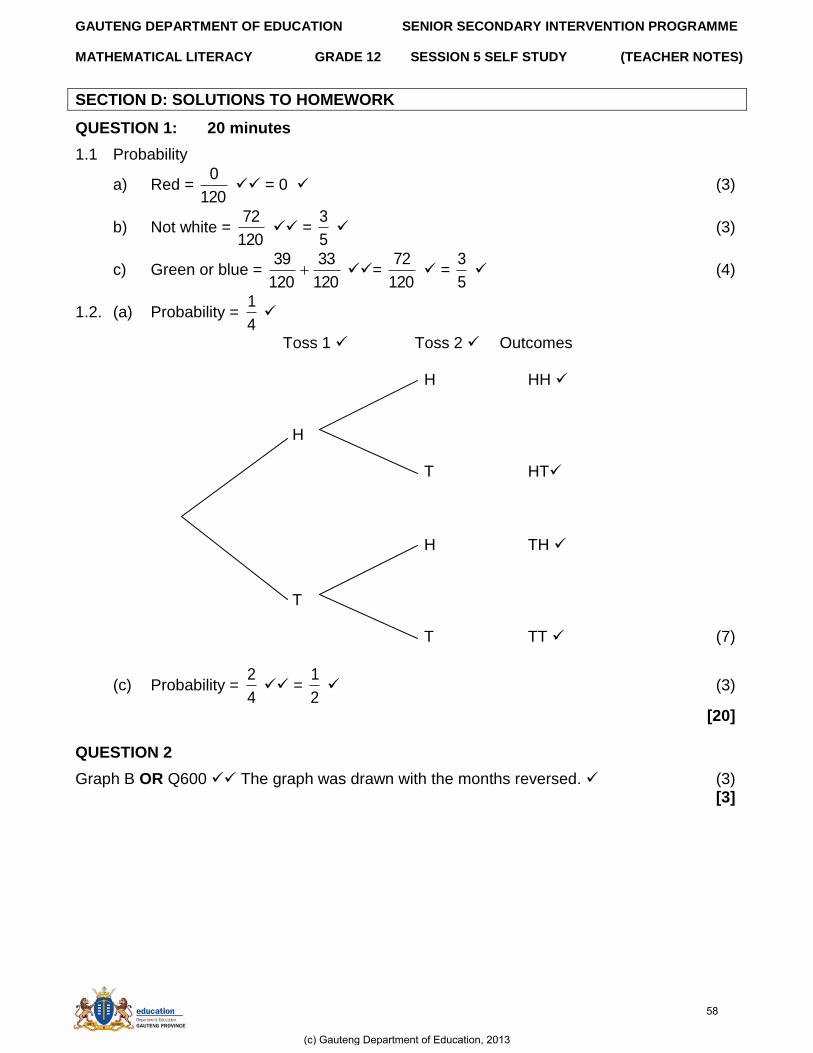
1.2. (a) You toss a coin twice. Draw a tree diagram to determine the probability of Getting two tails? (7)
(b) What is the probability of getting a head and a tail in any order? (3) [20]
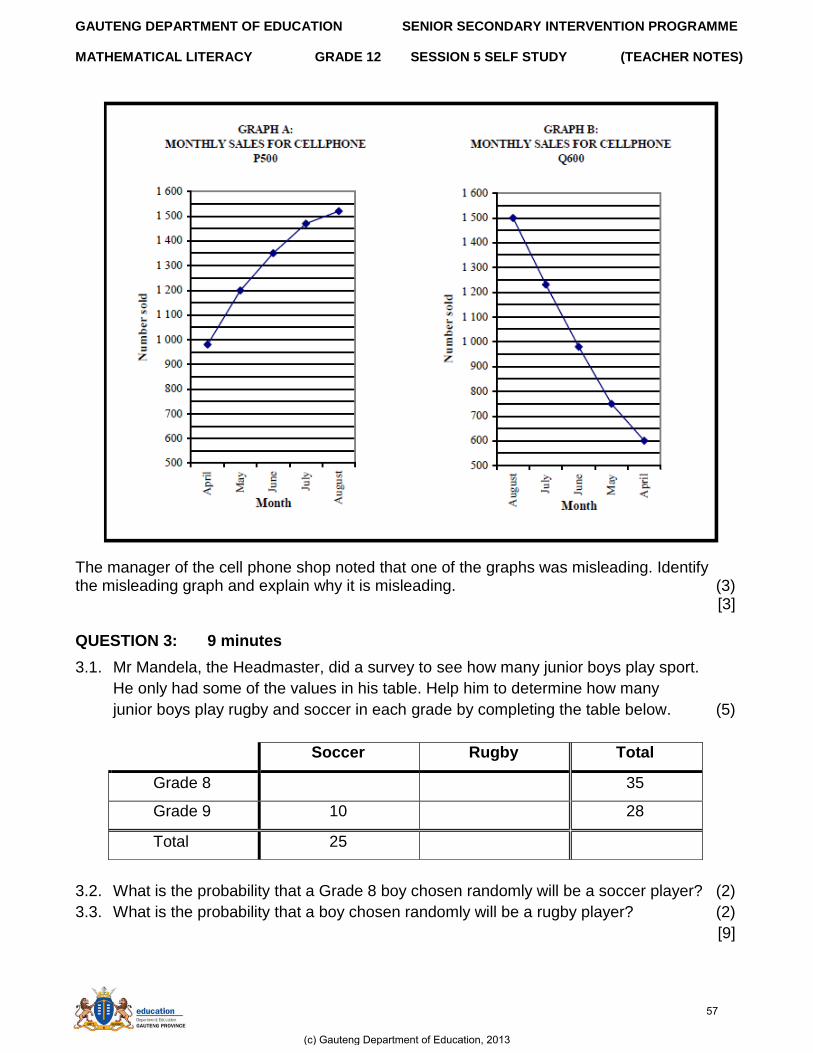
QUESTION 2: 3 minutes (Taken from DoE Nov 2009 Paper 2)
The salesman for cell phone P500 claimed that the monthly sales for cell phone Q600 were decreasing while the sales of cell phone P500 were increasing. To support his claim, he used the two graphs on the following page:
(c) Gauteng Department of Education, 2013
56
GAUTENG DEPARTMENT OF EDUCATION SENIOR SECONDARY INTERVENTION PROGRAMME MATHEMATICAL LITERACY GRADE 12 SESSION 5 SELF STUDY (TEACHER NOTES)
The manager of the cell phone shop noted that one of the graphs was misleading. Identify the misleading graph and explain why it is misleading. (3)
[3] QUESTION 3: 9 minutes
3.1. Mr Mandela, the Headmaster, did a survey to see how many junior boys play sport.
He only had some of the values in his table. Help him to determine how many
junior boys play rugby and soccer in each grade by completing the table below. (5)
3.2. What is the probability that a Grade 8 boy chosen randomly will be a soccer player? (2)
3.3. What is the probability that a boy chosen randomly will be a rugby player? (2)
[9]
Soccer Rugby Total
Grade 8 35
Grade 9 10 28
Total 25
(c) Gauteng Department of Education, 2013
57
GAUTENG DEPARTMENT OF EDUCATION SENIOR SECONDARY INTERVENTION PROGRAMME MATHEMATICAL LITERACY GRADE 12 SESSION 5 SELF STUDY (TEACHER NOTES)
SECTION D: SOLUTIONS TO HOMEWORK
QUESTION 1: 20 minutes
1.1 Probability
a) Red = 120
0 = 0 (3)
b) Not white = 120
72 =
5
3 (3)
c) Green or blue = 120
33
120
39 =
120
72 =
5
3 (4)
1.2. (a) Probability = 4
1
Toss 1 Toss 2 Outcomes
H HH
H
T HT
H TH
T
T TT (7)
(c) Probability = 4
2 =
2
1 (3)
[20] QUESTION 2
Graph B OR Q600 The graph was drawn with the months reversed. (3) [3]
(c) Gauteng Department of Education, 2013
58
GAUTENG DEPARTMENT OF EDUCATION SENIOR SECONDARY INTERVENTION PROGRAMME MATHEMATICAL LITERACY GRADE 12 SESSION 5 SELF STUDY (TEACHER NOTES)
Page 83 of 133
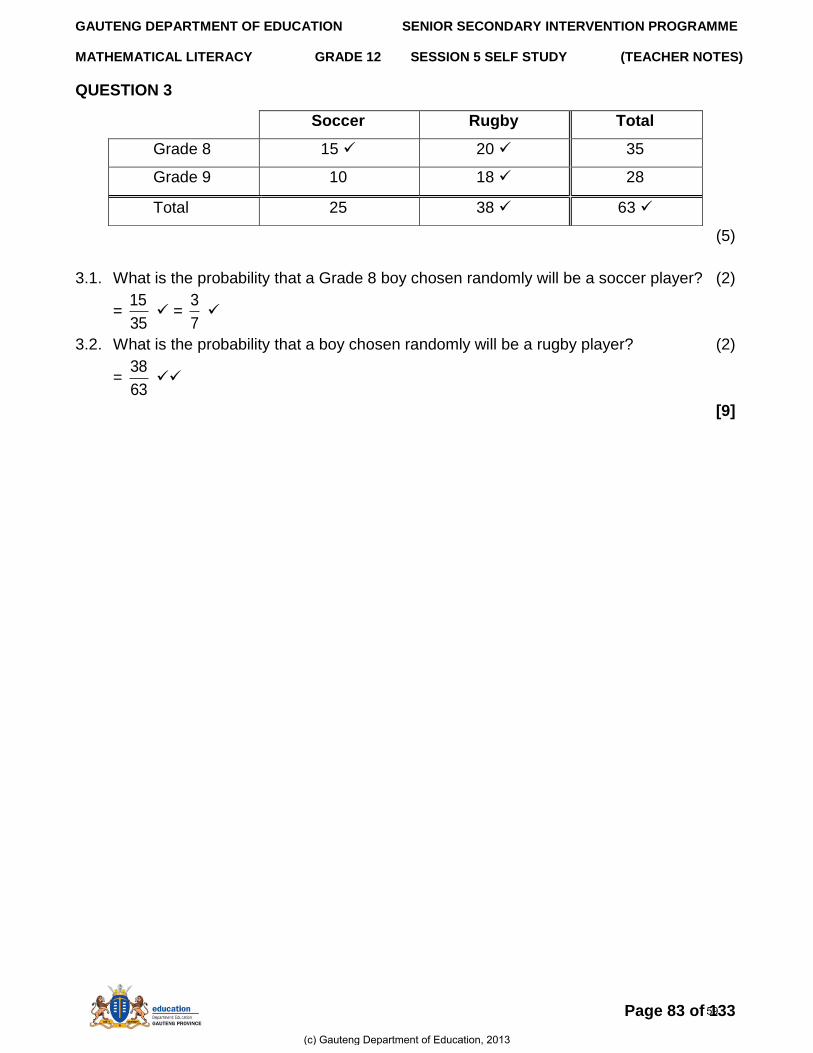
QUESTION 3
(5)
3.1. What is the probability that a Grade 8 boy chosen randomly will be a soccer player? (2)
= 35
15 =
7
3
3.2. What is the probability that a boy chosen randomly will be a rugby player? (2)
= 63
38
[9]
Soccer Rugby Total
Grade 8 15 20 35
Grade 9 10 18 28
Total 25 38 63
(c) Gauteng Department of Education, 2013
59