Embed Size (px)
Citation preview

British Social Attitudes 30 | Government spending and welfare
NatCen Social Research
33
Government spending and welfareChanging attitudes towards the role of the stateIt is often argued that changes in Britain over the last 30 years have led to the public becoming more individualistic, resulting in a decline in ‘collectivist’ attitudes – with the public becoming less supportive of the role of government in social protection. On the other hand, attitudes to government responsibilities, spending and welfare could logically be expected to behave in a cyclical way – responding to changes in economic circumstances for example. How can we explain the changes in attitudes that have taken place over the last 30 years, in the light of these theories and, more recently, in relation to an ongoing programme of welfare reform?
Government responsibilitiesGenerally speaking, the last 30 years have not seen a shift to a less collectivist Britain – the public’s views on taxation and social protection are very similar to those seen in 1983. However there have been shifts in attitudes towards social welfare for disadvantaged groups in society.
Consistently high proportions say it should be the government’s responsibility to provide a decent standard of living for the old (96%), and to provide health care for the sick (97%).
But there has been a decrease in the proportion believing it is the government’s responsibility to provide a decent standard of living for the unemployed, with 59% saying this down from 81% in 1985. Much of this change occurred during Labour’s time in power.
Welfare: a change of direction?In 2012 there is some sign of the trend towards negative views of the unemployed starting to reverse.
The most recent British Social Attitudes survey finds a public more likely to support extra spending on benefits, with 34% saying this compared with 28% in 2011.
There are also signs of a more sympathetic view of benefit claimants, with more people than in 2011 agreeing that cutting benefits would damage too many people’s lives (47% up from 42% in 2011), and fewer people saying that benefits are too high and discourage work (51% down from 62% in 2011).
97%
81%
42%
47%
59%
1985
2011
2012
2000
28% 34%
2011 2012
96%
PENSION BOOK
59%2012

British Social Attitudes 30 | Government spending and welfare
NatCen Social Research
34
Introduction
In this chapter, we consider public attitudes to the role of government in the economy, the provision of public services and social security, and analyse how these have changed over time. In particular, we address the question of whether the British public has become less ‘collectivist’ over the past three decades, in terms of the extent of its support for key publicly-funded services and the provision of welfare benefits to different groups in the population.
Throughout this report we set out the many and varied ways in which Britain has changed over the last 30 years. One much discussed consequence of these changes has been that many people have more scope now to make their own choices about how they wish to live than would have been the case 30 years ago. But what impact might these changes have had on public attitudes towards the role of government? If individualism gives people more freedom to choose for themselves, perhaps they may be less willing to show solidarity with those whose experiences differ markedly to their own? As a result, we might find declining support for a welfare state that shares the risks of poor health or economic misfortune, or engages in substantial income or wealth redistribution.
Alternatively, there might be other important influences on public attitudes towards the government’s role in the economy and its provision of public services. These might behave in a cyclical, rather than a secular, manner. In particular, attitudes to government provision could be expected to be influenced by economic circumstances that shape the extent to which individuals view government provision as necessary and its recipients as deserving. Equally, reform of the welfare state has become a central and divisive issue in contemporary British politics. Attitudes are likely to be influenced by government policy debates and the extent to which people regard policy as sufficient in delivering an ‘ideal’ level of social protection. In other words, we might expect to find that attitudes are mediated by the public’s current and recent experiences of different levels of provision, and the debates that surround this. In this chapter we seek to identify how best to account for changing attitudes to the role of government over the past three decades.
We also consider more recent changes in attitudes and how these might be understood in the context of the recent experience of recession and an ongoing programme of government welfare reform. As part of its fiscal consolidation measures, the coalition government has introduced a number of reforms to social security entitlements and levels of benefit payments, many of which have been subject to fierce political debate. From April 2013, a cap of £26,000 a year has been placed on the total value of benefits that can be claimed by families, affecting some 40,000 households. Child Benefit has been withdrawn from higher income earners and its rate frozen. The government has broken with the historic practice of uprating core working age benefits by Consumer Price Inflation and restricted the level instead to one per cent in 2013/2014, while the main elements of working tax credits and childcare support have been held constant in cash terms. Tenants in social housing with spare bedrooms now receive lower rates of Housing Benefit, while the national system of Council Tax Benefit has been replaced with localised assistance. Disability Living Allowance for working age claimants has been replaced by a new Personal Independence Payment and claimants of Employment Support Allowance are being assessed for their work capabilities, with those deemed ready for work transferred to Job Seeker’s Allowance. In addition, a major new system of integrated benefits and credits – the Universal Credit – is being slowly introduced.
Authors
Nick Pearce and Eleanor TaylorNick Pearce is director of the Institute for Public Policy Research (IPPR). Eleanor Taylor is a Senior Researcher at NatCen Social Research, and Co-Director of the British Social Attitudes survey series

British Social Attitudes 30 | Government spending and welfare
NatCen Social Research
35
Although each of these reforms has proved politically contentious, the coalition government claims that it has broad public support for its measures to reduce social security expenditure, particularly for working age claimants. Opinion polls consistently show that large majorities of the public believe that many social security benefits are claimed by people who do not deserve them. Unlike support for the National Health Service, popular attachment to the welfare state appears to have weakened considerably over the last 30 years. In much popular discourse, the welfare state – once a towering achievement of the post-war Beveridge generation – has become a byword for social breakdown, irresponsibility and mistrust within communities.
Will this erosion of popular support for welfare spending survive the cuts to benefit entitlements? In previous recessions, public attitudes have tended to become more sympathetic to benefit recipients as the impact of joblessness and income loss becomes more widespread. Yet last year’s British Social Attitudes report found little evidence of that happening this time round, despite the depth and longevity of the economic crisis. The hardening in public attitudes towards welfare spending, although far from uniform, showed little sign of abating (Clery, 2012). The coalition government has been emboldened by this popular mood to continue implementing its welfare reform agenda and even to heighten the political rhetoric accompanying it.
The second aim of this chapter is therefore to examine whether this apparent permafrost of hardened public attitudes has started to thaw as benefit cuts and other welfare reforms begin to bite. We begin by examining attitudes to overall levels of taxation and public spending, the role of government in providing public services and social security, and attitudes to whether government should reduce inequality in the income distribution. We then examine public attitudes to particular benefits and groups of benefit claimants, before probing the question of whether these attitudes have started to change, and if so, among which groups in society. In addition, we relate these findings to recent academic literature on the evolution of welfare states in the European Union.
What should the role of government be?
We begin by considering the public’s views on levels of government taxation and spending and what it thinks the government’s responsibilities in specific areas of social protection and the economy should be. If the British public is less collectivist than it has been in the past, we might expect to see a long-term decline in support for government taxation and spending, and a restriction in the activities regarded as governmental responsibilities.
Government taxation and spendingFirst, we examine responses to a long-standing question about the role of government, framed in terms of the extent of taxation and spending. Since 1983, we have asked respondents to choose one of three courses of action for the government:
Reduce taxes and spend less on health, education and social benefits
Keep taxes and spending on these services at the same level as now
Increase taxes and spend more on health, education and social benefits
Last year’s British Social Attitudes report found little evidence of increased sympathy towards benefit recipients despite the depth and longevity of the economic crisis

British Social Attitudes 30 | Government spending and welfare
NatCen Social Research
36
While we might expect a public which has become less collectivist to be less supportive of government taxation and spending than it has been in the past, Figure 2.1 in fact reveals that responses to this question in 2012 are very similar to when the British Social Attitudes survey was first conducted in 1983. In both years roughly a third of the public express support for increased taxes and higher public spending (32 and 34 per cent respectively); a little over half want the levels of tax and spend kept where they are (53 and 54 per cent respectively); and only a small minority (nine and six per cent respectively) want both taxes and public spending cut.
However, there have been some notable shifts in attitudes during the past three decades. While support for increased taxes and spending rose in the 1980s and 1990s, the growth in expenditure during the period of the New Labour government, especially during its second and third terms of office (2001–2010) appeared to satisfy the desire of at least a third of the public to invest more in public services. This trend was interpreted in previous British Social Attitudes reports as a reaction to increased public spending during Labour’s period in power (Curtice, 2010). In contrast, the public’s appetite for a radical scaling back of taxes and spending has been consistently low since the early 1980s. There is very little public support for significant cuts to key public services and social protection in return for lower taxes. While the majority of the public appear supportive of maintaining or increasing levels of government taxation and spending, it appears that fluctuations in this support are cyclical and tend to occur in response to adjustments in government activity.
Figure 2.1 Attitudes to tax and spend, 1983–2012
10%
20%
30%
40%
50%
60%
70%
80%
100%
90%
87 88 89 90 91 92 93 94 95 96 97 98 99 00 01 02 03 04 05 06 07 08 09 10 11 120%
83 84 85 86
Keep taxes and spending at the same level Increase taxes and spend moreReduce taxes and spend less
The data on which Figure 2.1 is based can be found in the appendix to this chapter
Government responsibilities and priorities for spendingAs well as being influenced by levels of taxation and spending, the public’s view of the extent to which government should tax and spend may be underpinned by people’s perceptions of what the government’s role should be in public life. To examine views on this matter and whether they have changed over time, we turn to a set of questions asked a number of times on the British Social Attitudes survey since 1985. Specifically, respondents are asked:

British Social Attitudes 30 | Government spending and welfare
NatCen Social Research
37
On the whole, do you think it should or should not be the government’s responsibility to…
… reduce income differences between the rich and the poor … provide a job for everyone who wants one… provide a decent standard of living for the unemployed … provide decent housing for those who can’t afford it … provide health care for the sick … provide a decent standard of living for the old … keep prices under control
[Definitely should be, probably should be, probably should not be, definitely should not be]
The data, presented in Table 2.1, indicate that public perceptions of government responsibility in relation to different areas have not evolved in a consistent way over the past three decades, suggesting that there has not been a universal shift in views regarding the nature and extent of the government’s responsibilities. We see long-standing and near universal public support for the proposition that it is the government’s responsibility to provide health care for the sick and a decent standard of living for older people – with almost all respondents, across the lifetime of the survey, thinking these should be government responsibilities. These attitudes underpin consistently high levels of public commitment to the National Health Service (see the Health chapter) and the basic State Pension (Clery, 2012 and Table 2.1). However, views on other areas of government responsibility have varied over time.
The public feels strongly that the government should be responsible for keeping prices under control. A higher proportion, almost nine in ten, view this as a government responsibility compared with those who believe that it should be the responsibility of government to provide employment for everyone who wants to work (slightly less than two-thirds express this view). Support for both propositions has fluctuated over time, both falling to a low point in 2006 and subsequently increasing, in 2012, to levels last seen in the 1990s. While the proportion thinking the government should be responsible for reducing differences in income between the rich and the poor is identical to that recorded in 1985, almost seven in ten, agreement with this stance has also fluctuated over time, though not in a consistent direction. However, when it comes to the provision of social security to particular groups in the population, support for government responsibility has declined. This is particularly marked in relation to the unemployed. In the 1980s, a large majority of people (more than eight in ten) believed it was the job of government to provide a decent standard of living for the unemployed. By 1996, support for this view had fallen to less than three-quarters and, by 2006, to just half. This proportion increased somewhat to 59 per cent in 2012 – and we shall explore whether this is indicative of broader trends later in this chapter – but it is still markedly lower than that recorded three decades ago. At the same time, we see a less marked decline in support for the proposition that government has a responsibility to provide decent housing for people who cannot afford it, from nine in ten in 1990 to slightly more than eight in ten now. These trends suggest that the public is less collectivist in relation to the needs of certain disadvantaged groups than it has been in the past – although this shift in views does not have appear to have affected attitudes to wider government responsibilities.
We see near universal support for the proposition that it is the government’s responsibility to provide health care for the sick and a decent standard of living for older people

British Social Attitudes 30 | Government spending and welfare
NatCen Social Research
38
Table 2.1 Views on government responsibilities, 1985–2012
% saying it should be the government’s responsibility to … 85 89 90 96 00 02 06 12
… reduce income differences between the rich and the poor 69 72 71 63 n/a n/a 63 69
… provide a job for everyone who wants one 68 62 60 65 76 72 52 62
… provide a decent standard of living for the unemployed 81 83 77 73 n/a n/a 50 59
… provide decent housing for those who can’t afford it n/a n/a 90 84 n/a n/a 81 81
… provide health care for the sick 98 98 98 97 98 96 95 97
… provide a decent standard of living for the old 97 98 97 95 97 95 94 96
… keep prices under control 91 89 87 82 95 91 80 89
Weighted base 1502 1315 1163 993 2015 1928 932 950Unweighted base 1530 1321 1197 989 2008 1911 930 956
n/a = not asked
We might expect to see these trends reflected in public priorities for extra government spending. Since its inception, the British Social Attitudes survey has asked respondents to identify their first and second choices for extra government spending. In Table 2.2 we see that, over the last three decades, a majority of people consistently choose health spending as one of their top two priorities within the overall envelope of public spending (71 per cent in 2012) – reflecting the near universal support for the government’s role in providing health care for the sick, noted earlier. Education is the second most popular choice, selected by just over six in ten in 2012, with other functions attracting much lower levels of support. While spending on education and health has been a public policy priority since the 1980s, there have been interesting fluctuations in the priority given to other, less popular, areas of government spending. An effect of the financial crisis has been to increase public support for extra spending on help for industry, which is now higher than it was in the late 1980s, albeit at only 15 per cent, while support for extra government spending on police and prisons has fallen by almost half since the start of the economic crisis in 2008 (from 19 per cent to 10 per cent).
Notably, only a very small proportion of the public – one in twenty – now support increased spending on social security benefits, a reduction from 13 per cent in the early 1990s. This figure has not increased in recent years, despite the recession and prolonged economic stagnation, reflecting the falling numbers who believe that the provision of a decent standard of living for the unemployed is a government responsibility (Table 2.1). Similarly, we see that support for extra government spending on housing has declined since 1983, when 20 per cent identified this as one of their top two priorities; this has fallen to 15 per cent in 2012. This decline may be linked to the reduction in support for the government providing decent housing for those who cannot afford it (Table 2.1).
Only one in twenty now support increased spending on social security benefits

British Social Attitudes 30 | Government spending and welfare
NatCen Social Research
39
Table 2.2 Highest and second highest priority for extra government spending, 1983–2012
83 87 90 93 97 00 03 06 08 09 10 11 12
% % % % % % % % % % % % %
Health 63 78 81 70 78 81 79 75 72 73 71 68 71
Education 50 55 63 57 70 64 63 61 55 59 64 61 61
Help for industry 29 11 6 14 8 5 4 4 5 11 10 12 15
Housing 20 24 20 22 11 11 10 12 14 14 13 14 15
Police and prisons 8 8 7 11 10 10 12 17 19 12 11 15 10
Defence 8 4 2 3 3 3 3 6 8 9 8 10 8
Public transport 3 1 6 4 6 10 13 11 11 8 7 6 7
Roads 5 3 4 4 3 6 6 5 7 6 7 6 5
Social security benefits 12 12 13 13 9 7 6 5 5 4 5 4 5
Weighted base 1719 2766 2698 2945 1355 2292 4432 3240 2229 3421 3297 3311 3248
Unweighted base 1761 2847 2797 2945 1355 2302 4432 3228 2184 3421 3297 3311 3248
Percentages sum the responses to two questions, so will add to more than 100 per cent
Thus far we have seen that, overall, the British public does not appear to have become less collectivist over time in its support for government activities and spending. Levels of support for government taxation and spending are very similar to those witnessed three decades ago, with fluctuations in the intervening period clearly being linked to trends in government activity in this area. Attitudes towards government responsibility are also broadly similar to those recorded three decades ago. However, we see markedly reduced support for the government’s role in providing support for certain disadvantaged groups, particularly the unemployed, and this is reflected in lower priority being given to extra spending in related areas. Given this change, we now turn to explore further attitudes to the government’s role in providing support for these groups in general, alongside the related issues of income inequality and income redistribution.
The income gap and redistribution
In the previous section we found that a majority of people, more than two-thirds, believe it should be the government’s responsibility to reduce income differences between the rich and the poor, with levels of support remaining similar to those measured three decades ago. Yet support for the government’s role in providing a decent standard of living for the unemployed and, to a lesser extent, decent housing for those who cannot afford it, has declined over time – even though these activities could have the effect of marginally narrowing the income gap. To explore this apparent contradiction further, we first consider levels of concern about income inequality and support for the government’s redistributive role. We explore how views on these matters inform each other and influence attitudes towards the government’s role in providing welfare.
Concern about income inequality and support for redistribution Since the mid-1980s, we have asked the public whether they think “the gap between those with high incomes and those with low incomes” is too large, about right or too small. To measure support for the government having a redistributive role, we have additionally asked people to identify how far they agree with the following statement:
We see markedly reduced support for the government’s role in providing support for certain disadvantaged groups, particularly the unemployed
British Social Attitudes 30 | Government spending and welfare
NatCen Social Research
40
The government should redistribute income from the better off to those who are less well off
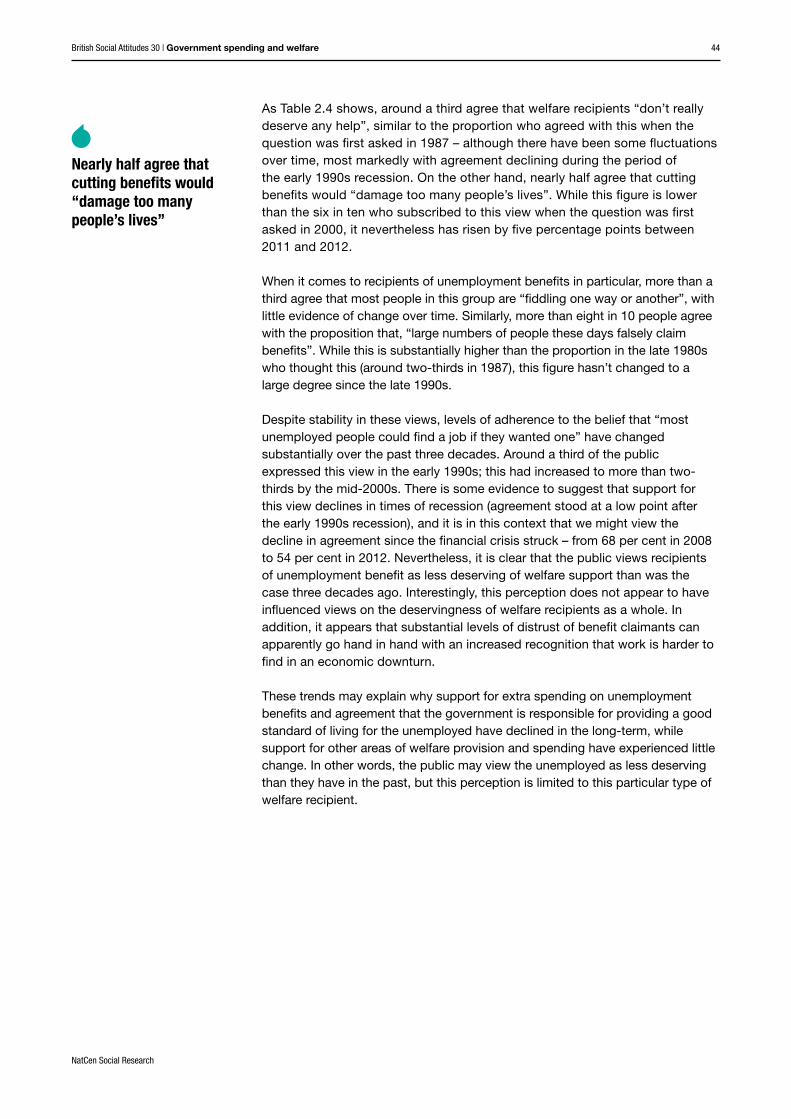
In Figure 2.2 we see that since 1983 there has been a high level of concern about income inequality and that this has recently risen. In 2010, three-quarters of the public agreed with the idea that the income gap was too large – slightly higher than the proportion who stated this view when the question was first asked in 1983, although there has been some fluctuation in support in the intervening period. By 2012, this figure had risen to more than eight in ten, with just 14 per cent agreeing that the gap is “about right”. This rise may reflect well-publicised cases of bankers’ bonuses and big increases in chief executive remuneration packages in recent years, as well as the so-called ‘Shareholder Spring’ of 2012, during which institutional investors at Barclays, Aviva and other big firms rejected CEO pay deals. Moreover, there is some evidence that the proportion of people holding the view that the income gap is too large changes in a cyclical way, increasing during and after periods of recession, where the public are more likely to have their own incomes squeezed and to witness the impact of earnings loss and widespread unemployment. Certainly this appeared to be the case in the aftermath of the early 1990s recession, where agreement with this view rose to a high of 87 per cent.
While more than eight in ten people think the income gap is currently too large, and as we saw in Table 2.1 nearly seven in ten believe the government has a responsibility to reduce income differences, only a little over four in ten agree that the government should redistribute income from the better off to those who are less well off. In a previous analysis of British Social Attitudes data, Rowlingson et al. (2010) suggested there is a negative reaction to the “r word” itself, which may underpin this substantially lower level of support.
While this proportion is higher than in the mid-2000s, it remains lower than the 48 per cent recorded in the depth of the last recession in 1991 (though similar to the proportion who expressed this view in 1986, when the question was first asked). However, for the first time since 1995, we see a significantly higher proportion supporting rather than opposing government redistribution (41 per cent compared with 30 per cent). This suggests that the British public has not become less collectivist over time in its support for the government having a redistributive role, perhaps because, as suggested above, support for such a strategy primarily fluctuates in a cyclical way, increasing in times of economic hardship.
Figure 2.2 Attitudes towards income inequality and redistribution, 1983–2012
% saying the income gap is too large % agree the government should redistribute income
87 88 89 90 91 92 93 94 95 96 97 98 99 00 01 02 03 04 05 06 07 08 09 10 11 1283 84 85 86
10%
20%
30%
40%
50%
60%
70%
80%
100%
90%
0%
The data on which Figure 2.2 is based can be found in the appendix to this chapter
8 in 10say the income gap is too large

British Social Attitudes 30 | Government spending and welfare
NatCen Social Research
41
We have seen that there is a widespread and enduring view that the income gap is too large, and considerable support for the proposition that the government should reduce income differences. We might anticipate that these views would translate into support for the government’s role in providing social security. However, we have already noted a long-term decline in support for the government’s role in providing a decent standard of living for the unemployed and a decent standard of housing for those who cannot afford it – two activities that could be viewed as key aims of the welfare state. In the remainder of this chapter, we consider how public attitudes to the government’s role as a provider of welfare are changing over time – and whether these reflect either the enduring concern about income inequality and support for its reduction, or the declining support for the government’s role in supporting the most disadvantaged sections of society. Further, we consider the direction of recent changes in attitudes and what this might mean for the government’s welfare reform programme.
Welfare benefits
Since its inception, the British Social Attitudes survey has asked a range of questions to measure the public’s support for spending on welfare and people’s views of welfare recipients. By examining these areas in turn, we can reflect again on whether or not the public has become less collectivist in its attitudes towards welfare over the past three decades.
Spending on benefitsWe first consider public attitudes to welfare spending. As shown in Table 2.2, the public is less likely now to identify spending on “social security benefits” as one of its top two priorities for extra government spending, with 12 per cent selecting this option in 1983 compared with just five per cent now. To measure support for welfare spending, we have also regularly included a question on British Social Attitudes asking the public whether they agree or disagree that:
The government should spend more money on welfare benefits for the poor, even if it leads to higher taxes
It is immediately apparent from Figure 2.3 that support for additional spending on welfare benefits for the poor is considerably lower now than it was when the question was first asked in 1987; at that point, more than half supported extra spending on welfare benefits, compared with around one third now. Much of this decline occurred in the 1990s, from almost six in ten (58 per cent) in 1991 advocating this, compared with less than three in ten (28 per cent) in 2011. In 2012, however, we see another change of direction, with 34 per cent of people supporting extra spending (an increase of six percentage points). While this overall trend reflects a hardening of attitudes through the 2000s and even through the 2008 recession, data for 2012 may indicate a break in the long-term trend, although it should be noted that similar shifts in opinion in recent years have proved temporary. In either case, what is clear is that the public are much less collectivist now in terms of their support for extra welfare spending than they were three decades ago.
In 2012 we see another change of direction, with 34 per cent of people supporting extra spending

British Social Attitudes 30 | Government spending and welfare
NatCen Social Research
42
Figure 2.3 Views on government spending on benefits, 1987–2012
87 88 89 90 91 92 93 94 95 96 97 98 99 00 01 02 03 04 05 06 07 08 09 10 11 12
10%
20%
30%
40%
50%
60%
70%
80%
0%
% agreeing the government should spend more on welfare benefits
The data on which Figure 2.3 is based can be found in the appendix to this chapter
In addition to measuring generic support for welfare spending, we have regularly asked respondents to identify their first and second priorities for extra spending on welfare; the data obtained in 2012 and at a number of points over the lifetime of the survey are presented in Table 2.3.
In line with previous years, retirement pensions continue to be the highest priority for extra spending on benefits, selected by more than seven in ten, followed by benefits for disabled people (selected by around six in ten). Both of these have historically been high public priorities compared with benefits for other groups, although support for retirement pensions is now somewhat higher than it was in 1983 and for much of the subsequent decade. Child benefits rose up the hierarchy of priorities from the mid-1980s onwards; however, in 2012, only slightly more than one third chose to prioritise them, a reduction of seven percentage points since 2010. This might reflect public attention to the issue of means-testing of Child Benefit. Alternatively, it could reflect media stories about benefit payments to large families and public support for cutting these benefits.
It is among those benefit types which have traditionally been lower priorities for extra spending that we observe the most substantial long-term changes. While one third of the public in 1983 prioritised benefits for the unemployed for extra spending, only slightly more than one in ten do so now – reflecting the earlier finding that providing a decent standard of living for the unemployed is less likely to be viewed as a government responsibility than it has been in the past. However, the prolonged economic crisis does appear to have increased the level of support for extra spending on benefits for the unemployed in the short-term, by five percentage points since 2007. A similar trend can be observed in the recession of the early 1990s, where of the proportion of people prioritising extra spending on unemployment benefits increased by ten percentage points between 1991 and 1993. This suggests that, while support for increased spending on unemployment benefits is in long-term decline, this decline can be abated in difficult economic circumstances. This reflects the finding of a recent analysis of British Social Attitudes data which concluded that, while attitudes to welfare are generally less clearly linked to economic circumstances than they have been in the past, this does remain the case for attitudes to the unemployed (Clery et al., 2013).
While one third of the public in 1983 prioritised benefits for the unemployed for extra spending, one in ten do so now

British Social Attitudes 30 | Government spending and welfare
NatCen Social Research
43
It is also interesting to note that support for extra spending on benefits for single parents remains low, at 14 per cent, a decline from the 21 per cent who prioritised this area for extra spending in 1983. This may reflect decreased support for the government’s role in providing support for disadvantaged groups such as the unemployed and those who cannot afford decent housing noted earlier – assuming that the public view single parents in this light.
Table 2.3 First and second priorities for extra spending on welfare, 1983–2012
83 84 85 86 87 89 90 91 93 94
% % % % % % % % % %
Retirement pensions 64 66 64 65 68 67 65 63 63 64
Child benefits 20 22 23 23 24 30 32 35 31 34
Benefits for the unemployed 32 35 31 33 33 25 21 22 32 26
Benefits for disabled people 58 55 58 58 54 60 59 58 51 57
Benefits for single parents 21 16 18 18 16 17 18 19 18 14
None of these 1 1 1 * 1 * 1 * 1 1
Weighted base 1719 1645 1769 3066 2766 2930 2698 2836 2945 1187Unweighted base 1761 1675 1804 3100 2847 3029 2797 2918 2945 1167
95 96 00 01 03 05 07 10 12
% % % % % % % % %
Retirement pensions 68 71 74 76 79 80 78 72 72
Child benefits 33 30 33 35 38 39 42 42 35
Benefits for the unemployed 25 26 13 12 10 8 7 11 12
Benefits for disabled people 58 54 61 57 54 53 54 53 59
Benefits for single parents 12 12 15 14 16 15 15 14 14
None of these 1 1 1 1 1 1 1 2 2
Weighted base 1199 3620 3426 3287 3276 3210 3082 3297 3248Unweighted base 1234 3620 3426 3287 3272 3193 3094 3297 3248
Percentages sum the responses to two questions, so will add to more than 100 per cent
To probe this question further, we next turn to examine a series of long-standing questions about benefit recipients.
Views of welfare recipientsSince 1987 we have asked whether people agree or disagree with each of the following statements about welfare recipients in general and people in receipt of unemployment benefits specifically:
Cutting benefits would damage too many people’s lives
Many people who get social security don’t really deserve any help
Around here, most unemployed people could find a job if they really wanted one
Most people on the dole are fiddling in one way or another
Large numbers of people these days falsely claim benefits
British Social Attitudes 30 | Government spending and welfare
NatCen Social Research
44
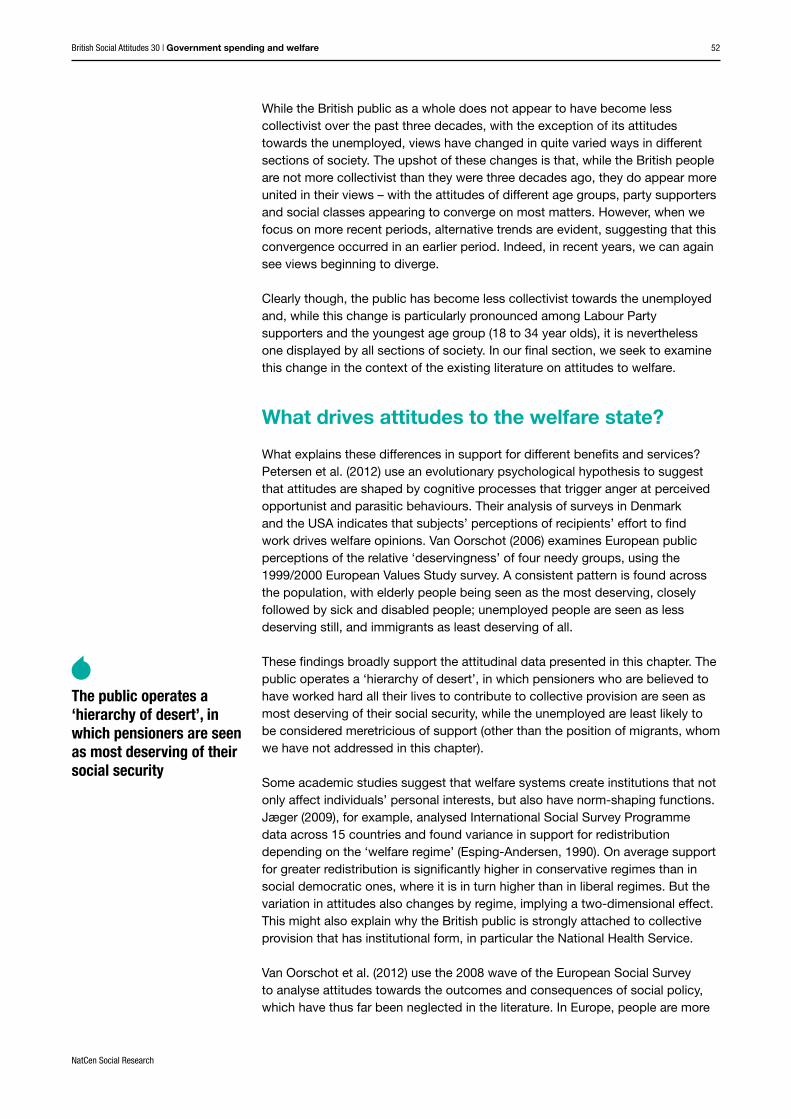
As Table 2.4 shows, around a third agree that welfare recipients “don’t really deserve any help”, similar to the proportion who agreed with this when the question was first asked in 1987 – although there have been some fluctuations over time, most markedly with agreement declining during the period of the early 1990s recession. On the other hand, nearly half agree that cutting benefits would “damage too many people’s lives”. While this figure is lower than the six in ten who subscribed to this view when the question was first asked in 2000, it nevertheless has risen by five percentage points between 2011 and 2012.
When it comes to recipients of unemployment benefits in particular, more than a third agree that most people in this group are “fiddling one way or another”, with little evidence of change over time. Similarly, more than eight in 10 people agree with the proposition that, “large numbers of people these days falsely claim benefits”. While this is substantially higher than the proportion in the late 1980s who thought this (around two-thirds in 1987), this figure hasn’t changed to a large degree since the late 1990s.
Despite stability in these views, levels of adherence to the belief that “most unemployed people could find a job if they wanted one” have changed substantially over the past three decades. Around a third of the public expressed this view in the early 1990s; this had increased to more than two-thirds by the mid-2000s. There is some evidence to suggest that support for this view declines in times of recession (agreement stood at a low point after the early 1990s recession), and it is in this context that we might view the decline in agreement since the financial crisis struck – from 68 per cent in 2008 to 54 per cent in 2012. Nevertheless, it is clear that the public views recipients of unemployment benefit as less deserving of welfare support than was the case three decades ago. Interestingly, this perception does not appear to have influenced views on the deservingness of welfare recipients as a whole. In addition, it appears that substantial levels of distrust of benefit claimants can apparently go hand in hand with an increased recognition that work is harder to find in an economic downturn.
These trends may explain why support for extra spending on unemployment benefits and agreement that the government is responsible for providing a good standard of living for the unemployed have declined in the long-term, while support for other areas of welfare provision and spending have experienced little change. In other words, the public may view the unemployed as less deserving than they have in the past, but this perception is limited to this particular type of welfare recipient.
Nearly half agree that cutting benefits would “damage too many people’s lives”

British Social Attitudes 30 | Government spending and welfare
NatCen Social Research
45
Table 2.4 Attitudes towards people receiving welfare benefits, 1987–2012
87 89 91 93 94 95 96 98 99 00 01
% agree cutting benefits would damage too many people’s lives n/a n/a n/a n/a n/a n/a n/a n/a n/a 59 58
% agree many people who get social security don’t really deserve any help 31 28 26 24 26 30 28 32 27 31 32
% agree around here, most unemployed people could find a job if they really wanted one 41 52 38 27 32 38 39 54 56 60 63
% agree most people on the dole are fiddling in one way or another 32 31 28 31 34 33 35 28 36 40 35
% agree large numbers of people these days falsely claim benefits 67 65 69 n/a 72 n/a n/a 83 84 77 79
Weighted base 1243 2529 2428 2595 2957 3145 3085 3000 2478 2991 2821Unweighted base 1281 2604 2481 2567 2929 3135 3103 3000 2450 2980 2795
02 03 04 05 06 07 08 09 10 11 12
% agree cutting benefits would damage too many people’s lives 53 54 48 47 47 44 45 47 42 42 47
% agree many people who get social security don’t really deserve any help 36 38 39 40 29 36 37 34 35 35 35
% agree around here, most unemployed people could find a job if they really wanted one 65 66 69 69 67 67 68 55 54 56 54
% agree most people on the dole are fiddling in one way or another 38 39 41 39 32 39 36 34 35 37 37
% agree large numbers of people these days falsely claim benefits 81 78 84 n/a 83 n/a 82 n/a 84 n/a 81
Weighted base 2929 881 2610 2697 2813 2663 2956 963 2791 2845 2867Unweighted base 2900 873 2609 2699 2822 2672 3000 967 2810 2841 2855
n/a = not asked
To explore this further, we ask respondents to choose which of the following two statements comes closest to their view:
Benefits for unemployed people are too low and cause hardship,
or,
benefits for unemployed people are too high and discourage them from finding jobs
The responses obtained, presented in Figure 2.4, indicate a long-term shift towards the view that benefits are too high and discourage work (35 per cent in 1983, compared with 51 per cent in 2012). The increase in the belief that benefits are too high began in the late 1990s when Labour came into power,

British Social Attitudes 30 | Government spending and welfare
NatCen Social Research
46
and continued until 2008. Previous analyses of British Social Attitudes data have interpreted this trend as evidence that the views of the public, and of Labour Party supporters in particular, have moved in line with the tougher stance adopted by the Labour Party from the mid-1990s towards out-of-work benefits for working age claimants (Curtice, 2010; Clery, 2012). However, we cannot be certain whether the views of Labour Party supporters changed in response to the changing policy direction of their party, or vice versa. It should also be borne in mind that the composition of the group identifying themselves as Labour Party supporters would not have been static throughout this period.
Attitudes towards unemployment benefits perceptibly shifted in 2012, however, as the proportion saying that benefits for the unemployed are “too high and discourage work” fell by 11 percentage points to 51 per cent. This reflects the increase in support for extra spending on the unemployed, and suggests that we may be seeing the start of a decline in negative attitudes towards this group of benefit recipients, likely to be driven by current experiences of economic hardship. Nevertheless, the fact remains that attitudes to the unemployed and the role of government in providing support to them, across a range of measures, are much less sympathetic now than they were three decades ago – suggesting, again, that the public have become less ‘collectivist’ in relation to this group.
Figure 2.4 Attitudes towards level of unemployment benefits, 1983–2012
Too low and cause hardship Too high and discourage work Neither
84 85 86 87 88 89 90 91 92 93 94 95 96 97 98 99 00 01 02 03 04 05 06 07 08 09 10 11 1283
10%
20%
30%
40%
50%
60%
70%
80%
0%
The data on which Figure 2.4 is based can be found in the appendix to this chapter
Although public attitudes to the unemployed are less collectivist than three decades ago, there are visible signs of change since 2011, with attitudes towards spending on unemployment benefits and the deservingness of recipients becoming less negative. To understand this specific pattern of change, we now consider whether it has occurred across the public as a whole or is confined to specific sections of society, and the likely explanations for this.
Who has changed their mind?
Although we have not witnessed overall long-term changes in concern about the income gap or in public support for redistribution, the stability in views at a societal level may conceal patterns of change within different sections of society. We therefore begin this section by considering whether different groups within society adopt different stances to these issues than they did three
The proportion saying that benefits for the unemployed are “too high and discourage work” fell by 11 percentage points to 51 per cent

British Social Attitudes 30 | Government spending and welfare
NatCen Social Research
47
decades ago. Previous analyses of British Social Attitudes data, focusing on trends in the views of different generations and subgroups of the population, have linked the hardening of attitudes to some benefits and benefit claimants with disproportionate changes among two specific groups: Labour supporters and young people (Clery, 2012; Clery et al., 2013; MORI, 2012). In this section we explore differences between these groups and the wider population as well as the influence of socio-economic group on people’s views towards spending and welfare (see the Social class chapter for an in-depth discussion of the relationship between class and attitudes).
The income gap and redistributionTable 2.5 presents the proportions of different groups, defined by age, occupational class and party affiliation, who agree that the income gap is “too large”, and indicates how their views have changed between 1987 and 2012.[1] Clearly, the views of different groups have changed in varied ways over the past three decades, with the opinions of those who are oldest and who support the Conservative Party having changed the most, while there is no clear pattern of association with socio-economic group. Concern about the income gap has increased among those in the oldest age group by 13 percentage points, while among the youngest age group this has declined by five percentage points. Agreement with the view that the income gap is too large has increased by nine percentage points among Conservative Party supporters, while remaining stable for supporters of the two other main parties. As a result, the difference between the views of Conservative and Labour Party supporters has reduced since the 1980s, from 21 percentage points to 12 percentage points in 2012. As the two characteristics associated with the greatest degree of attitude change (being older and being a Conservative Party supporter), are known to be correlated, it is not possible to conclude which is driving the narrowing of views on inequality with the rest of the population. It is also worth noting that, between 2007 and 2012, movement in attitudes for different groups were rather similar – across all age, occupational and party affiliation groups (with the exception of blue-collar workers and Liberal Democrat supporters) there was a rise in those saying that the income gap is too large. This suggests that the key period of divergence in views between different occupational groups, party identifiers and age groups occurred somewhat earlier.
The difference between the views of Conservative and Labour Party supporters has reduced since the 1980s

British Social Attitudes 30 | Government spending and welfare
NatCen Social Research
48
Table 2.5 The income gap is “too large”, by demographic group, 1987–2012[2]
% saying income gap is too large 1987 1995 2003 2007 2012Change
1987–2012
Age
18–34 81 87 74 71 76 -5
35–54 81 89 81 76 84 +3
55–64 77 84 83 81 86 +9
65+ 72 86 76 77 85 +13
Occupational class
Professional/managerial 76 88 80 77 83 +7
Intermediate (white-collar) 81 86 78 76 82 +1
Independent 74 84 67 73 80 +6
Intermediate (blue-collar) 78 94 78 80 80 +2
Working class 80 88 80 75 84 +4
Party affiliation
Conservative 67 79 72 67 76 +9
Labour 88 91 82 81 88 0
Liberal Democrat 87 95 83 86 85 -2
All 79 87 78 76 82 +3
Even more interesting patterns emerge when we examine changes in views on redistribution. Table 2.6 demonstrates a similar pattern of attitudinal change for different age groups as that noted in relation to income inequality above. While in the 1980s the youngest age group was the most likely to support redistribution, it is within this group that we see the biggest decrease in support for redistribution over time (a fall of nine percentage points, while the two oldest age group’s views have remained stable). As a result, in 2012, we see little difference by age in levels of support for government redistribution.
Those in the lowest occupational group have become less likely to support redistribution, despite traditionally exhibiting higher support than other groups. While other occupational groups’ views have remained fairly stable, the proportion among this group agreeing that the government should redistribute income has fallen from 54 per cent in 1987, to 46 per cent in 2012.
Finally, support for redistribution has remained stable among those affiliating with the Liberal Democrats, and increased just by four per cent among those supporting the Conservative Party. However support among Labour Party supporters has declined by 17 percentage points in the same period. Marked differences between Conservative Party supporters and supporters of the other two main parties do remain – although these are somewhat less pronounced than they were in 1987.
As with views on the income gap, the views of different age groups on redistribution have changed in a consistent way since 2007, indicating that divergence in their views occurred earlier than this. However, in the case of redistribution, this is not true for groups defined by occupation or party identification. It is interesting to note a particularly sharp rise (of 15 percentage points, compared with nine or less for each other group) in support for redistribution among those defined as working class over the period of the
Support for redistribution among Labour Party supporters has declined by 17 percentage points

British Social Attitudes 30 | Government spending and welfare
NatCen Social Research
49
financial crisis and recession since 2007. It may be that the views of this group have changed most in this period as they were the most likely to be affected by these events. Support for redistribution has also increased most among Labour and Liberal Democrat Party supporters since 2007 (by 15 and 13 percentage points respectively, compared with a rise of seven percentage points among Conservative Party supporters). This is at odds with the long-term trend noted above, and indicates that the convergence of views witnessed over the past three decades may have begun to reverse.
Table 2.6 Views on income redistribution, by demographic group, 1987–2012[3]
% agreeing that government should redistribute income 1987 1995 2003 2007 2012
Change 1987–2012
Age
18–34 50 43 38 30 41 -9
35–54 42 50 42 31 39 -4
55–64 43 46 46 34 43 0
65+ 42 50 42 34 44 +2
Occupational class
Professional/managerial 40 44 41 32 38 -1
Intermediate (white-collar) 37 42 40 31 40 +3
Independent 36 38 36 33 37 +1
Intermediate (blue-collar) 40 51 46 32 40 0
Working class 54 56 44 31 46 -8
Party affiliation
Conservative 21 25 27 18 25 +4
Labour 69 60 52 38 53 -17
Liberal Democrat 54 49 44 41 54 0
All 45 47 42 32 41 -4
While there has been little change at the societal level, we can therefore conclude that attitudes to income inequality and redistribution have moved in varied directions and at different rates for various subgroups within the population over the past three decades. The views of those who were once the least likely to identify income inequality as an issue or to endorse redistribution have changed the most, becoming far more ‘collectivist’ in nature, while the opposite can be seen to be true for those who once adopted the alternative viewpoint. As a result, the public appears more united in its attitudes to these issues than it did three decades ago although, at a societal level, we have seen that it has not appeared to have moved in a more or less collectivist direction. Nevertheless, more recent change suggests that these long-term trends may be starting to reverse – with the public again becoming less united in its views.
The public appears more united in its attitudes to these issues than it did three decades ago

British Social Attitudes 30 | Government spending and welfare
NatCen Social Research
50
WelfareWe next examine whether attitudes to welfare have changed in similar ways among different sections of the population over time, focusing on those two measures where we have seen most change over the past three decades – namely the declining view that the government should spend more money on welfare benefits for the poor, and the growing perception that unemployment benefits are too high and discourage work.
So far we have seen that the views of the youngest age group, lowest occupational group and Labour Party have become less ‘collectivist’ regarding redistribution. In Table 2.7 we see the changing attitudes of these groups in relation to welfare. Support for increased welfare spending has declined relatively evenly among groups defined by age and occupational class; however, the support of those identifying with the Labour Party has declined more dramatically than of the support of those identifying with the Conservative Party – by 29 percentage points, compared with 18 percentage points for Conservative Party supporters. When we examine the increasingly prevalent view that unemployment benefits are “too high and discourage work” (Table 2.8), we see that support for this standpoint has increased most among the youngest age group and among supporters of the Labour Party (two characteristics which are known to be correlated). The view that unemployment benefits are too high has increased by 31 percentage points among the youngest age group, compared with 17 percentage points among the oldest age group. Among Labour Party supporters this view has increased by 27 percentage points, (compared with a slightly lower 24 percentage points among Conservative supporters, and 22 percentage points among Liberal Democrat supporters). This, together with findings from Table 2.7, reflects findings from other analyses of British Social Attitudes data which show that the development of less collectivist public attitudes towards welfare have been most pronounced among Labour Party supporters, following the policy direction adopted by the party since the mid-1990s – though, as noted previously, we cannot be certain about causality in this instance. Nevertheless, unlike attitudes to income inequality and government redistribution, the view that unemployment benefits are too high has risen in popularity among all subgroups since 1987.
However, when we focus on very recent change, between 2011 and 2012, we see that these patterns are not replicated. While the overall increase of six percentage points in support for more government spending on welfare benefits since 2011 is broadly reflected across all sections of the population, it is interesting to note that it is particularly marked in the highest occupational groups, and less marked in the lowest. This is intriguing, given that lowest occupational groups would have been more likely to require welfare benefits in a period of economic hardship. In contrast, the decline of 11 percentage points between 2011 and 2012 in the proportion agreeing with the view that benefits for unemployed people “are too high and discourage work” occurred relatively evenly across all sections of society, though was considerably less pronounced among the oldest age group, those aged 65 or more. These findings suggest that the long-term trends in subgroups’ attitudes are not necessarily set to continue.
The view thatunemployment benefits are too high has increased by 31 percentage pointsamong the youngest age group

British Social Attitudes 30 | Government spending and welfare
NatCen Social Research
51
Table 2.7 Support for more government spending on welfare benefits for the poor, by demographic group, 1987–2012[4]
% agreeing the government should spend more money on welfare benefits 1987 1995 2000 2003 2007 2011 2012
Change 1987–2012
Change2011–2012
Age
18–34 48 43 30 31 23 19 28 -20 +9
35–54 57 51 36 45 27 25 30 -26 +5
55–64 60 52 48 46 38 35 41 -19 +6
65+ 59 55 47 55 44 39 42 -17 +4
Occupational class
Professional/managerial 55 49 38 45 29 25 34 -21 +8
Intermediate (white-collar) 49 44 35 41 31 20 32 -17 +12
Independent 45 46 31 40 36 31 26 -19 -5
Intermediate (blue-collar) 51 56 39 48 31 32 34 -17 +2
Working class 61 53 42 41 34 33 37 -25 +3
Party affiliation
Conservative 38 32 27 30 23 17 20 -18 +3
Labour 73 61 45 58 37 36 44 -29 +8
Liberal Democrat 64 52 46 47 35 32 38 -25 +6
All 55 50 38 43 32 28 34 -21 +6
Table 2.8 Unemployment benefits are too high and discourage work, by demographic group, 1987–2012[5]
% saying unemployment benefits are too high 1987 1995 2000 2003 2007 2011 2012
Change 1987–2012
Change 2011–2012
Age
18–34 23 25 33 41 52 66 54 +31 -12
35–54 29 31 33 37 52 61 48 +19 -13
55–64 32 31 38 43 52 59 45 +13 -14
65+ 41 34 46 45 63 62 58 +17 -4
Occupational class
Professional/managerial 30 31 35 40 55 65 54 +24 -11
Intermediate (white-collar) 31 34 41 40 53 63 51 +20 -12
Independent 49 30 40 45 61 71 51 +2 -20
Intermediate (blue-collar) 29 41 39 42 54 65 53 +24 -12
Working class 26 24 33 39 51 57 47 +21 -10
Party affiliation
Conservative 43 47 52 56 67 77 67 +24 -10
Labour 16 18 28 36 49 55 43 +27 -12
Liberal Democrat 25 36 36 36 51 55 47 +22 -9
All 29 30 36 40 54 62 51 +22 -11
British Social Attitudes 30 | Government spending and welfare
NatCen Social Research
52
While the British public as a whole does not appear to have become less collectivist over the past three decades, with the exception of its attitudes towards the unemployed, views have changed in quite varied ways in different sections of society. The upshot of these changes is that, while the British people are not more collectivist than they were three decades ago, they do appear more united in their views – with the attitudes of different age groups, party supporters and social classes appearing to converge on most matters. However, when we focus on more recent periods, alternative trends are evident, suggesting that this convergence occurred in an earlier period. Indeed, in recent years, we can again see views beginning to diverge.
Clearly though, the public has become less collectivist towards the unemployed and, while this change is particularly pronounced among Labour Party supporters and the youngest age group (18 to 34 year olds), it is nevertheless one displayed by all sections of society. In our final section, we seek to examine this change in the context of the existing literature on attitudes to welfare.
What drives attitudes to the welfare state?
What explains these differences in support for different benefits and services? Petersen et al. (2012) use an evolutionary psychological hypothesis to suggest that attitudes are shaped by cognitive processes that trigger anger at perceived opportunist and parasitic behaviours. Their analysis of surveys in Denmark and the USA indicates that subjects’ perceptions of recipients’ effort to find work drives welfare opinions. Van Oorschot (2006) examines European public perceptions of the relative ‘deservingness’ of four needy groups, using the 1999/2000 European Values Study survey. A consistent pattern is found across the population, with elderly people being seen as the most deserving, closely followed by sick and disabled people; unemployed people are seen as less deserving still, and immigrants as least deserving of all.
These findings broadly support the attitudinal data presented in this chapter. The public operates a ‘hierarchy of desert’, in which pensioners who are believed to have worked hard all their lives to contribute to collective provision are seen as most deserving of their social security, while the unemployed are least likely to be considered meretricious of support (other than the position of migrants, whom we have not addressed in this chapter).
Some academic studies suggest that welfare systems create institutions that not only affect individuals’ personal interests, but also have norm-shaping functions. Jæger (2009), for example, analysed International Social Survey Programme data across 15 countries and found variance in support for redistribution depending on the ‘welfare regime’ (Esping-Andersen, 1990). On average support for greater redistribution is significantly higher in conservative regimes than in social democratic ones, where it is in turn higher than in liberal regimes. But the variation in attitudes also changes by regime, implying a two-dimensional effect. This might also explain why the British public is strongly attached to collective provision that has institutional form, in particular the National Health Service.
Van Oorschot et al. (2012) use the 2008 wave of the European Social Survey to analyse attitudes towards the outcomes and consequences of social policy, which have thus far been neglected in the literature. In Europe, people are more
The public operates a ‘hierarchy of desert’, in which pensioners are seen as most deserving of their social security

British Social Attitudes 30 | Government spending and welfare
NatCen Social Research
53
likely to view the welfare state as having positive social consequences than to associate it with negative economic and moral ones. However, public opinion in the UK, as well as in Slovakia and Hungary, is skewed in the other direction, with relatively large majorities seeing negative economic and moral consequences and smaller proportions viewing positive social consequences.
Reeskens and Van Oorschot (2013) find that negative and positive perceptions are not in a zero-sum relationship: people may, and many do, combine negative and positive perceptions at the same time. In fact, in more developed welfare states the public perceives both the negative and the positive consequences more strongly. The authors conclude that citizens seem to have a more nuanced view on the consequences of the welfare state than policy makers. Our analysis of British Social Attitudes supports this more complex interpretation of popular views on social security: it is not all good or bad.
Some studies have recently attempted to address this perceived dissonance between different expressed attitudes, by pointing out that perceived risks often crowd out people’s values. This is a vein of argument which naturally leads to a discussion of the portrayal of welfare recipients in the media.
Citing Bartels (2008), who draws attention to the fact that many Americans support tax policies that run completely counter to their own values on distribution and justice, Kulin and Svallfors (2011) examine what they see as a paradox in people’s expressed attitudes to welfare, which often run counter to their values (attitudes being focused on a specific object or situation, and values being abstract, idealised and general). They argue that personal values can play an important role in attitude formation, but the extent to which they do so must be understood by considering the moderating effect of contextual factors, and in particular the ways in which self-interest in times of perceived risk can cut across such values. This is grounded in previous work on the link between attitudes towards welfare spending and risks (such as Cusack et al. 2005).
Likewise, Petersen et al. (2010) analyse how values interact with perceptions to shape people’s attitudes to welfare, in order to suggest ways in which contextual information can crowd out value judgements on welfare. Perceptions of risk derived from the media or elsewhere trigger a “deservingness heuristic”, which spontaneously guides attitude formation whenever informational cues to the ‘deservingness’ of welfare recipients are available, effectively crowding out values from the judgement process.
In order to test this hypothesis, they carried out a pair of studies asking participants about their support for a specific welfare policy, after providing them with one of four short descriptions of a specific welfare recipient. The descriptions varied according to the perceived deservingness of the recipient. Just as Van Oorschot (2006) found, there were quite large differences in the participants’ support for welfare provision depending on the specific welfare recipient they were considering, and how ‘deserving’ they were perceived to be. These differences were replicated across the sample, regardless of the participant’s level of political sophistication (which undermines the ‘classic’ heuristic model which posits that such heuristics are evoked as a fallback mechanism when people are unable to link their values to a specific political context).

British Social Attitudes 30 | Government spending and welfare
NatCen Social Research
54
The fact that individuals are highly sensitive to cues that portray benefit recipients in an ‘undeserving’ light, and the finding that such cues can actively crowd out values from attitude formation, has major implications for how the mass media and political elites should frame public support for welfare policies.
Conclusions
The past three decades have not seen a universal shift in attitudes towards the government and its role in social protection and the economy. Levels of support for government taxation and spending activities in many areas are comparable to those recorded 30 years ago. Where there is clear evidence that the public has become less collectivist is in its views on government welfare provision for the unemployed. While attitudes towards welfare provision for this group behave to some extent in a cyclical way, becoming more supportive during and after periods of recession (a pattern which may explain an increase in such support since 2011), the dominant trend has been one of declining support for government spending and provision in this area.
While British society as a whole has not become less collectivist, the attitudes and perceptions of different groups have changed in very distinctive ways. So, while attitudes to income inequality and redistribution have remained fairly stable, the views of those groups who were traditionally the most likely to perceive income equality as a problem or to support redistribution (younger people and Labour supporters) have become less collectivist; at the same time, the views of older people and Conservative Party supporters, who were traditionally the least likely to adopt these views, have become more collectivist. As a result the British people are less divided on these issues than they were in the 1980s. Over the same period, while attitudes to welfare for the unemployed have become less collectivist at the societal level, this shift has been most pronounced among young people and Labour Party supporters.
There is some evidence that we may be approaching a turning point, however. The 2012 data indicate that austerity and the experience of cuts to social security may be changing public attitudes towards a more sympathetic view of benefit claimants; in particular we see significantly more support for welfare spending in general, and for spending on unemployment benefits in particular, than we did in 2011. For that reason, the 2013 survey will be particularly interesting, given the extent of the welfare changes taking place in 2013/2014. Concern about the income gap between rich and poor, and support for redistribution, have also risen since the financial crisis. Whether these shifts mark the beginning of a long-term trend or simply a temporary blip in public attitudes as has been witnessed in the past, to be reversed when economic conditions improve, is likely to have significant political implications.
Whether these shifts mark the beginning of a long-term trend or simply a temporary blip is likely to have significant political implications

British Social Attitudes 30 | Government spending and welfare
NatCen Social Research
55
Notes1. 1987 was chosen as the starting point for our analysis in order to use a comparable
measure of social class with all subsequent years.
2. The bases for Table 2.5 are as follows:
Agreement that the income gap is “too large”, by demographic group, 1987–2012
1987 1995 2003
Weighted base
Unweighted base
Weighted base
Unweighted base
Weighted base
Unweighted base
Age
18–34 903 885 399 371 324 289
35–54 980 1024 413 411 422 417
55–64 425 451 147 151 151 151
65+ 454 482 240 300 230 276
Occupational class
Professional/managerial 653 675 332 341 410 403
Intermediate (white-collar) 604 633 241 252 203 209
Independent 206 216 98 97 71 72
Intermediate (blue-collar) 127 133 99 101 167 171
Working class 1002 1026 380 389 236 241
Party affiliation
Conservative 1051 1095 306 319 275 269
Labour 804 824 544 561 419 420
Liberal Democrat 381 392 158 160 123 124
All 2766 2847 1199 1234 1127 1133
2007 2012
Weighted base
Unweighted base
Weighted base
Unweighted base
Age
18–34 563 450 935 635
35–54 751 757 1147 1108
55–64 318 340 486 532
65+ 455 552 674 967
Occupational class
Professional/managerial 820 831 1311 1280
Intermediate (white-collar) 336 348 440 489
Independent 181 183 283 274
Intermediate (blue-collar) 279 263 400 400
Working class 390 407 640 667
Party affiliation
Conservative 513 551 830 866
Labour 717 718 1102 1090
Liberal Democrat 185 197 195 200
All 2090 2102 3248 3248

British Social Attitudes 30 | Government spending and welfare
NatCen Social Research
56
3. The bases for Table 2.6 are as follows:
Agreement the government should redistribute income from the rich to the poor, by demographic group, 1987–2012
1987 1995 2003
Weighted base
Unweighted base
Weighted base
Unweighted base
Weighted base
Unweighted base
Age
18–34 798 781 993 936 947 863
35–54 874 917 1146 1093 1366 1320
55–64 378 398 425 408 616 597
65+ 371 394 578 693 705 840
Occupational class
Professional/managerial 596 619 914 922 1418 1377
Intermediate (white-collar) 545 573 706 691 608 610
Independent 174 181 274 264 241 242
Intermediate (blue-collar) 119 122 233 224 527 524
Working class 850 869 893 907 723 751
Party affiliation
Conservative 947 986 839 837 979 962
Labour 683 699 1378 1371 1329 1322
Liberal Democrat 344 352 422 424 408 417
All 2424 2493 3145 3135 3634 3621
2007 2012
Weighted base
Unweighted base
Weighted base
Unweighted base
Age
18–34 962 755 803 539
35–54 1302 1323 1017 976
55–64 572 611 441 480
65+ 738 887 602 856
Occupational class
Professional/managerial 1392 1411 1171 1151
Intermediate (white-collar) 597 613 401 439
Independent 308 305 242 234
Intermediate (blue-collar) 462 452 359 358
Working class 689 697 552 570
Party affiliation
Conservative 913 961 760 788
Labour 1210 1225 971 956
Liberal Democrat 340 346 180 186
All 3576 3578 2867 2855

British Social Attitudes 30 | Government spending and welfare
NatCen Social Research
57
4. The bases for Table 2.7 are as follows:
Support for more government spending on welfare benefits for the poor, by demographic group, 1987–2012
1987 1995 2000 2003
Weighted base
Unweighted base
Weighted base
Unweighted base
Weighted base
Unweighted base
Weighted base
Unweighted base
Age
18–34 412 399 993 936 835 766 239 213
35–54 454 478 1146 1093 1140 1102 335 328
55–64 181 195 425 408 467 452 136 132
65+ 195 207 578 693 545 656 171 200
Occupational class
Professional/managerial 304 320 914 922 947 933 349 335
Intermediate (white-collar) 276 291 706 691 686 672 159 163
Independent 91 95 274 264 192 186 53 56
Intermediate (blue-collar) 63 64 233 224 239 242 120 120
Working class 432 443 893 907 842 861 175 178
Party affiliation
Conservative 482 506 839 837 844 840 234 227
Labour 331 337 1378 1371 1205 1220 330 321
Liberal Democrat 176 183 422 424 323 305 102 104
All 1243 1281 3145 3135 2991 2980 881 873
2007 2011 2012
Weighted base
Unweighted base
Weighted base
Unweighted base
Weighted base
Unweighted base
Age
18–34 692 541 799 640 803 539
35–54 980 994 1015 1006 1017 976
55–64 421 454 445 488 441 480
65+ 568 681 580 710 602 856
Occupational class
Professional/managerial 1079 1090 1143 1153 1171 1151
Intermediate (white-collar) 428 435 420 430 401 439
Independent 241 240 214 219 242 234
Intermediate (blue-collar) 322 315 319 330 359 358
Working class 500 516 591 578 552 570
Party affiliation
Conservative 696 739 783 822 760 788
Labour 911 911 893 881 971 956
Liberal Democrat 249 263 224 227 180 186
All 2663 2672 2841 2845 2867 2855

British Social Attitudes 30 | Government spending and welfare
NatCen Social Research
58
5. The bases for Table 2.8 are as follows:
Unemployment benefits are too high and discourage work, by demographic group, 1987–2012
1987 1995 2000 2003
Weighted base
Unweighted base
Weighted base
Unweighted base
Weighted base
Unweighted base
Weighted base
Unweighted base
Age
18–34 903 885 399 371 970 891 895 807
35–54 980 1024 413 411 1282 1236 1249 1213
55–64 425 451 147 151 517 501 490 482
65+ 454 482 240 300 651 791 641 770
Occupational class
Professional/managerial 653 675 332 341 1063 1046 1207 1182
Intermediate (white-collar) 604 633 241 252 769 752 545 549
Independent 206 216 98 97 239 228 228 224
Intermediate (blue-collar) 127 133 99 101 271 275 485 489
Working class 1002 1026 380 389 968 1008 688 711
Party affiliation
Conservative 1051 1095 306 319 943 937 814 806
Labour 804 824 544 561 1379 1394 1200 1203
Liberal Democrat 381 392 158 160 353 341 365 368
All 2766 2847 1199 1234 3426 3426 3276 3272
2007 2011 2012
Weighted base
Unweighted base
Weighted base
Unweighted base
Weighted base
Unweighted base
Age
18–34 863 683 948 752 935 635
35–54 1111 1128 1171 1159 1147 1108
55–64 456 494 496 541 486 532
65+ 651 786 693 856 674 967
Occupational class
Professional/managerial 1200 1216 1277 1289 1311 1280
Intermediate (white-collar) 500 505 494 500 440 489
Independent 283 279 261 261 283 274
Intermediate (blue-collar) 393 377 366 380 400 400
Working class 589 617 686 685 640 667
Party affiliation
Conservative 773 819 881 926 830 866
Labour 1052 1058 1062 1039 1102 1090
Liberal Democrat 282 293 247 253 195 200
All 3082 3094 3311 3311 3248 3248

British Social Attitudes 30 | Government spending and welfare
NatCen Social Research
59
References Bartels, L. (2008), Unequal Democracy: the Political Economy of the New Gilded Age, Princeton: Princeton University Press
Clery, E. (2012), ‘Are tough times affecting attitudes to welfare?’, in Park, A., Clery, E., Curtice, J., Phillips, M. and Utting, D. (eds.) (2012), British Social Attitudes: the 29th Report, London: NatCen Social Research, available at: www.bsa-29.natcen.ac.uk
Clery, E., Lee L. and Kunz S. (2013), Public attitudes to poverty and welfare, 1983–2011: analysis using British Social Attitudes data, NatCen Social Research, available at: www.natcen.ac.uk/media/1106142/poverty%20and%20welfare.pdf
Curtice, J. (2010), ‘Thermostat or weathervane? Public reactions to spending and redistribution under New Labour’, in Park, A., Curtice, J., Thomson, K., Phillips, M., Clery, E. and Butt, S. (eds.), British Social Attitudes: the 26th Report, London: Sage
Cusack, T., Iversen, T. and Rehm, P. (2005), Risks at Work: The Demand and Supply Sides of Government Redistribution, (SSRN Scholarly Paper No. ID 791305), Rochester, NY: Social Science Research Network
Jaeger, M. (2009), ‘United But Divided: Welfare Regimes and the Level and Variance in Public Support for Redistribution’, European Sociological Review, 25(6): 723–37
Kulin, J. and Svallfors, S. (2011), ‘Class, Values, and Attitudes Towards Redistribution: A European Comparison’, European Sociological Review, 29(2): 155–167
Petersen, M., Slothuus, R., Stubager, R. and Togeby, L. (2010), ‘Deservingness versus values in public opinion on welfare: The automaticity of the deservingness heuristic’, European Journal of Political Research, 50(1): 24–52
Petersen, M., Sznycer, D., Cosmides, L. and Tooby, J. (2012), ‘Who Deserves Help? Evolutionary Psychology, Social Emotions, and Public Opinion about Welfare’, Political Psychology, 33(3): 395–418
Reeskens, T. and Van Oorschot, W. (2013), ‘Equity, equality, or need? A study of popular preferences for welfare redistribution principles across 24 European countries’, Journal of European Public Policy, 20(8), 1174–1195
Rowlingson, K., Orton, M. and Taylor, E. (2010), ‘Do we still care about inequality?’, in Park, A., Curtice, J., Clery, E. and Bryson, C. (eds.) (2010), British Social Attitudes – the 27th Report: Exploring Labour’s Legacy, London: Sage
Van Oorschot, W. (2006), ‘Making the difference in social Europe: deservingness perceptions among citizens of European welfare states’, Journal of European Social Policy, 16(1): 23–42
Van Oorschot, W., Reeskens, T. and Meuleman, B. (2012), ‘Popular perceptions of welfare state consequences: A multilevel, cross-national analysis of 25 European countries’, Journal of European Social Policy, 22(2): 181–197
AcknowledgementsNatCen Social Research is grateful to the Department for Work and Pensions for their financial support which enabled us to ask the questions reported in this chapter. The views expressed are those of the authors alone.

British Social Attitudes 30 | Government spending and welfare
NatCen Social Research
60
AppendixThe data on which Figure 2.1 is based are shown below.
Table A.1 Taxation and spending, 1983–2012
83 84 85 86 87 89 90 91 93 94 95 96 97 98
% % % % % % % % % % % % % %
Increase taxes/spend more 32 39 45 46 50 56 54 65 63 58 61 59 62 63
Keep taxes/spend same 54 50 43 44 42 37 37 29 29 33 31 34 31 32
Reduce taxes/spend less 9 6 6 5 3 3 3 3 4 4 5 4 3 3
Weighted base 1716 1642 1767 3062 2762 2928 2692 2833 2941 3469 3633 3619 1352 3143Unweighted base 1757 1671 1802 3096 2843 3027 2791 2914 2941 3469 3633 3619 1353 3142
99 00 01 02 03 04 05 06 07 08 09 10 11 12
% % % % % % % % % % % % % %
Increase taxes/spend more 58 50 59 63 51 49 46 46 42 39 34 31 36 34
Keep taxes/spend same 35 40 34 31 38 42 43 44 47 50 55 56 54 53
Reduce taxes/spend less 4 5 3 3 6 6 7 6 7 8 8 8 6 6
Weighted base 3142 2302 3287 3434 3274 2130 2167 3227 3082 2184 1134 3296 3311 3248Unweighted base 3142 2292 3287 3434 3271 2146 2166 3239 3094 2229 1139 3295 3311 3248
The data on which Figure 2.2 is based are shown below.
Table A.2 Attitudes towards income inequality and redistribution, 1983–2012
83 84 85 86 87 89 90 91 93 94 95 97 98 99
% saying the income gap is too large 72 75 77 78 79 80 81 80 85 85 87 85 81 81
% agreeing the government should redistribute income n/a n/a n/a 43 45 51 51 49 48 51 47 44 39 36
Weighted base 1719 1645 1769 1315 2424 2529 2349 2644 1327 2957 3145 3103 2546 2478Unweighted base 1761 1675 1804 1321 2493 2604 2430 2702 1306 2929 3135 3085 2531 2450
00 01 02 03 04 05 06 07 08 09 10 11 12
% saying the income gap is too large 82 80 82 78 73 n/a 76 76 75 78 75 n/a 82
% agreeing the government should redistribute income 39 38 39 42 32 32 34 32 38 37 36 37 41
Weighted base 2991 2821 2929 3634 2610 3539 3744 3576 3963 2951 2810 2841 3248Unweighted base 2980 2795 2900 3621 2609 3559 3748 3578 3990 2942 2791 2845 3248
n/a = not asked

British Social Attitudes 30 | Government spending and welfare
NatCen Social Research
61
The data on which Figure 2.3 is based are shown below.
Table A.3 Attitudes towards spending on welfare benefits, 1987–2012
87 89 91 93 94 95 96 98 99 00 01
% agree government should spend more money on welfare benefits for the poor 55 61 58 53 50 49 43 43 40 38 43
Weighted base 1243 2529 2428 2595 2957 3145 3103 2546 2478 2991 2821Unweighted base 1281 2604 2481 2567 2929 3135 3085 2531 2450 2980 2795
02 03 04 05 06 07 08 09 10 11 12
% agree government should spend more money on welfare benefits for the poor 44 43 36 36 35 32 35 27 29 28 34
Weighted base 2929 873 2610 2697 2813 2663 2956 963 2810 2845 2867Unweighted base 2900 881 2609 2699 2822 2672 3000 967 2791 2841 2855
The data on which Figure 2.4 is based are shown below.
Table A.4 Attitudes towards unemployment benefit level and spending on benefits, 1983–2012
83 84 85 86 87 89 90 91 93 94 95 96 97 98
Benefits for unemployed people are … % % % % % % % % % % % % % %
… too low and cause hardship 46 49 44 44 51 52 50 53 55 53 51 48 46 29
… too high and discourage work 35 28 34 33 29 27 29 27 24 24 30 32 28 46
… Neither 13 8 7 6 6 8 8 7 11 14 11 14 15 17
Weighted base 1761 1645 1769 3066 2766 2930 2698 2836 2945 3469 1199 3620 1355 3146Unweighted base 1719 1675 1804 3100 2847 3029 2797 2918 2945 3469 1234 3620 1355 3146
99 00 01 02 03 04 05 06 07 08 09 10 11 12
Benefits for unemployed people are … % % % % % % % % % % % % % %
… too low and cause hardship 33 40 37 29 34 23 26 23 26 21 29 23 19 22
… too high and discourage work 42 36 37 47 40 54 50 54 54 61 51 54 62 51
… Neither 18 15 16 17 17 16 16 16 14 13 12 14 14 17
Weighted base 3143 3426 3287 3435 3272 3199 3210 3228 3082 3333 1134 3297 3311 3248Unweighted base 3143 3426 3287 3435 3276 3199 3139 3240 3094 3258 1139 3297 3311 3248

British Social Attitudes 30
NatCen Social Research
At NatCen Social Research we believe that social research has the power to make life better. By really understanding the complexity of people’s lives and what they think about the issues that affect them, we give the public a powerful and influential role in shaping decisions and services that can make a difference to everyone. And as an independent, not for profit organisation we’re able to focus our time and energy on meeting our clients’ needs and delivering social research that works for society.
Publication details
Park, A., Bryson, C., Clery, E., Curtice, J. and Phillips, M. (eds.) (2013), British Social Attitudes: the 30th Report, London: NatCen Social Research, available online at: www.bsa-30.natcen.ac.uk
© NatCen Social Research 2013First published 2013
You may print out, download and save this publication for your non-commercial use. Otherwise, and apart from any fair dealing for the purposes of research or private study, or criticism or review, as permitted under the Copyright, Designs and Patents Act, 1988, this publication may be reproduced, stored or transmitted in any form, or by any means, only with the prior permission in writing of the publishers, or in the case of reprographic reproduction, in accordance with the terms of licences issued by the Copyright Licensing Agency. Enquiries concerning reproduction outside those terms should be sent to NatCen Social Research.
NatCen Social Research35 Northampton SquareLondonEC1V 0AX
ISBN 978-1-907236-28-0