Embed Size (px)
Citation preview

Policy Research Working Paper 5423
Political Economy of Infrastructure Spending in India
Stuti Khemani
The World BankDevelopment Research GroupHuman Development and Public Services TeamSeptember 2010
WPS5423P
ublic
Dis
clos
ure
Aut
horiz
edP
ublic
Dis
clos
ure
Aut
horiz
edP
ublic
Dis
clos
ure
Aut
horiz
edP
ublic
Dis
clos
ure
Aut
horiz
edP
ublic
Dis
clos
ure
Aut
horiz
edP
ublic
Dis
clos
ure
Aut
horiz
edP
ublic
Dis
clos
ure
Aut
horiz
edP
ublic
Dis
clos
ure
Aut
horiz
ed

Produced by the Research Support Team
Abstract
The Policy Research Working Paper Series disseminates the findings of work in progress to encourage the exchange of ideas about development issues. An objective of the series is to get the findings out quickly, even if the presentations are less than fully polished. The papers carry the names of the authors and should be cited accordingly. The findings, interpretations, and conclusions expressed in this paper are entirely those of the authors. They do not necessarily represent the views of the International Bank for Reconstruction and Development/World Bank and its affiliated organizations, or those of the Executive Directors of the World Bank or the governments they represent.
Policy Research Working Paper 5423
This paper examines a puzzle in the political economy of infrastructure in India—the co-existence of relatively low shares of capital spending in public budgets alongside evidence of large demand for village infrastructure from poor voters. It argues that this pattern is due to infrastructure projects being used at the margin for political rent-seeking, while spending on employment and welfare transfers are the preferred vehicles to win votes for re-election. New suggestive evidence on the variation of public spending composition across states,
This paper—a product of the Human Development and Public Services Team, Development Research Group—is part of a larger effort in the department to examine incentives and accountability for the delivery of public goods. Policy Research Working Papers are also posted on the Web at http://econ.worldbank.org. The author may be contacted at [email protected].
and within states over time is offered that is consistent with this argument. This evidence underscores a growing argument in the development literature that the level and composition of public spending per se may not be sufficient metrics to assess the quality of public goods policies—greater infrastructure spending in some contexts may go to political rents rather than to the actual delivery of broad public goods for growth and poverty reduction.

Political Economy of Infrastructure Spending in India
Stuti Khemani*
* Development Research Group, The World Bank, 1818 H Street NW, Washington DC 20433, [email protected]. This paper was prepared for the Handbook on the Indian Economy, to be published by Oxford University Press. I thank Chetan Ghate for useful discussion, and two anonymous referees for their comments. Disclaimer: The findings, interpretations, and conclusions expressed in this paper are entirely those of the authors, and do not necessarily represent the views of the World Bank, its Executive Directors, or the countries they represent.

2
Introduction
This paper poses and examines a significant puzzle in the political economy of
infrastructure in India—the co-existence of relatively low shares of capital spending in public
budgets alongside evidence of large demand from poor voters. Several separate household
surveys in different states provide systematic empirical support for the conventional political
wisdom that bijli, sadak, and pani (electricity, road, and water) rank at the top of voter demands,
and dominate electoral rhetoric. Yet, across the major states of India, public spending on capital
works has barely averaged 13 percent of total spending (excluding debt servicing and interest
payments), in contrast to over 21 percent on recurrent education expenses.1 Education, however,
is cited far below infrastructure on citizen rankings of priorities for public action.2
The argument offered here to explain this puzzle is that public infrastructure projects are
particularly suited to political rent extraction, the benefits from which are traded-off against the
electoral gains from delivering infrastructure as a broader public good.3 At the same time,
targeted provision of employment and welfare transfers to the poor can be more effective in
ensuring their favorable vote, while the vote returns to delivering infrastructure as a public good
can be more uncertain (relative to the provision of targeted benefits). Infrastructure provision,
1 Author’s calculations using detailed data on state finances published in annual issues of the Reserve Bank of India Bulletin, for the period 1980-2005. 2 Data collected by Besley et al (2004) through a survey of more than 5000 rural households in 3 states in the south—Andhra Pradesh, Karnataka, and Tamil Nadu—shows the overwhelming majority of respondents (more than 89 percent) citing either water works or general village infrastructure among the top problems with public services in their village; in contrast, education is mentioned by less than 6 percent of the households. Rural household surveys in the north Indian states of Uttar Pradesh by Banerjee et al (2007), and in Rajasthan and West Bengal by Chattopadhyay and Duflo (2004) similarly reveal roads and water as the top ranked priorities for public action, with education trailing behind. 3 This chapter does not distinguish between political rent-seeking as private kick-backs for political agents from projects (corruption), versus rent-seeking through the servicing of elite economic interests (elite capture), from which political agents may either benefit directly if they overlap as the economic elite, or through kick-backs or campaign finance. Both types of rent-seeking would lead to policy choices that deviate from what a benevolent and utilitarian social planner would adopt.

3
even when swing voters at large demand it, may therefore be too costly a means to win votes—
both because if it is provided as a broad public good to win broad electoral support, it implies
giving-up large rents; and because there is uncertainty in whether swing voters at large will
indeed vote for the incumbent after receiving the broad public good.
The first testable implication of this argument is that when institutions that constrain rent-
seeking are weaker, the share of infrastructure in public spending should be higher. Second,
when re-election requires winning votes from more voters (such as when more voters turn out at
the polls, or when political competition is more vigorous), the share of infrastructure should fall,
in favor of those types of public spending that deliver jobs and transfers. Some new evidence,
albeit largely suggestive rather than conclusive, is offered on the variation of public spending
composition across states, and within states over time, that are consistent with this argument. The
share of capital spending is estimated to be greatest in states that are reputed to have poorer
quality governance compared to others, and declines within these states when they experience
greater voter participation. In contrast, the share of spending on social programs, including
education as its largest component, designed to provide employment and welfare transfers to the
poor, is lower in weaker-governance states, and increases in all states with increases in voter
turnout.4
The responsiveness of changes in budget composition, away from capital projects and
towards recurring benefits in social programs, with increasing voter turnout is significantly
higher in the states characterized as having weaker governance. This greater interaction effect
with voter turnout is argued to be due to the greater room at the margin in weaker governance
4 Education spending reportedly consists largely of salaries to teachers on the public payroll, and teacher recruitment by states has been argued to serve electoral purposes (Kingdon and Muzammil, 2001; Beteille, 2009; Chhibber and Nooruddin, 2004).

4
environments for using public spending to seek votes instead of rents. Weaker governance states
may also be more effective at targeting recurrent spending on salaries and welfare transfers to
“buy” votes, that is, to enforce a quid pro quo between receiving a targeted benefit and voting.
We find further evidence suggestive of this in that the share of spending on state administration
(consisting largely of the salaries of state employees in public administration) increases with
increasing turnout in states characterized as having poor governance, while the estimated
correlation is in the opposite direction in other states (administrative spending falls with
increasing turnout, although the correlation is not statistically significant).
In the absence of multi-year panel data on objective indicators of governance at the state-
level, there are substantial limits to the extent to which this characterization can be defended.
However, we experimented with a number of other state groupings to see whether similar
differences in the correlation with voter turnout would emerge. We found no other grouping of
states within which the correlation with voter turnout is so systematically different, other than the
grouping of all or some sub-set of five states—Bihar, Madhya Pradesh, Orissa, Rajasthan, and
Uttar Pradesh—characterized as relatively weaker governance states in the Indian literature. The
difference in budget composition and its response to voter turnout in these states is robust to
including measures of state income, population, poverty and inequality.
This evidence across the Indian states, and its interpretation offered here, is consistent
with recent cross-country research which finds greater public investment spending in countries
with lower ratings for governance, political checks and balances and electoral competition
(Keefer and Knack, 2007). They argue that the more plausible explanation for this pattern of
variation is that pubic investment projects are vehicles for rent-seeking in weak governance
environments. Other recent work on public expenditure composition in the Indian states has

5
found correlations consistent with greater political competition reducing spending on capital
projects and increasing social and education spending. Saez and Sinha (2009) find that education
spending in the Indian states is greater when there are greater numbers of political parties
competing for office. Teitelbaum and Thachil (2010) find the opposite effect of the number of
competing political parties on economic services, consisting largely of capital spending.
The pattern of findings that increased pressures to seek and win votes (because of greater
turnout, or greater political competition) are associated with a shift towards recurrent spending
on social programs that provide jobs and welfare benefits are consistent with stories of populist
pressures on public policies in India, for redistribution at the expense of managing resources for
broad public goods (Acharya, 2004). This has general implications for constraints to public
provision of, or public facilitation of private investments in infrastructure as a broader public
good. The results presented here are also consistent with other arguments and evidence in the
development literature that public spending levels or composition per se may not be adequate
metrics to assess the quality of public goods policies, because spending may be allocated to serve
purposes other than avowed; the examples suggested by the findings of this paper, that echo
previous work, are that infrastructure projects may be used as vehicles for rent seeking, and
education spending may be used to deliver jobs rather than learning (World Development
Report, 2004; Filmer et al, 2000; Keefer and Khemani, 2004, 2005).
The following sections provide more details on the evidence summarized above. After
presenting the evidence, the paper discusses its interpretation in the context of models of political
rent-seeking and populist spending to win votes, at the expense of broad public goods. It then
explores new ideas for how greater political participation by the poor in India may become an

6
opportunity to shift away from populist policies and improve political incentives for broad public
goods.
Budget composition and household demands
Table 1 shows the summary statistics of the share of capital and recurrent social spending
in the budgets of 14 major states over the period 1980-2005. On average, states allocate 13
percent of their total spending, excluding interest payments and debt servicing, to capital works,
compared to 39 percent on recurrent spending on social programs including education health and
welfare. The single largest category of spending is education, accounting for 21 percent of total
spending. As a proportion of developmental spending on public services alone, excluding other
kinds of administrative spending, capital spending accounts for 16 percent, recurrent spending on
social programs for 49 percent, and within it, education accounts for 27 percent. These averages
mask variation across states and over time, which this paper will explore in the next section.
This distance between the share of capital and social spending in state budgets is at odds
with household survey evidence on reported citizen prioritization of village problems. In a large
survey of over 5000 rural households in the southern Indian states of Andhra Pradesh, Karnataka,
and Tamil Nadu undertaken by Besley et al (2004) between September-November 2002, the data
show that 89 percent of respondents list water or infrastructure as among their top 3 priorities,
while less than 6 percent list education.5 These three states are at the sample average for the
shares of spending devoted to capital versus social programs and education. Ban and Rao (2009)
report that for a sub-sample of these households, for which they gathered transcripts of village
assembly meetings with public officials, 38 percent rank water as their top priority, another 38
percent rank roads, 7 percent each rank electricity and housing, 5 percent rank health, 2 percent
5 I am grateful to Biju Rao for providing access to this data.

7
rank employment, and 1 percent rank education. Infrastructure outstrips education by several
orders of magnitude for every sub-group of household respondents—landed versus landless, low
versus high caste, Hindu versus Muslim, women versus men (Ban and Rao, 2009, Table 5).
Data on similar questions in household surveys in other states show the same pattern—an
overwhelming number of respondents rank village infrastructure as priorities, versus very few
responses ranking education (Banerjee et al, 2007, for Uttar Pradesh; Chattopadhyay and Duflo,
2004, for West Bengal). This consistency across several different surveys in several different
states does not seem to be obviously driven by an accident of how the surveys were implemented
and whether they primed households to respond in ways they thought the interviewers wanted (or
otherwise). The Besley et al (2004) and Banerjee et al (2007) surveys, for example, asked the
question on household opinion without any prompting with possible response options. The
Banerjee et al (2007) survey was in fact focused on education, thereby possibly signaling to
respondents an interviewer interest in education6. Indeed this survey seems to have found a
somewhat higher number of respondents listing education among the top 3 priorities (at 13
percent). Yet, this is in sharp contrast to the 40 percent that prioritize roads, the 32 percent that
prioritize water, and the 31 percent that prioritize electricity.
Of course, how households at large respond to a general question about what they see as
priorities for the village, and what they evaluate when they make their personal decision to vote,
may be quite separate. Nevertheless, if these are systematically different, that is, if households at
large think village infrastructure is the top priority but vote on the basis of other types of benefits
received from public spending, or on other issues altogether, this would be important to examine
to assess political incentives for growth-promoting and poverty-reducing policies. Bardhan et al 6 The question on ranking village priorities featured early in the interview, however, with the education-specific questions coming afterwards.

8
(2008) included a secret ballot in their survey of rural households in West Bengal to examine the
correlates of voting for the incumbent Left Front political parties. They find that an individual
household’s vote for the incumbent party is significantly correlated only with private and
recurring benefits received, in the form of personal help in times of need or benefits from welfare
schemes, and not with the availability of local infrastructure. This suggests that the vote-returns
from providing infrastructure broadly as a public good can be less than the vote-returns from
providing privately targeted recurring benefits. We return to discuss this issue after presenting
the results on how budget composition across states varies with voter turnout in state assembly
elections.
If the share of infrastructure spending is negatively correlated with voter turnout, falling
when turnout increases, this would suggest that infrastructure provision may not be as effective
as other types of spending at winning votes. If the share of spending on social programs that
provide recurrent and private benefits like welfare transfers and salaries is positively correlated
with turnout, increasing when turnout increases, these types of government programs may be
more effective at winning votes.
Variation of budget composition across states over time
Political agents with decision-making power over budget composition, however, might
not be motivated to satisfy voter demands and win re-election alone, but also to use the powers
available to them to extract private benefits or rents for themselves. Persson and Tabellini (2000)
provide a review of models of rent-seeking, some of which show that when voters are too
demanding politicians might make their policy choices solely on the basis of what allows them to
extract more private benefits for themselves. The cross-country analysis of Keefer and Knack

9
(2007) suggests that public investment spending may be particularly instrumental for rent-
extraction and therefore higher in countries with weak governance.
Some states in India have a long-standing reputation of weaker institutions to limit rent-
seeking compared to other states. Specifically, the socially and economically lagging states in the
north of India –Bihar, Madhya Pradesh, Orissa, Rajasthan and Uttar Pradesh—are described as
having weaker governance than others among the 14 major states (Ahluwalia, 2000; Acharya,
2004; Subramanian, 2007). 7 Four of them—Bihar, Madhya Pradesh, Rajasthan, and Uttar
Pradesh—were lumped together famously by an acronym of their first letters, BIMARU, which
means “prone to illness” for having the poorest demographic outcomes among all states
(Ahluwalia, 2000). In an examination of growth performance across the major states before and
after the economic reforms of the late 1980s and early 1990s, Ahluwalia (2000) finds that Bihar,
Uttar Pradesh and Orissa exhibit striking growth decelerations after reforms. This suggests that
there may be some basis to the reputation of weak governance that these states suffer from.8
This study will examine over longer periods, 1960-2005, whether these states on average
have systematically higher shares of capital spending, and whether voter turnout within these
states has differential effects on budget composition compared to turnout in other states.9
Table 2 reports the state fixed effects, i, in the following regression of the variation in
budget composition with variation in voter turnout.
7 The 14 major states are Andhra Pradesh, Bihar, Gujarat, Haryana, Karnataka, Kerala, Madhya Pradesh, Maharashtra, Orissa, Punjab, Rajasthan, Tamil Nadu, Uttar Pradesh, and West Bengal. 8 In contrast, and contrary to their lumping with lagging states, Madhya Pradesh and Rajasthan have been performing well in recent years after economic reforms (Ahluwalia, 2000). 9 The data on budget composition is compiled from annual issues of the Reserve Bank of Bulletin devoted to finances of state governments. The data on voter turnout in state assembly elections is compiled from Butler, Lahiri, and Roy (1995) and from the website of the Election Commission of India.

10
ShareSpendingYit = i + it + 1 LowerGovernanceStates*Turnoutit
+ 2 (1-LowerGovernanceStates)*Turnoutit (1)
where ShareSpendingYit is the share of spending on category Y in state i in year t, in the
total spending of state governments categorized as “developmental” spending. This is spending
on all programs that provide front-line services to the population, and exclude spending on the
administration of government, fiscal services and interest payments.10 LowerGovernanceStates is
an indicator variable which equals 1 for the states of Bihar, Madhya Pradesh, Orissa, Rajasthan
and Uttar Pradesh, and 0 otherwise. Turnout is the percentage of eligible voting population that
turns out to vote in the most recent past state assembly election.
The first column of Table 2 reports the results for the share of capital spending between
1960 and 2005, and the second column for the share of recurrent spending on social programs
between 1972 and 2005, all the years for which data is available on these spending categories.
The second pair of columns reports the results for the more recent years, 1980-2005. Compared
to the excluded state of Kerala, the fixed effects for the five states—Bihar, Madhya Pradesh,
Orissa, Rajasthan and Uttar Pradesh—are substantially larger for capital spending and
substantially smaller for social spending compared to the coefficients for other states. The
correlation of budget composition with voter turnout is also significantly different among these
states. Greater voter turnout in these states is correlated with a shift away from capital spending
towards recurrent spending on social programs. Greater voter turnout in the other states is also
correlated with a shift towards recurrent spending on social programs, but smaller in size than the
correlation in the five states.
10 The pattern of results is identical when the shares are calculated over the sum of developmental and non-developmental spending, excluding interest payments and debt servicing.

11
In Table 3 we examine whether budget composition in these states continues to be
systematically different even after including in the specifications available measures of state
income, population, poverty and inequality. The first two columns of Table 2 include controls for
state population, per capita domestic product in constant prices, and the share of agriculture in
state income, variables for which data is available from 1980-2003.11 Even after the inclusion of
these state income variables, the variation in the share of capital spending across states and
within states, with changes in voter turnout, remains as above.
The second two columns of Table 3 include measures of rural poverty and inequality
within states, for which annual data is available from 1960 to 1992.12 After controlling for
poverty and inequality, the share of capital spending in the five states characterized as having
weaker governance is higher than in the other states at the 10 percent level of significance;
greater turnout within these states continues to be associated with a greater shift away from
capital spending than in other states. Greater turnout is associated with a shift towards recurrent
social spending in all states, but this turnout correlation is not statistically different between the
two groups of states when income, poverty, and inequality are included as controls. This could
be because poverty and inequality explain part of the difference between the two groups of states
in the correlation between turnout and budget composition, or simply because the sample
available for this estimation is smaller.13
11 The state income and population series is taken from the data available at the World Bank’s Development Data Pltaform, and is reported to be compiled from the statistics provided by the Central Statistical Office in India. 12 The rural poverty and inequality data, and the state income and population data for the period 1960-1992 is taken from the Indian states poverty database compiled by the World Bank’s development research group (Ozler et al, 1996). 13 Data on spending in the category of social programs is available from 1972 onwards, and on poverty and inequality only until 1992. Hence, for this category of spending estimates including poverty and inequality cover only the period 1972-1992.

12
In the absence of panel data on objective indicators of governance comparable across
states, and within states over time, we are limited in the extent to which these differences across
states in the results discussed above can be attributed to differences in governance. We tried
something akin to falsification tests by testing whether various other groupings of states, other
than the five that are historically described as having weaker governance, would yield similar
differences in the correlation of voter turnout with budget composition. We found no other
grouping of states where voter turnout has a systematically bigger correlation with budget
composition as it does in the five states described above.14
We examine variation in the shares of further disaggregated categories of spending to
probe what kinds of spending appear to be responding to increases in voter turnout. Two
narrower categories, in particular, are interesting to examine whether the spending shifts towards
providing broader public goods versus private welfare transfers—one, on education which is the
single largest category of social spending and indeed of all developmental spending; and two, on
the administration of state governments which largely consists of salaries of government
employees.
Education spending, however, also largely consists of salaries to government
employees—teachers in public schools (Kingdon and Muzammil, 2001). Greater shares of
spending on education could therefore be interpreted in different ways—as increasing allocation
to the broad public good of education, or to the provision of public sector jobs through teacher
recruitment. Indeed, new political economy research in the education sector in India suggests
that teacher jobs are protected as political patronage, and teachers’ accountability, for showing-
up at the job and teaching, is very poor (Kingdon and Muzammil, 2001; Beteille, 2009; Banerjee 14 The results are also robust to dropping one state at a time from the sample. That is, no one state is driving the pattern of reported correlations.

13
et al, 2010). Chhibber and Nooruddin (2004) have described recruitment of additional teachers in
Uttar Pradesh as an electoral strategy to win votes through job provision.
Table 4 shows the correlation of voter turnout with share of total non-interest spending
allocated to education and state administration. Voter turnout is correlated with increasing
education spending in all states. However, in the case of the share of spending on state
administration, the correlation is systematically different between the two groups of states. The
point estimates suggest that in weaker governance states, share of spending on state
administration increases with increasing voter turnout, while in other states the share of
administrative spending falls with increasing voter participation. The correlation in weaker
governance states of increasing spending on state administration with increasing voter turnout is
consistent with weaker governance states relying more on political patronage strategies of jobs
provision to win votes rather than provision of broad public goods. However, the correlation of
turnout with share of administrative spending is not statistically significant when poverty and
inequality are included as controls, which could be because poverty and/or inequality
simultaneously explain turnout and administrative spending, or because of loss in efficiency with
lower sample size.
Discussion
The interpretation of the results presented above that this paper offers is that
comparatively weaker governance institutions in the socially and economically lagging states
enable political agents to use public investment spending for private rent-seeking. This
interpretation extends to the differential correlation of voter turnout with budget composition in
the states characterized as having weaker governance. When faced with increasing electoral
pressures, politicians in weaker governance states have more discretionary room to shift

14
resources to recurring private benefits from government programs that are more effective at
winning votes. The weaker institutions may also enable them to target benefits more effectively
to win or buy votes.
One alternate interpretation of the results is that poorer states have lower private savings
being allocated to investment and therefore governments in these states need to allocate a higher
share of public resources to investment spending to achieve growth. However, this interpretation
of growth promoting or productive public investment is inconsistent with the poor or indifferent
growth performance of these states for most of the years of their existence. As indicated above,
even though Ahluwalia (2000) finds that two of these states—Madhya Pradesh and Rajasthan—
improved their growth performance after the liberalization reforms in the 1990s, this
performance improvement is recent, and quite different from the other three—Bihar, Uttar
Pradesh, and Orissa—which were especially disappointing. This alternate interpretation also
does not lend itself easily to explaining the negative correlation within these states of voter
turnout and public investment spending.
Other interpretations could focus on whether or how underlying changes in poverty,
inequality, or human and social development, that are not sufficiently captured in the empirical
specification, may drive both voter participation and budget composition and account for the
correlations observed in this paper. The two groups of states distinguished here on the basis of
reputation in governance are also distinct with regard to other socio-economic characteristics—
the lower governance group has higher poverty and inequality, lower human development and
social or political cohesion, on average, than the other group.15 The lower governance group also
15 A recent argument by Singh (2010) focuses on social and political cohesiveness, or a stronger shared sub-national identity, as the explanation for different levels of social and human development in Kerala and Tamil Nadu, contrasted against Uttar Pradesh and Rajasthan.

15
has substantially lower voter turnout—over a long period of regular elections from 1960 to 2005,
the mean and median turnout in this group is around 52 percent, contrasted against 66 percent for
the higher governance group.
Alternate explanations focusing on underlying determinants of poverty, inequality, and
social or political institutions would therefore need a theory of why these factors would be
correlated with higher share of capital spending, without growth (as discussed in the previous
paragraph), if not through the channel of rent-seeking as argued in this paper. That is, even if the
correlation between voter participation and budget composition is viewed as the outcome of
underlying socio-economic conditions that contribute simultaneously to reduced turnout and
greater share of capital spending, the most plausible channel for such correlation is the use of
infrastructure spending for rent-seeking by political agents rather than the actual provision of
broad public goods for citizens at large.
Perhaps the most puzzling issue presented by the observed negative correlation between
voter turnout and share of capital spending is its inconsistency with household survey evidence
on reported prioritization of capital infrastructure—roads, water, electricity—by an
overwhelming majority of respondents.16 New experimental evidence on the nuances of voting
behavior provides some answers. Finan and Schechter (2010) explore the role of social
preferences such as reciprocity, the psychological pressure to return a favor received from
someone, in shaping electoral strategies of vote buying. Combining experimental games that
measure the strength of reciprocal feelings among individuals with survey data on vote-buying
16 Reverse causation, that greater relative allocation to capital spending would contribute to lower turnout, also does not seem plausible given this survey evidence—if voters care more about capital infrastructure relative to social sectors, greater government activity in their preferred sector may be expected to increase their participation. Unless, of course, they are more likely to be satisfied with government and greater satisfaction keeps them away from the polls. However, there is nothing in the literature or data to suggest that actual access to infrastructure in the low governance states is of the quality that would support such an argument.
16
offers made to individuals in the country of Paraguay, they find that political agents target vote
buying to individuals with greater feelings of reciprocity. A large literature on get-out-the-vote
campaigns in the US finds that personal or direct contact with households are the most
persuasive in getting them to vote on election day, compared to other strategies that are more
broadly targeted, such as distributing pamphlets (DellaVigna and Gentzkow, 2009).
This argument might logically extend to comparing the marginal vote-returns from
spending on broad public goods versus privately targeted transfers—broadly provided public
goods might not generate the same strength of reciprocal feelings in individual voters as do
private, one-to-one transfers. Even when an incumbent government provides broad public goods,
voters that are targeted with private benefits from a rival party might still vote against the
incumbent. Political studies of vote-buying, largely concentrated in Latin America and in poorer
constituencies in the US, have provided theoretical arguments as well as empirical evidence that
low-income or poor voters are more likely to be targeted with vote-buying offers, and more
likely to comply (Harding, 2008; Stokes, 2005; Brusco et al, 2004).
Others have argued for India that since the poor live at or near subsistence levels they are
more likely to reward with a vote even a small welfare transfer made directly to their household
rather than broad performance in the delivery of public goods (Varshney, 2000). Their private
voting action may therefore be at odds with their publicly declared preferences for public goods,
such as when they answer questions about priority problems for the village. The nature of voting
behavior, especially among the poor, alluded to in this literature implies that jobs and welfare
transfers may be a lower risk electoral strategy in terms of the expected vote returns compared to
a strategy that invests in broad public goods.

17
Jobs and welfare transfers may also provide larger vote returns than investments in broad
public goods for lower ranges of public spending. Nooruddin and Chhibber (2008) argue that
Indian state governments indeed struggle with substantial restrictions on the fiscal space
available to them for discretionary public spending, and that declining fiscal space within states
over time is associated with increasing electoral volatility. Providing infrastructure as a broad
public good to sufficiently large numbers of voters is costly in budget terms, especially if
recourse to user charges for financing is politically difficult. If prior committed government
spending (such as on unionized public sector jobs accumulated over past years) reduces the
amount of public resources over which new incumbents have discretion, and raising taxes is
costly, populist spending on private transfers may be the dominant electoral strategy compared to
the low levels of public goods that can be provided with limited fiscal resources.
Khemani and Wane (2008) provide a model of costly taxation (limitations to fiscal space)
and rent-seeking political parties which predicts that when poor swing voters become too
demanding, parties can give-up re-election altogether and follow predatory fiscal policies, or
come together in coalition governments to continue to serve the vested interests of organized
groups at the expense of benefits to (unorganized) voters at large. The section below adapts this
Khemani-Wane model to the choice of spending on public goods versus private transfers to
swing voters, to provide some theoretical notation for the intuition of this discussion.
The effort here is to find an explanation for the observed correlation between voter
turnout and budget composition that does not hinge upon assuming different preferences for the
median voter, as in the work of Ghate (2008) and Dasgupta and Kanbur (2007), for example.
This is because explanations based on median voter preferences would be hard-pressed to
address the challenge of the reported household survey evidence that citizens across caste and

18
income lines uniformly prioritize physical infrastructure over social services such as education in
their demands from government. The theoretical framework below attempts to derive greater
allocation to social spending with increasing voter turnout as the preferred electoral strategy of
political agents whose objective is to maximize their or their group’s self-interest subject to a re-
election constraint.
A theoretical framework for populist fiscal policy
Consider a population with 3 groups indexed by j. The welfare of group j’s member is
given by:
)(),( gHcgcW jj
W( ) is an increasing and concave function, jc is private consumption, and g is a general
public good such as village-wide infrastructure provision. Two of these groups are economic
elites, controlling different economic resources, paying taxes, and organized into political
interest groups (political parties) to gain private rents from office and public spending. The third
group is poor, with income normalized to zero (and hence does not pay taxes), is not organized
into a political group and therefore votes solely on the basis of individual benefits received from
government spending. Let the 2 elite groups organized into political parties be designated 1P ,
and 2P , and the third group of unorganized voters be designated as the swing voters S . 17 The
size of each group is denoted by j , for SPPj ,, 21 .
17 The characterization of this group as swing voters is consistent with several different characterizations in the literature of what it means to be “swing”. First, swing voters in this model are indifferent between voting for or against an incumbent government, based upon comparing the benefits of economic policy against a reservation utility (as in Persson et al; 2006). Second, swing voters in this model are not ideologically attached to political parties, and vote only the basis of evaluating general public policies of incumbent governments (as in Lindbeck and Weibull, 1987; Dixit and Londregan, 1995, 1996; and much of the political science literature). Third, some models
19
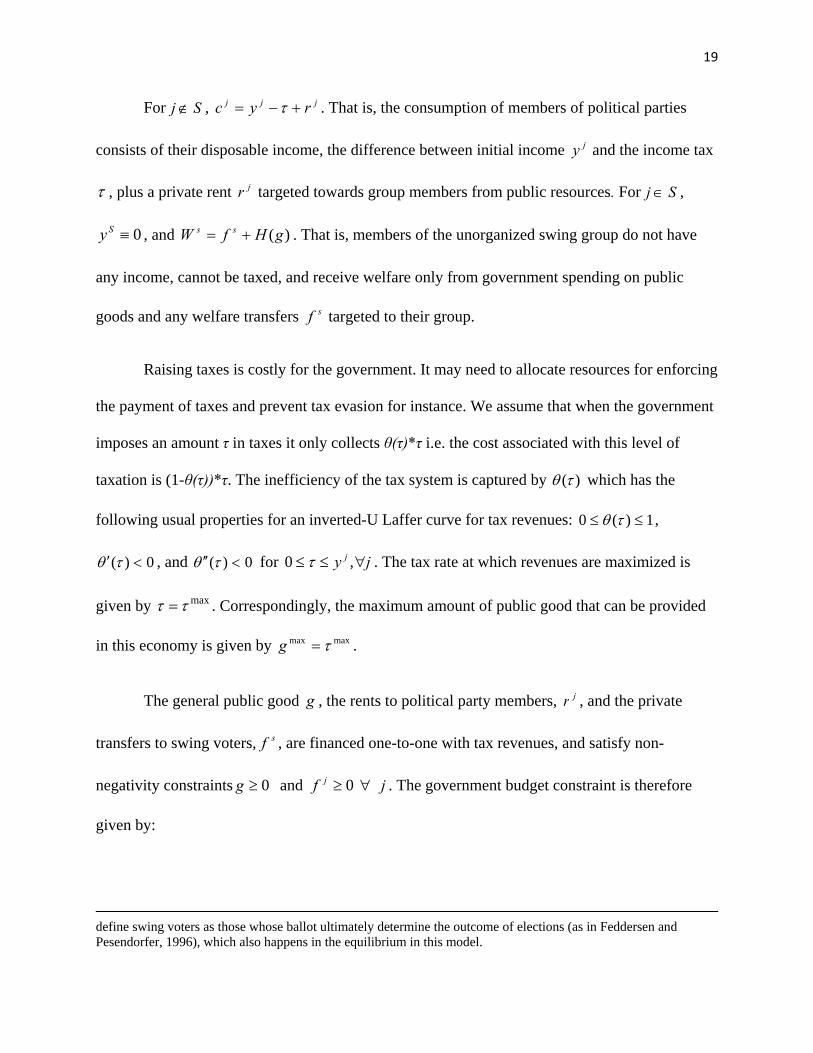
For Sj , jjj ryc . That is, the consumption of members of political parties
consists of their disposable income, the difference between initial income jy and the income tax
, plus a private rent jr targeted towards group members from public resources. For Sj ,
0Sy , and )(gHfW ss . That is, members of the unorganized swing group do not have
any income, cannot be taxed, and receive welfare only from government spending on public
goods and any welfare transfers sf targeted to their group.
Raising taxes is costly for the government. It may need to allocate resources for enforcing
the payment of taxes and prevent tax evasion for instance. We assume that when the government
imposes an amount τ in taxes it only collects θ(τ)*τ i.e. the cost associated with this level of
taxation is (1-θ(τ))*τ. The inefficiency of the tax system is captured by )( which has the
following usual properties for an inverted-U Laffer curve for tax revenues: 1)(0 ,
0)( , and 0)( for jy j ,0 . The tax rate at which revenues are maximized is
given by max . Correspondingly, the maximum amount of public good that can be provided
in this economy is given by maxmax g .
The general public good g , the rents to political party members, jr , and the private
transfers to swing voters, sf , are financed one-to-one with tax revenues, and satisfy non-
negativity constraints jfg j 0 and 0 . The government budget constraint is therefore
given by:
define swing voters as those whose ballot ultimately determine the outcome of elections (as in Feddersen and Pesendorfer, 1996), which also happens in the equilibrium in this model.

20
)( Rgfr ss
Sj
jj
where
Sj
jR )()( is the government’s tax revenue when the tax rate is .
The politics. The two political parties 1P , and 2P compete during elections to win a
majority of votes, and choose the policy vector ],,[ jfgp . Any member of the political
parties, j for 21 , PPj can be a candidate. The political party that wins office chooses policies
to maximize the welfare of its members (core constituents) subject to a re-election constraint (to
be derived below), in addition to the budget constraint specified in equation (2) above. The
objective function of party j in government is given by:
BgHry jj
fg j
)]([ j
},,{max
B represents the rents or benefits (outside of fiscal policy) from holding office, which are
shared equally among all members of the party. Note that swing voters and opposition party
supporters do not enter the government’s objective function. Any transfers to them would be
determined by their role in the re-election constraint to be derived below. Political parties in this
model are therefore both partisan and opportunistic. They cater to the interests of their core
constituents once in office, but also choose policies to try to win elections and gain office. The
core-supporters j of political party j, always vote for the party to which they are attached,
consistent with the party’s objective of maximizing the welfare of its supporters subject to re-
election and budget constraints.

21
The unorganized or swing voters cast their ballot for the incumbent government if their
welfare under government policy, sfgH )( is higher than or equal to a reservation utility
parameter ω; otherwise they vote for the opposition. The swing voters’ reservation utility
parameter ω is distributed on the support ],[ , with density f and cumulative F which are
common knowledge.18
When the incumbent implements the policy ],,[ jfgp it can expect to receive
))(( sS fgHF of swing voters’ ballots. The remaining swing voters )))((1( sS fgHF
will punish the incumbent and vote for the opposition. The incumbent government party Gj
therefore receives ))(( sSG fgHF of the votes. The reelection constraint is given by:
S
GSsfgHF
2))(( or )()( 1 FfgH s
Where )( GGG is the difference in size of the core constituents of the two
political parties. is the minimum swing votes the incumbent government needs to win re-
election.
The political distortion. In the absence of political considerations, a utilitarian social
planner would solve only the public goods and taxation problem, setting all targeted transfers to
zero. The public good optimization problem is therefore:
Sj
jj
fgygH
Gjj
][)(max},,{
18 We assume that 0 i.e. the swing voters expect to be at least as well off as under laissez-faire with no
taxation and no public goods or spending targeted to them.

22
subject to
Sj
jRg )()( , 0g , and y 0 .
The solution is familiar, given by: 1])([)( 1* gH , ** )( gR The level
of public goods supplied in the utilitarian optimum equates marginal social benefit of the public
good to its marginal social cost of production. The utilitarian government raises just enough
taxes to finance the production of the public good, spending nothing on targeted transfers to
organized interest groups or individual swing voters.19
When political considerations are taken into account, the incumbent political party will
deviate from this optimum and aim to provide targeted transfers to its core constituents, and
perhaps also to some swing voters to win elections. The extent to which it is able to capture
public benefits for its core supporters depends upon its prospects for gaining public office which
in turn depends upon how demanding swing voters are, or the function F(ω) chosen by nature.20
We now derive the preferred levels of the tax, the public good, and targeted rents of an
incumbent political party, denoted by G* , Gg * , Gr * respectively, or the policy package
incumbents would implement if their re-election constraint were ignored or not binding. A
government’s optimization of the welfare of its core constituents consists of a two-step
19 If the objective of the social planner is redistribution, to equalize welfare or to guarantee a minimum level of welfare for the poorest group, then private transfers to the poorest may emerge in equilibrium depending on the gains to welfare from public goods versus private transfers. 20 In our model, if voters could cooperate and choose the distribution of reservation utilities (as in Persson et al. , 2000) they will set it in a way to extract the maximum amount of public good from whatever government is in place. This assumption is, however, unrealistic since it requires a high level of information. It is also inconsistent with our modeling of swing voters as unorganized, and therefore unable to coordinate. We instead consider atomistic voters who cannot communicate or cooperate. Each swing voter will then independently set her reservation utility or will be assigned one by nature.
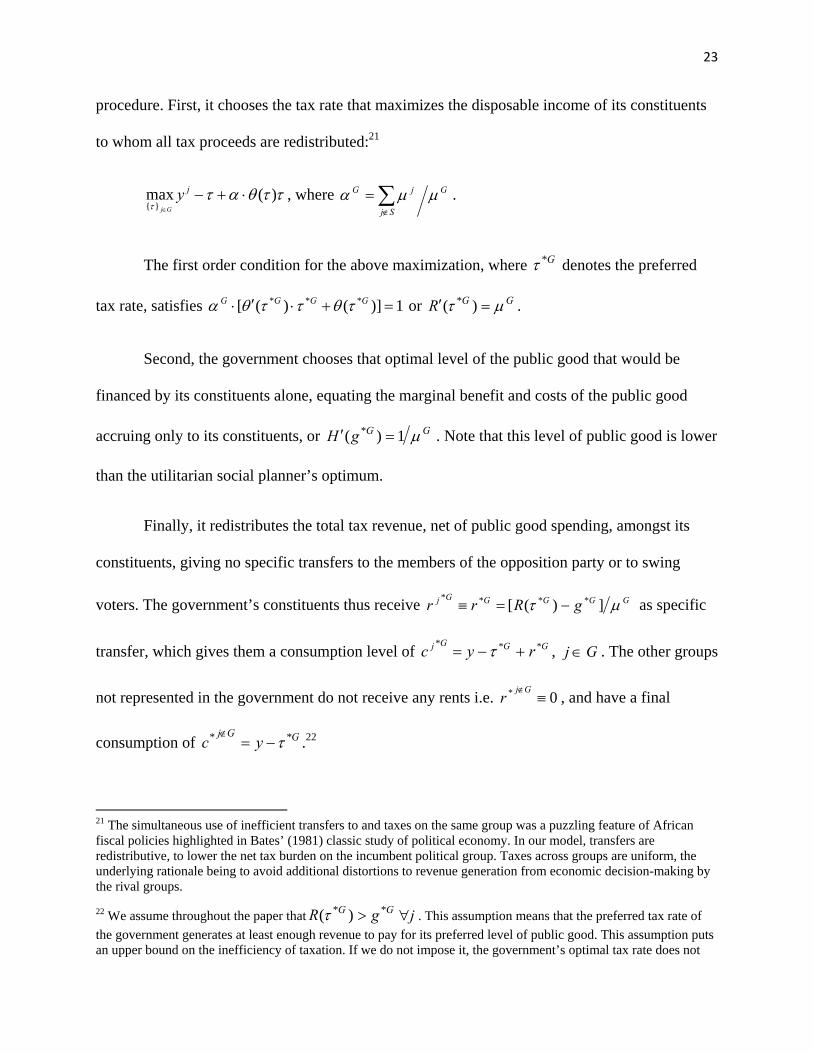
23
procedure. First, it chooses the tax rate that maximizes the disposable income of its constituents
to whom all tax proceeds are redistributed:21
)(max}{
jyGj
, where G
Sj
jG
.
The first order condition for the above maximization, where G* denotes the preferred
tax rate, satisfies 1)]()([ *** GGGG or GGR )( * .
Second, the government chooses that optimal level of the public good that would be
financed by its constituents alone, equating the marginal benefit and costs of the public good
accruing only to its constituents, or GGgH 1)( * . Note that this level of public good is lower
than the utilitarian social planner’s optimum.
Finally, it redistributes the total tax revenue, net of public good spending, amongst its
constituents, giving no specific transfers to the members of the opposition party or to swing
voters. The government’s constituents thus receive GGGGGj gRrr ])([ **** as specific
transfer, which gives them a consumption level of GGGj ryc *** , Gj . The other groups
not represented in the government do not receive any rents i.e. 0* Gj
r , and have a final
consumption of GGjyc **
.22
21 The simultaneous use of inefficient transfers to and taxes on the same group was a puzzling feature of African fiscal policies highlighted in Bates’ (1981) classic study of political economy. In our model, transfers are redistributive, to lower the net tax burden on the incumbent political group. Taxes across groups are uniform, the underlying rationale being to avoid additional distortions to revenue generation from economic decision-making by the rival groups.
22 We assume throughout the paper that GG gR ** )( j . This assumption means that the preferred tax rate of
the government generates at least enough revenue to pay for its preferred level of public good. This assumption puts an upper bound on the inefficiency of taxation. If we do not impose it, the government’s optimal tax rate does not

24
The incumbent government can choose its preferred policy package when its preferred
level of public good is sufficient to win the minimum swing votes needed for electoral victory, or
))(( *GgHF . It would also choose this when re-election is entirely out of reach, which
happens when swing voters are too demanding and the minimum swing votes required for
victory cannot be obtained even by spending all revenues on them at the maximum tax rate max
That is, governments anticipate defeat in an upcoming election, and implement predatory policy
(their most preferred policy).
Incumbent government’s constrained choice under re-election. Suppose that the
distribution of reservation utilities is such that ))(())(( max* gHFgHF G . The government can
then either increase the level of the public good or provide targeted transfers to swing voters until
it receives the minimum swing votes . Following the discussion of voter behavior in the
previous section, we explore the implications of assuming that the reservation utility parameter
for the voting decision is distributed such that some swing voters can be “bought” much more
cheaply with low levels of private transfers, than the vote gain from increasing public goods for
everybody. That is, at the level of public good preferred by the members of the incumbent
government, reallocating some resources from their private rents towards transfers to some
swing voters would lead to larger marginal gains in votes received than reallocating to the public
good:
s
sGsG
f
fgHF
g
fgHF
))(())(( **
(2)
change but the amount of public good provided becomes )}(),1({ *1* GGG RHMaxg which may entail
some rationing.

25
If the incumbent party chooses to seek re-election, it would provide private transfers to
swing voters just up to the point where it meets the reelection constraint. The constrained optimal
amount of private transfers to swing voters for a government seeking re-election is therefore
given by *sf where )))(( ** sG fgHF .
The government would attempt to finance the provision of these transfers, by diverting
tax revenues collected through its preferred rate G* from rents for its constituents. If G*
generates enough revenue to finance the vote-buying transfers then it is the rate the government
would choose. However, if G* falls short of the revenue needed to finance the vote-buying
transfers necessary for reelection, the re-election constrained tax rate would have to be increased
to G which is just necessary to finance the transfers i.e. sGG fgR **)ˆ( . The optimal tax
rate for a government seeking re-election is thus given by: }ˆ,{ˆ ** GGG Max .
In any event, the share of government spending towards programs that provide private
transfers would increase, relative to spending on goods like infrastructure which, in the model
and interpretation adopted here, either function as broad public goods, g , or vehicles for rents,
jr , to the organized interests that political parties serve. In this theoretical framework, the
political distortion to public spending policy is “populist” in the sense that it skews resource
allocation to private transfers to win votes from the least demanding of voters (with low
threshold values of welfare to determine their vote), at the lowest cost to political rent extraction,
and, at the expense of broad public goods that would benefit larger numbers. This
characterization of populism seems consistent with what is described more informally in writings
on economic prospects in India (Acharya, 2004).

26
Indeed, the critical assumption required to derive the result of populist policy is that
voting behavior is skewed towards rewarding private transfers instead of broad public goods, the
condition (2) above. Lizzeri and Persico (2004) use completely opposite assumptions, of the
increasing value of the public good to pivotal voters, to explain the extension of suffrage by
English elites in the mid-late 1800s. They argue and provide some evidence that in England, the
increase in the value of urban public goods following the industrial revolution (public health
infrastructure such as sewerage, waterworks and paved roads), led to a majority of the franchised
elite pushing for reforms to extend the suffrage so that political parties would have stronger
incentives to deliver these public goods. They show that following suffrage reforms, spending by
municipal corporations on public health and sanitation infrastructure increased substantially.
That is, a diametrically different conclusion than that provided here of shifting spending to
private transfers.
Persson and Tabellini (2000) show more generally that in models of rent-seeking by
politicians if voters can coordinate their voting decision through their value of a broad,
indivisible public good, then they can discipline the incumbent and reduce political rents. In
contrast, in his seminal contribution to this literature, Ferejohn (1986) shows that in the absence
of public goods, and with distributional conflict for private transfers among voters, political
effort for constituents’ welfare ends up being minimal, and rent extraction large.
In states with weaker governance institutions, greater poverty and social inequality, the
lack of voter coordination on broad public goods may be exacerbated, and the effectiveness of
small private transfers to win votes may be enhanced. This may explain the greater and
differential correlation of budget composition and voter turnout in the poorest states in India,
which are also characterized as having weaker governance compared to others. As voter

27
participation increases, spending becomes more populist (small private transfers to win votes
from the poorest) rather than focused on the delivery of broad public goods.
The risks of greater political participation for public spending policies examined in the
previous section may extend to other kinds of public policies for infrastructure provision, such as
the management of public utilities and state owned enterprises, and the facilitation of private
investments in infrastructure. Public utilities may serve both rent-extraction and populism,
providing subsidized services to win votes, at the expense of investments needed for reliable
functioning of the utility. Partnership with private investors may be hampered by non-transparent
land lease policies, and lack of credible commitment by the government to allow levy of user
charges to recover returns from investment.
Populist pressure on public policy—opportunity for reform?
Yet, greater political participation, particularly in recent years, may also provide
opportunities to shift the equilibrium of electoral competition away from populist distribution of
private transfers towards greater voter coordination on broad public goods. Large scale political
mobilization and empowerment of poor and traditionally disadvantaged social groups over the
1990s documented through voter surveys may yet become an opportunity for reform.
According to a national survey of voting behavior conducted in 1996, 75 percent of the
sample respondents were not guided by anyone in their voting decision, and of the 25 percent
who sought advice only 7 percent sought it from caste and community leaders (Oldenburg,
1999). Based on detailed interviews of village residents in a sample of north Indian villages,
Krishna (2003) concludes that political parties can no longer rely on big landlords and caste
leaders to mobilize the votes. Studies of electoral performance show that state and national
elections are characterized by volatility, that is, large party-vote swings between elections; party

28
fragmentation, that is, significantly more than two effective number of competing parties; and
incumbency disadvantage, that is, incumbents face a lower probability of getting elected than do
comparable competitors (Yadav 2000, 2004; Chhibber and Nooruddin, 2008; Linden, 2004).
This political trend could improve the alignment of political interests with development
interests if voters could better coordinate their evaluation of governments on the basis of the
quality of public goods, and indeed reward well-performing incumbents. New political
leadership may be persuaded to overcome incumbency disadvantage and electoral volatility by
undertaking institutional reforms that enable voter coordination and higher electoral returns from
public goods platforms.
One area of institutional reform with the potential to achieve voter coordination is to
decentralize urban infrastructure and its financing (powers to levy user charges and property
taxes) to urban local governments. Directly elected and fiscally empowered urban local
governments might be able to tap the willingness to pay for services among better-off residents,
and develop political reputation for delivering better quality services. Urban residents might be
better able to solve the voter coordination problem because of their concentrated need for better
public services, and the large cost of pursuing private alternatives. It is probably not an accident
that voter coordination on a public goods platform in post industrial revolution 19th century
England described by Lizzeri and Persico (2004) happened around municipal infrastructure.
Successful performance in running urban local government might enable political parties to
develop more credible rural public goods platforms on which rural residents can coordinate.
India is unique among urbanized and growing economies in its low levels of revenue
decentralization to municipalities, as most local revenue powers are retained by state
governments. The model of populist fiscal policy explored here may also explain why state

29
governments instead pursue grants-financed decentralization to rural bodies, primarily for
beneficiary selection of poverty alleviation programs. Khemani (2010) uses this model to argue
that states pursue grants-based rural decentralization to retain control rights over urban revenues
to enable discretionary spending on vote-buying programs from rural constituencies. The rapidly
changing pattern of voter demographics in rural areas, and migration to urban areas, may
however change these political incentives and create an enabling environment for urban
decentralization.
Deliberate governance interventions by civic society organizations in evaluating
performance of political agents and disseminating information about it might also enable voters
to solve their coordination problem (Jenkins and Goetz, 1999; Goetz and Jenkins, 2001; Paul,
2002; Khemani, 2007; Banerjee et al, 2010). While much of the existing work on information for
accountability focuses on changes in the behavior of frontline service providers in small
jurisdictions, the recent experience of the Member of Parliament Local Area Development
Scheme (MPLADS) suggests that dramatic changes in the behavior of political agents can be
effected if specific information about their performance is compiled and broadly disseminated in
mass media. Keefer and Khemani (2009) document that the first three cohorts of MPs entitled to
the MPLADS fund hardly used these resources to provide infrastructure to their constituents,
with the mean and median constituency using only 36 percent of the total allotted funds.
However, after extensive media coverage of the lack of effort by MPs to use their funds, the
fourth cohort of MPs increased utilization to 85 percent at the median.
The country of Brazil provides some particularly encouraging examples of how
information dissemination and decentralization to municipal governments can be combined to
improve political incentives for public goods. One celebrated example comes from the state of
30
Ceara, where a reform-minded governor flooded radio airwaves in the early 1990s with messages
about how infant and child mortality could be drastically reduced through particular public
programs of municipal governments. Tendler (1997) describes how this brought political
pressure to bear upon the mayors to actually deliver basic health services. The state also created
a new class of public health workers through a publicized recruitment effort that conveyed
information to communities about the valuable role the workers could play in improving public
health through community-wide effort. Such information campaigns have been credited with
bringing a remarkable turnaround to the politics of the state—from being “clientelist” and
patronage-based, to becoming service-oriented.
More recently, Brazil has been the source of another innovative experiment in reducing
local political rent-seeking by generating and providing credible information to citizens. In May
2003 the national government of Brazil launched an anti-corruption program based on the
random auditing of municipal government expenditures by an independent public agency, and
then publicly releasing audit findings on the internet and to media sources.23 New evidence from
more than 600 municipalities covered by the audit suggests that the disclosure of information
significantly and substantially reduced the re-election rates of mayors that were found to be
corrupt (Ferraz and Finan, 2008). Furthermore, this impact was significantly more pronounced in
municipalities with greater access to radio stations, presumably because of greater revelation of
information.
Conclusion
23 In Portuguese, this program is called Programa de Fiscaliza¸c˜ao a partir de Sorteios P´ublicos, details of which is available from the following website: www.presidencia.gov.be/cgu.

31
To summarize in concluding, this paper has examined a puzzle in the political economy
of infrastructure in India—the co-existence of relatively low shares of capital spending in public
budgets alongside evidence of large demand for village infrastructure from poor voters. It has
argued that this pattern is due to infrastructure projects being used at the margin for political
rent-seeking, while spending on employment and welfare transfers are the preferred vehicles to
win votes for re-election. New suggestive evidence on the variation of public spending
composition across states, and within states over time is offered that is consistent with this
argument. The share of capital spending is estimated to be higher in states that are reputed to
have poorer quality governance, where rent-seeking may be easier, and declines within these
states when they experience greater voter participation. In contrast, share of spending on social
programs that provide employment and welfare transfers to the poor are lower in weaker-
governance states, and increase in all states with increases in voter turnout.
The paper interprets this evidence in the broader context of populist pressures on public
policies. It presents some preliminary ideas for how greater political participation may become
an opportunity for institutional reform to improve political incentives for better infrastructure
policy. These ideas would be worth exploring in future policy dialogue and policy research.

32
References
Acharya, S. 2004. “India’s growth prospects revisited,” Economic and Political Weekly, October
9, 4537-4542.
Ahluwalia, M. S. 2000. “Economic performance of states in post-reforms period,” Economic and
Political Weekly, May 6, 1637-1648.
Banerjee, A., R. Banerji, E. Duflo, R. Glennerster, and S. Khemani, 2010. “Pitfalls of
Participatory Programs: Evidence from a randomized evaluation in education in India,”
American Economic Journal: Economic Policy, 2(1): 1-30.
Banerjee, A., R. Banerji, E. Duflo, R. Glennerster, D. Keniston, S. Khemani, and M. Shotland.
2007. “Can Information Campaigns Raise Awareness and Local Participation in Primary
Education?” Economic and Political Weekly, April 14, 42(15): 1365-1372
Ban, R. and V. Rao, 2009. “Is deliberation equitable? Evidence from transcripts of village
meetings in south India,” Policy Research Working Paper No. 4928, Development
Research Group, The World Bank, Washington DC
Besley, T., R. Pande, and V. Rao, 2004.”The politics of public good provision: Evidence from
Indian local governments,” Journal of the European Economic Association, April-May
Beteille, T. 2009. “Absenteeism, Transfers, and Patronage: The Political Economy of Teacher
Labor Markets in India,” PhD Dissertation, Stanford University
Brusco, V., M. Nazareno and S. Stokes. 2004. “Vote Buying in Argentina." Latin American
Research Review, 39(2):66-88.
Chattopadhyay, R. and E. Duflo, 2004. “Women as Policy Makers: Evidence from a randomized
policy experiment in India,” Econometrica, 72(5): 1409-1443

33
Chhibber, P. and I. Nooruddin, 2004. “Do party systems count? The number of parties and
government performance in the Indian states,” Comparative Political Studies, 37(2): 152-
187
Dasgupta, I. and R. Kanbur, 2007. “Community and class antagonism,” Journal of Public
Economics, 91: 1816-1842
DellaVigna, S. and M. Gentzkow, 2009. “Persuasion: Empirical Evidence,” NBER Working
Paper No. 15298, National Bureau of Economic Research, Cambridge, USA
Ferejohn, John (1986). “Incumbent performance and electoral control.” Public Choice 50: 5-
26.
Ferraz, C. and F. Finan. 2008. “Exposing Corrupt Politicians: the effect of Brazil’s publicly
released audits on electoral outcomes,” Quarterly Journal of Economics, 123(2): 703-
745.
Filmer, D., J. S. Hammer, L. H. Pritchett, 2000. “Weak Links in the Chain: A Diagnosis of
Health Policy in Poor Countries,” World Bank Research Observer, 15(2): 199-224.
Finan, F. and L. Schechter. 2010. “Vote-buying and reciprocity,” Mimeo, Department of
Economics, University of California—Berkeley, Berkeley, USA
http://www.econ.berkeley.edu/~ffinan/Finan_VB.pdf
Ghate, C. 2008. “Understanding divergence in India: a political economy approach,” Journal of
Economic Policy Reform, 11 (1): 1-9

34
Goetz, Anne Marie, and Rob Jenkins, 2001. ‘Hybrid Forms of Accountability: Citizen
Engagement in Institutions of Public-Sector Oversight in India’, Public Management
Review, 3(3): 363-84
Harding, Robin. 2008. “Vote Buying Across Africa.” Mimeo. Department of Political Science,
New York University
Jenkins R. and A.M. Goetz. 1999. 'Accounts and Accountability: Theoretical Implications of the
Right-to-Information Movement in India.' Third World Quarterly. Vol. 20. No. 3.
Keefer, P. and S. Khemani. 2009. “When do legislators pass on “pork”? The Role of Political
Parties in Determining Legislator Effort,” American Political Science Review, 103(1): 99-
112.
Keefer, P. and S. Khemani. 2005. “Democracy, Public Expenditures, and the Poor,” World Bank
Research Observer, 20:1-27
Keefer, P. and S. Khemani. 2004. “Why do the Poor Receive Poor Services?” Economic and
Political Weekly, February 2004, 39(9): 935-43.
Keefer, P. and S. Knack, 2007. “Boondoggles, rent-seeking, and political checks and balances:
public investment under unaccountable governments,” Review of Economics and
Statistics, 89(3): 566-572
Khemani, S. 2010. “Political Capture of Decentralization: Vote Buying through Grants-Financed
Local Jurisdictions.” Mimeo, Development Research Group, The World Bank (Prepared
for the Decentralization Task Force, Initiative for Policy Dialogue, Columbia University)
Khemani, S. and W. Wane. 2008. “Populist Fiscal Policy”, Policy Research Working Paper No.
4762, Development Research Group, The World Bank, October 2008.

35
Khemani, S. 2007. “Can Information Campaigns Overcome Political Obstacles to Serving the
Poor?” In The Politics of Service Delivery in Democracies: Better Access for the Poor,
Shanta Devarajan and Ingrid Widlund (Eds.), Expert Group on Development Issues,
Ministry for Foreign Affairs, Sweden, 2007
Kingdon, G. and M. Muzammil. 2001. “A Political Economy of Education in India,” Economic
and Political Weekly, 36(32): 3052-3063
Krishna, A. 2003. “Poor People’s Participation in Democracy at the Local level: Information and
Education matter more than Wealth and Social Status”, Working Paper No. SAN03-04,
Terry Sanford Institute of Public Policy, Duke University
Lizzeri, A. and N. Persico, 2004. “Why did the elites extend the suffrage? Democracy and the
scope of government, with an application to Britain’s ‘Age of Reform’,” Quarterly
Journal of Economics, 119(2): 707-765
Paul, Samuel, 2002. Holding the State to Account: Citizen Monitoring in Action. Bangalore,
Books for Change.
Persson, Torsten and Guido Tabellini 2000. Political Economics: Explaining Public Policy.
Cambridge, MA: The MIT Press
Saez, L. and A. Sinha, 2009. “Political cycles, political institutions and public expenditure in
India, 1980-2000,” British Journal of Political Science, 2009:1-23
Singh, Prerna. 2010. “We-ness and Welfare: A longitudinal analysis of social development in
Kerala, India,” World Development, Forthcoming
Stokes, Susan. 2005. “Perverse Accountability: A Formal Model of Machine Politics with
Evidence from Argentina." American Political Science Review, 99(03):315-325.

36
Subramanian, A. 2007. “The evolution of institutions in India and its relationship with economic
growth,” Oxford Review of Economic Policy, 23(2): 196-220.
Tendler, J. 1997. Good Government in the Tropics, Johns Hopkins University Press, Baltimore,
MD
Varshney, Ashutosh, 2000. “Why have poor democracies not eliminated poverty?” Asian Survey
Vol XL, No. 5, September/October 2000, 718-736
World Development Report, 2004. Making Services Work for Poor People. The World Bank,
Washington DC

37
Table 1
Average Budget Composition in major Indian States, 1980-2005
Out of Total Spending a
Out of Developmental Spending b
Share of Capital Spending 13% 16%
Share of Recurrent Spending on all Social Programs
39% 50%
Share of Recurrent Spending on Education
21% 27%
a. Excluding interest payments b. Excluding state administrative expenses and interest payments
Source: Annual issues on state finances published by the Reserve Bank of India Bulletin

38
Table 2 Variation in Budget Composition Across States,
and Within States with Variation in Turnout
(1) Share of Capital Works
1960-2005
(2) Share of Social
Programs 1972-2005
(3) Share of Capital Works
1980-2005
(4) Share of Social
Programs 1980-2005
Turnout*Lower Governance States
-.006287***
(.001) .0055874***
(.001) -.0046577***
(.001) .0052246***
(.001)
Turnout*Higher Governance States
-.001088 (.001)
.0009133*** (.0003)
-.0002049 (.001)
.0008704** (.0004)
F test for Prob > F
0.016 0.000 0.002 0.001
Andhra Pradesh .0508634***
(.009) -.1093236***
(.002) .0350249***
(.002) -.1020997***
(.001)
Bihar .3532005***
(.123) -.3378677***
(.057) .3092692***
(.072) -.3058319***
(.065)
Gujarat .0385882*
(.024) -.1298321***
(.006) .0525851***
(.008) -.1434996***
(.007)
Haryana .0346056***
(.010) -.1851301***
(.002) .0268124***
(.002) -.1615526***
(.002)
Karnataka .0578296***
(.013) -.1230405***
(.002) .0502972***
(.003) -.1189619***
(.002)
Madhya Pradesh .3188593**
(.121) -.3833415***
(.055) .3106019***
(.069) -.3655694***
(.062)
Maharashtra .0412199**
(.018) -.1083631***
(.004) .0526371***
(.006) -.1079113***
(.004)
Orissa .3360527***
(.119) -.3463793***
(.055) .3438026***
(.071) -.3260435***
(.064)
Punjab -.0041389
(.0173) -.1054206***
(.004) .0176884**
(.007) -.0980074***
(.005)
Rajasthan .3637228***
(.124) -.365923***
(.057) .3536187***
(.071) -.3451808***
(.064)
Tamil Nadu -.0391591***
(.010) -.0466253***
(.002) -.0293639***
(.004) -.0482142***
(.003)
Uttar Pradesh .3068779**
(.120) -.3562615***
(.051) .2825757***
(.064) -.3214746***
(.057)
West Bengal -.0214842**
(.008) .0136576***
(.001) -.0238669***
(.001) .0185001***
(.001) R-sq 0.34 0.56 0.36 0.56
N 627 476 364 364 Excluded state is Kerala. Robust standard errors, clustered by state, in parentheses. * Significant at 10%, ** Significant at 5%; ***Significant at 1%

39
Table 3 Variation in Budget Composition Across States,
Controlling for state income, population, poverty, inequality
(1)
Share of Capital Works
1980-2003
(2)
Share of Social
Programs
1980-2003
(3)
Share of Capital Works
1960-1992
(4)
Share of Social
Programs
1972-1992
Turnout*Lower Governance States
-.0042131***
(.001)
. 0048101***
(.002)
-.0054046***
(.001)
.0029056**
(.001)
Turnout*Higher Governance States
-.0010648
(.001)
.0030061*
(.002)
-.0024883*** (.001)
.0039805**
(.002)
F test for Prob > F
0.043 0.49 0.107 0.588
= 1 for Lower Governance States
.2222205**
(.087)
-.0857687
(.160)
.1685886*
(.098)
.0513811
(.111)
Per capita state domestic product (cons)
-3.38e-07
(1.89e-06)
-3.03e-06
(2.56e-06)
Share of agriculture in SDP
.0579515
(.083)
-.2149271
(.147)
Total Population -4.32e-07**
(1.74e-07)
1.43e-07
(2.17e-07)
Rural Poverty Head Count Index
.0009901*
(.001)
.0014053**
(.001)
Rural Gini Coefficient .0017733
(.001)
-.0015996
(.002)
R-sq 0.29 0.33 0.27 0.26 N 336 336 445 294
Robust standard errors, clustered by state, in parentheses. * Significant at 10%, ** Significant at 5%; ***Significant at 1%

40
Table 4 Variation in Administrative and Education Spending Shares Across States,
Controlling for state income, population, poverty, inequality
(1)
Share of Education
1980-2003
(2)
Share of State Administration
1980-2003
(3)
Share of Education
1960-1992
(4)
Share of State Administration
1972-1992
Turnout*Lower Governance States
.0028303**
(.001)
.0018215**
(.001)
.0031893***
(.001)
.0007111
(.001)
Turnout*Higher Governance States
.0012448* (.001)
-.0006547
(.001)
.0033168** (.001)
-.0005694
(.001)
F test for Prob > F
0.304 0.035 0.940 0.221
= 1 for Lower Governance States
-.0865509
(.091)
-.1550651** (.063)
.0314042 (.095)
-.0718648 (.060)
Per capita state domestic product (cons)
-1.88e-06 (1.76e-06)
7.44e-07 (1.23e-06)
Share of agriculture in SDP
-.0523752 (.072)
.134467**
(.052)
Total Population 1.64e-07
(1.93e-07)
3.91e-07***
(9.12e-08)
Rural Poverty Head Count Index
.0003436 (.0004)
.0000785
(.0004)
Rural Gini Coefficient .0005073
(.001) -.0013058*
(.001)
R-sq 0.24 0.36 0.36 0.11 N 336 336 438 288
Robust standard errors, clustered by state, in parentheses. * Significant at 10%, ** Significant at 5%; ***Significant at 1%