Embed Size (px)
Citation preview
Government interventions to support retirement incomes
REPORT BY THE COMPTROLLER AND AUDITOR GENERAL
HC 536 SESSION 2013-14
12 JULY 2013
Department for Work & Pensions and HM Treasury

The National Audit Office scrutinises public spending for Parliament and is independent of government. The Comptroller and Auditor General (C&AG), Amyas Morse, is an Officer of the House of Commons and leads the NAO, which employs some 860 staff. The C&AG certifies the accounts of all government departments and many other public sector bodies. He has statutory authority to examine and report to Parliament on whether departments and the bodies they fund have used their resources efficiently, effectively, and with economy. Our studies evaluate the value for money of public spending, nationally and locally. Our recommendations and reports on good practice help government improve public services, and our work led to audited savings of almost £1.2 billion in 2012.
Our vision is to help the nation spend wisely.
Our public audit perspective helps Parliament hold government to account and improve public services.
Report by the Comptroller and Auditor General
Ordered by the House of Commons to be printed on 11 July 2013
This report has been prepared under Section 6 of the National Audit Act 1983 for presentation to the House of Commons in accordance with Section 9 of the Act
Amyas Morse Comptroller and Auditor General National Audit Office
9 July 2013
Department for Work & Pensions and HM Treasury
HC 536 London: The Stationery Office £16.00
Government interventions to support retirement incomes

This report examines what actions government has been taking since the Pensions Commission reported in 2006 to mitigate the risk to public finances from an ageing population and how effectively it is being managed. It is intended as an overarching report to inform Parliament ahead of more detailed value-for-money reports on specific government actions.
© National Audit Office 2013
The text of this document may be reproduced free of charge in any format or medium providing that it is reproduced accurately and not in a misleading context.
The material must be acknowledged as National Audit Office copyright and the document title specified. Where third party material has been identified, permission from the respective copyright holder must be sought.
Links to external websites were valid at the time of publication of this report. The National Audit Office is not responsible for the future validity of the links.
Printed in the UK for The Stationery Office Limited on behalf of the Controller of Her Majesty’s Stationery Office
2573339 07/13 PRCS

The National Audit Office study team consisted of: Ian Derbyshire, Raymond Fawcett, Claire Hardy, Liam Blanc, George Crockford, Andrew Oliver and Andy Fisher, under the direction of Keith Davis.
This report can be found on the National Audit Office website at www.nao.org.uk/retirement-incomes-2013
For further information about the National Audit Office please contact:
National Audit Office Press Office 157–197 Buckingham Palace Road Victoria London SW1W 9SP
Tel: 020 7798 7400
Enquiries: www.nao.org.uk/contact-us
Website: www.nao.org.uk
Twitter: @NAOorguk
Contents
Key facts 4
Summary 5
Part OneThe risk to public finances 12
Part TwoInitiatives to increase retirement incomes 22
Part ThreeManaging the portfolio of interventions and uncertainty 37
Appendix OneOur audit approach 46
Appendix TwoOur evidence base 48

4 Key facts Government interventions to support retirement incomes
Key facts
£39 billion net amount of tax and National Insurance contribution relief government provided in 2011-12 to encourage saving in pensions
8 million people are expected to save for the first time or save more because of automatic enrolment into workplace pensions
1 per cent increase in GDP that government expects (within six years) from a one-year extension of working lives
£250bnis the amount government spent in 2011-12 on supporting older people and encouraging saving for retirement
10.7mis the number of people aged between 22 and state pension age DWP estimates are not saving enough to achieve the pension income they want or expect in retirement
2.6%is the increased proportion of Gross Domestic Product (GDP) that the Office for Budget Responsibility projects government will spend on pensions and pensioner benefits in 2061-62

Government interventions to support retirement incomes Summary 5
Summary
1 People are living longer and looking after an ageing population presents a major challenge to government. The state is ultimately liable for providing a basic income for the elderly and meeting certain health and care costs. Government spending on state pensions, other financial support, and health and social care for older people has increased substantially over recent decades to £250 billion, 16 per cent of Gross Domestic Product (GDP). Life expectancy is continuing to increase and the working age population is not currently saving sufficiently for retirement. As well as being a current pressure, an ageing population presents a growing risk to public finances.
2 This report examines what actions government has been taking since the Pensions Commission reported in 2006 to mitigate this risk and how effectively it is being managed. It is intended as an overarching report to inform Parliament ahead of more detailed value-for-money reports on specific government actions. The report examines interventions that affect current and future retirement incomes, including: state pensions and benefits for older people; encouraging saving for retirement; and, extending working lives. We report on social care insofar as it affects retirement incomes and incentives to save. Public service pensions, on which we have reported earlier, and health spending on the elderly lie outside the scope of this report. We plan to carry out more work on adult social care in the future. We cover:
• the risks to public finances of an ageing population (Part One);
• the challenges government faces with its initiatives to manage this liability of the state (Part Two); and
• managing the uncertainty (Part Three).

6 Summary Government interventions to support retirement incomes
Key findings
The risks to public finances
3 There are significant future consequences for the taxpayer as people live longer and are likely to be more dependent on the state to look after them. There are four factors which place increasing demands on the public purse and need management:
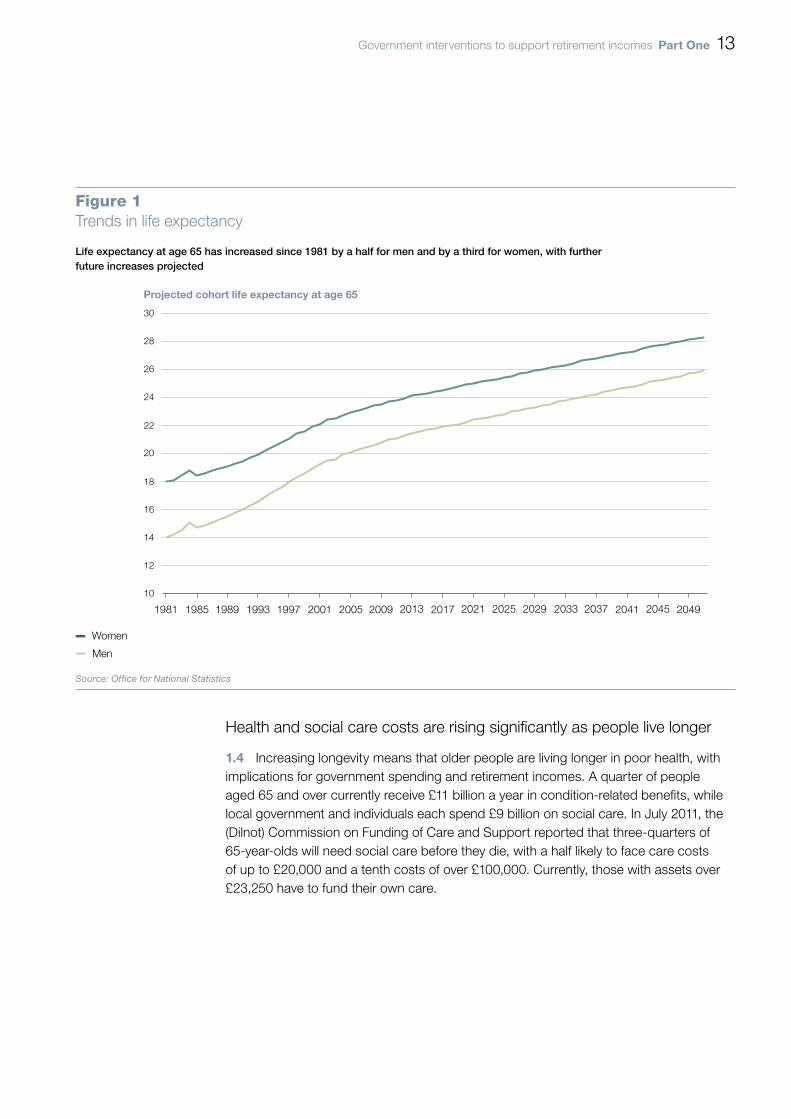
• People are living longer and spending longer in retirement. Between 1981 and 2010, life expectancy at age 65 increased from 14 to 21 years for men and from 18 to 23.7 years for women. The Office for National Statistics (ONS) estimates that by 2050 it will have reached 25.8 years for men and 28.2 years for women (paragraph 1.3 and Figure 1).
• People can expect to spend more than two-fifths of their remaining years from age 65 in poor health. In July 2011, the Commission on Funding of Care and Support reported that three-quarters of 65-year-olds will need social care before they die, with a half likely to face care costs of up to £20,000 and a tenth costs of over £100,000 (paragraphs 1.4 and 1.5).
• People need to save more for retirement, but are saving less. The Department for Work & Pensions (DWP) estimates that 10.7 million people, two-fifths of the working age population, are not saving enough to achieve the income they want or expect in retirement (paragraphs 1.9 and 1.10).
• The proportion of working age people in private sector workplace pension schemes fell between 2002 and 2011 from 47 per cent to 33 per cent and individuals’ annual saving in pensions fell by nearly a fifth. Most private sector employees will receive defined contribution pensions that will be typically much smaller, and less certain, than people with private pensions have received in the past. Defined benefit schemes have mostly been closed to new entrants over the last few years (paragraphs 1.11 to 1.13 and Figures 5 and 7).
4 Government spending on the state pension and pensioner benefits has risen substantially since 1990 and is projected to rise further by 2061. Spending on the state pension and pensioner benefits increased from 5.5 per cent of GDP in 1990 to 6.9 per cent in 2011-12 in part because of the growing pensioner population but also because of increased spending per capita on pensioner benefits and pensions. The Office for Budget Responsibility (OBR) projected, in July 2012, that this spending will rise by a further 2.6 percentage points of GDP, to 9.5 per cent by 2061-62 (paragraphs 1.7 and 1.8 and Figures 3 and 4).

Government interventions to support retirement incomes Summary 7
There are challenges with existing initiatives to manage this problem
5 Governments have been implementing a programme of reforms to help mitigate the potential liability to the state from the ageing population. The programme has been informed by a substantial evidence base and recommendations of the 2002 to 2006 Pensions Commission and involves three key elements (paragraphs 2.2 and 2.3 and Figure 8):
• State pension reforms. Government has increased spending on the basic state pension by uprating it from 2011 by the best of average earnings growth, inflation or 2.5 per cent (‘triple lock’). And from 2016, it plans to introduce for new pensioners a single-tier pension set at a level above the level of basic means-tested support for pensioners. This is intended to improve incentives to save and reduce the proportion of pensioners who receive means-tested benefits (paragraphs 2.5 to 2.7).
• Encouraging saving for retirement. Between 2012 and 2018, all eligible workers are being automatically enrolled into workplace pension schemes, but with the right to opt out. DWP estimates that this will lead to eight million employees newly saving £11 billion a year (in 2012-13 earning terms) and that by 2050 it will increase aggregate private pension incomes by £5 billion to £8 billion a year (in 2011-12 earning terms) and reduce government spending on income-related benefits to the retired by £0.9 billion (paragraphs 2.9 to 2.12).
• Extending working lives. Government has raised future state pension ages to among the highest in the developed world and abolished the default retirement age. It has also extended the right to request flexible working to all employees. DWP projects that each one-year extension in working lives increases GDP by 1 per cent, improves the government’s budget balance by 0.6 per cent of GDP and raises a person’s private pension income by 10 per cent (paragraphs 2.13 and 2.14).
6 The success of encouraging saving through automatic enrolment of employees into a pension will depend on the responses of individuals, pension providers and employers. Automatic enrolment is an innovative approach informed by analysis that has identified inertia as a key factor in savings decisions. Its success will depend on the proportion of employees who remain with schemes and the incomes they receive when they retire. This will depend on the level and duration of contributions, scheme charges and investment performance. DWP and The Pensions Regulator have been working with the pension industry to improve the quality and transparency of defined contribution pensions, but people’s confidence in them has been low and declining. In its November 2012 consultation paper on Reinvigorating Workplace Pensions DWP has suggested amalgamating schemes and asking employers to take on some investment risk. Implementation of automatic enrolment began in October 2012 and employee opt-out rates have been lower than expected, at between 5 per cent and 20 per cent according to early indications to DWP from the largest employers (paragraphs 2.16 to 2.20 and Figure 12).

8 Summary Government interventions to support retirement incomes
7 Many individuals find it difficult to plan for their retirement. The shift to defined contribution pensions has transferred financial risk from employers to individuals. To prepare effectively for retirement, people need to make complex decisions about how much to save, in what fund, and what annuity to choose. They also need a good understanding of what income they are likely to receive when they retire, from the state and private savings. Currently, people have poor awareness of state pension ages and their likely retirement incomes and government recognises that many individuals will need to increase their levels of saving if they are to achieve the retirement incomes they need to be less reliant on the state.. The Money Advice Service leads on government activities to improve the UK’s financial capability, working to improve the effectiveness and provision of financial education, to enable people to understand and manage their finances better. Spending on financial capability has more than doubled since 2006, but so far there is limited direct evidence of impact on outcomes (paragraphs 2.21 to 2.25).
8 Tax incentives have not been successful in encouraging overall saving for retirement. Government provides tax incentives to encourage saving for retirement through pensions because it recognises that pensions are less flexible than other forms of saving. The net cost to government of tax and National Insurance relief to encourage pension saving doubled in real terms to £40 billion in the nine years to 2010-11. Around three-fifths went to higher rate taxpayers, but there has been little evidence of positive impact on overall saving. From April 2011, government placed new limits on the amount of relief available. This helped reduce the annual cost to government by 2 per cent in 2011-12 (paragraphs 2.26 and 2.27 and Figure 13).
9 Government is working to change employers’ attitudes towards training and employing older workers to influence the extent to which working lives are extended. Government has increased the incentives for working longer through raising future state pension ages and enabling people to increase the weekly amount of their state pension by claiming it at a later date. It has also addressed some barriers to extended working through abolishing the default retirement age, extending flexible working and allowing people to claim part of their private (but not state) pension while continuing to work. The average age at which people leave the labour force has been rising and DWP projects it will continue to rise, although less rapidly than the state pension age is to rise. Government has no formal published strategy to influence employers and its spending on communications has been scaled down since 2006, with its focus shifting to working with employer stakeholders (paragraphs 2.28 to 2.31 and Figure 14).

Government interventions to support retirement incomes Summary 9
Managing the portfolio of interventions and uncertainty
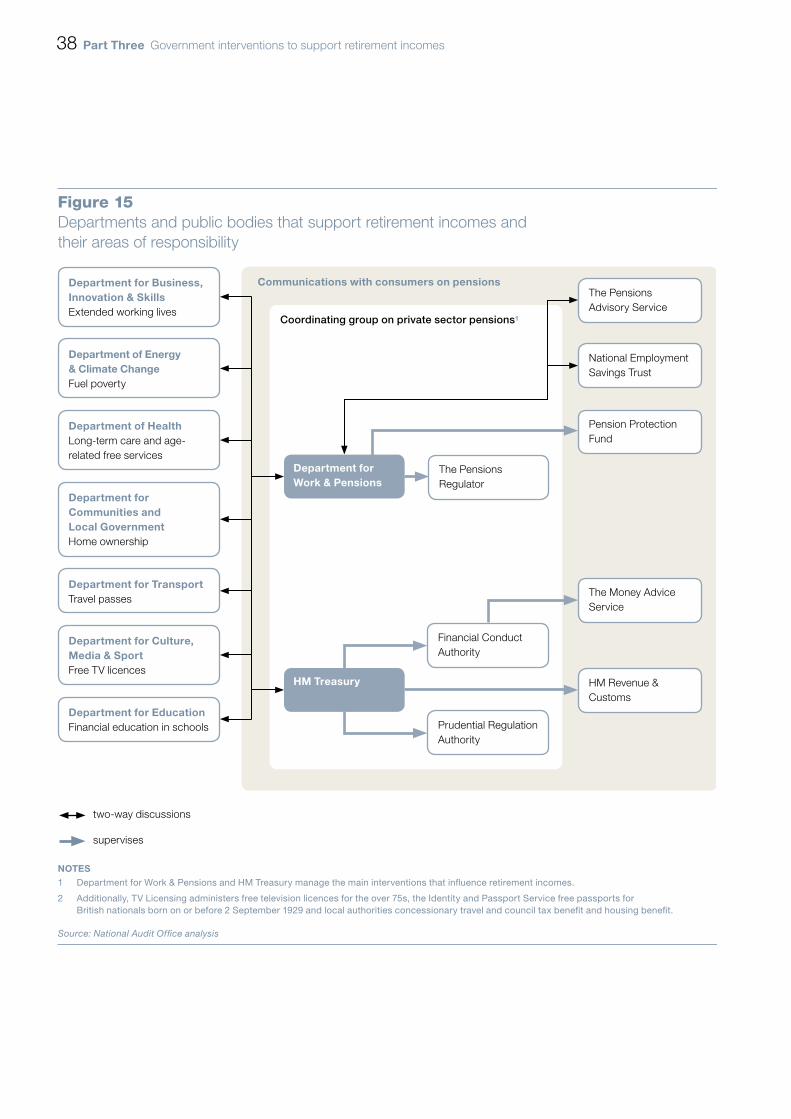
10 Government does not view the interventions that influence retirement incomes as a portfolio with clear responsibility for delivering the intended outcomes. DWP and HM Treasury have strategic lead on the main interventions that influence retirement incomes, but a variety of departments and public bodies, and local authorities, have some involvement. There is no overarching programme or single accountability. Many of the interventions have complex interactions with each other and with other policies and objectives. Some of these interactions extend widely, including home ownership, long-term care funding, quantitative easing, and consumer credit and debt (paragraphs 3.2 to 3.4 and Figures 15 and 16).
11 Without a whole system view, there is a risk that individual, but co-dependent interventions may not be effective in increasing saving for retirement. There are a number of areas where we have identified potential risks:
• Individual interventions are managed separately without adequate consideration of their impact on the overall objective of increasing retirement incomes.
• The Treasury leads on overall savings strategy and tax treatment of pension contributions and DWP on workplace saving, but there is no overall accountability for saving for retirement.
• DWP research suggests that the overwhelming majority of people who save under automatic enrolment can expect to end up better off in retirement than if they did not save, although incentives to save in pensions are diluted for those on low incomes and renters by the interaction with means-tested benefits on retirement. The single-tier pension will improve incentives for those on low incomes who are not renters.
• Differing tax treatments, indexation and eligibility rules for older person benefits add to complexity and risk sending confusing signals.
• Three regulators have oversight of pension providers but they have no common framework for assessing risk and measuring performance.
• Seven public bodies inform the public about pensions and saving for retirement but, outside the automatic enrolment programme, there is no overall strategy or mechanism to make sure they work seamlessly together (paragraphs 3.5 and 3.6 and Figure 17).
12 Efficient allocation of resources is difficult because government does not know the relative costs and benefits of different interventions. Impact assessments provide insight into the distribution of expected benefits between government, individuals and employers but not comparative cost and benefits. But recent programmes, such as automatic enrolment, have been better at identifying critical success factors, measuring baselines and developing evaluation strategies (paragraphs 3.7 to 3.9 and Figure 18).
10 Summary Government interventions to support retirement incomes
13 Long-term costs for government remain highly uncertain. The actual residual liability on the state created by lack of saving for retirement is not known and will be reliant on a number of factors. It depends on trends in healthy life expectancy, inflation, GDP growth, investment returns, migration, and house ownership and on outcomes on saving and extended working (paragraph 3.10).
14 Government has developed mechanisms to manage some of these uncertainties but current projections on income-related and condition-related expenditure may be too optimistic. Government is managing affordability and sustainability through a variety of reforms and policies, including regular reviews of future state pension ages, with the potential to adjust the indexation of benefits. In November 2012, DWP projected that government’s spending on income-related and condition-related benefits on pensioners will fall by 1.3 percentage points of GDP between 2011-12 and 2061-62 to 0.6 per cent of GDP in 2061-62 despite it expecting that the number of pensioners claiming condition-related benefits will double. In March 2013, DWP projected that government spending on state pensions and pensioner benefits will rise as a proportion of GDP between 2011-12 and 2061-62 by only 1.2 percentage points: far below OBR’s forecast of 2.6 percentage points in July 2012. These projections may be too optimistic given trends in house ownership, private pension income and the numbers of older people with physical and mental health conditions (paragraphs 3.11 to 3.13 and Figure 19).
Conclusion
15 Government is implementing a series of measures to help reduce the liability on the state arising from people living longer and under-saving. It is doing so within the constraints of a challenging fiscal position. By increasing the future state pension age, introducing automatic enrolment into workplace pensions and making changes to the state pension the government is expecting to reduce the potential long-term spending liability of supporting people in their retirement. The interaction between these policy changes and other interventions is complex. To maximise effectiveness and mitigate perverse effects, government could benefit from taking a more holistic view of its portfolio of interventions, how they interact and their relative costs and benefits to ensure they are being managed coherently. This should be done in a proportionate way that enables DWP and the Treasury to take a central overview and provide clear accountability for the interventions that contribute to the aim of increasing retirement incomes.

Government interventions to support retirement incomes Summary 11
16 The value of the UK state pension, as a proportion of pre-retirement earnings, has historically been low compared to other developed countries and projections for future spending on state pensions and pensioner benefits (as a share of GDP) may prove too optimistic. To manage this risk, government needs to be more active and effective in:
• influencing individuals to save more;
• working with employer stakeholders to influence those employers who have negative attitudes towards older workers;
• enabling people to financially plan effectively for retirement; and
• influencing pension providers to improve their schemes’ transparency and value for money.

12 Part One Government interventions to support retirement incomes
Part One
The risk to public finances
1.1 This part describes:
• the pressures on public spending to support older people in retirement;
• trends in public spending on older people; and
• how people are saving for retirement.
Pressures on public spending arising from increasing longevity and under-saving
1.2 There is increasing pressure on government spending on older people arising from three trends:
• people are living longer and spending longer in retirement;
• increasing health and social care needs; and
• people need to save more for retirement but are saving less as membership of private sector workplace pension schemes has been declining and changing type.
Life expectancy at age 65 has been increasing and continues to do so
1.3 Life expectancy has been rising substantially and the Office for National Statistics (ONS) projects this trend to continue (Figure 1). In the thirty years to 2010, life expectancy for men aged 65 increased by a half, or 7 years, to 21 years and women by a third, or 5.7 years, to 23.7 years. The ONS projects life expectancy at age 65 in 2050 to be 25.8 years for men and 28.2 years for women. This means that, between 2012 and 2050, the proportion of people aged 65 and over will increase from 17 per cent to 24 per cent, and those aged 85 and over from 2 per cent to 6 per cent.
Government interventions to support retirement incomes Part One 13
Health and social care costs are rising significantly as people live longer
1.4 Increasing longevity means that older people are living longer in poor health, with implications for government spending and retirement incomes. A quarter of people aged 65 and over currently receive £11 billion a year in condition-related benefits, while local government and individuals each spend £9 billion on social care. In July 2011, the (Dilnot) Commission on Funding of Care and Support reported that three-quarters of 65-year-olds will need social care before they die, with a half likely to face care costs of up to £20,000 and a tenth costs of over £100,000. Currently, those with assets over £23,250 have to fund their own care.
Figure 1Trends in life expectancy
Projected cohort life expectancy at age 65
Life expectancy at age 65 has increased since 1981 by a half for men and by a third for women, with further future increases projected
Source: Office for National Statistics
10
12
14
16
18
20
22
24
26
28
30
1981 1985 1989 1993 1997 2001 2005 2009 2013 2017 2021 2025 2029 2033 2037 2041 2045 2049
Women
Men
14 Part One Government interventions to support retirement incomes
1.5 People can expect to spend more than two-fifths of their remaining years from age 65 in poor health. In March 2013, the Select Committee on Public Service and Demographic Change predicted that between 2010 to 2030 there will be increases in the number of people aged 65 and over with diabetes by 45 per cent, arthritis and coronary heart disease by 50 per cent, dementia by 80 per cent and social care need by 90 per cent.
Government spending on the state pension and pensioner benefits has risen substantially
Overall spending on older people
1.6 In 2011-12, government spent £250 billion, or 16 per cent of GDP, in aggregate on older people and encouraging saving for retirement (Figure 2). This comprised £154 billion, or 10 per cent of GDP, on supporting retirement incomes and saving, including £107 billion on the state pension and pensioner benefits that are included in DWP and OBR projections, £9 billion on other benefits and £39 billion on tax relief to encourage saving using a pension. Government spent a further £64 billion on health and social care and £32 billion on public service pensions.
Spending on state pensions and pensioner benefits has grown since 1990
1.7 Government spending on state pensions and the pensioner benefits that are included in DWP and OBR projections doubled in real terms between 1990 and 2011. This represented a rise from 5.5 per cent of GDP to 6.9 per cent (Figure 3 on page 16). The Institute for Fiscal Studies has calculated that a quarter of the rise in expenditure since 1997 can be explained by demographic changes: the pensioner population increasing and pensioners living longer. The rest has represented a real increase in income, with pensioners receiving more from state second pensions, the introduction of new universal benefits, such as winter fuel payments (from 1997) and free television licences for the over 75s (from 2000), and more generous means-tested support.
OBR project spending on state pensions and pensioner benefits to rise by 2.6 percentage points of GDP by 2061-62
1.8 The Office for Budget Responsibility (OBR) projects that public spending on state pensions and pensioner benefits will rise by 2.6 percentage points of GDP, to 9.5 per cent, by 2061-62 (Figure 4 on page 17). It also projects that demographic change will cause government spending on health and long-term care to rise by 1.7 percentage points of GDP, to 11.1 per cent of GDP, in 2061-62, but that government expenditure on public service pensions will fall from 2.1 per cent of GDP to 1.3 per cent of GDP.

Government interventions to support retirement incomes Part One 15
Figure 2Government expenditure on older people and encouraging saving for retirement
In 2011-12, government spent £250 billion (16 per cent of GDP) on supporting older people and encouraging saving for retirement
Area of expenditure on older people £ billion spend
As percentage of GDP
Included in DWP and OBR projections
of state pension and pensioner benefits?
In scope of this report?
State pension and state second pension 76 4.9 Yes Yes
Income-related benefits for older people (including pension credit, housing benefit and council tax benefit)
17 1.1 Yes Yes
Condition-related benefits (including attendance allowance and disability living allowance)
11 0.7 Yes Yes
Universal benefits (including winter fuel payments and free TV licences)
3 0.2 Yes Yes
Subtotal A 107 6.9
Net tax and NICs relief on pension saving
39 2.5 No Yes
Other universal benefits (including free NHS prescriptions, bus travel and tax allowances)
8 0.5 No Yes
Cumulative subtotal B 154 9.9
Health spending by NHS 55 3.5 No No
Public service pensions 32 2.1 No No
Social care 9 0.5 No In part
Total 250 16.0
NOTES1 In 2012-13 prices.
2 UK Figures, except concessionary bus travel, health spending, social care spending and free prescriptions, which are England.
3 The fi gure for health, social care, NHS prescriptions and free eye tests are estimates.
4 Further relevant spending includes: part of £2 billion of tax relief on ISAs, where used to fund retirement; levies on pension schemes to fund the Pension Protection Fund (£605 million), The Pensions Regulator (£35 million) and The Pensions Advisory Service (£3 million); and levy on fi nancial services industry to fund The Money Advice Service (£44 million). And, under the Department of Energy & Climate Change’s Warm Home Discount Scheme, pensioners in receipt of the guarantee credit of pension credit are eligible for a £135 discount (for winter 2013-14) from their energy supplier on their electricity bills.
Source: Department for Work & Pensions; HM Revenue & Customs; Report of the Commission on Funding of Care and Support; The Offi ce for Budget Responsibility; Department for Transport and Department of Health

16 Part One Government interventions to support retirement incomes
Fig
ure
3G
over
nmen
t exp
endi
ture
on
stat
e pe
nsio
ns a
nd p
ensi
oner
ben
efits
199
0-91
to 2
011-
12
Go
vern
men
t sp
end
ing
on
stat
e p
ensi
ons
and
pen
sio
ner
ben
efits
do
uble
d in
rea
l ter
ms
bet
wee
n 19
90-9
1 to
201
1-12
fro
m £
54 b
illio
n to
£1
07 b
illio
n, r
isin
g f
rom
5.5
per
cen
t o
f G
DP
to
6.9
per
cen
t o
f G
DP
£ b
illio
n in
201
2-13
pri
ces
So
urce
: Dep
artm
ent
for
Wo
rk &
Pen
sio
ns
1990
-91
1991
-92
1992
-93
1993
-94
1994
-95
1995
-96
1996
-97
1997
-98
1998
-99
1999
-20
0020
00-
0120
01-
0220
02-
0320
03-
0420
04-
0520
05-
0620
06-
0720
07-
0820
08-
0920
09-
1020
10-
1120
11-
12
0102030405060708090100
110
5.5
5.9
6.2
6.3
6.1
6.0
5.9
5.8
5.7
5.8
5.8
6.0
5.9
5.8
5.9
5.9
5.8
5.9
6.4
6.9
6.8
6.9
Uni
vers
al b
enefi
ts
0 0
0 0
0 0
0 0
0 1
3 3
3 3
3 3
3 3
4 4
4 3
Con
diti
on-r
elat
ed b
enefi
ts
5 6
7 8
8 9
9 9
9 8
9 9
8 8
8 9
9 10
10
11
11
11
Inco
me-
rela
ted
ben
efits
for
old
er p
eop
le
10
10
11
12
13
12
12
12
12
12
13
13
14
14
15
15
16
16
17
18
18
17
Sta
te s
econ
d p
ensi
on
1 2
2 2
3 3
4 4
5 6
6 7
7 8
9 10
10
11
12
14
14
15
Bas
ic s
tate
pen
sion
37
39
40
41
40
41
42
42
44
45
45
48
49
50
51
52
52
54
55
58
60
61
As
per
cent
age
of G
DP
Government interventions to support retirement incomes Part One 17
People are not saving enough for retirement
1.9 People need to save more for the longer time they are spending in retirement if they are going to avoid relying on the state, but they are saving less. In 2010-11, seven in ten pensioner households received income from workplace and personal pensions, averaging £188 a week. The number of people saving in workplace or personal pensions decreased between 2000 and 2010 and the amount saved each year by individuals fell by a fifth in real terms, to £16 billion (Figure 5 overleaf). This has implications for future retirement incomes and reliance on state pension and benefits as workplace and personal pensions made up 30 per cent of the retirement incomes across pensioner households in 2010-11.
Figure 4OBR projections of government expenditure on state pensions and pensioner benefits 2011-12 to 2061-62
OBR has projected that government spend on state pensions and pensioner benefits will rise by 2.6 percentage points of GDP between 2011-12 and 2061-62, to 9.5 per cent
Percentage of GDP
NOTE1 Health spend is on the whole population, not just older people, but a key factor behind the rise over time
is the ageing population.
Source: Office for Budget Responsibility Fiscal Sustainability Report, July 2012
Health 8.1 7.1 7.7 8.3 8.7 9.1
Long-term care 1.3 1.2 1.5 1.7 1.9 2.0
Public service pensions 2.1 2.0 1.7 1.5 1.3 1.3
Pensioner benefits 1.2 1.1 1.2 1.3 1.2 1.2
State pensions 5.7 5.3 6.1 7.0 7.3 8.3
0
5
10
15
20
25
2011-12 2021-22 2031-32 2041-42 2051-52 2061-62

18 Part One Government interventions to support retirement incomes
1.10 There are several elements to this under-saving:
• The UK’s gross household saving rate has consistently been below the European Union average throughout the period from 1995 and fell substantially to 2007 (Figure 6).
• In 2010, over half of 25–34-year-olds, and a third of 35–44-year-olds, had no private pension.
Figure 5Annual saving in pensions by individuals: 2000 to 2010
Between 2000 and 2010 people's annual saving in private sector workplace and personalpensions fell by 20 per cent to £16 billion
£ billlion
NOTES1 Figures are for the United Kingdom and are in 2012-13 prices. The pension contributions are by employees and
individuals to workplace and personal pension schemes. They exclude their contributions to unfunded public sector pension schemes, which were £7 billion in 2010.
2 Totals do not sum due to rounding.
Source: National Audit Office analysis of the Office for National Statistics and HM Revenue & Customs data
2000 2001 2002 2003 2004 2005 2006 2007 2008 2009 20100
2
4
6
8
10
12
14
16
18
20
22
2020 20
19
17
18
2020
19
17
16

Government interventions to support retirement incomes Part One 19
• The number of self-employed contributing to personal pensions fell from 1.1 million to 0.6 million between 2001-02 and 2010-11.
• In 2011, Chatham House projected that 15 million UK households with incomes today of between £18,000 and £44,000 risk a reduction in their income of 60 per cent when they retire.
• In July 2012, DWP projected that 38 per cent of people currently aged between 22 and state pension age, or 10.7 million, are not saving enough to achieve the pension income they are likely to want or expect in retirement.
Figure 6UK household saving in international context
UK gross household saving rates have consistently been below the European Union average and declined substantially to 2007
Percentage
NOTE1 The gross household saving rate is the percentage of disposable income that people save or use to repay loans.
Source: Eurostat
European Union 27 15.5 14.8 14.1 13.0 12.0 11.2 12.2 12.2 12.0 11.6 11.1 10.9 10.8 11.1 13.2 11.6 11.0
United Kingdom 9.4 8.6 8.1 6.4 4.3 4.3 5.8 5.1 4.7 3.7 2.8 2.7 1.7 2.2 6.7 6.6 6.0
0
2
4
6
8
10
12
14
16
18
1995 1996 1997 1998 1999 2000 2001 2002 2003 2004 2005 2006 2007 2008 2009 2010 2011

20 Part One Government interventions to support retirement incomes
Private sector workplace pension scheme membership has been falling and changing in type
1.11 Fundamental to this under-saving have been the changes in the membership and predominant type of private sector workplace pension scheme. There are two main types of privately funded pension: defined benefit and defined contribution. With defined benefit, the retirement income members will receive is guaranteed by the scheme’s rules, for example a proportion of final salary based on number of years’ service. With defined contribution, it depends on the level of employee and employer contributions and the investment returns, which determine the size of the pension pot, and then on the annuity rate at the time when the pot is converted into an annual income stream. The income from a defined contribution pension is less predictable and typically smaller than from a defined benefit pension. Combined contributions by employers and employees are typically much lower for defined contribution pensions than defined benefit: averaging 9 per cent of salary as against 20.5 per cent.1
1.12 Since 2002, there has been a decline, from 47 per cent, in the proportion of private sector employees who are active members of workplace pension schemes and, over a longer period, there has been a shift towards defined contribution schemes (Figure 7).2 The proportion that were in defined benefit schemes fell between 1997 and 2011 from 34 per cent to 9 per cent, while the proportion in defined contribution schemes doubled to 24 per cent.
1.13 Private sector employers have closed defined benefit schemes for various reasons,3 including the increase in costs to employers arising from increasing longevity, poor investment returns and accounting and regulatory changes. Between 2000 and 2008, employers’ average contribution rates to defined benefit schemes rose from 10 per cent of earnings to 17 per cent.4 Developments in the labour market also had an impact, particularly higher staff turnover and employees valuing pensions less.
1 Comptroller and Auditor General, Regulating defined contribution pension schemes, Session 2012-13, HC 466, National Audit Office, July 2012, p.5.
2 In contrast, most public sector employees are in employer-sponsored pension schemes, which are predominantly defined benefit.
3 Reinvigorating workplace pensions, Department for Work & Pensions, November 2012, pp.12, 13.4 Annual Occupational Pension Schemes Surveys.

Government interventions to support retirement incomes Part One 21
Figure 7Trends in employee membership of private sector employer-sponsored pension schemes in the UK
The proportion of private sector employees with active membership of pension schemes has fallen substantially since 2002 and there has been a shift towards defined contribution schemes
Percentage of employees
NOTE1 Between 2008 and 2009, Lloyds Banking Group, the Royal Bank of Scotland Group and HBOS plc were reclassified from the
private sector to the public sector.
Source: Office for National Statistics
Defined contribution 12 13 15 16 19 21 22 21 22 25 25 23 23 23 24
Defined benefit 34 32 30 29 27 26 24 22 19 17 15 14 12 11 9
0
5
10
15
20
25
30
35
40
45
50
1997 1998 1999 2000 2001 2002 2003 2004 2005 2006 2007 2008 2009 2010 2011
22 Part Two Government interventions to support retirement incomes
Part Two
Initiatives to increase retirement incomes
2.1 This part examines government’s initiatives to increase retirement incomes and reduce the future liability on the state arising from longevity and under-saving. It examines the changes government has made to increase retirement income and sets out the challenges government faces in achieving its objectives.
How government is tackling the problem
2.2 The government’s approach has been informed by the evidence base and recommendations of the 2002 to 2006 Pensions Commission and research by DWP and others. It involves three key elements:
• state pension reforms;
• encouraging workplace saving for retirement; and
• encouraging extended working lives.
2.3 Government has been implementing this package of reforms since 2006 (Figure 8), but some elements, such as introduction of a single-tier state pension and automatic enrolment, are not expected to be completed before 2016 to 2018.
2.4 Governments have been guided by four principles (Figure 9 on page 24) while responding to the financial crisis from 2008. The crisis accelerated the closure of private sector defined benefit schemes. It also led to deteriorating outcomes from pension saving because of falling equity and gilt yields, and annuity rates.

Government interventions to support retirement incomes Part Two 23
2006 2007 2008 2009 2010 2011 2012
Lifetime and annual allowances introduced to simplify pension tax relief rules
Employment Equality Act: regulates against age discrimination
Pensions Act: sets timetable for future rises in state pension age from 65 to 68
Pensions Act: sets up Personal Accounts Delivery Authority (forerunner of NEST)
Pensions Act: provides for automatic enrolment and NEST
Reduces qualifying years for full state pension to 30 and extends entitlement to state second pension to carers
Sets up forerunner of Money Advice Service
Start of phased increase, from 60 to 65 in state pension age for women
Pensions Act: brings forward to 2020 rise in to 66 in state pension age
End of Default Retirement Age
Rise in SPA to 67 brought forward eight years to 2026 to 2028
Sets 2012 to 2018 timetable for automatic enrolment. Reduces annual and lifetime pension tax allowances
Automatic enrolment begins
Further reductions in annual and lifetime pension tax allowances
Adopts ‘triple lock’ for annual increase in state pension
Government commits to introduce a single-tier, flat-rate state pension
Pensions Act: plans restoring link of state pensions to earnings from 2011 and phasing out earnings related state second pension
Figure 8Implementation of the strands of reform set out by the Pensions Commission
Source: National Audit Offi ce analysis of pension legislation
Strand 1: state pension and benefits
Strand 2: encouraging saving
Strand 3: extended working lives

24 Part Two Government interventions to support retirement incomes
State pension reforms
2.5 The UK has had “one of the least generous state pension systems in the developed world”5 and has relied on a developed system of voluntary private funded pensions. The Organisation for Economic Cooperation and Development (OECD) has calculated that in 2008 the UK state pension and benefits provided a gross retirement income equivalent to 32 per cent of average earnings. This compared to OECD and European Union averages of 42 per cent and 49 per cent6 respectively.
5 The Pensions Commission First Report, 2004.6 Pensions at a Glance 2011: Retirement-income systems in OECD and G20 countries, (OECD: 2011) p.121.
Figure 9The four guiding principles for reform of the pensions system
Source: Department for Work & Pensions
• Enable individuals to take responsibility for meeting their retirement aspirations in the context of increased longevity
• Tackle the problem of under-saving for retirement
• Clarify the respective roles of the state, the employer and the individual
• Simplify the state pension to make it easier to plan and save for retirement
• Ensure an adequate level of support for the most vulnerable
• Be fair to women and carers, to savers, and between generations
• Strike the right balance for provision between the state, the employer and the individual
• Be cost neutral and avoid placing an unsustainable burden on future taxpayers
• Maintain macroeconomic stability
• Command national consensus while being flexible to future trends
Personal responsibility
Fairness
SimplicityAffordability
and sustainability

Government interventions to support retirement incomes Part Two 25
2.6 The Pensions Commission recommended increasing coverage and generosity of the state pension and government has been doing this:
• More people, especially women, are now able to qualify for a full state pension as the number of years of National Insurance contributions needed for a full pension was reduced to 30 in 2010. Previously, this was 39 years for women and 44 years for men. DWP calculated that it meant that that three-quarters of women reaching state pension age after 2010 would receive a full state pension as against a half before and that by 2025 the proportion would be 90 per cent.
• Annual increases to the basic state pension have been linked to the best of average earnings growth, inflation or 2.5 per cent (‘the triple lock’ or guarantee) from 2011, instead of just to prices.
• Government has been phasing out the earnings-related state second pension and announced, in March 2013, it will be ended for new pensioners from April 2016 for whom there will be a single-tier pension, but with qualifying years for a full pension increased from 30 to 35 years.
2.7 Government plans to set the full single-tier pension at a level above the basic means-tested support for pensioners in order to improve incentives to save. DWP projects that this will lead to the proportion of pensioners eligible for pension credit falling from two in five in 2012, to one in twenty by 2060. But there will remain disincentives to save for those on moderate incomes who live in rented accommodation and draw housing benefit.
2.8 Government’s approach for encouraging pension saving is being supported by changes to the funding rules for long-term care. In March 2013, the government announced that, from April 2016, the asset threshold, above which people have to fund their own residential care, is to be raised to £118.000 (at 2016-17 prices) and people’s lifetime contributions to their care will be capped at £72,000 of reasonable care costs (at 2016-17 prices), after which the state will fund costs. The cap has been set at a level which is considerably higher than the £25,000 to £50,000 (at 2010-11 prices) recommended by the Dilnot Commission, which would have protected more of the assets of the moderately wealthy.

26 Part Two Government interventions to support retirement incomes
Encouraging workplace saving for retirement
2.9 Government is seeking to reverse the downward trend in saving for retirement through private workplace pensions by an innovative approach: automatic enrolment. This involves employees automatically becoming members of a workplace pension scheme chosen by the employer. The employer and employee must make a minimum level of annual contributions deducted from salary, and the employee must make an active decision to leave the scheme. It is informed by behavioural theory, international experience and evidence from DWP attitudinal surveys that have identified a key barrier to saving in pensions (Figure 10) is inertia: the tendency to do nothing or remain with existing arrangements.
Figure 10The barriers to individuals’ saving in pensions
Source: National Audit Offi ce analysis of Department for Work & Pensions and other research publications
Financial
• No spare funds to save
• Other demands/priorities
• Pensions not an attractive savings vehicle
Behavioural
• Saving or spending disposition
• Attitudes to risk
• Short-term thinking
• Inertia
Lack of trust
• In financial institutions
• In pensions as a product
• In government
Low levels of financial capability
• Pensions ‘too complicated’
Barriers to saving
Government interventions to support retirement incomes Part Two 27
2.10 DWP is introducing automatic enrolment in stages between October 2012 and October 2018.7 There are three elements:
• Employers must enrol their employees into a qualifying workplace pension scheme and contribute at or above a minimum.
• Employees must contribute at or above a minimum unless they decide to opt out, in which case employers no longer have to contribute.
• Employers can choose any scheme which meets the qualifying rules. The government has supported such a scheme, the National Employment Savings Trust (NEST). This has been designed to be simple, have low charges and be suitable for low and moderate earners and small employers, which the existing market has found it unprofitable to serve.8 It has a public service obligation to accept any employer who wishes to use it to fulfil their new employer duty.
2.11 ‘Gateway reviews’ by the Office for Government Commerce and the Major Projects Authority assessed the programme as well planned and managed, informed by research and consultation, with good awareness of risks, critical success factors identified and a monitoring and evaluation strategy in place. Implementation began in October 2012, with roll-out to the largest employers, many with already established workplace pension schemes. Employee opt-out rates have been lower than DWP expected: early indications to DWP from the largest employers suggest initial opt-out rates have been between 5 per cent and 20 per cent. From 2014 to 2017, the programme will face greater challenges when it is extended to the 1.2 million medium and smaller employers, many unfamiliar with workplace pensions.
2.12 DWP projects that automatic enrolment will lead to eight million people saving in pensions for the first time. It projects additional pension saving of £11 billion a year (in 2012-13 earning terms), half as new saving and half displaced from other saving. DWP forecasts it will cost government £3 billion a year in lower tax revenues by 2050, but it will increase aggregate private pension incomes by £5 billion to 8 billion a year (in 2011-12 earning terms) and reduce government spending on income-related benefits in retirement by £0.9 billion by 2050.
7 These relate to the size of employer, with large employers being ‘staged’ first.8 The NEST Corporation received start-up financial support from DWP in the form of a repayable loan, amounting
to £171 million at 31 March 2012. It also received a grant of £10.8 million in 2011-12.
28 Part Two Government interventions to support retirement incomes
Extending working lives
2.13 Government has identified substantial financial benefits to taxpayers, individuals and the economy if working lives are extended (Figure 11). Research carried out on behalf of DWP has calculated that each one year increase in working lives raises real GDP by one per cent and improve the government’s budget balance by 0.6 per cent of GDP. It has also calculated that working an extra year past state pension age can increase a person’s private pension income in retirement by 10 per cent and that leaving the labour force a year early can reduce it by 10 per cent.
Figure 11The fi nancial benefi ts of extended working lives
Source: Winning the Generation Game (Cabinet Offi ce Performance and Innovation Unit: 2000), Parts 3 and 4
Individuals
• Longer period to accumulate savings for retirement
• Shorter period in retirement to fund
• Potential for part working and part retirement
But dependent also on:
• Individuals’ capabilities: health and skills
• Jobs being available
• Individuals’ (and society’s) attitudes to working later into life
• Employers’ attitudes and willingness to employ older workers
• Overcoming barriers to extended working: for example, caring responsibilities, and flexible working
Benefits of extended working lives
Government
• Shorter period over which pension age benefits paid
• Potentially fewer retired reliant on income-related benefits
• Larger working age population, hence higher tax revenues and GDP
2.14 Government has used research to understand what encourages and discourages extended working. This has influenced the measures it has taken to encourage extended working lives:
• Since 1995, government has raised future state pension ages to among the highest in the OECD group of countries. The state pension age influences when many people are financially able to retire and, through a ‘signalling effect’, society’s expectations on when to retire.

Government interventions to support retirement incomes Part Two 29
• Raising the ‘normal pensionable age’ at which a public service pension can be received un-reduced (for new employees).
• In 2010, increasing from 7.5 per cent to 10.4 per cent the amount by which an individual’s state pension is increased for each year a person defers taking it.
• In 2011, abolishing the default retirement age so employers can no longer force workers to retire because of their age.
• From 2006, people have been able to continue in work while drawing part of an occupational pension but not part of the state pension.
• In November 2012, committing to extend the right to request flexible working to all employees, including older workers. This right had been available to carers from 2007.
• Providing through Jobcentre Plus more flexible and tailored services to jobseekers over the age of 50 to help them improve their skills in information technology and other employees.
• Worked with employer stakeholders to encourage employers to adopt practices that support the employment and retention of older workers as part of a mixed age workforce.
The challenges government faces in achieving its expected outcomes
2.15 The success of the government’s package of interventions depends on the responses of individuals, employees, employers and the financial services industry. There are key challenges in:
• improving confidence in, and the quality of, defined contribution schemes;
• helping people understand their finances better;
• making more effective use of tax incentives; and
• influencing employers to support extended working lives.
Improving confidence in, and the quality of, defined contribution schemes
2.16 Outcomes from automatic enrolment depend on the responses of employees, employers and pension providers. If DWP is to achieve the outcomes it expects, it will need a high level of employees to remain enrolled in schemes and there to be good levels of contributions, charges and investment returns if individuals are to secure the pension incomes they require and expect. DWP has projected a range of outcomes and identified a number of risks (Figure 12 overleaf).

30 Part Two Government interventions to support retirement incomes
Figure 12Automatic enrolment: projected outcomes, risks and mitigations
Projected outcomes
• The level of employee opt-out: currently estimated at around a third (DWP published research).
• The number of people newly saving or saving more (DWP estimates range from 6 million to 9 million of the 11 million eligible).
• The amount saved in pensions a year (DWP estimates range from £8 billion to £12 billion in steady state).
• The proportion that is new saving (DWP estimates range from 30 per cent to 70 per cent).
• How much aggregate private pension incomes will increase as a result (DWP estimates range from £5 billion to £8 billion a year in 2011-12 earning terms by 2050, but will depend on participation rates, contribution levels, charges and investment returns).
• The number who will save in NEST (DWP estimates range from 2 million to 4 million).
Risks Mitigations
Employers may choose schemes that do not best serve employees’ interests
In May 2013, government announced its intention to ban consultancy charges in automatic enrolment schemes where scheme members end up paying for advice given to their employer.
The 8 per cent minimum for total contributions (from October 2018) may lead employers to level down contributions in existing schemes and to individuals not recognising they need to save more to meet their retirement aspirations.
DWP has commissioned research on employers’ intentions and engagement with employers.
In November 2012, DWP set out one idea on how people in the future may be encouraged to save more than the statutory minimum through automatic escalation in which they commit to increase their contributions at a future date.
It has not been designed for the self-employed, who comprise 14 per cent of those in employment.
NEST has a public service obligation to accept the self-employed as members.
The annual limit on contributions to NEST and restrictions on transfers to it from other schemes may not serve the best interests of employers, employees and taxpayers.
Pensions Act 2008 requires government to review their effect in 2017. In November 2012, DWP issued a call for evidence on the impact of these constraints and will be responding in summer 2013.
Pensions Bill 2013 provides for a system of automatic transfers of small pension pots, to reduce the number of dormant pots and make it easier for people to keep track of their pensions savings and secure a better income in retirement.
It is uncertain how employers will fund their contributions, with potential impact on jobs, wages, prices, tax take and employment.
The minimum contribution rates that an employer must pay into their worker’s pension scheme are being introduced gradually: 1 per cent of qualifying earnings initially, 2 per cent from October 2017 and 3 per cent from October 2018. Small employers of less than 50 workers do not start to stage until 2015.
Source: National Audit Offi ce analysis of Department for Work & Pensions documents

Government interventions to support retirement incomes Part Two 31
2.17 Pension schemes will face a challenge in ensuring that employees do not opt out because confidence in saving through defined contribution pensions is low and it has been declining over recent years. The National Association for Pension Funds’ index of employees’ confidence in pensions, compared to other ways of saving for retirement, has fallen sharply since 2008. In 2012, there was a negative balance of 17 per cent, with 36 per cent confident in pensions and 53 per cent not confident: in 2008, there was a positive balance of 22 per cent.9
2.18 Two-thirds of people see pensions as too complicated to understand. Pensions are also seen as inflexible, compared to ISAs or property, as they cannot be drawn until at least the age of 55 and must be mostly converted into an annuity. DWP’s 2009 Attitudes to Pensions survey reported that twice as many people considered investing in property as “the way to make most of your money”, compared to paying into an employer pension scheme, and four times as many compared to paying into a personal pension scheme.
2.19 DWP and The Pensions Regulator have been working with key bodies in the pensions industry to improve the quality and transparency of pensions to help build consumer confidence. The focus of these efforts has been on two key determinants of the retirement income generated by a defined contribution pension: the level of charges; the annuity rate; and type of annuity chosen. National Association for Pension Funds (NAPF) and Association of British Insurers have developed quality marks and codes of practice to improve transparency about charges and how to choose the best annuity:
• A review for DWP found10 that an annual management charge of 1.5 per cent reduces a final pension pot by 22 per cent, whereas an annual charge of 0.5 per cent, which is broadly the level charged by NEST, reduces it by only 9 per cent.
• Annuity rates have fallen considerably since 1990 as a result of rising life expectancy and lower interest rates on corporate bonds and gilts. In 1990, a 65-year-old-man with a £100,000 pension pot could expect to receive £15,000 a year in non-indexed retirement income. This had fallen to £7,000 in 2007 and £5,200 in March 2013.
2.20 In May 2010, the government committed “to help reinvigorate occupational pensions (and) encourage companies to offer high-quality pensions to all employees”. In November 2012, DWP presented two ideas to achieve this goal:
• A new category of pension, ‘defined ambition’, which would be a hybrid of defined contribution and defined benefit. It involves employers and employees sharing risks of increasing longevity and uncertain investment performance. It would give employees greater certainty about the final value of their pension pot and employers greater certainty about their costs than is the case respectively with pure defined contribution and defined benefit schemes. Two barriers to overcome are persuading employers that there is benefit in a defined ambition scheme (rather than basic defined contribution) and devising an appropriate regulatory framework.
9 Workplace Pensions Survey Autumn 2012 (NAPF: November 2012), Figure 11, p.10.10 Making Automatic Enrolment Work: A review for the Department for Work & Pensions, October 2010, p.69.

32 Part Two Government interventions to support retirement incomes
• Improving scheme quality, particularly considering whether consolidation in the highly fragmented UK pensions industry11 could bring benefits of lower administrative charges, stronger governance, risk sharing and higher investment returns.
Helping people understand their finances better
2.21 With defined contribution pensions now more common, people need greater financial capability.12 They have to make complex decisions about: how much to save, in what scheme, when to convert the saving into an annuity, which type and from whom. To do so effectively, they need good and accessible information about how much retirement income they will receive from the state, and when, and from their private pension. They also need a good level of financial awareness and capability, so that, for example, they can understand the impact of compounding and inflation on investment returns and pension income, and the different risks and potential returns from different investment options.
2.22 A government objective is to make it clearer what financial support people can expect from the state on retirement so that people can act early and make additional private provision where needed. However, people’s knowledge of state pension issues is low: in 2012, three-quarters self-assessed it as ‘very patchy’ or less.13 Many people are unsure about their own state pension age and do not have a good understanding of the importance of making sure they are building qualifying years for the state pension and filling any gaps. A 2012 DWP survey found that 62 per cent of women and 38 per cent of men expected to reach state pension age earlier than they actually will. Confidence in the stability of current arrangements is also low: 38 per cent consider “There probably won’t be a state pension by the time I retire”.
2.23 In 2003, the Financial Services Authority (FSA) launched a National Strategy for Financial Capability aimed at addressing people’s poor understanding of the financial concepts needed for responsible financial planning. Between 2006-07 and 2008-09, it spent £17 million a year on financial capability programmes covering young people, schools, new parents and workplace advice. Following a Treasury-initiated review in 2007-08, government set up the Money Advice Service in 201014 to provide a free generic money advice service and take on the public awareness objectives previously held by the FSA in relation to developing consumer financial education and helping people understand and manage their finances.
11 Average scheme membership in the UK is 2,600, which is a quarter of that in the Netherlands.12 Financial capability is the ability to understand financial concepts (for example, compounding), compare
products, organise their finances and financially plan.13 All figures cited in this paragraph are from DWP’s 2012 Attitudes to Pensions Survey.14 It was set up in April 2010 as the Consumer Financial Education Body and renamed the Money Advice
Service in April 2011.
Government interventions to support retirement incomes Part Two 33
2.24 Annual spending on improving financial capability doubled to £46 million between 2009-10 and 2012-13, but the impact is unclear. The Money Advice Service’s early work has focused on developing its web-based service and public awareness of what it does.15 It has recently carried out a survey of UK financial capability to explore progress since the FSA’s baseline survey in 2006, and will publish the results in July 2013. Evidence from DWP’s attitudinal surveys and impact assessments suggest that people’s financial capabilities remain low, especially those of people under 40.
2.25 The government’s Long-term Approach to Financial Capability (2007) aimed for all children and young people to have access to a planned and coherent programme of personal financial education so they leave school with skills and confidence to manage their money on a daily basis as well as to plan for future financial needs. Currently, financial education is not a statutory part of the national curriculum in state schools in England, but in 2013, the government has been consulting on making it so from September 2014.16 Government spent £11.5 million on financial education initiatives in 2008 to 2011 alongside the financial services industry who spent £25 million in 2011-12. Progress has varied greatly and there is a lack of robust evidence on impact because of the absence of measurable key performance indicators, something the Money Advice Service is seeking to address.17
Making more effective use of tax incentives
2.26 Government provides up-front tax incentives for pension saving in recognition that pensions are less flexible than other forms of saving (see paragraph 2.18). The tax incentives include tax relief on contributions, tax-free investment growth, the facility to take a tax-free lump sum on retirement of up to a quarter of total pension entitlement and relief to employers on National Insurance contributions for contracted-out schemes. Government recoups some of the tax relief on contributions later through tax on retirement incomes. Much is not recovered. This is because of the tax-free lump sum and some people receive tax relief, when saving, at a higher rate than the rate at which they pay tax on the pension income when they are retired (‘tax band slippage’).
2.27 Net annual tax and National Insurance relief on pension contributions doubled in real terms to £40 billion between 2001-02 and 2010-11 (Figure 13 overleaf). The Treasury has come to recognise that tax relief is a blunt instrument to encourage pension saving. People do not understand it and around 60 per cent is used by higher rate taxpayers. The extent to which it has led to additional saving in aggregate is unclear. To improve targeting of tax relief to those on moderate and low incomes, government reduced the pension contribution annual tax free allowance to £50,000 from April 2011 and the lifetime allowance to £1.5 million from April 2012. HMRC calculated this would save government £4 billion a year. In December 2012, the Chancellor announced further reductions, to £40,000 and £1.25 million, from April 2014, and estimated this would save £1 billion within two years.
15 Treasury Select Committee inquiry into The Money Advice Service, evidence 28 November 2012.16 Unlike in Northern Ireland, Scotland and Wales.17 Impact review of financial education for young people: summary report for the Money Advice Service,
June 2012, foreword and p.7.
34 Part Two Government interventions to support retirement incomes
Influencing employers to support extended working lives
2.28 Since 2000, the average age of leaving the UK labour force has been rising, but not as fast as life expectancy has been rising. The government expects a widening gap between the state pension age and the average age of leaving the workforce (Figure 14). This implies that increasing numbers will be economically inactive for one to three years before state pension age and so will need to draw on their savings or working-age means-tested benefits before becoming eligible for the state pension. Currently, 12 per cent of those aged between 50 and 64 are economically inactive for reasons of ill-health and 5 per cent are unemployed, two-fifths of whom have been unemployed more than a year.
Tax relief in 2012-13 prices (£bn)
40
35
30
25
20
15
10
5
0
Figure 13Pensions tax relief: 2001-02 to 2011-12
2001-02 2002-03 2003-04 2004-05 2005-06 2006-07 2007-08 2008-09 2009-10 2010-11 2011-12
7
13
8
13
9
15
10
18
12
21
12
22
13
24
13
20
14
22
1515
25 24
NICs relief on employer contributions
Tax relief on contributions and investment income (net)
Pensions tax relief doubled in real terms to £40 billion between 2001-02 and 2010-11, but then fell in 2011-12 by 2 per cent to £39 billion following restrictions imposed from April 2011
NOTE1 Presented in 2012-13 prices and net of tax paid on pension income in retirement.
Source: HM Revenue & Customs personal pension statistics
Government interventions to support retirement incomes Part Two 35
Age
69
68
67
66
65
64
63
62
61
60
59
Figure 14Official projections of average age of leaving the UK labour force
2010 2020 2030 2040 2050
Male state pension age
State pension age for men and women
Female state pension age
NOTE1 Based on projections supplied to the European Commission by officials from the OBR and HM Treasury.
Source: The 2012 Ageing Report: Economic and budgetary projections for the 27 EU member states
Average age of female exit from labour force
Average age of male exit from labour force
Average age of male and female exit from labour force
36 Part Two Government interventions to support retirement incomes
2.29 To help extend working lives government has focused on three areas:
• Improving the skills, employability and support given to jobseekers over the age of 50.
• Making it possible for people who wish to work longer to have options to work flexibly.
• Ensuring employers no longer have outdated attitudes about older workers’ capabilities.
2.30 Tracker surveys carried out by The Pensions Regulator indicate that most employers have positive attitudes to employing older workers. In spring 2012, 88 per cent of private sector employers agreed that older workers bring skills and benefits to their business and 70 per cent considered they should be able to choose to continue to work for as long as they wish. These attitudes have been reflected in an increase in the proportion of people aged 65 and over in employment, rising from 7.3 to 8.8 per cent between 2008 and 2011 at a time of economic recession and at a time when the proportion of 16–24-year-olds in work fell from 56.3 to 50.1 per cent.
2.31 The Pensions Regulator’s surveys indicate, however, that a significant minority of employers have less positive views on older workers. A fifth consider that people get less productive as they get older and two-fifths that employers should be able to retire older workers. If government is to achieve its objectives on extending working lives, it is vital that all employers are well engaged, and barriers to employing older workers addressed. Effectively communicating messages to the country’s 1.5 million employers is a challenge. DWP and Department for Business, Innovation & Skills communications spending has reduced since the Age Positive campaign was at its height in 2006. Since then DWP has worked principally with and through employer stakeholders in the nine largest occupational sectors to help them provide information and guidance on employing older workers. It has also worked with stakeholders through an Age Action Alliance’s Healthy Workplaces group to help employers more effectively manage the health and productivity of an ageing workforce.

Government interventions to support retirement incomes Part Three 37
Part Three
Managing the portfolio of interventions and uncertainty
3.1 This part describes how government is managing its portfolio of retirement interventions to mitigate risks to outcomes and value for money that arise from the:
• large number of public bodies involved and complexity of the interactions;
• challenge of allocating resources optimally when information on costs and impacts is inadequate; and
• uncertainty over long-term costs and outcomes.
Government does not see the interventions as a portfolio to be managed
3.2 DWP and HM Treasury manage the main interventions that influence retirement incomes, but 17 departments and public bodies have some involvement (Figure 15 overleaf). The Pensions Commission viewed its reforms as an “integrated set of policies”.18 Government has not taken them forward as an overall programme and does not see the interventions as a portfolio that needs managing and coordinating with single accountability. DWP has programmes for state pension reform and automatic enrolment, but other significant interventions that affect retirement incomes are outside its control. For example, the Treasury leads on tax incentives for savings, the Money Advice Service on financial capability (which encompasses work to improve the effectiveness and provision of financial education) and the Department for Education on financial education in schools. The Committee on Public Service and Demographic Change has found similarly there has not been a collective, integrated government response to deal with the consequences of population ageing.19
18 The Final Report of the Pensions Commission, 2006, p.10.19 Ready for ageing? Report, House of Lords Select Committee on Public Service and Demographic Change,
Session 2012-13, 14 March 2013, p.92.
38 Part Three Government interventions to support retirement incomes
Figure 15Departments and public bodies that support retirement incomes andtheir areas of responsibility
Department for Business, Innovation & SkillsExtended working lives
Department of Energy & Climate ChangeFuel poverty
Department of Health Long-term care and age-related free services
Department for Communities andLocal GovernmentHome ownership
Department for TransportTravel passes
Department for Culture, Media & SportFree TV licences
Department for EducationFinancial education in schools
The Pensions Advisory Service
National Employment Savings Trust
Pension Protection Fund
The Money Advice Service
HM Revenue & Customs
NOTES1 Department for Work & Pensions and HM Treasury manage the main interventions that infl uence retirement incomes.
2 Additionally, TV Licensing administers free television licences for the over 75s, the Identity and Passport Service free passports for British nationals born on or before 2 September 1929 and local authorities concessionary travel and council tax benefi t and housing benefi t.
Source: National Audit Offi ce analysis
Communications with consumers on pensions
Coordinating group on private sector pensions1
The Pensions Regulator
Financial Conduct Authority
Prudential Regulation Authority
Department for Work & Pensions
HM Treasury
two-way discussions
supervises

Government interventions to support retirement incomes Part Three 39
3.3 Many of the interventions have complex interactions with each other and with other policies and objectives. These need careful management (Figure 16), and a good understanding of trade-offs and unintended effects. For example:
• decisions by the Bank of England and the Treasury on quantitative easing, interest rates and consumer credit can affect: the income of current pensioners;20 costs for employers funding defined benefit schemes; the investment performance of pension funds; and people’s ability to save;
• funding rules for long-term care and local variations in eligibility rules for social care can affect retirement incomes and may affect incentives to save;
• the level of and changing generational pattern of consumer debt, with student debt and house mortgages being taken out and paid off later in life, may affect the ability to save for retirement; and
• home ownership levels affect average retirement incomes and government spending on housing benefit.
20 Treasury Select Committee inquiry into Quantitative Easing, evidence on 29 January 2013.
Figure 16The interactions of government interventions on potential outcomes
Interest rates and quantitative easing
Saving for retirement
Long-termcare costsConsumer credit
and debt
Home ownership
Extended working lives
Unpaid caring for relatives and friends
Levels of employment of older workers
Source: National Audit Offi ce analysis
Growing the economy

40 Part Three Government interventions to support retirement incomes
3.4 Coordinating structures bring together some of the bodies involved in the interventions, but most interactions are bilateral. Without coordinating structures, there are risks of perverse incentives, unintended consequences and missed opportunities to work together. For example the Treasury has given limited consideration to the potential impact of changing debt and home ownership on pension saving and retirement benefits.
The absence of a holistic view raises the risk of not achieving expected outcomes
3.5 The absence of a holistic view raises the risk that individual, but co-dependent, policies or interventions may not be effective in increasing saving for retirement or extending working lives. We have identified potential risks in five areas:
a Savings strategy: The Treasury leads on overall savings strategy and tax treatment of pension contributions and DWP on workplace savings, but there is no overall accountability for saving for retirement or clarity over how progress and success of the overall strategy will be measured.
b Incentives to save in pensions: In 2009, DWP projected that most people can expect to be better off in real terms in retirement by saving under automatic enrolment and the majority may get back more than double the value of their contributions.21 However, DWP also projected that a minority of people were unlikely to get back the value of their own contributions in real terms because the interaction with means-tested benefits currently dilutes incentives to save for low earners and renters.
c Figure 17 on page 42 shows how different means-tested benefits can influence incomes in retirement for the scenario as stated. A person who expects to rent their property in retirement and have annual gross income of between £7,500 and £12,600 currently has limited incentive to increase their retirement savings. Within this range, retirement income after tax and benefits increases by only £10 to £15 for each £100 increase in annual gross income. This is largely because of the withdrawal of means-tested benefits such as Housing Benefit and Pension Credit. Since Housing Benefit is only available to those in rented accommodation, incentives to save are much stronger for owner-occupiers. A person with the same annual gross income but who owned their property would see their income after tax and benefits increase by £48 to £80 for each £100 increase in annual gross income. The introduction of the single-tier pension will help individuals to know what they can expect from the state and will improve incentives for low earners to save. DWP projects the single-tier pension will reduce the proportion of people eligible for pension credit but may have little impact on pensioners’ eligibility for housing benefit. The fall since 2004 in owner occupancy rates, particularly among those aged under 35, may lead to an increase in the proportion who draw housing benefit.
21 Saving for retirement: implications of pensions reforms on financial incentives to save for retirement, DWP Research Report No. 558, 2009. DWP’s projections are based on a number of key assumptions, including investment growth of 3.5 per cent a year in real terms.

Government interventions to support retirement incomes Part Three 41
d Regulation of workplace pensions: We reported in July 2012 that the system for regulating defined contribution pension schemes as a whole lacks clear, overarching objectives for what regulation seeks to achieve. We found no common framework for assessing risk, collecting evidence and measuring performance across the different bodies involved, and no single body with overarching responsibility for the delivery of regulatory objectives. As a result we found insufficient accountability to ensure that the system delivers value for money for the taxpayer. Since then, the responsibilities held by the Financial Services Authority have passed to the Financial Conduct Authority (FCA) and the Prudential Regulation Authority so that there are now, with The Pensions Regulator, three bodies involved. In April 2013, the Work and Pensions Committee reported that it had concerns about current regulatory gaps and the resourcing and priority given by the FCA to its pensions work and recommended that government reassess the case for establishing one body with sole responsibility for regulating workplace pensions.
e Complexity and confusing signals: There has been a growth of universal, means-tested and condition-related pensioner benefits over the years, with resulting complexity. Some benefits are taxable, some are tax free and indexation arrangements vary. There are also differences in eligibility ages for benefits that risk sending confusing signals on retirement ages. The eligible age for men and women for concessionary travel in England and the Winter Fuel Payment is set at the state pension age for women, which is gradually rising from 60 to 65 between 2010 and 2018, while it is 60 for concessionary bus travel in Scotland and Wales and free NHS prescriptions, and 75 for free television licences.
f Information provision: There is overlap in government’s information provision on financial planning for retirement, saving and pensions. Seven government bodies provide such information, along with third sector bodies, such as the Citizens’ Advice Bureaux and Age UK, and commercial bodies and websites. The automatic enrolment programme has arrangements for coordination of information provision across government bodies and with outside bodies, including Age UK and Citizens Advice via a consumer forum. Since 2010, the Money Advice Service has had lead across government on financial capability, efforts to raise public understanding and knowledge of financial matters, and to enhance people’s ability to manage their money. But it has not systematically reviewed what others in government are doing, their effectiveness and how they can most effectively work together for the benefit of citizens. However, the Service is developing with stakeholders during 2013-14 a new UK Strategy for Financial Capability. This will seek to improve the coherence and impact of existing provision of information and advice and identify gaps.

42 Part Three Government interventions to support retirement incomes
Figure 17Indicative scenario showing the interaction of means-tested benefi ts and retirement incomes
People on lower incomes and in rented accommodation may gain little by saving for retirement
Core scenario – single pensioner household, aged 75 plus, no capital savingsRental scenario – weekly charges: rent £80, council tax £15Owner occupier scenario – mortgage paid off, weekly council tax charge £15
Tax and means-tested benefits in retirement Criteria for tax/benefit
Influences of tax and benefits on retirementincome for the scenario presented
£0 to£5,899
£5,900 to £7,499
£7,500 to £9,899
£9,900 to £10,699
£10,700 to £12,699
£12,700 to £15,899
£15,900and above
Pension Credit
Guarantee credit
Tops up income in retirement to a minimum weekly level
Savings credit
Additional income available to those who have made some retirement saving provision
Housing Benefit
Support with rent costs, paid in full if in receipt of guarantee credit, otherwise calculated
Council Tax Benefit
Support with council tax charges, paid in full if in receipt of guarantee credit, otherwise calculated
Income tax For 2012-13 tax-free personal allowance for those aged 65 to 74 is £10,500, and £10,660 for those 75+
Income bands shown to nearest £100
Source: National Audit Offi ce analysis of current rules
120
100
80
60
40
20
0
Marginal deduction rate (%)
0 1 2 3 4 5 6 7 8 9 10 11 12 13 14 15 16 17 18 19 20
Annual gross income before tax and benefits (£000)
Renter
Owner occupier

Government interventions to support retirement incomes Part Three 43
3.6 A portfolio approach to managing these multiple policies and interventions could help HMT and DWP ensure that they working towards the joint objective of mitigating the liability on the state by increasing saving for retirement. Such an approach does not have to be bureaucratic but should: identify the links and relationships between existing and new policies in this area; help allocate resources based on the contribution to achieving the stated objectives; and help government manage risks in a coherent manner.
Allocating resources efficiently
3.7 Government cannot be sure it is allocating resources efficiently to those interventions that influence future retirement incomes most cost-effectively because it does not know the relative costs and benefits of different interventions.
3.8 Impact assessments provide insight into the distribution of predicted net benefits among government, individuals and others, but not into comparative cost-effectiveness (Figure 18).
Figure 18Impact assessments provide insight into the distribution of net benefi ts, butnot of comparative cost-effectiveness
Intervention Date of Impact
Assessment
Net Present Value(£bn)
Which groups are projected tobenefit or lose in net
TimePeriod
Net Individuals Government Employers Finance industry
Increasing state pension age to 66
Nov 2011 £26.9 10 years
Extending the right to request flexible working
May 2011 £0.2 10 years
Move from Retail Prices Index (RPI) to Consumer Prices Index (CPI) indexation for private sector Defined Benefit schemes
Feb 2011 £0 60 years
Phasing out the Default Retirement Age
Jan 2011 £2.9 10 years
Automatic enrolment/workplace pension reform
Jan 2010 £441 39 years
National rollout of Money Guidance and the Consumer Financial Education Body2
Nov 2009 £13.8 52 years
NOTES1 Principally social welfare benefi t from ‘consumption smoothing’ (the benefi t of transferring income from periods of relatively high income to
those of relatively low income).
2 The forerunner of the Money Advice Service.
3 Green circles indicates net benefi ts and red circles net losses.
Source: National Audit Offi ce analysis

44 Part Three Government interventions to support retirement incomes
3.9 For robust evidence on cost-effectiveness, it is important that interventions have clear objectives and outcomes are monitored and evaluated. The automatic enrolment programme has identified critical success factors and has a clear evaluation strategy. However, such information is lacking for the government’s savings strategy and tax relief to encourage pension saving and on financial capability and education. However, the Money Advice Service is collating evidence on ‘what works’ in order to shape its UK Strategy for Financial Capability.
Managing uncertainty
3.10 The outcomes of government’s interventions to encourage saving for retirement and extend working lives and future government spending on pensions and pensioner benefits are fundamentally uncertain as they depend on trends over which government has only part influence. They depend on what happens to healthy life expectancy, migration, inflation, GDP and earnings growth, investment performance, migration and house ownership, and how individuals, employers and pension providers respond to government’s interventions. Small changes to assumptions can have a significant impact. For example, OBR’s projections of government spending on state pensions and pensioner benefits in 2061-62 range from 7.6 per cent to 11.8 per cent of GDP, with a central projection of 9.5 per cent (Figure 4), depending on its assumptions on population structure.
3.11 Government has mechanisms to help manage some elements of affordability and sustainability, chiefly through adjusting the indexation of benefits and the future state pension age. In January 2013, government stated that future changes to state pension age “will be based around the principle of maintaining a given proportion of adult life in receipt of state pension”. And government committed to review the state pension age every five years based on independent reports on demographic and wider factors. This goes some way towards the Pensions Commission’s recommendation in 2005 that a successor should present to Parliament and government every four years a report on “latest demographic and economic facts and latest trends in pension provision …. (so that) difficult future decisions about the precise trade-off between state pension generosity, public expenditure and state pension age … (can) be made more effectively”.22
3.12 DWP has published forward projections of public spending on state pensions and pensioner benefits that show smaller rises, as a proportion of GDP, than those projected by the OBR because it has applied less generous assumptions for the indexation of benefits. In November 2012, DWP projected that spending on state pensions and pensioner benefits will rise a further 1.7 percentage points of GDP, to 8.6 per cent, by 2061-62 (Figure 19). It projected that spending on income-related and condition-related benefits will fall between 2011-12 and 2061-62 as a proportion of GDP by 1.3 percentage points to 0.6 per cent despite it expecting a doubling in the number of pensioners claiming condition-related benefits.
22 A new pension settlement for the twenty-first century: the second report of the Pensions Commission, 2005, p.30.
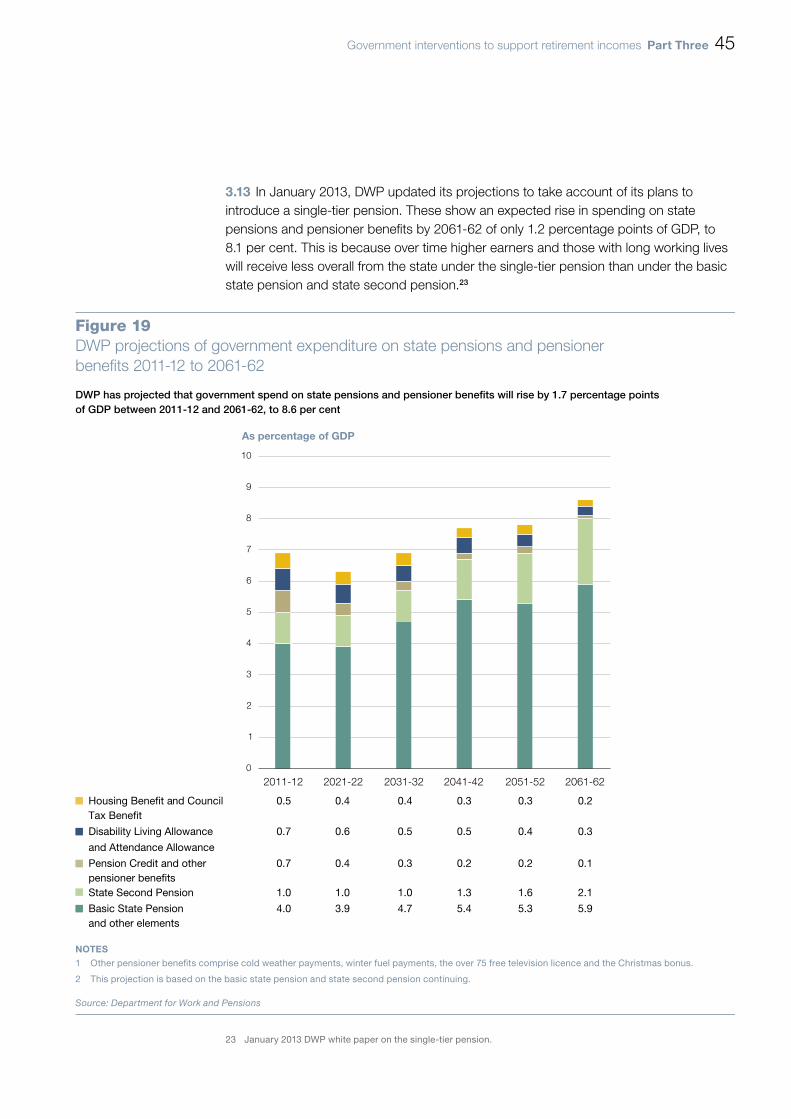
Government interventions to support retirement incomes Part Three 45
3.13 In January 2013, DWP updated its projections to take account of its plans to introduce a single-tier pension. These show an expected rise in spending on state pensions and pensioner benefits by 2061-62 of only 1.2 percentage points of GDP, to 8.1 per cent. This is because over time higher earners and those with long working lives will receive less overall from the state under the single-tier pension than under the basic state pension and state second pension.23
23 January 2013 DWP white paper on the single-tier pension.
Figure 19DWP projections of government expenditure on state pensions and pensioner benefits 2011-12 to 2061-62
As percentage of GDP
DWP has projected that government spend on state pensions and pensioner benefits will rise by 1.7 percentage points of GDP between 2011-12 and 2061-62, to 8.6 per cent
Housing Benefit and Council 0.5 0.4 0.4 0.3 0.3 0.2Tax Benefit
Disability Living Allowance 0.7 0.6 0.5 0.5 0.4 0.3
and Attendance Allowance
Pension Credit and other 0.7 0.4 0.3 0.2 0.2 0.1pensioner benefitsState Second Pension 1.0 1.0 1.0 1.3 1.6 2.1
Basic State Pension 4.0 3.9 4.7 5.4 5.3 5.9and other elements
NOTES1 Other pensioner benefits comprise cold weather payments, winter fuel payments, the over 75 free television licence and the Christmas bonus.
2 This projection is based on the basic state pension and state second pension continuing.
Source: Department for Work and Pensions
0
1
2
3
4
5
6
7
8
9
10
2011-12 2021-22 2031-32 2041-42 2051-52 2061-62

46 Appendix One Government interventions to support retirement incomes
Appendix One
Our audit approach
1 This landscape report examined government interventions to support current and future retirement incomes. We examined:
• the risks to public finances of an ageing population (Part One);
• initiatives to increase retirement incomes (Part Two); and
• managing the portfolio of interventions and uncertainty (Part Three).
2 Based on a literature review and initial consultations with departments and experts, we identified that government has a number of policy objectives on retirement incomes, three broad strands of interventions and its activities are guided by four principles: fairness; personal responsibility; simplicity; and, affordability and sustainability.
3 As the government’s interventions on the single-tier pension, automatic enrolment, raising the state pension age and extending working lives are at early stages, we have not reached a value-for-money conclusion. We have focused on identifying the challenges to successful delivery and areas of risk to public finances.
4 Our audit approach is summarised in Figure 20. Our evidence base is described in Appendix Two.

Government interventions to support retirement incomes Appendix One 47
Figure 20Our audit approach
The objective of government
Our study
Our key questions and evaluative criteria
Our evidence
(see Appendix Two for details)
Evidence covering all key questions
We examined this through:
• document review of reports by the Pensions Commission, the Work and Pensions Select Committee, the OECD and research bodies, including Chatham House and the Institute for Fiscal Studies;
• document review of statistics and projections published by the DWP, HMRC, OBR, ONS and other government departments on population trends, saving in pensions, retirement incomes and public spending on state pensions and benefits for the elderly, and legislation; and
• interviews with officials from DWP, the Government Actuary’s Department, HMRC, ONS, HM Treasury and experts from research bodies and interest groups.
We examined this through:
• document review of reports by the Commission on Funding of Care and Support, the NAO, the Pensions Commission and the Treasury Select Committee;
• document review of impact assessments and projections by BIS, DWP, OBR and HM Treasury on interventions affecting state pension age, saving in pensions, retirement incomes and public spending on state pensions and benefits for the elderly; and
• interviews with officials from BIS, DECC, DfT, DH, DWP, HMRC, the Money Advisory Service and HM Treasury, and experts from research bodies and interest groups.
Does government understand current spending on support for retirement incomes and the factors affecting future spending? It has identified the scale of the risks, or contingent liabilities, to public finances going forward, understands the causes and has carried out sensitivity analyses.
Is government managing its portfolio of interventions in a coherent and cost-effective way to meet its objectives? There is accountability for the totality of interventions, they are managed holistically, interactions are understood, cost and benefits monitored, and there is learning from experience?
Is government taking effective action to encourage people to save for retirement and work later into life? The interventions have clear and measurable objectives, a strong evidence base, and there is good understanding of costs, barriers, distributional effects and expected impacts.
We examined this through:
• document review of reports by the Pensions Commission, DWP, European Commission, select committees and research bodies;
• document review of statistics, surveys, impact assessments and projections by BIS, DWP, Eurostat, HMRC, HM Treasury, ONS and The Pensions Regulator on household saving, pensions, Individual Savings Accounts, tax relief, state pension age, ending the default retirement age, and average age of leaving the workforce and business cases, ‘gateway’ reports, strategy documents and board minutes;
• financial analysis of the interaction of means-tested benefits and incentives to save; and
• interviews with officials from BIS, DWP, HMRC, the Money Advisory Service, ONS, HM Treasury and experts from research bodies and interest groups.
Government has no single objective on retirement incomes, but it has objectives to:
• Deliver a simple and fair state pension that provides a foundation for saving and is sustainable for future generations.
• Reverse the culture of under-saving and enable individuals to take greater responsibility for retirement.
• Provide greater opportunities for people to participate in the labour market at age 65 and beyond.
This study reviewed the landscape of government interventions that support current and future retirement incomes, examining: government’s understanding of the need for change; interventions to encourage saving for retirement and extended working lives; and, how government is managing the portfolio of interventions.
We interviewed officials from DWP and HM Treasury and conducted expert interviews, with Ros Altmann, Professor Nicholas Barr (of the London School of Economics) and Chris Curry (of the Pensions Policy Institute), to explore issues across the key questions.

48 Appendix Two Government interventions to support retirement incomes
Appendix Two
Our evidence base
1 We carried out initial scoping interviews in May–June 2011 and collected and analysed evidence between March 2012 and March 2013. Our main methods were:
Interviews
2 We conducted 26 semi-structured interviews with officials to understand what government is seeking to achieve through its interventions, the identified challenges and risks and how they are being managed. We had interviews with:
• DWP: We conducted 11 interviews with: the finance director; the strategy directors for private pensions and for ageing society and state pensions; the lead analysts for pensions and ageing and workplace pensions reform; the heads of the pensions protection and stewardship division, the redefining retirement division, the pensions information and financial capability team, the private pensions policy and analysis team, and the pensions communication and stakeholder engagement team.
• HM Treasury: We conducted four interviews with officials in the pensions and savings division of the personal tax, welfare and pensions directorate.
• HMRC: We conducted two interviews with officials in the personal tax, customers and stakeholders’ directorate.
• The Money Advice Service: We conducted two interviews with the director of strategy and officials from the policy team on saving for retirement and financial capability and education.
• Other government departments and bodies: We conducted seven interviews with officials from: the Cabinet Office’s Major Projects Authority; the Department for Business, Innovation & Skills (covering abolition of the default retirement age and extension of flexible working); the Department of Energy & Climate Change (covering cold weather payments, winter fuel payments and the warm home discount scheme); the Department for Transport (covering concessionary bus travel); the Department of Health (covering spending on free prescriptions and eye tests, and on funding of social care and long-term care); the Government Actuary’s Department (GAD); and the Office for National Statistics (ONS).

Government interventions to support retirement incomes Appendix Two 49
3 We conducted 21 semi-structured interviews with experts and officials from a broad range of bodies with the purpose of better understanding the challenges government faces in successfully delivering its interventions.
• International organisations: We interviewed officials from the International Monetary Fund and the Organisation for Economic Cooperation and Development (OECD) to obtain a comparative perspective.
• Research organisations: We interviewed experts from Chatham House, the Institute for Fiscal Studies (IFS), the National Institute of Economic and Social Research (NIESR), the Pensions Policy Institute (PPI), the Oxford Institute of Ageing and the Strategic Society Centre.
• The financial services industry: We interviewed officials from the Association of British Insurers, the Association of Consulting Actuaries, the Equity Release Council, Hargreaves Lansdown, Hermes Research, and the National Association of Pension Funds.
• Employer, employee and consumer bodies: We interviewed officials from Age UK, the British Chambers of Congress, the Confederation of British Industry, the National Federation of Occupational Pensioners, the Trades Union Congress, and Which?
• Baroness Jeannie Drake, a member of the Pensions Commission 2002 to 2006 and a board member of the Pension Protection Fund from 2004.
4 We interviewed Dr Ros Altmann (a former policy adviser to HM Treasury and Number 10), Chris Curry (research director at the PPI) and Nicholas Barr (professor of public economics at the London School of Economics) for expert advice during scoping and fieldwork.
Document review
5 We reviewed a wide range of documents to understand the evidence base for government’s interventions, how they interact, barriers and challenges to successful delivery, the financial costs and the risks. The documents we reviewed included:
• the Pensions Commission’s reports and collected evidence;
• research reports by DWP and the Financial Services Authority;
• DWP surveys on attitudes to pensions and DWP statistics and projections on expenditure on pensions, pensioner benefits and means-tested benefits;
• ONS labour market statistics, national accounts, occupational pension scheme surveys, pension trends, population trends, and wealth and assets survey;

50 Appendix Two Government interventions to support retirement incomes
• the OBR’s fiscal sustainability reports;
• business plans for DWP, the Treasury and the Money Advice Service;
• green and white papers, consultation responses and impact assessments;
• the business case, ‘gateway’ reports, communications strategy, evaluation strategy and board minutes for the enabling retirement savings programme (automatic enrolment), The Pensions Regulator tracking surveys and research carried out for NEST;
• statistics from the Treasury and HMRC on saving in pensions and ISAs and tax relief;
• reports carried out for The Money Advice Service on brand awareness, competitor analysis and financial education initiatives;
• reports and evidence submitted to the Work and Pensions Select Committee inquiries into workplace pensions and the draft pensions bill (2013) and Treasury Committee inquiries into the Money Advice Service and Quantitative Easing;
• reports and surveys by non-government research bodies, the European Commission, financial services bodies and the OECD; and
• NAO reports on pensions matters and the whole of government accounts.
Financial analysis
6 We analysed DWP statistics of spending on pensioner benefits, HMRC statistics on tax expenditure and structural reliefs, DfT bus statistics and DH information on prescriptions dispensed to calculate (in Figure 2) total government expenditure in 2011-12 on supporting current and future retirement incomes.
7 We analysed current pensioner benefit and means-tested benefit rules to calculate (in Figure 17) marginal deduction rates for means-tested benefits available in retirement.

Design and Production by NAO Communications DP Ref: 10153-001
This report has been printed on Evolution Digital Satin and contains material sourced from responsibly managed and sustainable forests certified in accordance with the FSC (Forest Stewardship Council).
The wood pulp is totally recyclable and acid-free. Our printers also have full ISO 14001 environmental accreditation, which ensures that they have effective procedures in place to manage waste and practices that may affect the environment.

Published by TSO (The Stationery Office) and available from:
Online www.tsoshop.co.uk
Mail, telephone, fax and email TSO PO Box 29, Norwich NR3 1GN Telephone orders/general enquiries: 0870 600 5522 Order through the Parliamentary Hotline Lo-Call 0845 7 023474 Fax orders: 0870 600 5533 Email: [email protected] Textphone: 0870 240 3701
The Houses of Parliament Shop 12 Bridge Street, Parliament Square, London SW1A 2JX Telephone orders/general enquiries: 020 7219 3890 Fax orders: 020 7219 3866 Email: [email protected] Internet: http://www.shop.parliament.uk
TSO@Blackwell and other accredited agents
£16.00
9 780102 983791
ISBN 978-0-10-298379-1