Embed Size (px)
Citation preview

Journal of Economic and Social Research Vol 14(2) 2012, 27-52
Government Expenditure in Nigeria:
An Examination of Tri-Theoretical Mantras
Efobi Uchenna∗∗∗∗and Osabuohien S. Evans∗∗∗∗∗∗∗∗
Abstract: The role of the government in an economy cannot be overemphasised. This is with regards to fostering the development process. Government expenditure is presumed to be a veritable tool for economic growth and development leaning on the Keynesian doctrine. This study, therefore, analysed the behaviour of government expenditure in Nigeria and formulated an econometric model, which was estimated with vector autoregressive technique, among others. From three theoretical frameworks, the study found evidence that government expenditure in Nigeria responds largely to fiscal decentralisation and political instability than economic growth. This suggests that the government expenditure behaviour in Nigeria can be explained much more by the Leviathan and Peacock-Wiseman Displacement theories than the Wagner’s theory. Some recommendations were suggested for policy actions in the study.
JEL Classification Codes: H50, H70 Keywords: Capital Expenditure, Cointegration, Fiscal Decentralisation, Recurrent Expenditure, Variance Decomposition.
Acknowledgements: The useful comments from the anonymous reviewers are appreciated.
∗ Covenant University, Nigeria. E-mail:[email protected] ∗∗CovenantUniversity, Nigeria and German Development Institute. E-mail: [email protected]
Government Expenditure in Nigeria: An Examination of Tri-Theoretical Mantras
28
1. Introduction The determinants of government expenditure are important factors that are relevant for managing fiscal imbalances in developing countries, Nigeria inclusive. This becomes more pungent when development challenges such as poor infrastructure, high level of unemployment, insecurity of life and properties are blooming. These developmental challenges persist in Nigeria, despite the huge government expenditure that are budgeted annually to solve them. Based on this, diverse fiscal policies measures are been adopted by the Nigerian government with the aim of managing public expenditures. Some of these policies include reducing total expenditures, increasing taxes in the society as well as adopting a not fashionable approach of Central Bank financing, which Udoh (2009) has referred to as the devil’s alternative.
In utilising the option of curtailing bogus government expenditure,
some theories have been postulated to explain the behaviour of government expenditure. Some of them, identified in the literature include: excessive government revenue-the revenue-spend theory (connoting that the spending level in an economy should adjust equivalently to the volume of revenue generated in the economy). Others are the economic growth inducing government expenditure-Wagner theory (Bird, 1971); political instability inducing government expenditure-Peacock and Wiseman Displacement theory (Peacock and Wiseman, 1961); and the government decentralisation inducing government expenditure-Leviathan theory (Rodden, 2003).
Despite these theoretical postulations and the growing volume of
government expenditure in Nigeria and its marginal development outcome, the determinants of government expenditure in Nigeria has not received in-depth empirical examination in the light of these three theories. Few studies (e.g. Aregbeyen, 2006; Aruwa, 2010; Babatunde, 2011; Usenobong, 2011) have made attempts but with different conclusions regarding the rising government expenditure vis-à-vis economic growth o in Nigeria. Taking the case of of the Wagner’s theory; there are instances where the value of government expenditure increased but accompanied by a negative economic growth. For instance, from 1966 to 1968, the Nigerian economy growth rate fluctuated between -4.25% and -1.25%, while government expenditure growth rate increased from 1.12% to 58.96%. Likewise, during the Structural Adjustment Programme (SAP) of 1986, the Nigerian economy witnessed a reduction in growth rate of 2.51% (1986) and 0.1% (1994),
Efobi Uchenna and Osabuohien S. Evans
29
while the government expenditure growth rate increased from 35.72% to 54.62%. These evidences suggest that the behaviour of government expenditure sometimes follow a contradictory trend with economic growth. Thus, the government expenditure can be explained by some other factors apart from the growth of the economy. This is where this study makes its contribution by testing the government expenditure behaviour in relation to public expenditure’s theoretical postulations.
The rest of the study is organised as follows: literature review is
presented in the next section; method of analysis and empirical results are presented in the third and fourth section respectively, while the last section concludes with some policy recommendations.
2. Some Insights from Literature on Determinants of Government Expenditure The determinants of government expenditure have received considerable attention in the literature and some theories explaining this phenomenon persist. Popular among these theories include: the Wagner theory, Peacock and Wiseman-Displacement theory and the Leviathan theory.
The Wagner theory postulates that the government expenditure increases as a result of industrial and economic growth in a country. This theory further emphasises that there is both an absolute and a relative expansion of the public sector at the cost of the growth in the private sector. This is rooted on the assumption that during an industrialisation process, as the real income per capita of a country increases, the share of public expenditure is also expected to increase (Serena and Andrea, 2011; Babatunde, 2011). This suggests that the development in the industrial sector of a country will be accompanied by increased government expenditure. Therefore, increased government expenditure (recurrent or capital) occurs to maintain the industrial and growth process.
Bird (1971) justifies this postulation based on three evidences: the
administrative and protective functions of the government would require huge capital expenditure outlay; there will be the need for increased provision of social and cultural goods and services as the industrial sector grows. The government expenditure would be needed to manage and finance natural monopolies and ensure smooth operation of the market forces.
Government Expenditure in Nigeria: An Examination of Tri-Theoretical Mantras
30
It is also argued that government would have comparative advantages (e.g. capital) alongside the private sector in a growing economy (Rowley and Tollison, 1994). This is because the growth in the economy will attract shocks within the system and to ameliorate the effect of these shocks, the government’s intervention becomes pertinent. Furthermore, the industries set up by the private sector will look forward to the government’s involvement in ensuring sustainability and effectiveness through the provision of key facilities such as: infrastructures, health services and security. The provision of these facilities will involve an increase in government expenditure. Therefore, the main postulation of the Wagner’s theory is that government expenditure usually increases to match the growth rate of the industrial sector of the country.
Another popular theory that explains the behaviour of government
expenditure is the Peacock-Wiseman Displacement theory. This theory stems from the seminal work of Peacock and Wiseman (1961) who argued that a country’s government spending does not follow a smooth trend, but some ‘jumps’ at discrete intervals as a result of political instability. Peacock and Wiseman propose that the government expenditure of a country increases during periods of social, political and economic upheavals. The theory has three underlying assumptions, which include: government can always find ‘profitable’ ways in terms of its votes to expand available fund; citizens in general are susceptible to higher taxes; and government must be responsive to the wishes of their citizens (Henrekson, 1993). This implies that during periods of tranquillity and relative national peace, the incidence of tax will be fairly stable and consequently reduces the government revenue. However, during periods of national political instability, the tax levels seem to increase (displaced upward) and consequently shifts the government expenditure to a higher trajectory.
Sanjeev, De Mello and Sharan (2001), using panel regression
techniques from 120 countries found that total government expenditure and arms procurement in relation to the GDP, increased with political upheavals. In a more recent study, Olakalns (2010) examined the trend of government expenditure in the United Kingdom and found some instances where the ratio of government expenditure to GDP displayed structural break. A key feature of their finding is that, two instances coincided with major social upheavals. This is a reflection of the displacement theory.

Efobi Uchenna and Osabuohien S. Evans
31
The third theory that explains government expenditure is the Leviathan theory. This theory proposes that the aggregate government’s intervention in the economy will be reduced as the taxes and expenditures are reduced, ceteris paribus. Rodden (2003) asserts that the Leviathan theory emanates from the fact that the central government is viewed as a ‘revenue maximising leviathan’ that seeks to maximise her revenue by fiscal decentralisation of the central government monopoly on taxation. This theory maintains that the more decentralised the central government, the lower the government spending in the economy because the decentralised unit will be responsible for revenue generation and expenditure disbursement. By this, the pressure on the central government reduces and it is transferred to the sub-units.
In Nigeria, Olayiwola and Osabuohien (2010) described this
situation as fiscal hydrocephalus, where the leviathan trait is obvious as the federal government (FG) has overbearing fiscal jurisdiction (legislation, administration and collection of taxes). In effect, the FG legislates’ over 15 tax types and administers/ collects eight types of tax, the state government (SG) legislates six types of tax and administers 11 types of tax. While the local government (LG), which is the lowest cadre in public administration in Nigeria has no legislation over any form of tax, and it only administers/collects only two types of tax (Federal Inland Revenue Service-FIRS, 2008; Olayiwola and Osabuohien, 2010).
Some evidences have been observed mainly using data from United
States of America, Canada and Swiss (Rodden, 2003). However, not much evidence exist using data from developing countries like Nigeria.
3. Empirical Model and Estimation Technique
The study formulated an econometric model that relates government expenditure with indicators of economic growth, political instability and government decentralisation. This is intended to empirically test the relevance of the three theories in explaining the behaviour of government expenditure in Nigeria. Thus, the econometric model is stated as: Gexpt = f(Gdpgt + Polinstt + Gdiscent + µ) (1)
Government Expenditure in Nigeria: An Examination of Tri-Theoretical Mantras
32
In an explicit form, the model can be rewritten as: Gexpt = β0 + β1Gdpgt + β2Polinstt + β3Gdiscent + µt (2) Where: Gexp: Government expenditure, proxied as the total government expenditure (i.e. the sum of recurrent expenditure and capital expenditure). Gdpg: Real economic growth measured as the growth rate of GDP. Polinst: Political instability. The indicator of political institution (Polity IV) as reported in World Development Indicators dataset of the World Bank (2012) was used as a proxy. The value ranges from -10 (worst) to +10 (best). The political institutions measure was used because other direct measures of political instability such as estimates of battle deaths in civil war and the intensity of civil war, did not report data for the period of interest of this study. However, the proxy is able to capture the strength of government autocracy (-10) and democracy (+10). In Africa, the strength of autocracy of the government has been observed to fuel violence and rebel activities (Collier, 2008). The military era in Nigeria is a case in point, where there was a lot of political instability as a result of protest against the then autocratic government. Gdiscen: Government decentralisation is proxied as the ratio of the government revenue allocated to states to total federal government revenue (i.e. government revenue allocated to states divided by total federal government revenue). This measures the strength of the Federal Government (FG) revenue generating capability compared to the State Government (SG). The Leviathan theory suggests that the level of government decentralisation can be measured as the tax revenue that the SG generates. The assumption behind this is that the more the state generates revenue from tax, the less the aggregate federal government expenditure because the SG will be capable of engaging in expenditures needed in their jurisdiction. Oates (1985) identified two measures for government decentralisation, which include: fiscal centralisation ratios and a non-fiscal index of decentralisation. The former utilises either the SG’s share of state-local revenues or the state share of state-local total expenditure. These measures will incorporate the magnitude of state government revenue and expenditure as a ratio of total revenue and expenditure inclusive of local government revenue and expenditure. This
Efobi Uchenna and Osabuohien S. Evans
33
variable gives information on the size of the state government’s revenue in relation to the federal government.
The data for the variables was sourced from Statistical Bulletin of the Central Bank of Nigeria-CBN (2010) for the period 1961with the exception of political instability that was sourced from World Development Indicators of the World Bank (2012).
The time series property of the data was examined to determine the
order of integration by investigating the unit root properties of the series. Both the Augmented Dickey-Fuller (ADF) and Philipused to ascertain the unit root properties of the variablesestimated both at levels and first difference. This is represented in equations (3) to (5):
Constant and no trend model:
Constant and trend model:
Where is the first difference of the series
Furthermore, Α, ᴪ and β are the parameters to be estimated, while disturbance term. The chosen lagged terms was examined to ensure that the errors are uncorrelated. The difference between the equations (3either the inclusion or the exclusion of the deterministic elements. For instance, equation (3) does not have constant and trend, equation (4) has constant but no trend , while equation (5) has both constant
Uchenna and Osabuohien S. Evans
size of the state government’s revenue in
The data for the variables was sourced from Statistical Bulletin of CBN (2010) for the period 1961-2009. This is
political instability that was sourced from World Development Indicators of the World Bank (2012).
The time series property of the data was examined to determine the order of integration by investigating the unit root properties of the series.
Fuller (ADF) and Philip-Perron (PP) tests were used to ascertain the unit root properties of the variables. These tests were estimated both at levels and first difference. This is represented in equations
(3)
Constant and no trend model:
(4)
(5)
is the first difference of the series Yt. , which is the first difference of Yt-1.
are the parameters to be estimated, while εt is the stochastic disturbance term. The chosen lagged terms was examined to ensure that the errors are uncorrelated. The difference between the equations (3-5) lies at
clusion of the deterministic elements . For instance, equation (3) does not have constant and trend, equation (4)
, while equation (5) has both constant
Government Expenditure in Nigeria: An Examination of Tri
and trend . Further robustness check was carried out by applying the PP test to validate the result from the ADF test
After ascertaining the unit root property of the time series, the
cointegration test was estimated to determine the longvariables. This study adopts the approach of estimating the cointegration regressions with Ordinary Least Squares (OLS) by using variables with the same order of integration and then testing for stationary residuals of the cointegration regressions. After this, the errorcorrection model was formulated by including the vector error correction term, which is stated as:
∆Gexpt = β0 + β1∆Gexpt + β
ECM -1 + µt (6) The study is not only interested in establishing the long
relationship, but to establish the causality between the variables and the impulses that may occur due to the behaviours of the other endogenous variables in the model. The Vector Autothe Innovation Accounting estimation technique were usedAuto-regressive (VAR) equation is stated as:
∆Gexpt
∆Gdpgt-1
Where: εt-1 is the error correction term
and µt is the white noise disturbance terms.
1Some studies noted that performing a stationarity test for measures that do not readily change may not be appropriate. This study took note of this and results from the stationarity test further buttress this stance. 2 This also referred to as the Autoregressive Distributed Lag (ARDL), which makes the of stationarity among the co-integrating vectors not essential
Government Expenditure in Nigeria: An Examination of Tri-Theoretical Mantras
34
Further robustness check was carried out by applying the PP test to validate the result from the ADF test1.
After ascertaining the unit root property of the time series, the cointegration test was estimated to determine the long-run properties of the
approach of Miller (1991), which involves estimating the cointegration regressions with Ordinary Least Squares (OLS) by using variables with the same order of integration and then testing for
egration regressions. After this, the error-correction model was formulated by including the vector error correction
β2∆Gdpgt + β3∆Polinstt + β4Gdiscernt-1 +
only interested in establishing the long-run relationship, but to establish the causality between the variables and the impulses that may occur due to the behaviours of the other endogenous variables in the model. The Vector Auto-regressive system of estimation and the Innovation Accounting estimation technique were used2. The Vector
regressive (VAR) equation is stated as:
= β0 + βGexp t-1 + ∆Gexpt-1 +
1 + ∆Polinstt-1 + Gdiscernt-1 + µt
(7) is the error correction term βi (i= 1-4) are the parameters
is the white noise disturbance terms.
Some studies noted that performing a stationarity test for measures that do not readily change may not be appropriate. This study took note of this and results from the stationarity test
This also referred to as the Autoregressive Distributed Lag (ARDL), which makes the order integrating vectors not essential.

Efobi Uchenna and Osabuohien S. Evans
35
4. Results and Discussions We began the econometric estimations by observing the descriptive statistics of the variables. Then the econometric analyses follow. 4.1 . Descriptive Analysis The total government expenditure in Nigeria, like most countries, includes the capital expenditure and the recurrent expenditure. The capital expenditures include government expenditures on infrastructures, educational facilities, investment and development expenditure. This kind of expenditure involves physical asset as well as intangibles such as education, research and development and every other expenditure that improves the functionality of the assets, distinct from repairs (Davina, 2009). On the other hand, the recurrent expenditure includes those kinds of government expenditures that the benefits are not expected to be consumed within a year. This kind of expenditure reoccurs on an annual basis, implying that the government is expected to engage in this kind of expenditure on an annual basis. Figure 1 Categories of Government Expenditure in Nigeria
Source: Authors’ computation using data from CBN Statistical Bulletin (2010)
Figure 1 illustrates the trend in the volume of the government
expenditure in Nigeria (measured in local currency unit –Naira, N) for the period 1961-2009. From the figure, the recurrent expenditure of the Nigerian
Government Expenditure in Nigeria: An Examination of Tri-Theoretical Mantras
36
governments’ has remained higher than the capital expenditure. This is especially from the early 1990s onward. From this period, there was a distinct gap between the capital and recurrent expenditure. In 1961, there was a slight gap between both expenditures, as the government recurrent expenditure (N96.86 million) was only slightly more than the capital expenditure (N67.04 million). This is compared to 1971 when the gap increased sporadically with recurrent expenditure (N823.60 million) becoming many fold more than capital expenditure (N173.60 million). In 1981, there was a reversal in the trend as government capital expenditure (N6, 567 million) rose slightly above the recurrent expenditure (N4, 847.00 million). After this period, the government recurrent expenditure has been on the increase. In 1991, the recurrent expenditure was N38, 243.00 million, while capital expenditure was N28, 341.00 million. In 2001, the value of recurrent expenditure increased to N579.00 billion, while capital expenditure was N438.00 billion. In 2002, recurrent expenditure became about two fold more than capital expenditure. Similar trend was observed till 2009. It is important to note that economic development requires more capital expenditure than recurrent expenditure. This is based on the fact that expenditure which enhances development includes those that are channelled to infrastructural development, research and development equipment and energy.
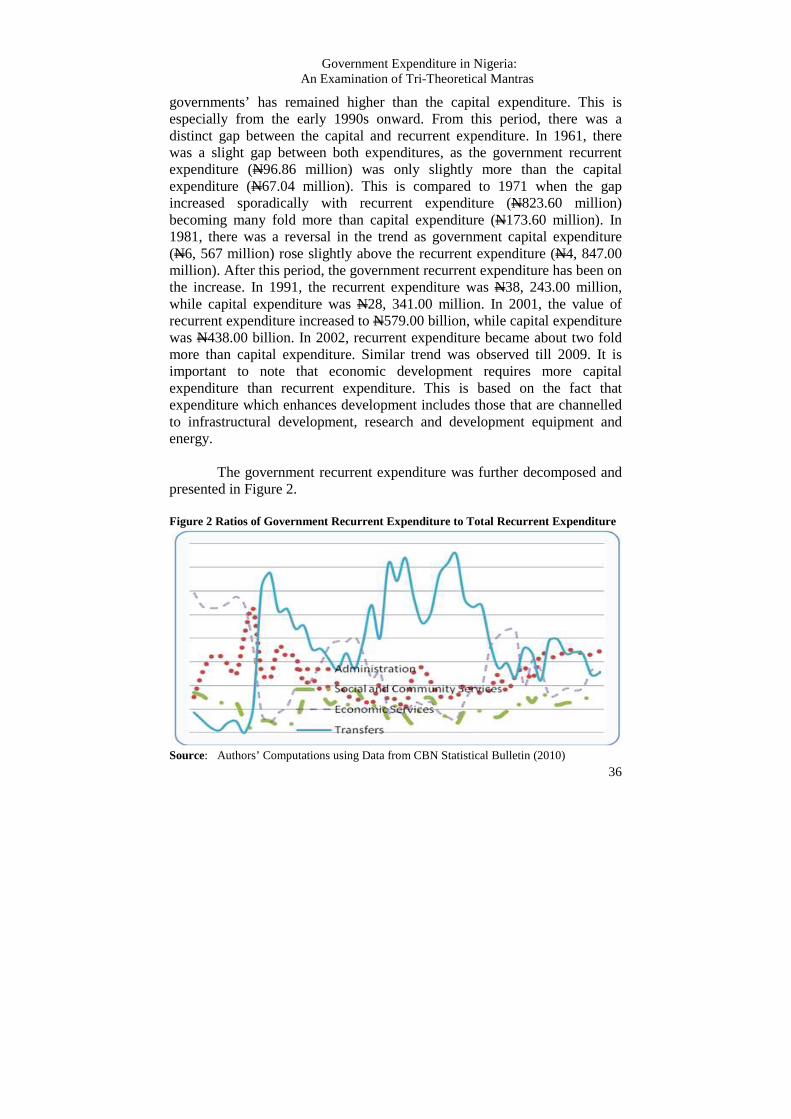
The government recurrent expenditure was further decomposed and
presented in Figure 2. Figure 2 Ratios of Government Recurrent Expenditure to Total Recurrent Expenditure
Source: Authors’ Computations using Data from CBN Statistical Bulletin (2010)
Efobi Uchenna and Osabuohien S. Evans
37
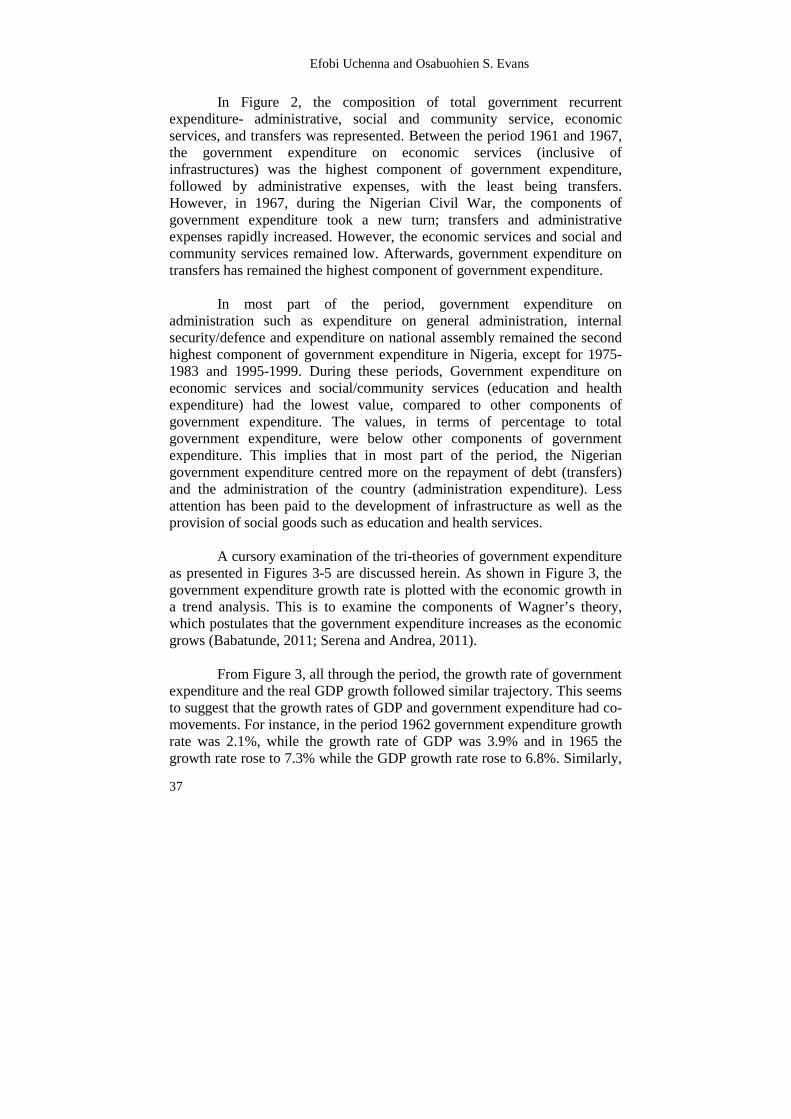
In Figure 2, the composition of total government recurrent expenditure- administrative, social and community service, economic services, and transfers was represented. Between the period 1961 and 1967, the government expenditure on economic services (inclusive of infrastructures) was the highest component of government expenditure, followed by administrative expenses, with the least being transfers. However, in 1967, during the Nigerian Civil War, the components of government expenditure took a new turn; transfers and administrative expenses rapidly increased. However, the economic services and social and community services remained low. Afterwards, government expenditure on transfers has remained the highest component of government expenditure.
In most part of the period, government expenditure on
administration such as expenditure on general administration, internal security/defence and expenditure on national assembly remained the second highest component of government expenditure in Nigeria, except for 1975-1983 and 1995-1999. During these periods, Government expenditure on economic services and social/community services (education and health expenditure) had the lowest value, compared to other components of government expenditure. The values, in terms of percentage to total government expenditure, were below other components of government expenditure. This implies that in most part of the period, the Nigerian government expenditure centred more on the repayment of debt (transfers) and the administration of the country (administration expenditure). Less attention has been paid to the development of infrastructure as well as the provision of social goods such as education and health services.
A cursory examination of the tri-theories of government expenditure
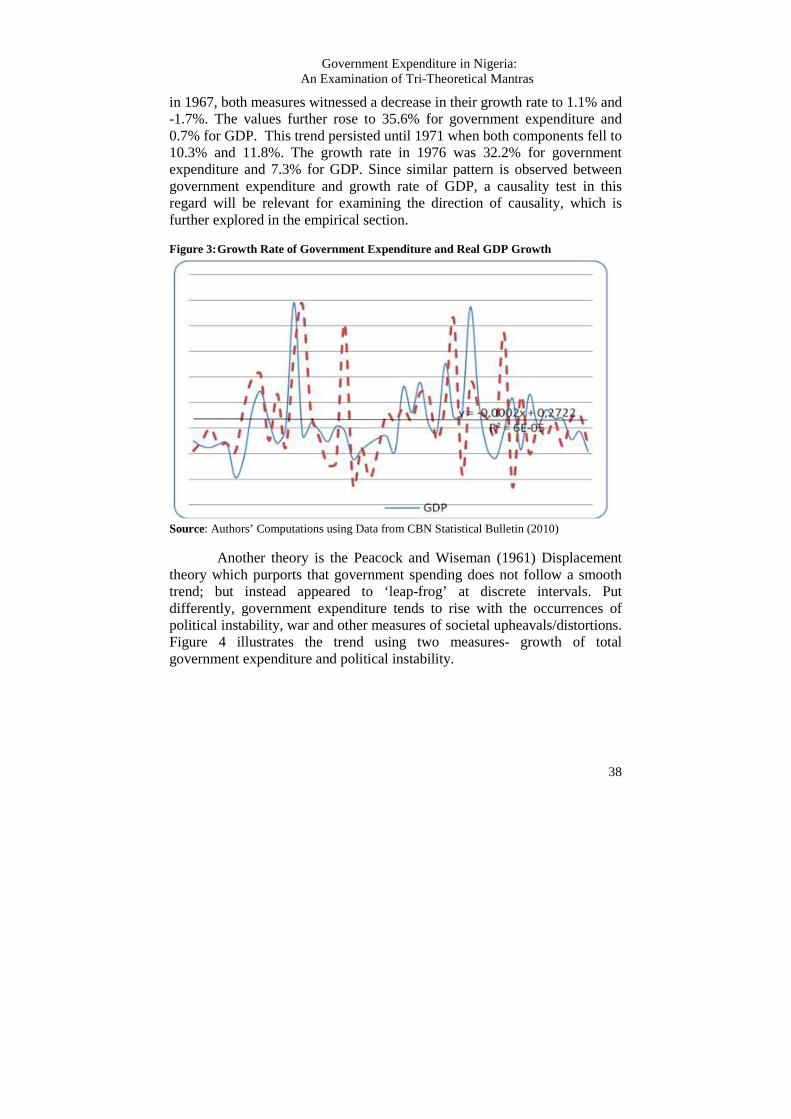
as presented in Figures 3-5 are discussed herein. As shown in Figure 3, the government expenditure growth rate is plotted with the economic growth in a trend analysis. This is to examine the components of Wagner’s theory, which postulates that the government expenditure increases as the economic grows (Babatunde, 2011; Serena and Andrea, 2011).
From Figure 3, all through the period, the growth rate of government
expenditure and the real GDP growth followed similar trajectory. This seems to suggest that the growth rates of GDP and government expenditure had co-movements. For instance, in the period 1962 government expenditure growth rate was 2.1%, while the growth rate of GDP was 3.9% and in 1965 the growth rate rose to 7.3% while the GDP growth rate rose to 6.8%. Similarly,
Government Expenditure in Nigeria: An Examination of Tri-Theoretical Mantras
38
in 1967, both measures witnessed a decrease in their growth rate to 1.1% and -1.7%. The values further rose to 35.6% for government expenditure and 0.7% for GDP. This trend persisted until 1971 when both components fell to 10.3% and 11.8%. The growth rate in 1976 was 32.2% for government expenditure and 7.3% for GDP. Since similar pattern is observed between government expenditure and growth rate of GDP, a causality test in this regard will be relevant for examining the direction of causality, which is further explored in the empirical section. Figure 3: Growth Rate of Government Expenditure and Real GDP Growth
Source: Authors’ Computations using Data from CBN Statistical Bulletin (2010)
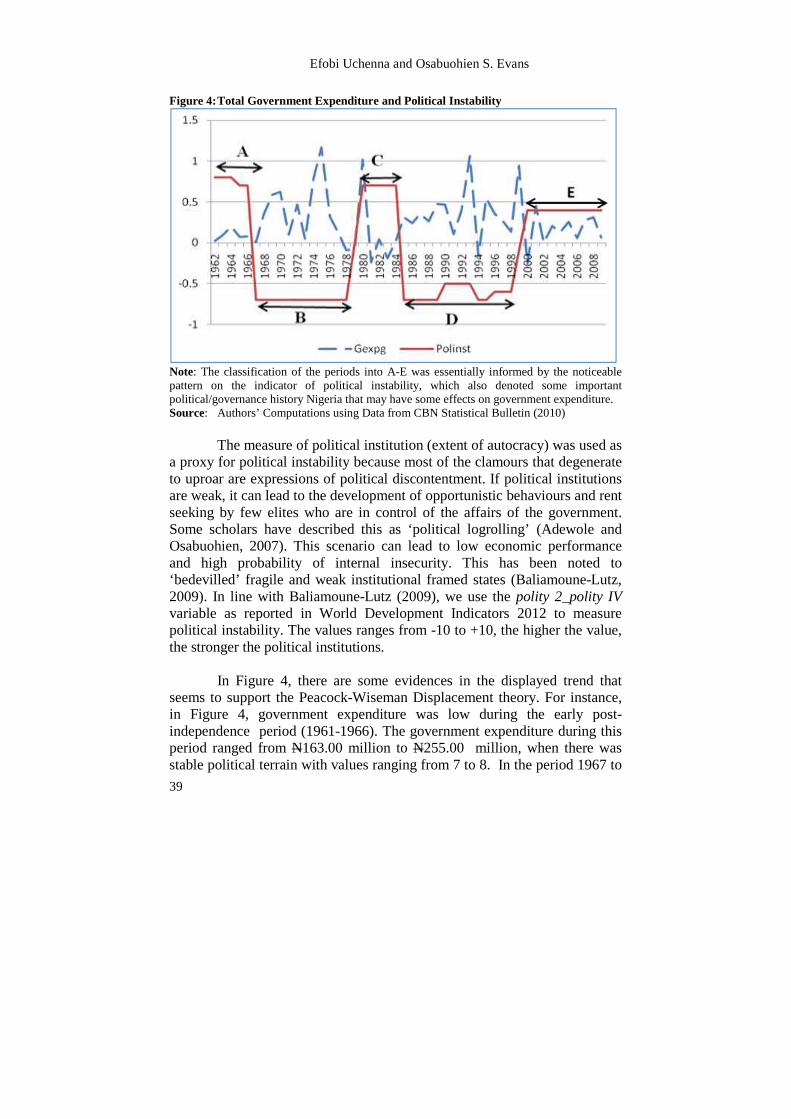
Another theory is the Peacock and Wiseman (1961) Displacement theory which purports that government spending does not follow a smooth trend; but instead appeared to ‘leap-frog’ at discrete intervals. Put differently, government expenditure tends to rise with the occurrences of political instability, war and other measures of societal upheavals/distortions. Figure 4 illustrates the trend using two measures- growth of total government expenditure and political instability.
Efobi Uchenna and Osabuohien S. Evans
39
Figure 4: Total Government Expenditure and Political Instability
Note: The classification of the periods into A-E was essentially informed by the noticeable pattern on the indicator of political instability, which also denoted some important political/governance history Nigeria that may have some effects on government expenditure. Source: Authors’ Computations using Data from CBN Statistical Bulletin (2010)
The measure of political institution (extent of autocracy) was used as
a proxy for political instability because most of the clamours that degenerate to uproar are expressions of political discontentment. If political institutions are weak, it can lead to the development of opportunistic behaviours and rent seeking by few elites who are in control of the affairs of the government. Some scholars have described this as ‘political logrolling’ (Adewole and Osabuohien, 2007). This scenario can lead to low economic performance and high probability of internal insecurity. This has been noted to ‘bedevilled’ fragile and weak institutional framed states (Baliamoune-Lutz, 2009). In line with Baliamoune-Lutz (2009), we use the polity 2_polity IV variable as reported in World Development Indicators 2012 to measure political instability. The values ranges from -10 to +10, the higher the value, the stronger the political institutions.
In Figure 4, there are some evidences in the displayed trend that
seems to support the Peacock-Wiseman Displacement theory. For instance, in Figure 4, government expenditure was low during the early post-independence period (1961-1966). The government expenditure during this period ranged from N163.00 million to N255.00 million, when there was stable political terrain with values ranging from 7 to 8. In the period 1967 to

Government Expenditure in Nigeria: An Examination of Tri-Theoretical Mantras
40
1978, which was the period of civil war and post civil war in Nigeria, the government expenditure ranged from N258.00 million to about N8.00 billion. When the political terrain became fairly peaceful again in the period 1980 to 1984, government expenditure was within the range of about N 9.00 billion to N 14.00 billion.
In the latter period 1985 to 1999, Nigeria witnessed some forms of
military change of government, civil unrest and riots, the government expenditure during this period was within the range of N13.00 billion to N947.00 billion, while political stability was within the range -1 to -7. However, in the transmission era from military to democratic era (2000-2009), the government expenditure ranged from N701 billion to about N3 trillion3, while the measure of political stability was fairly stable.
The trend in Figure 4 can be categorised into five different scenarios
using political instability variable denoted as A-E and summarised in Table 4.1. The Table describes the growth rate of government expenditure for the five scenarios and the mean value of political instability for each of the periods. Table 4.1: Scenarios of Government Expenditure and Political Instability
Source: Authors’ computations using Data from CBN (2010); World Bank (2012) From Table 4.1, the different scenarios show that the growth rate of
government expenditure was higher for the periods of political instability but
3 Inflation might have some influence on the figure. However, since emphasis is on the growth rate and variables are compared at the same period, such effect will fizzle out.
Periods Scenarios
Mean Growth Rate of Government Expenditure
Mean Political Institutions
1961-1966 A 0.0941 7.67
1967-1978 B 0.4090 -7.00
1980-1984 C -0.0886 7.00
1985-1999 D 0.3903 -5.87
2000-2009 E 0.1949 4.00
Efobi Uchenna and Osabuohien S. Evans
41
became lower for the periods of political stability. For instance, scenarios A, C and E were periods of relative political stability with mean values of 7.67, 7.00 and 4.00, the average government expenditure growth rate for the same scenarios were 9%, -0.08% and 19.49%. In scenarios B and D, political instability was prevalent with average values of -7.00 and -5.87, the average government expenditure growth rate was 40.90% and 39.03%. This gives some indication that the pattern of the Nigerian government expenditure has traces of the prediction by the Peacock-Wiseman Displacement theory.
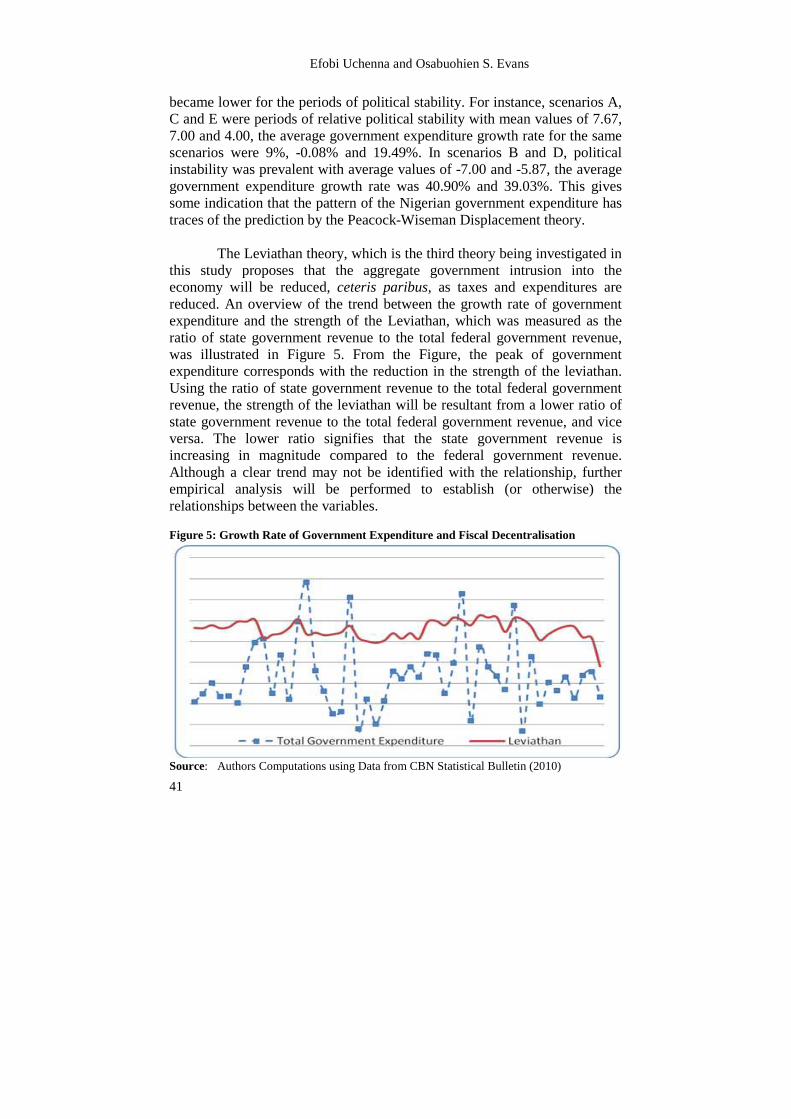
The Leviathan theory, which is the third theory being investigated in
this study proposes that the aggregate government intrusion into the economy will be reduced, ceteris paribus, as taxes and expenditures are reduced. An overview of the trend between the growth rate of government expenditure and the strength of the Leviathan, which was measured as the ratio of state government revenue to the total federal government revenue, was illustrated in Figure 5. From the Figure, the peak of government expenditure corresponds with the reduction in the strength of the leviathan. Using the ratio of state government revenue to the total federal government revenue, the strength of the leviathan will be resultant from a lower ratio of state government revenue to the total federal government revenue, and vice versa. The lower ratio signifies that the state government revenue is increasing in magnitude compared to the federal government revenue. Although a clear trend may not be identified with the relationship, further empirical analysis will be performed to establish (or otherwise) the relationships between the variables. Figure 5: Growth Rate of Government Expenditure and Fiscal Decentralisation
Source: Authors Computations using Data from CBN Statistical Bulletin (2010)
Government Expenditure in Nigeria: An Examination of Tri-Theoretical Mantras
42
From the descriptive analysis, the theory that best explains the
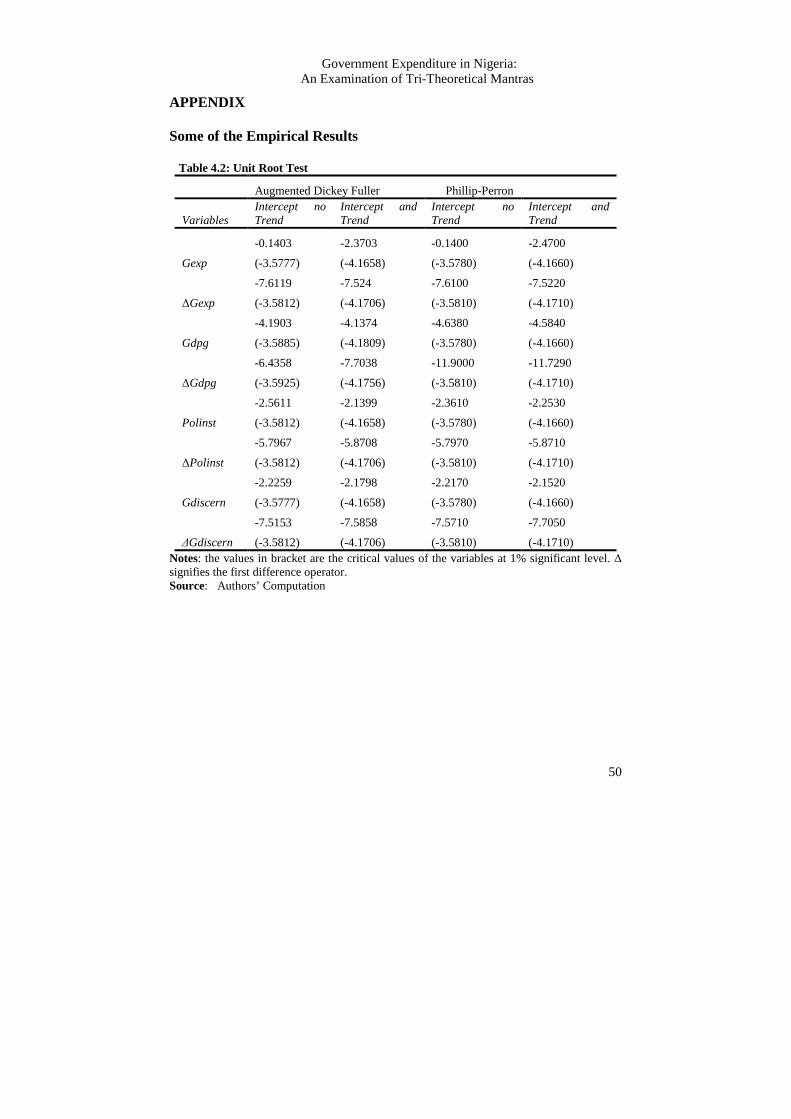
government expenditure behaviour in Nigeria cannot be clearly established. However, we took a step further in our econometric estimations, as reported and discussed in the next sub-section. 4.2. Econometric Results The econometric analysis engaged the cointegration test to establish the long run relationship between the variables, the variance decomposition technique, based on Vector Auto-regressive (VAR) approach and the causality test was also estimated. The unit root test was first estimated and reported in Table 4.2. The Augmented Dickey Fuller Test (ADF) and the Phillip-Perron (PP) test were employed.
Insert Table 4.2 Here From the results in Table 4.2, it is evident that the null hypothesis of
a unit root is accepted for all the variables at levels except the growth rate of GDP, where the hypotheses was rejected when the unit root test was conducted for intercept and no trend. However, at their first differences, the result revealed that all the series were stationary. The implication of the results is that all the variables are I (1) order of integration, with the exception of Gdpg. However, much discussion and emphasis is not placed on this test because the test for unit root is not a prerequisite for estimating the VAR model. As Marcet (2004:4) notes, VAR does not take cognisance of over-differencing. This is because the VAR model will be correctly adjusted by the moving average representation of the probability values of the models. Thus, reliable results about the innovation in a VAR model can be obtained by combining the process I(0) and I(1). Others like Sims, Stock and Watson (1990) have made related observation.
Having ascertained the unit root properties of the variables, the study
estimates the cointegration equation by performing an Ordinary Least Square (OLS) regression using the first differenced variables. The residuals from the estimation were determined and a unit root test was further performed on the residuals. The criterion for determining the existence of co-integration relationship amongst the variables is by testing the residuals from the
Efobi Uchenna and Osabuohien S. Evans
43
regression for the presence of unit root at levels. If the null hypothesis is rejected, then it is expected that the variables have a long-run relationship.
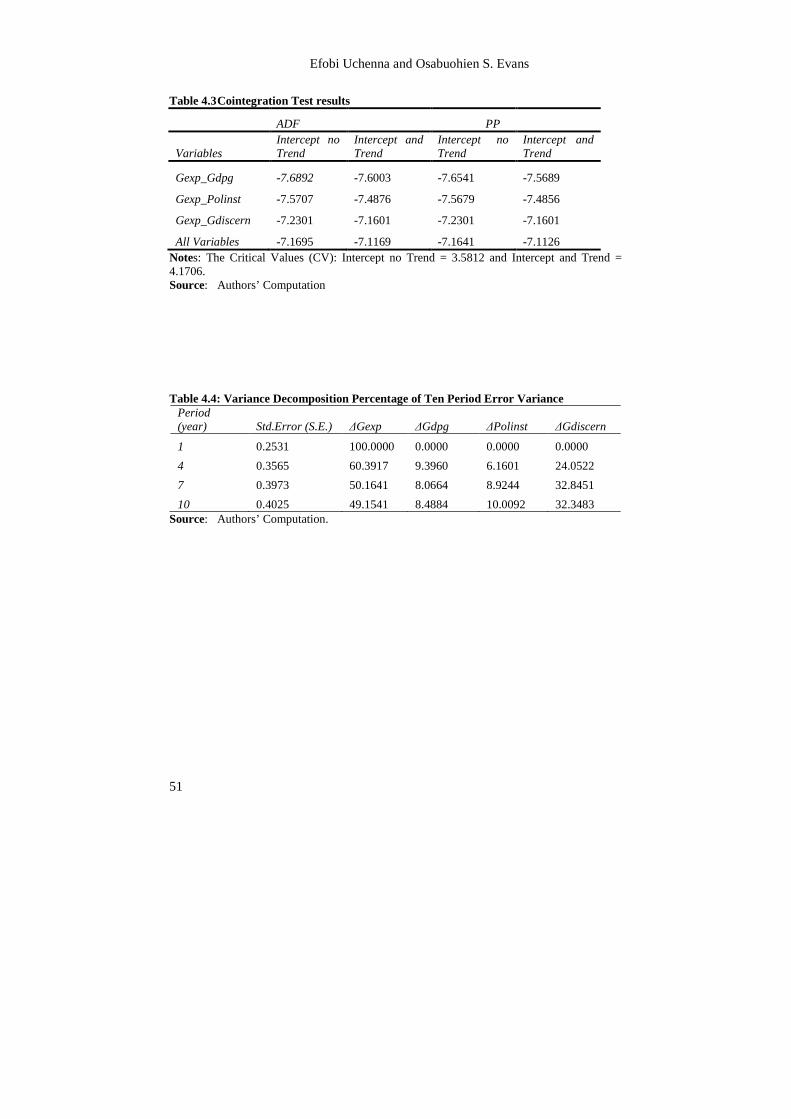
Insert Table 4.3 Here In Table 4.3, the long-run relationship was tested individually for
government expenditure and the three explanatory variables. The results indicate the existence of a long-run relationship between government expenditure and the three explanatory variables. This is evidenced in the test statistics of the unit root tests that were greater than the critical values at levels. Another long-run test was estimated for the combination of all the variables, and the result also confirmed that there exists a long-run relationship among the variables in the model.
The causal relationship and the response of government
expenditures to shocks from behaviours of the other explanatory variables were examined. The selected lag structure was five based on the Akaike Information Criteria (AIC) selection statistic. This lag structure was used in estimating the innovation accounting-variance decomposition and impulse response within a ten year forecasting period. The variance decomposition result is reported in Table 4.4.
Insert Table 4.4 Here From Table 4.4, the government expenditure in Nigeria was
explained largely by its past value (50.16%) in the seventh period, only 8.06% by the past value of economic growth and 8.92% by the past value of political instability. The fiscal decentralisation exerted relatively large influence on government expenditure as its past value explained about 32.85% variation on government expenditure in the seventh period. This implies that, apart from its past value, fiscal decentralisation is a crucial factor in determining the behaviour of government expenditure in Nigeria. The VEC granger causality test reported in Table 4.5 further confirms this finding that fiscal decentralisation is a significant determinant of government expenditure.
Insert Table 4.5 Here As can be observed from Figure 6 in the Appendix, the impact of the
shock on government expenditure itself was higher, as government
Government Expenditure in Nigeria: An Examination of Tri-Theoretical Mantras
44
expenditure (∆Gexp) reverted to its mean value after a sharp decline. This means that government expenditure in Nigeria depends very much on its past value. The effect on other variables is such that the growth of GDP (∆Gdpg) increased in the early periods but witnessed a significant decline before the value increased again to maintain its mean value for the other periods. Government decentralisation (∆Gdiscern) maintained a positive trend throughout the period, while political instability (∆Polinst) experienced decrease for a long period before it experienced noticeable increase towards the end of the period. This is likely to be connected to the return of democratic governance system in May 1999. Unexpectedly, the trend in government expenditure and political instability followed almost opposite spikes and troughs, which implies that the measure of political instability responds in opposite direction to shocks from government expenditure.
In segment B of Figure 6, the shock on ∆Gdpg had strong influence
on itself, with a sharp decline in the early period and the value reverted to its mean values afterwards. The trend in government expenditure (∆Gexp) follows a somewhat converse pattern compared to that of ∆Gdpg. This seems to be at variance with the Wagner’s theory, which postulates that the shock in economic growth increases the value of government expenditure.
In segments C and D of Figure 6, the impulse response to shocks in
political instability (∆Polisnt) and fiscal decentralisation are presented . A shock in political instability, will result to a somewhat rise in government expenditure after which it maintains its mean value in later years. The implication of this finding is that the government expenditure responds to shocks from political instability by exhibiting positive response characteristics for the period, before maintaining the mean values. This tends to support the tenets of Peacock-Wiseman Displacement theory. Furthermore, the reaction of government expenditure to shocks from fiscal decentralisation shows that a positive response is exhibited by government expenditure (∆gexp) before the mean value is maintained.
The implication of the impulse response function is that government
expenditure in Nigeria responds faster to shocks in political instability and fiscal decentralisation than economic growth. The submission supports Babatunde (2011) who used bound test to arrive at the conclusion that the government expenditure in Nigeria is not induced by economic growth. The implication of the above finding is that the Peacock-Wiseman Displacement

Efobi Uchenna and Osabuohien S. Evans
45
theory and the Leviathan theory better explains government expenditure behaviour in Nigeria than the Wagner’s theory.
5. Policy Recommendations and Conclusion The study was motivated to make contribution to the debate on fiscal policy aspect of macroeconomics. This is especially with regards to the determinants of government expenditure in Nigeria. The effort was deemed essential as not much empirical studies, focusing on explaining the behaviour of government expenditure, with regards the postulations of Wagner, Peacock-Wiseman and Leviathan theories (tri-theories), have been carried out in developing countries particularly those in Africa The above objective of this study was achieved by drawing empirical evidence from Nigeria for the period 1961-2009.
The result of the study shows evidences that government expenditure in Nigeria responds largely to fiscal decentralisation and political instability and not economic growth. Thus, the behaviour of government expenditure in Nigeria can be understood from the orthodoxy of the Leviathan and Peacock-Wiseman Displacement theories, more than the Wagner’s theory. The findings of this study have some implications for policy, which are summarised as policy recommendations herein.
Given the finding that fiscal decentralisation greatly and significantly influences the pattern of government expenditure, then efforts that will lead to revenue generations by the State Governments (SG) will help to solve some of the fracas caused by the issue of revenue sharing-formula and its aftermaths (including the recent ‘fuel subsidy removal’ in Nigeria). This is because such approach would ease the challenge of over centralisation at the level of Federal Government (FG). This is very germane in Nigeria because she practices much of a centralised system of government, with little revenue generation autonomy attributed to the SG.
The above recommendation will also make the SG assiduously seek
out competitive ways of improving their internally generated revenue, rather than depending excessively on the monthly allocation from the FG. It will also reduce the political tensions of revenue sharing formula. This is because the revenues from the FG will be minimal. With this in place, the FG expenditure will be reduced as the SG will have the autonomy to generate revenue and expend same, in ways they so deem efficient. This calls for a
Government Expenditure in Nigeria: An Examination of Tri-Theoretical Mantras
46
review of the present fiscal structure in Nigeria, which will include emphasis on true federalism and fiscal decentralisation.
Another important implication from the findings of the study that is
worth stressing is the fact that political instability significantly determines the behaviour of government expenditure in Nigeria. Thus, it is pertinent to recommend that strategies that will ensure strengthening of political institutions to avoid the degeneration into political instability will help reduce the gargantuan nature of government expenditure in Nigeria. This includes the calling of sovereign national confab, where the issues of discord such as ethnicity, religion will be ironed out and differences will be addressed, while common goals are emphasised. Thus, the issue of clientelism, elitism and rent seeking tendencies will be reduced. The above will lead to improved economic performance and reduce the high probability of internal insecurity which will help to reduce the over-bloated government spending at the federal level.
Efobi Uchenna and Osabuohien S. Evans
47
References Adewole, M.A. and Osabuohien, E.S. (2007) “Analysis of the Cost of
Governance and Options for Its Reduction in Nigeria”, Nigerian Journal of Economic and Social Studies, 49 (1): 137-159.
Aregbeyen, O. (2006) “Cointegration, Causality and Wagner’s Law: A Test
for Nigeria”, Central Bank of Nigeria Economic and Financial Review, 44 (2): 1-17.
Aruwa, S. (2010) “Public Finances and Economic Growth in Nigeria”,
Faculty Conference Proceeding, available at http://nsukonline.academia.edu/nsukedungacademiaedu/Papers [Accessed 14.04.2012]
Babatunde, M.A. (2011) “A Bound Testing Analysis of Wagner’s Law in
Nigeria: 1970-2006”, Applied Economics, 43(21): 2843-2850. Baliamoune-Lutz, M. (2009) “Institutions, Trade, and Social Cohesion in
Fragile States: Implications for Policy Conditionality and Aid Allocation”, Journal of Policy Modeling, 31: 877-890.
Bird, R.M. (1971) “Wagner’s law of Expanding State Activity”, Public
Finance, 26: 1-26. Central Bank of Nigeria-CBN. (2010) “Statistical Bulletin, Abuja: CBN Collier”, P. (2008). The Bottom Billion: Why the Poorest Countries are
Failing and what can be done about it, Oxford: Oxford University Press.
Davina, J. (2009) “Capital Expenditure and the Budget, Washington DC:
International Monetary Fund.” Federal Inland Revenue Services-FIRS (2008) “Current Tax Policy
Reforms”, Available at http://www.firs.gov.ng/about_us/mission_and_mandate/index.html#4 >.[Accessed 04.10.2012]
Henrekson, M. (1993) “The Peacock-Wiseman Hypothesis”. In Gemmel, N. (ed.), The Growth of the Public Sector, Theories and International Evidences. Cheltenham: Edward Elgar Publishing.
Government Expenditure in Nigeria: An Examination of Tri-Theoretical Mantras
48
Marcet, A. (2004) “Overdifferencing VAR’s is Ok”. Seminar Paper at CEMFI, June.
Miller, S. (1991) “Monetary Dynamics: An Application of Cointegration and
Error Correction Modelling”. Journal of Money, Credit, and Banking, 23: 139-154.
Oates, W.E. (1985) “Searching for Leviathan: An Empirical Study”.
American Economic Review, 75 (4): 748-757. Olakalns, H. (2010) “Peacock and Wiseman’s Displacement Hypothesis:
Some new Long-Run Evidence for the UK”. Applied Economics, 42: 1455-1460.
Olayiwola, K.W., and Osabuohien, E.S. (2010) “Evaluation of the Role of
Fiscal Policy in Promoting Savings, Investment and Capital Formation in Nigeria”. The Journal of Banking and Finance, 10 (1): 26-45.
Peacock, A.T., and Wiseman, J. (1961) "Determinants of Government
Expenditure," NBER Chapters, in: The Growth of Public Expenditure in the United Kingdom: 12-34 National Bureau of Economic Research, Inc. Available at http://www.nber.org/chapters/c2302.
Rodden, J. (2003) “Reviving Leviathan: Fiscal Federalism and the Growth
of Government”. International Organization. 57: 695-729. Rowley, C. and Tollison, R. (1994) “Peacock and Wiseman on the growth of
Public Expenditure”. Public Choice, 78: 125-128. Sanjeev, G., De Mello, L., and Sharan, R., (2001) “Corruption and Military
Spending”, European Journal of Political Economy, 17(4): 749-777. Serena, L. and Andrea, Z. (2011) “Increasing Public Expenditures: Wagner’s
Law in OECD Countries.” German Economic Review, 12(2):149-164.
Efobi Uchenna and Osabuohien S. Evans
49
Sims, C. A, Stock, J.H. and Watson, M.W. (1990) “Inference in Linear Time Series Models with Some Unit Roots.” Econometrica, 58(1):113-144.
Udoh, E (2009) “Optimal Seigniorage and Tax-smoothing in WAMZ: An
Econometric Assessment.” AERC Selection of Research Papers Drawn from Doctoral Theses, Nairobi: AERC.
Usenobong, A. (2011) “Cointegration, Causality and Wagner’s Hypothesis:
Time Series Evidence for Nigeria (1970-2008)”. Journal of Economic Research, 16: 59-84.
World Bank (2012) “World Development Indicators.” Available online at
http://data.worldbank.org/data-catalog/world-development-indicators [Accessed 25.07.2012]
Government Expenditure in Nigeria: An Examination of Tri-Theoretical Mantras
50
APPENDIX Some of the Empirical Results
Table 4.2: Unit Root Test
Augmented Dickey Fuller Phillip-Perron
Variables Intercept no Trend
Intercept and Trend
Intercept no Trend
Intercept and Trend
Gexp
-0.1403 -2.3703 -0.1400 -2.4700
(-3.5777) (-4.1658) (-3.5780) (-4.1660)
∆Gexp
-7.6119 -7.524 -7.6100 -7.5220
(-3.5812) (-4.1706) (-3.5810) (-4.1710)
Gdpg
-4.1903 -4.1374 -4.6380 -4.5840
(-3.5885) (-4.1809) (-3.5780) (-4.1660)
∆Gdpg
-6.4358 -7.7038 -11.9000 -11.7290
(-3.5925) (-4.1756) (-3.5810) (-4.1710)
Polinst
-2.5611 -2.1399 -2.3610 -2.2530
(-3.5812) (-4.1658) (-3.5780) (-4.1660)
∆Polinst
-5.7967 -5.8708 -5.7970 -5.8710
(-3.5812) (-4.1706) (-3.5810) (-4.1710)
Gdiscern
-2.2259 -2.1798 -2.2170 -2.1520
(-3.5777) (-4.1658) (-3.5780) (-4.1660)
∆Gdiscern
-7.5153 -7.5858 -7.5710 -7.7050
(-3.5812) (-4.1706) (-3.5810) (-4.1710) Notes: the values in bracket are the critical values of the variables at 1% significant level. ∆ signifies the first difference operator. Source: Authors’ Computation
Efobi Uchenna and Osabuohien S. Evans
51
Table 4.3 Cointegration Test results
ADF PP
Variables Intercept no Trend
Intercept and Trend
Intercept no Trend
Intercept and Trend
Gexp_Gdpg -7.6892 -7.6003 -7.6541 -7.5689
Gexp_Polinst -7.5707 -7.4876 -7.5679 -7.4856
Gexp_Gdiscern -7.2301 -7.1601 -7.2301 -7.1601
All Variables -7.1695 -7.1169 -7.1641 -7.1126 Notes: The Critical Values (CV): Intercept no Trend = 3.5812 and Intercept and Trend = 4.1706. Source: Authors’ Computation
Table 4.4: Variance Decomposition Percentage of Ten Period Error Variance Period (year) Std.Error (S.E.) ∆Gexp ∆Gdpg ∆Polinst ∆Gdiscern
1 0.2531 100.0000 0.0000 0.0000 0.0000
4 0.3565 60.3917 9.3960 6.1601 24.0522
7 0.3973 50.1641 8.0664 8.9244 32.8451
10 0.4025 49.1541 8.4884 10.0092 32.3483 Source: Authors’ Computation.

Government Expenditure in Nigeria: An Examination of Tri-Theoretical Mantras
52
Table 4.5: VEC Granger Causality Test
Variables ∆Gexp ∆Gdpg ∆Polinst ∆Gdiscern
∆Gexp 0.8466 1.6830 2.4954*
(0.5274) (0.1681) (0.4910)
∆Gdpg 0.7321 1.7679 0.7050
(0.6049) (0.1488) (0.6240)
∆Polinst 0.9516 0.1784 0.0783
(0.4621) (0.9687) (0.9951)
∆Gdiscern 0.4830 1.1914 0.9530
(0.7862) (0.3361) (0.4613)
Conclusion: ∆Gdiscern ∆Gexp
Note: the values in bracket are the probability values; * reject null hypothesis at 5%. Source: Authors’ Computation
Figure 6: Impulse Responses Functions