Embed Size (px)
DESCRIPTION
This paper is a product of the Fall 2010 capstone course for the CHANGE (Certificate on Humans and the Global Environment) program in the Nelson Institute for Environmental Studies at the University of Wisconsin‐Madison. CHANGE was originally created as the training component of an NSF‐IGERT (National Science Foundation – Integrative Graduate Education and Research Traineeship) program that funded graduate students at UW‐Madison. Several of the researchers on this project are IGERT recipients. This capstone project was completed under the direction of Gary Radloff, Policy Director for the Wisconsin Bioenergy Initiative, and we are grateful for his commitment and insight. We would also like to thank Professor Jonathan Patz and Dr. Robert Beattie, both of the CHANGE program, whose guidance and assistance helped make this paper a reality.
Citation preview

GotGas?AnAnalysisofWisconsin’s
BiogasOpportunity
AleiaI.McCordStevePlachinskiMirnaSantanaJeffreyA.StarkeSarahStefanos
CHANGEProgram
UniversityofWisconsin‐Madison
March2011


i
FOREWORDThispaper is aproductof theFall2010capstone course for theCHANGE (CertificateonHumansandtheGlobalEnvironment)programin theNelsonInstitute forEnvironmentalStudies at the University of Wisconsin‐Madison. CHANGE was originally created as thetrainingcomponentofanNSF‐IGERT(NationalScienceFoundation–IntegrativeGraduateEducation and Research Traineeship) program that funded graduate students at UW‐Madison. Severalof the researcherson thisprojectare IGERTrecipients. This capstoneproject was completed under the direction of Gary Radloff, Policy Director for theWisconsinBioenergyInitiative,andwearegratefulforhiscommitmentandinsight.Wewould also like to thankProfessor JonathanPatz andDr.RobertBeattie, both of theCHANGEprogram,whoseguidanceandassistancehelpedmakethispaperareality.

ii
TABLEOFCONTENTSEXECUTIVESUMMARY .......................................................................................................................................... 1INTRODUCTION........................................................................................................................................................ 2
WhatisBiogas? .................................................................................................................................................. 2FarmingMicrobes:Small‐scaleHusbandry........................................................................................... 2BasicBiogasSystems....................................................................................................................................... 4DairyandFoodProcessing:Wisconsin’sBiogasPotential ............................................................. 4
METHODSANDOBJECTIVES............................................................................................................................... 6WisconsinStakeholderEngagement ........................................................................................................ 6WisconsinBiogasBenefitsAnalysis.......................................................................................................... 6FutureAnalyses:UnderstandingWisconsinBiogasChallenges................................................... 6
BIOGASBENEFITSINWISCONSIN ................................................................................................................... 7Benefit1:WASTEMANAGEMENT............................................................................................................. 8
1.DairyFarmWasteandNutrientManagement ..................................................................... 10NitrogenandPhosphorousLoading:AWisconsinChallenge .................................... 10Estimatingthe“Cost”ofPhosphorousinWisconsin...................................................... 10AnaerobicDigestion:AWisconsinNutrientManagementSolution........................ 11IntegratingAnaerobicDigestionintoExistingNutrientManagementTools ...... 12OdorReductions ............................................................................................................................ 13ScenarioAnalysis........................................................................................................................... 16WeedReduction ............................................................................................................................. 17PathogenReduction ..................................................................................................................... 17EffectsofReductionsinManurePathogenLoadsforWisconsin ............................. 19
2.FoodProcessingWasteandNutrientManagement........................................................... 21Wastewater ...................................................................................................................................... 21SolidWaste....................................................................................................................................... 24
Benefit2:ENERGYINDEPENDENCE ..................................................................................................... 26Wisconsin’sEnergySpending ........................................................................................................... 27Biogas:Versatile,Predictable,StorableEnergy......................................................................... 27BiogasEnergyContribution............................................................................................................... 28ScenarioAnalysis .................................................................................................................................... 28
Benefit3:ADDITIONALECONOMICOPPORTUNITIES.................................................................. 30GreenJobsandNewIndustry............................................................................................................ 31Co‐productsandAvoidedCosts:NewOpportunitiesforDairyProducers? ................. 32
Bedding .............................................................................................................................................. 32Fertilizer ............................................................................................................................................ 32ScenarioAnalysis........................................................................................................................... 33
CarbonMarketsandCarbonCredits .............................................................................................. 33Benefit4:GREENHOUSEGASEMISSIONSREDUCTIONS ............................................................. 35
GreenhouseGasEmissionsandSources....................................................................................... 36HowAnaerobicDigestionCanReduceEmissions.................................................................... 36GreenhouseGasEmissionsinWisconsin..................................................................................... 37ScenarioAnalysis .................................................................................................................................... 39

iii
UNDERSTANDINGWISCONSIN’SBIOGASCHALLENGES .................................................................... 41StakeholderConcerns .................................................................................................................................. 41OtherPerspectives ........................................................................................................................................ 41
CONCLUSIONS ........................................................................................................................................................ 43REFERENCES........................................................................................................................................................... 45
QuantitativeSourceDataandAssumptions....................................................................................... 45WorksCited ...................................................................................................................................................... 46

1
EXECUTIVESUMMARY
Much research has addressed the potential for “green” technologies—such as anaerobicdigestion—to provide clean, renewable alternatives to fossil fuels that can meet thenation’senergyneeds.However, fewanalystshaveaddressedtheotherpotential impactsof these technologies. This report analyzes the potential suite of benefits that anaerobicdigestionofferstothestateofWisconsin,beyonditsutilityasanenergyresource.AtastatewidebiogasstakeholdersummithostedbytheWisconsinBioenergyInitiativeinOctober 2010, producers, utilities, policy experts, researchers, and financial industryrepresentatives identified the four most significant categories of biogas benefits inWisconsin.Specifically,biogasmayofferopportunitiesfor:
1. WasteManagement:Protecting Wisconsin’s scenic waterways & drinking water, promoting publichealth, improving property values, and extending the life of municipal wastesystemsby:
• OfferingLIVESTOCKoperationsopportunitiesfornutrientmanagement,odorcontrol,pathogenreduction,&weed‐seedreduction
• OfferingFOODPROCESSINGoperationsopportunitiesforsolid&liquidwastemanagement,&odorcontrol;
2. EnergyIndependence:
Reducing reliance on fossil fuel imports by supporting a versatile, predictable,andstorableWisconsin‐madeenergysource;
3. AdditionalEconomicOpportunities:• Creating“greenjobs”andnewindustryinWisconsin• Offeringnewincomesourcesand/oravoidedcostsfordairyproducersthat
utilizedigestedsolidsforanimalbeddingand/orfertilizer• Capitalizingonthepotentialforlinkingwithemergingcarbonmarkets
4. GreenhouseGasEmissionsReductions:Providingaclean,sustainablefutureforgenerationsofWisconsinites.
We offer qualitative and—when possible—quantitative assessments of each of thesebenefits. We identify challenges, controversies, and information gaps in need of furtheranalysis.Inaddition,weincludeascenarioanalysisofeachbenefitforthreesystems:(1)anaverageWisconsin dairy farm (~100 head ofmilk cows), (2) aWisconsin ConcentratedAnimalFeedingOperation(~1000headofmilkcows),and(3)aWisconsinfoodprocessingplant.According to our analysis, biogas does appear to offer Wisconsin a host of benefits.However, this document is not a definitive assessment of these benefits. Rather, it isintendedasastartingpointforresearchers,policymakers,producers,andotherexpertstocriticallyexamineWisconsin’sbiogasopportunity.

2
!"#$%&'()*
+(,$-.$%*
/0'-.%#.$-*
!!"#$%&'(")*$
+,-+.("*/0$/1'1!
•!!"#$%&'!!
•!!()&$!*+,#-'!
•!!./'#0!
•!!1!3/#45!
•!!6))7!.#20'!
$!$2/&3/"4"'$5/++/6$
/123+*
789%+:9%&%,+;&)*9<$
4315!/*
7=>;?@A$B/.9("/<$ 89-'!0)!
:+9',+$'!;%#,+04!
C%3-,+4%"$
<&#$29)&0#=)$!
6%',!
D)&/*.$E+/$
>'#0!
?,'@0&+@+04!
23673+*
7F).&%'/";&)*9<$
D)&/*.$6("G$
(::6)*(4%"$
H/&46)I/&$%&$$
!")3(6$J/GG)"'$
A%09%02! ?$7!82'2!B+),)-+@#,!C@=D+04!E$9%02!
Figure1.Schematicrepresentationoftheprocessofanaerobicdigestion.
INTRODUCTION
WhatisBiogas?Biogas is produced whenmicroorganisms break down organic waste—such as manure,crop residues, or foodwaste—in the absence of oxygen. Biogas is a complexmixture ofseveral gases, but the majority of the product is methane (typically 40‐75%), the maincomponentofnaturalgas.Biogascanbeusedinanyofthewaysconventionalnaturalgaswouldbeused.Itcanbecombustedtoproduceelectricityandheat,cleanedandupgradedfor injection into existing natural gas pipelines, or cleaned and compressed to createtransportation‐gradefuel. Inadditiontoproducinggaseousmethane,biogassystemsalsogenerateliquidandsolidproducts.Thedigestedsolidsarerichinphosphorousandcanbeusedon‐farmasanimalbeddingorsoldasasoiladditive.Theliquideffluentcanbeland‐applieddirectlyasanitrogen‐richfertilizer.
FarmingMicrobes:SmallscaleHusbandryAnaerobicdigestioniscarriedoutbyanaturally‐occurringcommunityofmanyspeciesofbacteriathatthriveinareaswithlowoxygenandplentyoforganicmatter—suchasinthe
Figure2.Fromlefttoright:(a)Anon‐farmanaerobicdigester,(b)afacilitythatupgradesbiogastopipelinequalityrenewablenaturalgasnearFreiburg,Germany,and(c)acombustionenginethatcovertsbiogastoelectricity.

3
gastrointestinal systems of cattle and people. The rate and efficiency of this digestiondependsuponboththechemicalstructureofthesubstrateandthestabilityofthebacterialcommunities. Selecting a consistent mix of substrates with high energy content that isreadilyavailabletothebacteria(likesimplesugarsandfats)maximizesbiogasproduction.On the other hand, feeding the digester highly variable substrateswith nutrients lockedaway in compounds that bacteria cannot digest (like lignin and cellulose) leads to poorbiogasyields.Manure is actually among the least efficient substrates for biogas production (25‐45m3biogas per ton). Microbial communities in the gastrointestinal system of the cow havealreadydigestedtheorganicmaterial,andthusmuchoftheenergy/nutrientshavealreadybeen extracted. In contrast, maize silage produces several times more methane thanmanure (202m3 biogas per ton). Other substrates, such as food wastes, can yield evenmore biogas; for example, food scraps (265m3 biogas per ton), bakerywastes (714m3biogasperton),andfatsandgrease(961m3biogasperton).1Each digester should be individually designedandmaintainedbasedontheuniqueconditionsof its site. A mixture of co‐substrates fromagricultural,municipal,andindustrialproductscan be combined to optimize biogasproduction.There is not one “magicmix” thatwillwork for all digesters, and eachproducershould analyze the trade‐offs inherent inselectinganappropriatemixofsubstrates.Like all living things, these microbialcommunitiesmustbenourishedandcaredforin order to grow.Microbeswill perish if exposed to toxins such as detergents, high saltconcentrations,antibiotics,highconcentrationsofmetals,bleachorotherharshchemicals.Theywill flourish if kept at a constant temperature and fed an energy‐rich, high‐qualityfeedstock. A well‐designed and operated anaerobic digester will provide the optimalconditionsforthesemicrobestosurviveandreproduce.
1Substrateyieldsderivedfromhttp://www.fnr‐server.de/cms35/index.php?id=399andhttp://biogas‐energy.com/site/BiogasEnergy.pdf
ResearchPriorities:Whichsubstratecombinationswill…• Optimizebiogasproduction?• Supportoptimalmicrobial
communitycompositions?• UtilizeWisconsin’sexisting
resourcesoraddressitsexistingchallenges?
TechnologySpotlight:DigesterAdditives
NewsmallbusinessesinGermanyoffercustomersmonthlymicrobialmonitoringservices.Alabanalyzessamplesfromthedigesterandidentifieskeymicronutrientandenzymaticadditivesthatwilloptimizedigesterperformance.
Substrateconsiderations:• Howmuchenergyisinthesubstrate?
• Howconsistentisthesubstrateenergy/nutrientcontentovertime?
• Howreliableisthesubstratesource?• Whatisthecostofcollecting/transportingthesubstratetothedigestersite?

4
BasicBiogasSystemsAnaerobic digestion, like all biologically mediated processes, is dependent upon severaloperationalconditions,thatwhenoptimized,willgeneratethemostgasproduction.Someoftheoperationalconditionsthatcanbeoptimizedinclude:ReactorConfigurationThereareseveraldifferentdesignconfigurationsavailable.InWisconsin,themostcommonconfigurations are completely mixed and plugflow processes. The completely mixedconfiguration induces mixing by mechanical (e.g. stirrers) or convection (e.g. mixinginducedby thegasproduced inside thereactor).Thisdesign isused toensure that freshmanureandthemicroorganismsarebroughttogetherefficientlyandthatcrustlayersarepreventedfromforming—resultinginlesstimerequiredforthedigestiontobecompleted.Theplug‐flowreactortreatswasteinsuchamannertomovethewastethroughthereactoras “plug”withminimalmixing in thedirectionof flow.This can result in a veryefficientprocessthatcandecreasetheamountoftimeforreactionstobecompleted.TemperatureReactors can be run at different temperature regimes—mesophilic and thermophilic. Thetemperature for mesophilic operations is 35°C whereas thermophilic operations usetemperatures of 55°C to 65°C. The temperature impacts several operational parametersincluding the rate of chemical reactions and the ability for specific organisms to surviveundertheseconditions.
DairyandFoodProcessing:Wisconsin’sBiogasPotentialWisconsin’sdairyindustrycontributes$26.5billionperyeartothestate’seconomy.1Eachyear, the 1.26 million dairy cows in the state’s 12,500 licensed milk herds generateapproximately 23 million tons of manure, 14 million pounds of nitrogen, and 6 millionpounds of phosphorous.2, 3 Dairy operators spend $48.5 million annually on manuremanagement to protect Wisconsin’s watersheds.2 Despite the best efforts of theseproducers, manure‐related phosphorous loading in Wisconsin’s waterways remains aserious concern for homeowners, fishermen, recreational users, and others across thestate. If anaerobic digestion can provide a new tool for manure management, thistechnologywould provide a critical secondary benefit of pollution control in addition toenergy production. Properly promoted and regulated, biogas could offer America’sDairyland a new source of on‐farm income not subject to commodity price fluctuationswhilecontributingtoWisconsin’slonghistoryofenvironmentalstewardship.Wisconsin is home to more than 1000 food‐processing facilities with large numbers ofbrewers, cheese producers, and processors of meat, fruit, vegetables, and grains. Theseindustries generate nearly $10 billion in revenue each year and employ over 60,000Wisconsinites.4 These facilities also generate a large amount of solid and liquid organicwastethatputincreasedstrainonthestate’slandfillsandwastewatertreatmentplants—acostforindustryandthepublicalike.5,6Anaerobicdigestionisacost‐effectivewaytotreatfood‐processingwaste.
5
Wisconsincurrentlyboastsatleast31on‐farmanaerobicdigesters,themostofanystateinthe United States, and at least 27 food processing anaerobic digesters7.2 The installedelectric generating capacity of the on‐farm systems alone is approximately 12 MW –enoughtopowerover10,000homes.AnupcomingindustrialdigestercasestudyreportbytheEnergyCenterofWisconsinanalyzesthecurrentcapacityofanaerobicdigestersatfoodprocessing facilities inWisconsin,andsuggests that theiruse isexpanding.However, theoverwhelmingmajority of dairy farms and foodprocessors arenot employing anaerobicdigestion to manage their waste. In recent years, the state has experienced a relativeplateau in the creation of newdigesters despite the range of policies andprograms thatcouldpropelbiogasexpansioninWisconsin.3Thisleadstothequestion:whyhasn’tbiogasbeenmoresuccessfulinWisconsin?Assessments of Wisconsin’s biogas potential have only described the direct benefits ofenergy use without carefully considering of all the potential benefits associated withanaerobic digestion. This has created a policy environment that may not value the realpotential for biogas production in the state of Wisconsin. Wisconsin has specific assets(suchasathrivingdairyindustryandahighconcentrationoffoodprocessors)andspecificneeds (such as reduced nutrient loads on recreational waters) that can be directlyaddressedbyanaerobicdigestion.To properly evaluateWisconsin’s biogas potential, wemust assess not only the obviousenergy benefits of this technology, but also the previously unquantified co‐benefits oravoided costs that may accompany its use in Wisconsin. Could these biogas benefitsultimatelysupportthedairyindustryinWisconsin,createnewjobsforWisconsinites,andimprovethestate’sairandwaterquality?Ifso,biogasoffersthestateatriplebottomlineworthyoffurtherevaluation.
2Thisstudydoesnotdifferentiatebetweenfoodandnon‐foodindustrialprocessors,sothespecificnumberoffoodprocessingfacilitieswithanaerobicdigestionisdifficulttodetermine.3Foracompleteanalysisofthesepolicies,seetheBilek(2010)reportonhowfederal,regional,andstatepoliciescouldcontributetoprovisionsoutlinedinWisconsin’sRenewablePortfolioStandards(RPS)of10%renewableenergyproductionby2015.

6
METHODSANDOBJECTIVES
WisconsinStakeholderEngagementRepresentatives from the dairy industry (producers), government agencies (naturalresourcesandagriculture), the financesector,environmentalgroups,energyutilities, thebiogas industry (facilitydesign, construction, andoperation), university researchers, andpolicymakers gathered at the Wisconsin Bioenergy Institute Summit on October 14‐15,2010inMadison.Together,thesestakeholdersidentifiedasuiteofbenefitsassociatedwithbiogas technology, hurdles to adopting this technology, and creativepolicy ideas to spurbiogasdevelopment inWisconsin.Wedocumented thesediscussionsandused themasastartingpointforourresearch.
WisconsinBiogasBenefitsAnalysisGuidedbytheideasofferedattheWisconsinBiogasStakeholdersMeeting,wereviewedtheacademic and industry literature to provide a qualitative assessment of the potentialmagnitudeofeachbiogasbenefitforWisconsin.Thenweusedexistingdataandsoftwareto conduct a preliminary quantitative analysis of these benefits for Wisconsin. For thisquantitative analysis, we present three scenarios that we believe represent the typicalrangeofpromisingbiogasapplicationsinWisconsin:anaveragesizefarm(<100headmilkcows),aconcentratedanimal feedingoperation(CAFO),anda foodprocessingoperation.This analysis does not report definitive values for each scenario. The calculation of co‐benefits will always depend on site location, previous activities, and other externalinfluences.Instead,thisanalysisexploreswhetheranaerobicdigestioncanbeusedineachscenario as a tool to provide opportunities for improved waste management, supportenergyindependence,offerarangeofneweconomicopportunities,andreducegreenhousegasemissions.Informationgapsandfutureresearchprioritiesareidentified.Assumptionsregardingthesethreescenarios(averagefarm,CAFO,foodprocessor)andotherinputsintoourmodels can be found in theReferences section (please seeQuantitative SourceDataandAssumptions).
FutureAnalyses:UnderstandingWisconsinBiogasChallengesOur analysis focuses exclusively on understanding and quantifying biogas benefits inWisconsin. However, we acknowledge that important challenges with this technologyrequirecarefulconsiderationbypolicymakersandothersinterestedinanaerobicdigestion.Althoughwedopresentpossiblehurdles tobiogasexpansionandsomeof thesuggestedsolutions identifiedby the stakeholders, this reportdoesnot conduct ananalysis of thesechallenges.Weurge future researchersand interestedpolicymakers tocarefully considerthesechallengesandcostsinlightofthebenefitsthatweassessinthispaper.

7
BIOGASBENEFITSINWISCONSIN
Here we explore the range of benefits and avoided costs, beyond energy production, thatanaerobicdigesterscanoffertoWisconsin.Ourgoal isnottoprovideadefinitiveanswertothe question of what biogas is worth toWisconsin, but rather to jumpstart the discussionamongpolicymakers,researchers,economistsandenergyexperts.WeevaluatefourtypesofbenefitsidentifiedbystakeholdersattheOctober1415,2010WisconsinBioenergyInitiative(WBI)BiogasStakeholderMeetinginMadison,WI:
1. WasteManagement:Protecting Wisconsin’s scenic waterways & drinking water, promoting publichealth, improving property values, and extending the life of municipal wastesystemsby:
• OfferingLIVESTOCKoperatorsopportunitiesfornutrientmanagement,odorcontrol,pathogenreduction,&weed‐seedreduction
• OfferingFOODPROCESSINGoperationsopportunitiesforsolid&liquidwastemanagement,&odorcontrol;
2. EnergyIndependence:
Reducing reliance on fossil fuel imports by supporting a versatile, predictable,andstorableWisconsin‐madeenergysource;
3. AdditionalEconomicOpportunities:• Offeringnewincomesourcesand/oravoidedcostsfordairyproducersthat
utilizedigestedsolidsforanimalbeddingand/orfertilizer• CreatinganewindustryinWisconsin• Capitalizingonthepotentialforlinkingwithemergingcarbonmarkets
4. Greenhousegasemissionsreductions:Providingaclean,sustainablefutureforgenerationsofWisconsinites.

8
Benefit1:WASTEMANAGEMENT
KeyPoints
DAIRYFARMWASTEANDNUTRIENTMANAGEMENTWisconsindairyfarmersspend$48.5millionayearonmanuremanagement.Anaerobicdigestionhasthecapacitytoimprovemanuremanagementbymitigating:
• NutrientLoading:Anaerobicdigestioncanmitigatenutrientloadingby(1) Convertingnitrogen&phosphoroustoformseasilyabsorbedby
terrestrialplants.(2) Reducingthevolumeofmanureproducedthroughevaporativeloss.(3) Usingpost‐digestionsolid‐liquidseparationtoretainphosphorousin
thesolidwasteandnitrogenintheliquidpotion.(4) Usingotherpost‐digestiontechnologiestomaximizephosphorous
extraction.• Odor:Odorreductionsofferedbyanaerobicdigestioncouldincreaserural
propertyvalueswhilereducingodorcomplaints.• WeedSeeds:Anaerobicdigestionreducesweed‐seedcontent,butnotmorethan
othertreatments.• Pathogens:Reducingpathogen‐loadsinmanureviaanaerobicdigestionhasthe
potentialto:(1) Reducehealth‐carecostsassociatedwithwater‐&food‐borneillness.(2) Increasestateparkrevenuesbyreducingbeach‐dayadvisories.(3) ReducestrainonWisconsin’sagingmunicipalwaterfacilities.
FOODPROCESSINGWASTEANDNUTRIENTMANAGEMENTFoodprocessingplantsproducelargevolumesofliquidandsolidwaste.Aerobicwastetreatmentisenergyintensiveandthusveryexpensive.Onsiteanaerobicwastetreatmentofferstheindustry:
• Thelowestcostoptionforwastewatertreatmentformanysystems.• Adecreaseinwastewaterstrength(BOD)byabout90%withoutexternalinput
ofenergy.• Potentialsavingofover$500,000peryearforarepresentativefacilitycompared
totreatmentatthemunicipalwastewatertreatmentplant.• Reductionsinthecostoflandfilltippingfeesbyreducingsolidwastevolume.• Aneffectivetoolforreducingodoremissionsfromwastetreatmentand/or
disposal(analysispresentedin‘DairyFarm’section).

9
ResearchPriorities
• Identifydigesterdesigns&operationalpracticeswhichoptimize:o Nitrogen&phosphorousnutrientconversion.o Phosphorousretentioninthesolidsandnitrogenintheliquidportion.o Manurevolumereductions.o Pathogenreductions.o Weed‐seedreductions.
• Createastandardizedpathogenmonitoringsystemforanaerobicdigesterswitharecommendedsetofindicatorsthatcanbeassessedwithrapid,moleculardiagnostics.
• Quantifythecapitalcostsofinvestinginon‐siteanaerobictreatmenttechnologyatfoodprocessingplants.
• Explorealternativefeedstocks,includingblendingfoodprocessingwastesteamswithoff‐sitewastesourcesandthepotentialofco‐locatingagriculturalandfoodprocessingdigestersystems.
• Combinetheoreticalandempiricalapproachestobetterestimateoptimalconditionsforanaerobicmicrobialcommunitiesfordecomposingwastestreamsandmaximizingmethaneoutput.
• Identifythebestopportunitiesforinstallationofanaerobicsystems.• Developpoliciesand/orincentivesfortheadoptionofanaerobictreatmentbest
managementpractices,bothfromenvironmentalandenergycostsavingperspectives.

10
1.DairyFarmWasteandNutrientManagement
NitrogenandPhosphorousLoading:AWisconsinChallengeInWisconsin,dairyfarmersspend$48.5millionannuallyonmanuremanagement.Manuremanagement influences the nutrient levels in soils, adjacent surface waterways, andgroundwater reservoirs. Increased nutrient loads from land‐application of manure hasresulted in degraded water quality in Wisconsin’s scenic waterways, causingeutrophication of lakes from increased phosphorous, decreased dissolved oxygenconcentration from organic compounds, and contamination of groundwater from nitrateandnitrite. InWisconsin,172 lakesare listedbytheDNRaspollutedbyphosphorous.8, 9Cost‐effective strategies to reduce nutrient inputs towaterwayswill improve ecosystemservicesandhelplocalandregionaleconomiesthatdependonrecreationalactivities.From2000‐2007, theWisconsinDNR issuedover 1.3million angler permits, corresponding tonearly$17milliondollarsinrevenue.10Hypoxicconditionscreatedbynutrient‐richwatersposeathreattoWisconsin’sfishingindustry.Theimplementationofanaerobicdigestionondairy farms in Wisconsin can be the integral part of an effective nutrient managementprogramthatmitigatesthenegativeeffectsofnutrientsonourwaterways.Toprotectwatersourcesaspromulgatedunder theCleanWaterAct, alldairyproducersneed to comply with the Natural Resource Conservation Service Nutrient ManagementStandard (590) that limits liquid manure application rates in surface water qualitymanagementareas.Additionalsolidandliquidmanurewinterapplicationrestrictionsareoutlined in Wisconsin’s DNR regulations on Animal Feeding Operations (WI NR 243).Farmers are required to calculate the amount of nitrogen and phosphorous that can beapplied to the landeachyearbaseduponsite‐specificparameters.11‐15TheDNRhasalsoimposedphosphorousbansincertainregionsinordertoprotectwaterquality,particularlyinrecreationalwaterssuchastheYaharaandFoxValleyWatersheds.Regionalcalculationsfor phosphorous budgets have been published for specific lakes and selectedWisconsinareas.16,17
Estimatingthe“Cost”ofPhosphorousinWisconsinPilot studiesofpotential nutrient credit tradingprograms in theLowerFoxRiverValleyBasin of Wisconsin have tried to estimate the cost of preventing watershed‐levelphosphorous contamination.18 The researchers from these studies concluded that theoptimalphosphorousmanagement strategy—thestrategy thatwouldsuccessfully reducenon‐point source run‐off to levels specified in the watershed’s published phosphorousbudget—could cost non‐point sources up to $138 per year to prevent one kilogram ofphosphorousfromenteringthewatershed.Understandinghowmuchphosphorousrun‐offcanbeattributed to a typicaldairyoperation is a sensitive andhighly contentious issue.Dairyproducermanuremanagement strategiesvarywidely, and farm‐levelphosphorouscontributions are a direct result of farm‐level practices. Rough estimates based onempiricalsitestudiessuggestthatdairyfarmscouldcontribute1‐3kgofphosphorousperacre. Using these rough estimates, we suggest that the “real” value of phosphorouspollutiononWisconsinfarmscouldbesomewherebetween$138and$414peracre.

11
AnaerobicDigestion:AWisconsinNutrientManagementSolutionAnaerobic digestion can mitigate dairy farm nutrient loading in four ways. First, thedigestion process converts nitrogen and phosphorous into forms that are more readilyavailable for terrestrialplantuptake therebyminimizingtheportionthatcomprisesnon‐point source discharge and enters water bodies as runoff. Second, anaerobic digestionsignificantly reduces the volume of manure produced through evaporative loss. Third,whenusedinconjunctionwithsolid‐liquidseparationsystems,anaerobicdigestionretainsmore phosphorous in the solid digestate, simplifying phosphorous handling. Finally,anaerobicdigestionallowsfortheuseofpost‐digestiontechnologythatimproveseffluentphosphorus management. Taken together, these processes allow for easier and moreeffectiveon‐farmnutrientmanagement.Anaerobic digestion does not change the totalmass of nitrogen and phosphorous in themanure, but it does change the chemical form of nitrogen and phosphorous in themanure.19Specificallyanaerobicdigestionconvertsphosphorousintoorthophosphatesandnitrates/nitrites into ammonia.20 Orthophosphates and ammonia are the forms ofphosphorous and nitrogen found in commercial fertilizers. These particular chemicalcompositionsofphosphorousandnitrogenaremorereadilyutilizedbyplants,andrapidplantuptakepreventsthesenutrientsfromleachingintoWisconsin’swaterways.Scientistsstilldebatehowmuchofthenitrogenandphosphorousinmanureisconvertedtobiologicallyavailable formsduringanaerobicdigestion.Wright (2004)estimates that30‐37%ofthenitrogenisconvertedtoammoniawhileorthophosphateincreasesby26%fromthe digestion process. Another study reports orthophosphate conversions of 3‐60%.19 AmorerecentstudyinNewYorkreportsthatmanureammonia‐Nandorthophosphatelevelsincreasebyanaverageof24%and15%,respectively,asaresultofanaerobicdigestion.21Conversion success is highly dependent upon operational conditions of the digester, themanure composition (animal feed used and substrate additions), and the storage time.Storage time of the digestate can result in a loss of ammonia due to volatilization andreleasedasnitrogengas.19Tofurthercomplicatethisissue,theuseofsubstrateadditionsto increase biogas yieldmay result in large surpluses of potassium and lowphosphorusreturns.22,23Anaerobic digestion also effectively reduces the volume of manure by 22‐62%.19 Thesereductions are caused by evaporative loss during the digestion process, creating highlyconcentrated post‐digestate slurry. Although evaporative loss does not result in anychangestothetotalnutrientcontentofmanure,itdoesmaketheeffluenteasiertohandleon‐farmbyreducingstrainonmanurelagoons.Post‐digestion technology can make this reduced volume of effluent even moremanageable. Anaerobic digesters can be easily coupled with a solid‐liquid separator.Phosphorous is largely captured in the solidwaste,while nitrogen remains in the liquidportion. A comprehensive study conducted on six farms in Wisconsin that employanaerobic digestion reported that anaerobic digestion successfully stabilized 70‐80% ofphosphorousinthesolidwaste.20

12
Finally, new technology can be incorporated into anaerobic digesters to precipitate thephosphorous in various forms (an example is theOstaraprocess toproduce struvite – aphosphorous‐rich precipitate or crystal of magnesium ammonium phosphate). In thesesystems,phosphorousiscapturedinapelletformthatpreventsitfrombeingdischargedintheplanteffluentandmakesaproductsuitableforsaleasfertilizer.24Astruviterecoverysystem is planned for the Dane County community digester project, as Dane County isespeciallyconcernedwithphosphorousloadinginitswaterways.25
IntegratingAnaerobicDigestionintoExistingNutrientManagementToolsAlthough anaerobic digestion is mentioned as a best management practice in some ofmanuremanagement guidelines produced by theDNR and other agencies,more explicitrecognition and quantification of the potential benefits of this technology on nutrientmanagement is neededbeforedairyproducers canbe given clear guidance and support.Integrating incentives for anaerobic digestion into the existing manure managementframeworkholdsgreatpromiseforWisconsin.If the nutrient management benefits derived from anaerobic digestion could beconsistently quantified, they could also be incorporated into existing programs that aredesignedtohelpproducerscreatemanuremanagementplans.Forexample,theWisconsinNatural Resource Conservation Service has certified nutrientmanagement planners thatassistfarmersindeterminingtheamountofnutrientsthatcanbeappliedtothelandbaseduponcropplans,previouspractices,andapplicableregulations.11Theseplannerscouldbetrainedtoincludeanaerobicdigestercalculationsaspartoftheirassessments.In addition, the University of Wisconsin offers The Wisconsin Nutrient ManagementsoftwareSNAP‐Plusthat integratesthecurrentregulationsintothenutrientmanagementplan andestimatesoutputs of nutrientby farm fields. Each farmhas toprovide a yearlyplan and state how their current practices, such as the manure storage structures,barnyard, biogas, and timing for spreads, along with manure/soil test and cropmanagement,wouldproviderunoffcontrolstoimprovemanuremanagementandprotectwaterquality.Thisstrategyofferstheadvantageofmanagingnutrientswithinlargetractsof land that might be under the management of one farmer or within a very sensitiveportion of thewatershed. Creating an additional component for the SNAP‐Plus scenariotoolcouldincorporatenutrientmanagementbenefitsofanaerobicdigestion.Finally, anaerobic digestion can be integrated into new approaches for nutrientmanagement focus on watershed management nutrient‐trading schemes. In thesestrategies,a“totalmaximumdaily load(TMDL)”representinga levelofphosphorousandothernutrientsthatarepermissibletobedischargedinthewatershed,isestablishedbasedupon thesoil characteristics, topography,andhydrological conditionsofeachwatershed.Phosphorouscreditsarethenestablishedandallocatedtofarms,municipalities,andotherpointandnon‐pointsourcesofphosphorouspollution.Thesecreditscanbetradedinthemarketplace,providing financial incentives forbestmanagementpractices thatminimizenutrient additions. Additional credits for anaerobic digester installation could beincorporatedintosuchprograms.

13
Awatershed‐basedpollutanttradingpilot‐studywasinitiatedinWisconsinin1998fortheRedCedarRiver,LowerFoxRiver/GreenBay,andRockRiverValleys.Anaerobicdigestionwas not considered as a bestmanagement practice for credit trading purposes.9 Futurenutrientcredit tradingstrategicplansshouldconsider thepotential impactsofanaerobicdigestiononmitigatingphosphorousrelease.
OdorReductionsAnaerobic digesters offer significant opportunities for odor reductions on farms, animportant benefit for neighboring communities. Noxious odor emissions from livestockwaste are a result of sulfides (H2S) from sulfate‐reducing bacteria, the conversion oforganicnitrogentoammonia,andvolatileorganiccompounds(VOCs)fromtheincompletedecompositionofotherorganicsubstances.InastudyinOhio,92%ofthoselivingnearand79%ofthoselivingfarfromlarge‐scaledairyoperationsidentifiedtheodorofmanureasaconcern.26 Between 1998 and 2007, more than 1,289 complaints associated withagriculture operationswere recorded in the state ofMichigan alone. Over 75% of thesewere associated with odor and surface water. In this study, even farms employingcommonlyacceptedbestmanagementpracticesformanurehandlingwereoftensourcesofodor complaints.27 This highlights a limitation of current approaches to on‐farm bestmanagementpracticesformanure.Many dairy producers wish to limit odors in order to be better neighbors. John Pagel,ownerofPagel’sPonderosaDairy,afarminKewauneewithanon‐farmdigester,expressesthissentiment:
It’shard toput a valueonnearly eliminatingodor.Whenwedecided tohouse somanycowsinonelocation,itwasourresponsibilitytomakesurewe’dstillbegoodneighbors.Wehave hadno complaints fromneighbors and they love thatwe aremakingrenewableenergy28…Infact,themostimportantbenefitofadigestermaybeodorreduction.29
Odor reduction is also frequently cited by food processing plants as a motivation forinstallinganaerobicwastetreatmenttechnology.7,30,31Odoremissionsfromthetreatmentanddisposalof foodwastecanbesignificant,negativelyaffectingcommunitiesnear foodprocessingplants. Comparedtootherwastetreatmenttechniques,anaerobicdigestionismore effective at controlling odor emissions.5While the analysis below focuses on odorreductionusing anaerobic digestion for livestock operations, it is also applicable to foodprocessingfacilities.BestmanagementpracticesCurrently, awide‐range ofmethods andmanagement practices are employed to addressodor issues. The Wisconsin Department of Agriculture Trade and Consumer Protection(DATCP)andDepartmentofNaturalResources(DNR)evaluatedtheabilityoffouron‐farmbest management practices to reduce odors: anaerobic digestion, permeable covers,impermeable covers, and solid separation/aeration treatment.32 Each management

14
strategy decreased odor emissions when operated correctly; however only theimpermeablecoversreducedodoremissionsalmostentirely.Evaluationof theanaerobicdigestion was based upon the odors coming from digested manure stored in an openlocation. Partially digested manure can result in increased odorous emissions, butoptimizedoperationalconditionsthatensurecompletedigestionwillreducethisconcern.It is important to note that, unequivocally, anaerobic digestion will decrease manurehydrogensulfidecontent—amajorcomponentofodoremissions—butbaseduponsystemdesign (mesophilic vs. thermophilic) ammonia emissions—another source of unwantedodors—may either increase or decrease. Anaerobic digesters typically include animpermeable cover as part of the gas collection system. Digested solids that are storedunderanimpermeablecoverwillprovideaddedreductioninodorsasmoisturecontentisminimized and eliminate the ensuing bacterial growth of the nuisance microbesresponsiblefornoxiousemissions.Other odor reducing strategies thatwerenot included in theDATCP study are currentlybeing used in Wisconsin. These include biofilters (emissions are collected and routedthrough a tank filled with peat, promoting the removal of the noxious odor), chemicaladditivesthatattempttoreducethemicrobesresponsibleforodors,aswellasotherodorsource reduction techniques. According to Wisconsin’s DATCP regulation on Siting ofFeedlotOperations(WIATCPRule51),thereareseveralmanagementstrategies listedtoreduce the impact of odor emissions from livestockoperations.Thesepractices focusonthe reduction of emissions from the housing of the animals (diet changes, frequency ofcleaning manure stalls, etc), lot operations (moisture control, windbreaks), and storagefacilitydesigns(covered,anaerobicdigestion,composting).Inestablishingspecificactionswithin the required odormanagement plan, an odor index is established by consideringfactors such as typical wind patterns, development density, distance to the nearestneighbor(thosewithin1300feet),andthecontrol/managementpracticesintegratedintocurrentorfutureoperationsasoutlinedabove.MethodstoquantifyodoremissionsOdors can be measured using olfactometry measurements, recording annoyances(complaints), and sophisticated analytical air measurements to identify known odorgenerating compounds. Olfactometry measurements rely upon trained analysts thatsubjectivelycategorizetheintensityofanodorthatisstatisticallytranslatedintoanodorindexvalue(ODI).Sophisticatedairsamplingthatusesgaschromatography(GC)todetectcommonodorantscanbeverycostly.Incorporatingthesemethodshasresultedinseveralapproachesthatcanbeusedtoquantifytheimpactoflivestockoperationodoremissionsuponthequalityoflifeforneighbors.Twomethods,theOFFSETToolandthehedonicpricemodel, offer policymakers opportunities to quantify the reduction of odors by anaerobicdigesters.
OFFSETToolThe University of Minnesota Extension consolidated empirical results from studies ofdifferentmanagementpracticesandtheirimpactonodorreductiononover200livestockfarms(dairy,swine,beef,andpoultry)tocreatetheOFFSET(OdorFromFeedlotsSetbackEstimation)tool.33Thismodelenableslivestockproducerstoestimatetheirodoremissions

15
and is similar to theworksheet required in theWIATCPRule51applicationprocess forlivestockoperations.Inorder toquantify thebenefitofodorreduction, theOFFSET tool correlatesannoyancereduction with separation distance based upon a total odor emission factor (Figure 3).Better odor management practices and greater distance from the farm result in fewerannoyance complaints. The odor emission factor is based upon livestock operationpractices and technologies employed on‐farm. This strategy suggests that to decreaseannoyance, livestockproducersshould increase thedistance fromthe farmto theclosestneighbor.However,increasedlandusepressurefromsuburbanizationhasresultedinnewsubdivisions in closer proximity to farms, making reliance upon setback distance tomitigatetheeffectofnoxiousodoremissionsmorechallenging.
Figure3. TheUniversityofMinnesotaOFFSETAnnoyanceReductionSetbackTool. Thisfigure shows thatbetterodormanagementpractices andgreaterdistance from the farmresultinfewannoyancecomplaints.Source:http://www.extension.umn.edu/distribution/livestocksystems/images/7680chart.gifHedonicPriceModel(HPM)Thereareseveralstudies thatcombineGISdatawithahedonicpricemodel tostudy theimpact of proximity to feedlot operations upon residential real estate values. A hedonicprice model attempts to explain the selling price of a house in terms of its physicalattributesandsurroundingenvironmentbyevaluatingfactorssuchasthelotsize,squarefeetoflivingarea,ageofthehouse,numberofbathrooms,distancetothenearestpark,andproximity to agricultural operations. The impact of agricultural operations is usuallyexpressed as the density of animals divided by the distance from the operation. In onestudy conducted in North Carolina, proximity to hog operations that were not usingoptimalodormitigationstrategiesresultedina3‐4%decreaseinpropertyvalueforhomesthatwerelocated800‐meters(approximatelyahalf‐mile)away.34Insuburbanandurban

16
areas,othershavereportedthatincreasedproximitytolivestockoperationscandecreasepropertyvaluesbyasmuchasthirtypercent.35Areductioninresidentialpropertyvaluescan have wide ranging economic impacts including decreases in taxable revenue at thecounty‐level.36AconservativeestimateofwhatodorreductionscouldmeanforWisconsinpropertyvaluesdemonstrateshowfinanciallysignificantthisbenefitcouldbeforthestate.Accordingtothe2000census,about1.5millionpeopleresideinruralareasinWisconsin.Letusassumethat5% of these people are affected by livestock odor, and that the average size of a ruralhouseholdinWisconsinis3persons.IfweassumetheaveragevalueofhomeinWisconsinis worth $100,000, we can quickly calculate that the total value of homes affected bylivestockodorsissomewherearound$2.5billiondollars:
1.5millionpeople*5%affected÷3personsperhousehold*$100,000perhouse=$2.5billion
Ifpropertyvalues increasedbyonly4%inresponsetoreductions inoffensiveodors, thecumulativevalueofthesehomeswouldincreaseby$100million.
ScenarioAnalysisThereare three recommendedapproaches toquantifying the co‐benefitsassociatedwithodoremissionreductions.Theseapproachesincludemonitoringthenumberofcomplaintsfromaspecifiedfarmovertime,olfactometrymeasurements(detectedodoremissionsasafunctionofthedistancefromtheanimaloperation),andpropertyvalues.Baseduponthedataavailableinthisstudy,theOFFSETtoolwasappliedtoeachscenario.Inthisanalysis,an odor emission factor with and without anaerobic digestion was calculated for eachoperation (Table1).The setbackdistance, reported inmiles,was then calculated for theoperationalconditionswithandwithoutanimpermeablecover.Valuesfor91%and99%annoyance reductionswere included. For the industrial foodprocessor, a concrete tankwasassumed in theOFFSETmodel. Introducinganaerobicdigestionresults ina100‐folddecrease in odor emissions. In general, this magnitude of odor reductions means thatneighborscouldliveroughlyfourtimesclosertofarmswithoutexperiencinganincreaseinodordistress.Table1.OdorEmissionAnalysisWithandWithoutAnaerobicDigestion(AD)
91%AnnoyanceFree 99%AnnoyanceFreeScenario
OdorEmissionFactor(AD/withoutAD)
WithAD(miles)
WithoutAD(miles)
WithAD(miles)
WithoutAD(miles)
Avg.Farm(100cows)
8/84 0.04 0.16 0.35 1.15
CAFO(1000cows)
84/840 0.16 0.69 1.15 3.74
FoodProcessor
28/280 0.08 0.34 0.65 2.13

17
WeedReductionAnaerobicdigestiondecreasestheviabilityofcommonweedseedsfoundinrawmanure.37‐39However,reductionsinweedseedviabilityfromanaerobicdigestionarenotsignificantlygreaterthanreductionsthatwouldoccurunderothermanuremanagementstrategies,suchasdrystorageorcomposting.RecentresearchbyCooketal.(2007)suggeststhatmanurespreading onWisconsin corn cropsdidnot result in any additionalweed introduction.40Although a reduction inweed seed viability is certainly ameasurable benefit offered byanaerobicdigestion, themagnitudeof thisbenefitmaynot justifyassigningany financialvaluetothisservicebecauseweedintroductionisnotamajorconcernwithothermanuremanagementstrategies.
PathogenReductionManure containsmanypathogenic ‐ or disease‐causing ‐ bacteria, viruses, andparasites.Anaerobic digestion can reduce, but not eliminate, pathogen loads in manure, therebydeceasing thepotential for thesezoonoticagents toentersoilsandwatersheds.41, 42Thisreduction has the potential to reduce health care costs, avoid revenue lost to beachclosures,andeasethestrainonagingmunicipalwatersystems.Manyofthepathogenspresentinlivestockmanuredonotpresentarisktohumanhealtheitherbecausetheyarebiologicallyunabletoinfecthumanhosts,orbecausetheycannotsurvive long enough in the environment to reach human hosts. The subset of thesepathogens that poses the most common risk to human health is generally the one thatincludes zoonotic, enteric pathogens. These disease‐causing agents are commonlytransmittedbytheoral‐fecalroutebecausetheycansurviveinmoistenvironments.Theyusually infect both human and animal hosts (zoonotic) and they often causegastrointestinaldistress(enteric).Suchpathogenscanenterwaterwaysfromfarmrun‐offfollowingheavyrains,ormayseep intothewatersheddueto landapplicationofmanurewhere they contaminate recreationalwaters and drinkingwater, leading towater‐borneillness.Alternatively, thesepathogensmayenter irrigationwatersused togrow fruitsorvegetablesandcausefood‐borneillnesses.ThemostcommonpathogensassociatedwithlivestockmanurethatposearisktohumanhealthincludeCryptosporidium,Giardia,Campylobacter,E.coli0157H7,andSalmonella.43‐48 Anaerobic digestion reduces the prevalence of some—but not all—of these commonpathogens, making digested solids and liquids safer for land application (Table 2).41, 42Importantly,thereareseveralemergingpathogensthatarebelievedtobeassociatedwithmanure, such as adenoviruses, hepatitis E, noroviruses,mycobacteria andmicrosporidia.The effects of anaerobic digestion on these organisms are not sufficiently evaluated byscientificliterature,andthepotentialhealtheffectsofreductionsintheirincidencearenotcertain.

18
Table2.PathogenReductionsDuetoAnaerobicDigestion
ReportedReductionduetoAnaerobicDigestion(logunits)
PathogenCategory
PathogenMesophilic Thermophilic
Reference
EscherichiacoliO157:H7 1–2 >4‐log 49,50Salmonellaspp 1–2.23 >4‐log 49,50Campylobacterspp Noimpact >4‐log 49,50Mycobacteriumaviumparatuberculosis
NoData NoData 49,51Bacteria
Listeriamonocytogenes 2.23 NoData 49‐51Cryptosporidiumparvum 4‐log(12weeks) 4‐log(3days) 49ProtozoaGiardialamblia 4‐log(12weeks) 4‐log(3days) 49
Helminths Ascarissuum 0.5–1 2 49Humanpolyomavirus(HPyV)
1log Nostudyfound 52
Norovirus(NV) Increased Nostudyfound 52HumanAdenovirus(HAdV)
1‐1.5log Nostudyfound 52
Enterovirus(EV) 1log Nostudyfound 52
Virus
HepatitusAVirus NotDetected Nostudyfound 52(Therearepathogenscontainedinanimalwastethatmaybepathogenictoanimalsotherthanhumans,andtheseareexcludedfromthistable.)Digesterdesignandoperationstrongly impacts thedegreeofpathogenreduction.Highertemperature thermophilic systems exhibit stronger reductions thanmesophilic systems,andlongerresidencetimesindigestertanksresultinhigherratesofpathogeninhibition.39,41, 53Pathogen survival appears inversely related tomethaneproduction, suggesting thatoptimized systemsmost effectively inhibit pathogens.53 Researchers have proposed thatbothphysicalchanges(e.g.effluentpH,temperature,watercontent)andbiologicalchanges(e.g. resource availability and direct competition with methanogenic microbes) may beresponsibleforthesepatterns.53Because the degree of pathogen reduction is highly dependent on the uniquecharacteristics of each anaerobic digester, site‐specific case studies provide the mostaccurate assessment of pathogen reductions. Although rapid, highly‐sensitive, moleculardiagnosticshavereducedpathogenmonitoringcosts,testingforallpotentialpathogensineverydigesterwouldbeprohibitively expensive. Instead, indicator species thatoften co‐occurwithpathogenscanbeusedtomonitorsystems.Fecalcoliformcountsarearelativelystandard and inexpensive way to estimate pathogen‐loads, although this method is notwithoutitscritics.Tobestassesspathogenreductionsfromanaerobicdigestion,additionalcasestudiessuchas theAgStar/EPAsupportedassessmentof theGordondaledigester inNelsonville, Wisconsin should be pursued. The Gordondale case study reported a 99%reduction in fecal coliform counts aswell asmore than 90% reduction in Streptococcusdensityintheevaluateddigester.54

19
EffectsofReductionsinManurePathogenLoadsforWisconsinHealthcareSavingsBecause gastrointestinal illnesses are often under‐reported ‐ only the most acute andseverecasesmakeittoclinicsorhospitals‐itisdifficulttoestimatethetruecostofillnesscaused by agricultural run‐off. In the past ten years, reported incidences ofwater‐bornedisease inWisconsin affected fewer than 70 individuals annually.55 The vastmajority ofthese cases were caused by ingestion of infected drinking water or exposure in publicswimmingpoolsandwhirlpools.From1995‐2005,Wisconsinannouncedfiveoutbreaksofwaterborne illness due to contamination of public waterways, resulting in no reportedfatalities.55Thesefiveoutbreakswerenotdefinitivelyassociatedwithwatercontaminationfromlivestockmanure.However,documentedcasesofwaterborneillnessassociatedwithrunofffromlivestockmanurearecommon,andresearchsuggeststhatresidentsinareasofhigh livestock densities ‐ especially households thatmainly utilize well water ‐ are at agreaterriskofgastrointestinalsymptoms.43‐48Foodborne illnessoutbreaksare farmorecommonthanwaterborne illnessoutbreaks inWisconsinandaffectapproximately700Wisconsiniteseachyear.55Fatalitiesarerare,anddeterminingthesourceoftheoutbreakcanprovechallenging.Onceagain,gastrointestinalsymptomsaregenerallyunderreported,sothetrue“cost”offoodborneillnessinthestateishardtoestimate.Anaerobicdigestiondoesnotpreventcasesoffoodborneillnesscausedby poor sanitation during food preparation. However, the national spotlight on recentoutbreaks of E. coli in spinach, tomatoes, and other fresh vegetables has highlightedconsumer concerns about food safety that could potentially be addressed by anaerobicdigestion.Theuseofundigestedmanureasfertilizerisfarmorelikelytoresultinpathogencontaminationoffieldcropsthanfullydigestedmanure.38,41,42RecreationalWaterUseRevenueOver14millionvisitorseachyearenjoyWisconsin’snaturalareastocamp,swim,fish,boat,andhunt.Thestatecollectsnearly$66millionayearinfeesfromtheserecreationalusers,whichareinturnusedtosupportoutdoorrecreationactivitiesinthestate.10Between2004and2009,anaverageof76ofWisconsin’s193GreatLakesBeacheshadatleastoneswimadvisoryperseasonbecauseE.coliconcentrationsexceeded235CFU/100mL,makingthewaters less safe for swimmers. Over this same time period, the total number of dailyadvisories posted at Wisconsin’s beaches has ranged from 402‐779 per year. The totalnumberof“beach‐days”inWisconsincanbecalculatedbymultiplyingthetotalnumberofbeachesbythetotalnumberofdaysthebeachesareopeneachyear:
193Wisconsinbeaches*14weekseason*7days/week=18,914beach‐days56Thus,waterqualityadvisoriesaffect2‐4%ofWisconsinbeachdayseachyear.
Weestimatethat2.8millionpeopleareswimminginourlakeseachyearifweassumethat20%ofWisconsin’srecreationalusersvisitstateparkstoswim.Ifwealsoassumethatanaverageof4visitorsarriveineachvehicle,andthateachvehiclepaysabout$7toenterthe

20
park,nearly$5milliondollars in revenueare collected.By these conservativeestimates,beachclosurescouldcostthestate$100,000‐$200,000eachyearinlostadmissionsfees.ReducedStrainonMunicipalDrinkingWaterWisconsin’swastewaterinfrastructureisagingasthestatefacesanincreasingdemandforclean water. The 2007 Drinking Water Infrastructure Needs Survey and Assessmentestimated thatWisconsinwill need nearly $6.2 billion dollars over the next 20 years toinstall,upgrade,orreplaceagingequipmentneededtokeepourdrinkingwatersafe.57Reducingthepathogenandnutrientloadsinourwaterwaysreducesthestrainonexistingsystemstherebyextendingthelifeofthesemunicipalresources.Inaddition,ifinvestmentsinWisconsin’smunicipalwatersuppliesmusthappenanyway,thereisgreatopportunitytoincludeanaerobicdigestersinthesewatertreatmentfacilities.

21
2.FoodProcessingWasteandNutrientManagementSimilarlytohowanaerobicdigestionimprovesmanuremanagementfordairyoperations,itoffersfoodprocessingplantsasuiteofwastemanagementbenefits.Anaerobicdigestionrepresentsalow‐costwastetreatmenttechnologyforthefoodprocessingindustry.Infact,theprimarymotivationofmanyfoodprocessingfacilitiesforinstallinganaerobicdigestersisthecost‐effectivetreatmentofprocessingwaste,withtheenergyfrombiogascitedasasecondary benefit.6, 7, 31 This section presents the economic benefits of using anaerobicdigestiontomanagefoodprocessingwaste.
WastewaterFormostfoodprocessingoperations,wastewateristhewastestreamofgreatestconcern.5Food processing produces high volumes of wastewater because water is used at manystages in the production process (e.g. washing and filtration). For example, the McCainFoodsplant4,apotatoproductsfacilitylocatedinPlover,WI,produces2.3milliongallonsofwastewaterperdayat full capacity.30 In thestateofMichigan, thevolumeofwastewatergeneratedfromprocessingthetop13fruitsandvegetables isover3.4billiongallonsperyearornearly7gallonsperpoundoffoodprocessed.58
These process wastewaters contain high concentrations of organic material resulting inhigh biochemical oxygen demand (BOD). BOD, a conventional pollutant in theU.S. CleanWaterAct, isdefinedas theamountofoxygenbacteriawill consumewhiledecomposingtheorganicmatterinwater.Becausebacteriaundernormalconditionsdecomposeorganicmatter using dissolved oxygen, themeasure of the concentration of dissolved oxygen inwaterisconnectedtotheamountoforganicnutrientsinthewater.Thus,themoreorganicwasteinwater,themoreoxygenneededforbacterialdecomposition.AlowBODindicatesgood water quality, while high BOD levels indicate poor water quality. We followconvention in callingwastewaterwith lowBOD levels “low‐strength” and thatwith highBOD values “high‐strength.” Typical BOD levels for a pristine river are approximately 2mg/L(milligramsper liter).5AverageBODvalues forwastewater frompotatoprocessinglikeattheMcCainFoodsfacilityisabout2,000mg/L,athousandtimeshigherthanlevelsforpristinewater.TypicalBODvalues forother foodprocessingwastewaterstreamsareshowninTable3.5
4TheMcCainFoodsplantcurrentlyemploysanaerobictechnologytotreatwastewater.5Obtainedfromhttp://www.ilpi.com/msds/ref/bod.html.

22
Table3.TypicalFoodProcessingWastewaterOrganicLoads
WastewaterSource BOD(mg/L)Brewery 850Dairy 1,000–4,000Fish 500–2,500Fruit 1,200–4,200Meat 1,000–6,500Potatoes 2,000Poultry 500–800Slaughterhouse 1,500–2,500Vegetable 1,000–6,800
To prevent deterioration of water quality, theWisconsin DNR and the U.S. EPA strictlyregulatethedischargeofwastewaterfromall industrialsources.59Wastewaterfromfoodprocessing plants with high BOD values cannot be discharged into natural waterwayswithout treatment. Food processing plants typically send wastewater to the municipaltreatment plants and/or use aerobic techniques to manage waste on‐site. For mostapplications, on‐site anaerobic digestion represents a lower cost option for wastewatertreatmentthanbothoftheseoptions.75
Currently, more than 80% of food processing waste is treated at municipal treatmentplants, either without pretreatment or with partial pretreatment at the food processingplant.5Thecostoftreatingthishighstrengthwastewateratmunicipalplantsispassedonto foodprocessingplants in the formofsewercharges. Inmostareas, sewerchargesarebasedonboththevolumeandstrengthofwastewater.Forexample,sewerfeesfortheCityofLaCrosse,WIarehigherforhigher‐strengthwastewater.60Thestructureofsewerratesinmostmunicipalities inWisconsin is similar to that presented here for La Crosse. ForwastewaterwithBODlevelsbelow250mg/L,thetotalsewerrateisthesumofaquarterlyfixedchargeandaratebasedonthevolumeofwastewater:
Totalrate=FC+(VxVR) (Equation1)FC=Fixedchargeof$13.10permeteringdeviceV=Totalvolumeofwastewater(ft3)VR=Volumeunitprice=$1.07per100ft3
However, for wastewater with BOD levels above 250 mg/L (which is characteristic ofalmostalluntreatedfoodprocessingwastewater), there isanadditional feebasedonthestrengthofwastewater6:
6Typically,thereareotherfeesforhighlevelsoftotalsuspendedsolids,phosphorus,andtotalnitrogeninadditiontothefeeforhighlevelsofBOD.BecauseanaerobicdigestionhasthelargesteffectonBODlevels,thissectiononlyconsiderstheBODsurcharge.

23
Totalrate=FC+(VxVR)+(PBxBR) (Equation2)FC=Fixedchargeof$13.10permeteringdeviceV=Totalvolumeofwastewater(ft3)VR=Volumeunitprice=$1.07per100ft3PB = Pounds of BOD discharged in excess of domestic strength (250 mg/L)
wastewaterBR=BODunitprice=$0.212perpound
Thus, forwastewaterwithhighBOD levels, theadditional feeaddssignificantcost to thetotal sewer rate for the foodprocessingplant.Theuseof on‐site anaerobic treatment topre‐treat wastewater would largely eliminate these additional costs. While anaerobicdigestion does not significantly reduce the volume of wastewater, anaerobic treatmentdoessignificantlyreducewastewaterBOD.Withanaerobicdigestionofwastewater,morethan90%of theorganicwaste isconverted tomethanegas,decreasingwastewaterBODlevelsbymore than90%.5Therefore, forapotatoprocessor like theMcCainFoodsplantwithtypicalwastewaterBODlevelsof2,000mg/L,anaerobicdigestionwouldreduceBODlevelsto200mg/L,whicharelowenoughtoeliminatetheadditionalfeeforhigh‐strengthwasteinthesewerrate.ApplyingtheLaCrossesewerchargestructuretotheMcCainFoodplant example shows that this type of high‐strength surcharge can significantly increasetotal sewer charges. Assuming this kind of sewer charge structure, eliminating the high‐strengthsurchargethroughwastewatertreatmentwithanaerobicdigestiondecreasestheyearlytotalsewerchargeby31%andsavesover$500,000peryear(Table4).Asaresultofthese potential costs reductions from anaerobic treatment, and because manymunicipalities are planning sewer rate increases in the future, more food processingfacilities are considering on‐site anaerobic digestion to pre‐treat wastewater.5 Digestercapital costsarehighlyvariabledependingon thespecificcharacteristicsofeachsystem,makingageneralsystemcostdifficulttodetermine.Thecostsofinstallingsuchsystemsarenotestimatedhere,andarenotaccountedforinthecostsavingspresented.Table4.SewerChargeComparisonWithandWithoutAnaerobicDigestion(AD)
WithoutAD WithADBODlevel(mg/L) 2,000 200Wastewatervolume(milliongallons/yr)
839.5 839.5
TotalBOD(lb/yr) 2,882,921 288,292ExcessBOD(lb/yr) 2,522,555 0YearlyVolumeCharge $1,200,804 $1,200,804YearlyHigh‐strengthSurcharge(HSS)
$534,782 $0
YearlyTotalSewerCharge $1,735,586 $1,200,804

24
In addition to generating cost reductions from lower sewer charges, anaerobic digestioncan reduce the cost of wastewater treatment relative to the cost associated with usingaerobic techniques. Aerobic treatment, like anaerobic digestion, is a form of biologicalwaste treatment.While anaerobic processes involvemicrobial decomposition of organicwaste in the absence of oxygen, the microbes in aerobic process require oxygen todecompose organic matter. Although aerobic treatment is typically as effective asanaerobic treatmentat reducingBOD levels inmanywastewaters, this typeof treatmenthastwomaindisadvantageswiththehigh‐strengthwastewatertypicaloffoodprocessingoperations. First, because aerobic techniques require oxygen to be added to the water,aerobic treatmentof largevolumesofhigh‐BODwastewater isveryenergy intensiveandvery expensive.5, 58, 61 Second, significant quantities of solid waste are generated fromaerobictreatmentofwastewater,andthedisposalofthesesolidscansignificantlyincreasetheoverallcostofwastewatertreatment.5,30,61Becauseanaerobictreatmentismuchlessenergyintensivethanaerobictechniquesandgeneratessmallerquantitiesofsolidwaste,itrepresentsasignificantlymorecost‐effectivewaytotreatwastewateron‐site.
For food processors that send all their untreated wastewater to municipal treatmentplants,anaerobicdigestersoffercostreductionsbysignificantlyreducingtheBODcontentof wastewater and eliminating the high‐strength sewer charges. Likewise, for foodprocessorsthatarepartiallyorfullytreatingwastewateron‐siteusingaerobictreatment,anaerobic digesters represent a much more cost‐effective technique of reducingwastewater BOD than aerobic treatments. Whether food processing facilities choose tofully treat wastewater on‐site or only partially treat wastewater and send the lower‐strengthwatertoamunicipaltreatmentplant,employinganaerobicdigestionwillinmostcasesreducetheiroveralltreatmentcosts.
SolidWasteIn addition to producing wastewater, many food processing operations also producesignificant amounts of solid waste. Some examples of solid waste from food processingincludespentgrainsfrombreweries,cropresidualssuchasfruitpitsorskins,andrumencontents (partiallydigested feed instomach) frommeatprocessing.6, 61Thesewastesaretypicallydisposedof in landfills,resulting inadditionalcosts forprocessingplantsduetothedisposal,or tipping, fees. Inaddition,anysolidwasteresulting fromaerobicorotherwastewater treatment techniques is generally sent to landfills, resulting in additionaltippingfees.5Asof2009,theaveragetippingfeeforlandfillsinWisconsinwas$50pertonof solid waste, and the tipping fees for Wisconsin are slightly higher than in mostsurroundingstates.62However, it isdifficulttodeterminetheaveragelandfilltippingfeespaidbyfoodprocessingplantsbecausemanyindustrialcustomershaveprivatecontractswithlandfillsandreceivevolumediscountpricing.62
Anaerobicdigestioncanreducethecostsoflandfilltippingfeesbyreducingthevolumeofthewastetobehandled.39,63Therefore,usinganaerobicdigestiontoprocesssolidwastesfromfoodprocessingwilldecreasesolidwastedisposalcosts.Inthepast,onlywastewithless than 50% solids content was considered for anaerobic digestion.6 However, newdigesterdesignssuchasdrydigestersareexpandingthetypesofwastethatcanbetreated

25
with anaerobic technology.64 As such, installing an anaerobic digester on‐site at a foodprocessing plant creates the possibility of blending food processing wastewater and/orsolid waste with off‐site waste sources such as livestock manure. In addition to theincreasedbiogasyieldfromadditionalsubstrates,thefoodprocessingplantwouldreceiveadditionalrevenue(tippingfees)foracceptingtheadditionalwastestream.6,58

26
Benefit2:ENERGYINDEPENDENCE
KeyPoints
• Wisconsinsendsover$18billiondollarsout‐of‐statetopayforenergy.• Unlikeotherformsofrenewableenergy,biogasisversatile,predictable,and
storable.• Currenton‐farmbiogassystems‐operatingatcapacity‐couldoffset$2.2
millionofcoal.• Ifthesesystemsupgradedbiogasforthepipeline,theycouldoffset$15
millionofnaturalgas.• AllofthemanureinWisconsin,ifdigested,representsthesameenergy
potentialas$185millionofnaturalgas.• Biogasutilizedincombinedheatandpowersystemscouldsaveevenmore
moneythatwouldbespentout‐of‐statetopurchaseenergy.
ResearchPriorities
• InvestigatewhetherWisconsin’snaturalgasinfrastructurecanaccommodaterenewablenaturalgas.
• Estimatehowmuchofthestate’stransportationfuelcostscouldbeoffsetbybiogas.
• Quantifytheamountofcoalornaturalgaspotentiallyoffsetbybiogasfromfoodprocessors.
• Definetheenergysavingsofferedbycombinedheatandpower.• Analyzethecostsandbenefitsofbiogasasabase‐loadorpeak‐loadsourceof
energy.

27
Wisconsin’sEnergySpendingWisconsin lacks any domestic sources of coal, oil, or natural gas, making the statecompletely dependent upon imports to meet fossil fuel needs. This situation makeshomegrown,distributedenergysourcessuchasbiogasattractivetosupportersofenergyindependence. BecauseWisconsin’s current electrical generation capacity exceeds actualdemandinthestate,advocatesforahomegrownsystemofclean,renewableenergyhavebeen challenged to justify additional investments in the state’s alreadyover‐built energyinfrastructure.Thestatethereforeneedsaneconomicanalysistobetterassesstheimpactof biogas production onWisconsin’s economy as the economic opportunities offered bybiogasproductionhavenotbeenwellcharacterized.An analysis of the impact of biogas production must begin with the current state ofWisconsin’s energy system. In 2008, Wisconsin sent about $18.6 billion7 to Wyoming,Louisiana,Texas,Oklahoma,Kansas,andCanadatopayforitsfossilfuelenergyneeds.69,70The state spent over $13.1 billion on petroleum, over $4.3 billion on natural gas ($3.9billionforprimaryuseand$0.43billionforelectricitygeneration),andnearly$1.1billionon coal ($0.15 billion for primary use and $0.93 billion for electricity generation).69, 70GiventhattheUSBureauofEconomicAnalysisestimatesthatWisconsin’sgrossdomesticproductisapproximately$244billion,thatmeansthatWisconsinsends7.6centsoneverydollar out of the state just to pay its energy bills. Retaining even a fraction of theseexpenditures could translate into substantial savings forWisconsin.Todate, researchershave not directly quantified how much biogas could save the state on its energyexpenditures.Biogas:Versatile,Predictable,StorableEnergyBiogasoffersanumberofuniqueadvantagesasahomegrownrenewableenergyresource.First,biogas isaversatileenergysource.Whileotherrenewablessuchaswindandsolarareonlyusedforelectricitygeneration,biogascangenerateelectricity,replacenaturalgasasaheatingfuel,orevenbeusedfortransportation.Thus,whileincreaseddeploymentofwindandsolartechnologywouldonlyoffsetelectricitygenerationfromfossilfuels,biogascould offset fossil fuel electricity, natural gas heating, and/or petroleum use fortransportation.
Biogas offers the additional benefit of being a reliable, predictable source of energy.Because renewable resources like wind and solar are highly variable and difficult topredict, integrating largeamountsofwindand solar capacity intoWisconsin’s electricitysystempresentsanumberoftechnologicalandoperationalchallenges.Ontheotherhand,well‐managedbiogas systemsare stable, predictable, andeasily controlled,making themmucheasiertointegrateintotheelectricitygrid.Becauseoftheseattributes,biogascouldbeused tomeet baseline (constant) powerdemand that is currentlymetwith coal‐firedpowerplants.
7Electricityexpenditureswerecalculatedusingelectricityutilityaveragefuelcostsfor2008($1.90perMMBtuforcoal,$9.97perMMBtufornaturalgas)fromtheOfficeofEnergyIndependence.

28
Alternatively, with technologies such as floating/flexible digester roofs, biogas can bestored for short periods of time (hours to days) and be used to meet peak electricitydemand.Becauseofitsversatility,predictability,andstoragecapacity,biogascomplementsbothexistingenergyresourcesandotherrenewabletechnologies.BiogasEnergyContributionIf all theon‐farmbiogas currentlyproduced inWisconsinwere tobeused forelectricitygeneration, howmuch coal could this offset?According the 2009WisconsinAgriculturalBiogasCasebook,thecurrentinstalledcapacityofon‐farmbiogasproductioninWisconsinis approximately 11.6megawatts.71 If all of these biogas systemswere to operate at fullcapacity (24 hours a day) for one year, they could theoretically generate about 102,000MWh of electricity. If the fuel cost for onemillion BTUs of coal forWisconsin’s electricutilities is $1.90, andwe assume a 30% efficiency for converting coal energy content toelectricity(typicalforcoal‐firedpowerplants),thentheelectricitypotentialofWisconsin’son‐farmanaerobicdigesterswouldoffsetnearly$2.2millioninout‐of‐statecoalpurchaseseachyear.72
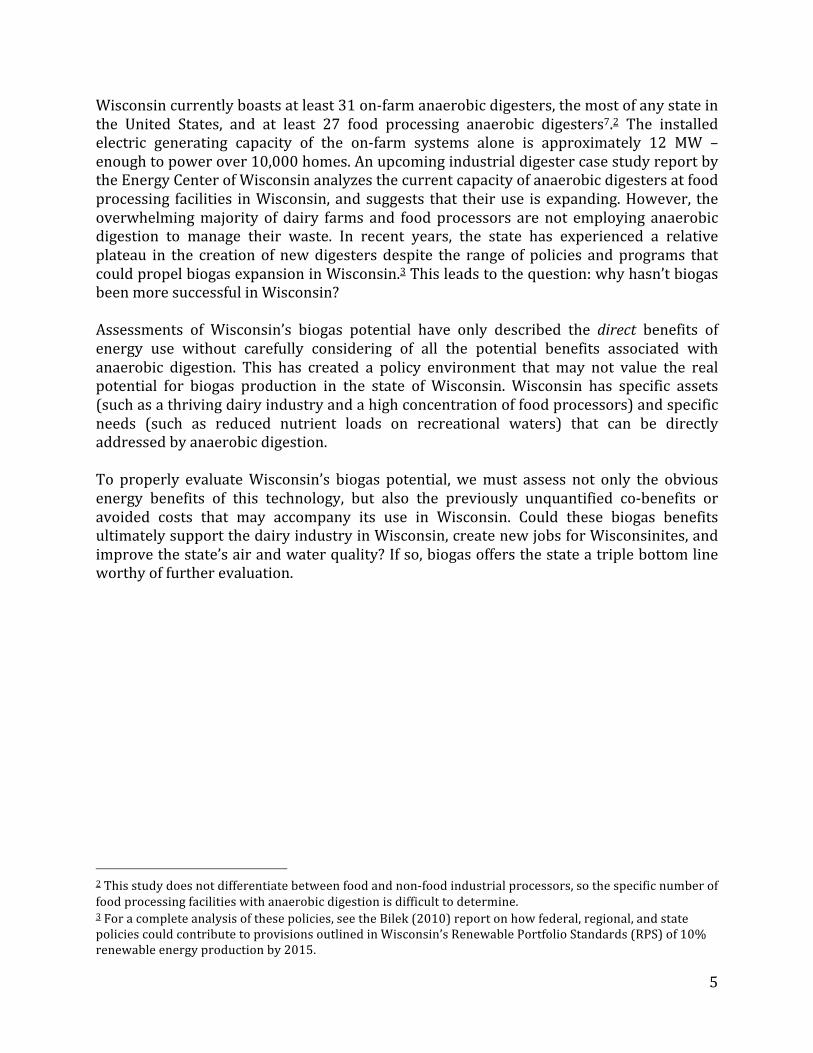
Whatifweusedallofthisbiogasinsteadasasourceofrenewablenaturalgas?Asof2009,the22dairyfarmswithbiogassystemscurrentlyoperatinginWisconsinprocessroughly1,275,000gallonsofmanureaday,orover1.84milliontonsperyear.71Approximately43cubicmeters of biogas canbe generatedper tonofmanure,meaning that these systemscouldpotentiallygeneratealmost2,825millioncubicfeetofbiogaseachyear.73Assumingthatonehalfof thisgascouldberecoveredasmethaneandupgradedtopipelinequalitygas,Wisconsin’s on‐farmbiogas systems could theoretically produce 1,400million cubicfeetofgas,or0.35%oftheannual400,580millioncubicfeetofgaspurchasedfromotherstates each year.72 Although 0.35%might not seem like much, consider that Wisconsinspendsover$4.3billioneachyearonimportingnaturalgas.69A0.35%reductioninthatbillwouldrepresentover$15millionofrevenueretainedwithinWisconsin’sborders.Bythesecalculations, the 23million tons ofmanure2 produced each year from all ofWisconsin’sdairy farms could produce nearly 4.4% of the state’s natural gas needs and represent a$185millionunder‐utilizedopportunity.ScenarioAnalysisOther digester feedstocks available inWisconsin, such as food processingwaste or cropstover, could substantially increase the fossil fuel offset potential of biogas in the state.Utilizing thepotentialofcombinedheatandpowerwouldonly furtheroffsetout‐of‐statefossilfuelconsumptionbyreplacingothersourcesofheatgenerationwiththe“waste”heatfrom biogas combustion. In the scenario analysis below (Table 5), we calculate thepotentialcoalandnaturaloffsetofcombinedheatandpower(CHP)generationofbiogas.This analysis was conducted using the RETScreen® International Clean Energy ProjectAnalysissoftware(Version4,2010).Thismodelingsoftwareisafree,publicallyavailabledecision support tool developed with the contribution of numerous experts fromgovernment,industry,andacademia.8
8Moreinformationcanbefoundathttp://www.retscreen.net/ang/home.php.
29
Table5.PotentialCoalandNaturalGasOffsetsfromAnaerobicDigestion(AD) Avg.Farm
(100cows)CAFO
(1000cows)Food
ProcessingPlant
PotentialBiogasOutput(m3/yr) 40,000 400,000 2,002,025CHPElectricityGeneration(MWh/yr)
131 1,310 6,560
Coaloffset(MMBtu/yr) 1,490 14,900 74,630Coal(electricity)offset($/yr) $2,832 $28,320 $141,800
CHPHeatGeneration(MWh/yr) 52 520 2,600NaturalGas(heat)offset(MMBtu/yr)
177 1,770 8,874
NaturalGasoffset($/yr) $1,769 $17,690 $88,470

30
Benefit3:ADDITIONALECONOMICOPPORTUNITIES
KeyPoints
• Biogashasbeenlargelyabsentfromdiscussionsabouttherenewableenergyeconomy,butcouldoffernewjobopportunitiesandindustrygrowthinWisconsin.
• Wisconsindairieshavesufferedlossesduetovolatilecommoditypricesandcouldbenefitfromastablesourceofon‐farmincome.
• Theuseofdriedsolidsasbeddingoffersasignificantavoidedcosttodairyproducers.
• Driedsolidscanalsobesoldassoiladditives,creatinganewon‐farmincomestream.
• IftheU.S.engageswithinternationalcarbonmarketsinthefuture,dairyfarmerswithdigesterscouldcreatevaluefromtheirreducedcarbonemissions.
ResearchPriorities
• Quantifypotential“greenjobs”andindustrygrowthcreatedbybiogasexpansion.• Determinewhetherbiogascouldpreventagricultural/dairyjobloss.• Assessthepotentialofbiogasasastablesourceofon‐farmincome.• Determinewhetherbiogascanreducewastemanagementcosts.• Clarifytherelationshipbetweenusingdriedsolidsasbeddingandmastitis
occurrence.• Createimproved,costeffectivetechnologiestoremovemoisturefrombedding.

31
GreenJobsandNewIndustryBecausebiogaskeepstherevenuefromenergyexpendituresinthestateofWisconsin,thegrowingbiogas industryhasthepotential tospureconomicdevelopmentandcreatenewjobs within the state. In the current economic climate, “green” jobs have been widelypromoted as America’s next great economic opportunity. Although the 2010WisconsinCleanEnergyJobsActdidnotpass,itdidgenerateaflurryofeconomicanalysisregardingthe impact of green policies on employment. Unfortunately, biogas remains noticeablyabsentfromlargerdiscussionsabouttherenewableenergyeconomy.Existingassessmentsfromprominentadvocacyorganizationsandthink‐tankssuchastheCenteronWisconsinStrategy, The Workforce Alliance, The Apollo Alliance, and the state’s own economicexperts at the Office of Energy Independence have documented the employmentopportunities generated by renewable technologies in general, but have not explicitlystatedwhatbiogashastoofferWisconsin.72,74The analysts for the Governor’s Task Force onGlobalWarming predicted that the CleanEnergyJobsActwouldhavecreatedaminimumof15,000newjobs inWisconsin,mostlywithin the construction and manufacturing sectors.72 Importantly, the state’s economicassessmentonlyincludednewjobsassociatedwithwindandphotovoltaicsystemsanddidnotconsiderthe impactofbiomassorbiogasproduction. Inaddition, theassessmentdidnot account for the economic benefits of expanding Wisconsin’s renewable technologymanufacturingbase; that is, it failed to consider thepotential benefits of stimulating thedevelopmentofWisconsin‐ownedcompanies tomanufactureproducts suchasanaerobicdigestersystemcomponents.72Thus,thespecificeconomicbenefitsofbiogasinWisconsinhavenotbeencarefullyconsidered.Analysis of green jobs should consider not only biogas’s potential to stimulate thedevelopment of new manufacturing and construction jobs, but also the support biogasoffers to Wisconsin’s dairy industry. Due to rising production costs and fluctuatingcommodityprices,manyofWisconsin’sdairyfarmsarestrugglingtostayafloat.ThemostrecentWisconsin Agricultural Statistics Service (WASS) Dairy Producer Survey revealedthat one‐quarter of all dairy producers in the state plan to discontinue their operationswithin fiveyears.Over40%of respondents indicated that theyareunable tomeetbasicliving expenses, and 92% of farms reported decreasing the number of paidworkers ontheirfarms.75ThiscrisisinAmerica’sDairylandservesasanimportantreminderthatanyserious analysis of biogas in Wisconsin must take into account the potential economicbenefits for Wisconsin’s dairy farmers. Could biogas systems offer an additional, stablesourceofincomefordairyfarmsthatisnotsubjecttofluctuatingcommodityprices?Doesit significantly reducemanuremanagementcosts?Mightbiogaspreventorhelp limit joblossinthestate’sagriculturalsector?The world leader in biogas production, Germany, has demonstrated that the biogasindustrydoeshavethecapacitytogeneratenewjobs.In2007,Germanyboasted249,000jobs in the renewable energy sector, and 5.4% of those jobswere related to the biogasindustry.76TheGermanFederalMinistryofEconomicsandTechnologyreportsthat11,000personswereemployedinthebiogasindustryasof2009.

32
CoproductsandAvoidedCosts:NewOpportunitiesforDairyProducers?Mostanaerobicdigestionanalysisfocusupontheusesandco‐benefitsassociatedwiththebiogas portion of the process. However, the solid and liquid phase product streams canproduce co‐benefits aswell. ForWisconsin, the primary benefits derive from the use ofsolidsforbeddingandfromuseoftheliquidandsolidportionsforfertilizer.
BeddingThe solid portion of digested manure can be used for application as animal beddingmaterial. Dairy producers can reduce the costs of providing bedding by using driedmanuresolidsasbeddingmaterial,whichhavetheaddedbenefitofincreasedcowcomfort.In Wisconsin, farms that have anaerobic digesters, 20 farms report using the digestedmaterialforbedding,representingasavingsof$7.25percowpermonth.23Ofthesefarms,12 produce enough bedding to sell to other farmers, creating an additional incomestream.23Usingthedigestedsolidson‐farmforbeddingprovidesanaddedoperationalbenefitofnothavingtoseparatesandfromthemanureinputintothedigester.Sandhastheadvantageofbeingavery inertbeddingmaterial;moisturequicklypassesthroughorevaporates fromsand,preventing thecolonizationofpotentialdiseaseorodor‐causingbacteria.However,sandcausesoperationalconditionsofextensiveabrasioninpumpsandisnotremovedintheanaerobicdigestionprocess.Becausethedigestedsolidsarenotinert(likesand),thereareconcernswiththisbeddingmaterialbecomingwet,promotingthegrowthofpathogens,andinducingcasesofmastitis,or udder infection, in cows. This pathway for mastitis is referred to as “environmentalmastitis.”Mastitisrepresentsaseriousconcernfordairyproducers(asanimalswithudderinfectionsmustbetakenoutofproduction)andconstitutesalossofrevenue.Somefarmshave been using digested solidswithout an increasedmastitis occurrence, and it is stillunclear if more intensive management can offset the risks of increased infection.Innovative technological approaches to decreasing the moisture content in the beddingthat include screw presses and drying (use the heat from on‐farm combined heat andpowerprojects)couldhelptominimizetheriskfromthisbedding.77
FertilizerTheliquidandsolidportionsofanimaleffluentcontainimportantnutrientsthatarereadilyavailable as fertilizers – specifically nitrogen as ammonium in the liquid portion andphosphorous in the solid portion. Several studies have been conducted to assess theeffectivenessoftheseportionstoreplacecommerciallymanufacturedfertilizers.InastudyconductedinWestVirginiaonpoultrymanure,thesolidsportionresultedinanincreaseinthe phosphorous content of the soil, but did not produce as much yield as field cropsreceivingmanufacturedfertilizers.Applicationoftheliquidportiontolandwithgrassandvegetablecropsresultedinsimilaryieldstothoseonlandthathadbeenappliedwithotheravailablefertilizers.78

33
Dairy cows excrete approximately 250 lbs N, 55 lbs P2O5 and 120 lbs K2O per year inmanurewhichhasanestimatedannualvalueof$300percow.79Onfarmsthatdonotwishtousethesolidportionforbedding, thedigestedmanuresolidsbeddingcanbesoldasasoil additive for $20 per ton.23 In fact, farmers in Wisconsin paid $465 per ton forcommercially produced Superphosphate (a type of fertilizer) in 2010, suggesting asubstantialmarketformanure‐basedfertilizer.80
ScenarioAnalysisBased on conversationswithWisconsin dairy producers,we estimate that commerciallyavailable organic bedding generally costs of $7.25per cowpermonth.81 In this scenarioanalysis,weevaluatethepotentialavoidedcostofpurchasingcommercialbeddingbyusingdriedmanuresolidsasbedding(Table6).Itisassumedinthisanalysisthattherewouldbenobeddingbenefitincurredbyafoodprocessingplant.
Table6.AvoidedCostsofBeddingPurchasesforAnaerobicDigesters
Scenario DriedManureSolidsBeddingAvoidedCost($perannum)
Avg.Farm(100cows) $8,700CAFO(1000cows) $87,000FoodProcessor N/A
CarbonMarketsandCarbonCreditsAnothereconomicopportunity forbiogasproducers is thepotentialofcarboncredits forgreenhouse gas emission reductions. Under a ‘cap and trade’ system designed to limitemissions, a carbon market is created where economic value (credits) is given togreenhouse gas emissions reductions. These carbon credits can be sold to buyers in themarket,creating incomefortheemissionreducer.Thus,biogasproducerscouldgenerateadditional revenue from the greenhouse gas emissions reductions achieved throughanaerobic digestion. Presently, however, no carbon markets exist in Wisconsin whereproducerscansellcredits;thevoluntaryChicagoClimateExchange9terminatedtradingattheendof2010.ThoughthestateofCaliforniarecentlyinstitutedacapandtradeprogram,andothercarbonmarketssuchastheRegionalGreenhouseGasInitiativeintheNortheastU.S.areintheearlystages,itisunclearwhenamarketforWisconsinproducersmayexist.ThecurrenttradingpriceasofJanuary19,2011forametrictonofCO2eqreductionintheEuropean Union Emissions Trading Scheme (EU ETS)—the world’s largest carbonmarket—was14.50Euros,orabout$19.75US.10Atthiscarbonprice,adairyfarmwith100head of cattle could earn about $10,025 per year from selling carbon credits generated9http://news.nationalgeographic.com/news/news/energy/2010/11/101103‐chicago‐climate‐exchange‐cap‐and‐trade‐election/.10Currenttradingpriceobtainedfromhttp://www.nytimes.com/cwire/2011/01/20/20climatewire‐european‐commission‐halts‐transfers‐of‐carbo‐22394.html.

34
frommanuremethaneemissionreductions(Table7).Seethe‘Benefit4: GreenhouseGasEmissionsReductions’sectionforcalculationdetails. Table7.PotentialCarbonCreditsfromGHGEmissionsReductions
Scenario PotentialCarbonCredits($)Avg.Farm(100cows) $10,025CAFO(1000cows) $100,250FoodProcessor notcalculated

35
Benefit4:GREENHOUSEGASEMISSIONSREDUCTIONS
KeyPoints
• Carbondioxide(CO2),methane(CH4),andnitrousoxide(N20)arethegreenhousegasesofprimaryconcernandhavedifferentwarmingpotentials.
• BoththeenergysectorandagricultureareimportantsourcesofgreenhousegasemissionsinWisconsin.
• Anaerobicdigestioncano 1)reducedirectemissionsfrommanure,o 2)reduceemissionsfromsyntheticfertilizerapplication,ando 3)offsetfossilfuelemissionsthroughbiogasenergyproduction.
• Usingbiogasforcombinedheatandpower(CHP,producingbothelectricityandspaceheat)representsaneffectivewaytomaximizeCO2emissionsreductions.
ResearchPriorities
• ObtainbetterdataonagriculturalgreenhousegasemissionsinWisconsinandtheMidwest.
• ResearchtheagriculturalemissionreductionsachievedbyanaerobicdigestionspecificfortheU.S.andWisconsin.
• Completeafullemissionslife‐cycleassessmentforbiogasenergytobetterquantifytheoffsetoffossilfuelemissions,production.

36
GreenhouseGasEmissionsandSourcesThethreatofglobalclimatechangehasreceivedanunprecedentedamountofattentioninpublicandscientificdiscourse.Causedby increasingemissionsofgreenhousegases fromhumanactivities,climatechange(orglobalwarming)islikelytohaveanegativeimpactonthe environment and human livelihoods in Wisconsin and worldwide. Because of thispotential threat, determining the most effective strategies for reducing greenhouse gasemissions has been a focus of scientific research and public policy debate. Employinganaerobicdigestion inWisconsincansignificantlyreducegreenhousegasemissionsfromthestate’sagriculturalandenergysectors.Greenhouse gas emissions come from a variety of anthropogenic or human sources andrepresentmultiplegases.Fossilfuelcombustionforenergyproducescarbondioxide(CO2),themostprevalentandwell‐knowngreenhousegas.Onaglobalscale, theCO2emissionsfrom the energy sector are the primary driver of climate change and have received themost attention in mitigation strategies. However, agriculture emissions are also animportantcontributortoclimatechange,namelythegreenhousegasesmethane(CH4)andnitrousoxide(N2O).Thesetwogasesaremorepowerfulthancarbondioxideatwarmingthe climate11 and are receiving greater attention in climate mitigation strategies.82Agricultural emissions of methane and nitrous oxide originate from two main sources:livestock and soilmanagement.83Methane is emitted from the digestion process (calledenteric fermentation) of certain livestock, throughanimal belchingor flatulence, and thedecompositionoflivestockmanure.Nitrousoxideisproducedaspartofthenitrogencycleandcanbeemittedfromlivestockmanureorasaresultofcertainnitrogen‐increasingsoilmanagementpracticessuchassyntheticfertilizerapplication.HowAnaerobicDigestionCanReduceEmissionsAnaerobic digestion of livestock manure and food processing waste, with effectivemanagement,canreducegreenhousegasemissionsinthreemainways.First,digestioncansignificantly reducedirect emissionsofmethaneandnitrousoxide fromwaste.Thehighvolumes of manure on dairy farms are typically stored in pits or lagoons. Becauseanaerobic decomposition usually prevails under these conditions, direct methaneemissionsfromthemanureresult.Digestingmanureinaclosedsystempreventsthevastmajorityofthismethanefrombeingemittedtotheatmosphere.84Similarlytoitseffectsonmanureemissions,anaerobicdigestionwouldalsosignificantlyreducemethaneemissionsfromfoodprocessingsolidwastethatisultimatelylandfilledorland‐applied.Furthermore,digestioncandecreasenitrousoxideemissions frommanure,bothwhen inopenstorageand when applied to fields.85 Studies do show that digested manure can emit smallamounts of methane and nitrous oxide depending on digester retention time and other
11 To compare the effects of these greenhouse gases with CO2, the relative scale of ‘global warming potential’ is utilized. Global warming potential is typically expressed as a mass of CO2 equivalence. Methane has a global warming potential of approximately 21, meaning that one molecule of methane is 21 times more powerful than CO2 at warming the planet and contributing to climate change. The global warming potential of nitrous oxide, about 310, is an order of magnitude higher than that of methane. Therefore, a per-ton reduction in methane and/or nitrous oxide emissions will have a much greater effect on mitigating climate change than the same per-ton reduction in CO2 emissions.

37
factors.84 While it is clear that anaerobic digestion of manure can significantly reducemethane and nitrous oxide emissions, few studies have examined these effects in theUnitedStates,makingitdifficulttoquantifythesereductions.
Second,usingdigestedmanureasanorganicfertilizerwillreducenitrousoxideemissionsfrom synthetic fertilizer application. Application of nitrogen‐rich synthetic fertilizers iscitedasamajorsourceofnitrousoxideemissionsfromcroplandsoils,andimprovingsoilnitrogenmanagementcouldsignificantlyreducetheseemissions.83Studiesshowthatfieldapplicationofdigestedmanureresultsinlowernitrousoxideemissionsthanapplicationofsynthetic fertilizers.84 In addition, over‐application of synthetic fertilizers is common inWisconsin, resulting in unnecessarily high soil nitrogen levels and greater nitrous oxideemissions. Use of digested manure in place of synthetic fertilizers would limit over‐application and thus largely eliminate these emissions. Furthermore, theproduction andtransportof synthetic fertilizers isanenergy intensiveprocess, resulting inanestimatedthree pounds of CO2 emissions per pound of nitrogen fertilizer.86 Replacing syntheticfertilizerswith digestedmanurewould help to reduce fertilizer production emissions aswell. For more details on using digested manure as a fertilizer, see the “Fertilizer”subsectioninthe‘Benefit3:AdditionalEconomicOpportunities’section.
Third, thebiogasproduced fromanaerobicdigestion canbeused for energyproduction,thusoffsettingtheCO2emissionsofcarbon‐intensivefossil fuelcombustion.Over82%ofWisconsin’s energy is derived from fossil fuel combustion. Using a renewable energysourcelikebiogastooffsetfossilfuelenergygenerationcouldsignificantlydecreaseenergysector CO2 emissions.70 While the combustion of biogas for electricity, heat, ortransportation does produce CO2 emissions, these emissions are qualitatively differentfrom fossil fuelCO2emissions: fossil fuelemissions introducenew carbon (fromgeologicsources) into theEarth‐atmosphere system,whereas emissions frombiogas simply cycleexisting carbon in the system.12 However, the cycling of this existing carbon is verycomplex,andnewgreenhousegasemissionscanbeintroducedwithinthiscyclingthrough,for example, fertilizer use for growing livestock feed. Furthermore, there are additionalfactors thatplayarole in theCO2offsetpotentialofanaerobicdigesterssuchasdigesterefficiencyanddigesterfugitivemethaneemissions.87Therefore,itislikelythatbiogasdoesnot fully offset the CO2 emissions from fossil fuels. More complete accounting of thegreenhousegasoffsetofenergyfrombiogasinWisconsinisneeded.GreenhouseGasEmissionsinWisconsinGivencurrentgreenhousegasemissionlevelsinWisconsin,thepotentialforreductionsislarge. In 2003,Wisconsin’s anthropogenic emissions of greenhouse gases totaled 123.1MtCO2eq.82GreenhousegasemissionsfromWisconsin’senergysectortop105.6MtCO2eq,or 86% of total emissions.82 Another 10.9 MtCO2eq, or about 9%, originate fromagricultural sources.While it is difficult to determine the exact proportion of emissionsfromspecificagriculturalpractices forWisconsin, itcanbeestimatedusingU.S.datathat12 Combustion of biogas emits CO2 into the atmosphere; plants take up atmospheric CO2 through photosynthesis and store carbon as tissue/starches; livestock consume carbon in plant tissue/starches; and livestock digest carbon in plant tissue/starches and release it as methane to the atmosphere (through manure emissions and belching); etc.

38
about50%ofthestate’sagriculturalemissionsoriginatefromsoilmanagementpracticesand about 15% from livestock manure.83 Through processes previously described,however, anaerobic digestion has the potential to significantly reduce greenhouse gasemissionsinWisconsin.Howmucharegreenhousegasemissionsbeingpreventedbyon‐farm anaerobic digestion in Wisconsin? We begin with the assessment of the directmethaneemissionsfrommanure.According to the 2009 Wisconsin Agricultural Biogas Casebook, the manure of about44,300dairy cows is currentlybeingdigested in the state.To calculatemanuremethaneemissions,weassumethatundigestedmanurefromonecowemitsabout1.13cubicmetersof methane per day, a typical density of methane of 0.65 kg per cubic meter, and thatdigested manure emits only 10% of the methane of undigested manure. Given theseassumptions,digestionofmanurefrom44,300dairycowspreventstheemissionofabout10,700tonsofmethaneperyear,orabout225,000tCO2eq.88, 89 If themanure fromallofWisconsin’s1.2milliondairycowsweredigested,thiswouldpreventtheemissionofabout290,000tonsofmethaneperyear,orabout6MtCO2eq.Whilethiscalculationrepresentsasignificant amount of uncertainty, the order of magnitude demonstrates that anaerobicdigestionhasthepotentialtosignificantlyreduceWisconsin’sagriculturalgreenhousegasemissions. In addition, these figures do not even include the decrease of nitrous oxideemissionsfromanaerobicdigestion.
Next,wefocusontheavoidedCO2emissionsfromfossil fuelcombustionforenergy.Thisanalysisfocusesontheemissionsoffsetfromcoal‐firedelectricityascoalisoneofthemostCO2‐intensivefossilfuels.88Asof2009,thestate’sbiogasdigestershadanelectriccapacityofabout11.6megawattsandcouldtheoreticallygenerate102,000MWhofelectricity(see“Benefit2:EnergyIndependence”section).23GiventhatoneMWhofelectricitygeneratedfromcoalproducesabout1,020kgofCO2,electricitygenerationfromWisconsin’sdigestersinsteadofcoalwouldresultinaCO2emissionreductionofabout104,000tCO2eq.86,13ThereportfromtheWisconsinGovernor’sTaskForceonGlobalWarminghypothesizedthatifbiogaselectricitywereproducedfromallofWisconsin’s1.2milliondairycows,thiswouldresult in a reduction of nearly 3.0MCO2eqper year, representing over 2%of the state’stotalgreenhousegasemissions.
Using biogas for combined heat and power (CHP, producing both electricity and spaceheat)representsaneffectivewaytomaximizetheCO2emissionoffsetofbiogasproduction.Figure 4 below shows the CO2 emissions reductions associated with different forms ofbiogasendusecomparedtofossilfuel‐basedproductionofenergy.
13 For the purpose of these calculations, we assume that biogas-fired electricity fully offsets the emissions of coal-fired electricity.

39
Figure4.CO2EmissionSavingsofBiogasEnergyEndUses.Source:http://www.renewableenergyworld.com/rea/news/article/2009/10/boosting‐biogas‐with‐heat‐bonus‐how‐combined‐heat‐and‐power‐optimizes‐biogas‐utilization.
Thetophalfofthefiguredisplaystheemissionsavingsforbiogaselectricitygenerationandwaste heat utilization. Electricity generation (from ‘local gas engine’) without heatutilization(topbar)resultsinabout47kgofCO2equivalentsavingsperGJofrawbiogas.Incontrast,generationwith80%usageofwasteheat,anoptimalscenario,canincreaseCO2equivalentsavingsbymorethan50%comparedtonoheatusage.ThebottomhalfofthefigureshowstheCO2emissionreductionsassociatedwithdifferentbiogasenduseoptionsafterupgradingtonaturalgasquality(renewablenaturalgas).Overall,thisshowsthattheCO2emissionoffsetsofbiogaselectricityincreasesubstantiallywhenwasteheatisutilizedandthatCHPresultsinlargeroffsetsthanrenewablenaturalgas.
ScenarioAnalysisBecauseGHGemissionsreductionsfromanaerobicdigestionofmanurecanvarydrasticallyamongbiogasdigestersofdifferentsizesanddesigns,weperformedanenergyanalysisof‘typical’Wisconsin biogas digesters. In this analysis,we focus on the offset of fossil fuelemissions.Here,theamountofGHGemissions(tonsofCO2)thatcanbereducedforeachsystemiscalculatedbycomparingtheelectricandheatingneedsforeachsystemtoabasecaseemissionsload.TheCO2emissionsforeachbiogassystemarecalculatedassumingthatallbiogasproducedwascombustedandconvertedtoelectricitywithwasteheatutilization(CHP, 75% heat recovery). Base case emissions are derived by meeting the sameelectricity/heatdemandfromthetable’ssecondcolumnusingthecurrentWisconsin fuelsourcemix(eachoftheircurrentpercentcontributions).ThisanalysiswasconductedusingRETScreen®software.

40
Table8.OffsetofFossilFuelEmissionsbyBiogasCHP
Scenario BaseCaseEmissions(tCO2)
BiogasCHPEmissions(tCO2)
EmissionReduction(tCO2)
Avg.Farm(100cows) 291.4 12.6 278.8CAFO(1000cows) 2915 126 2789FoodProcessingPlant notcalculated
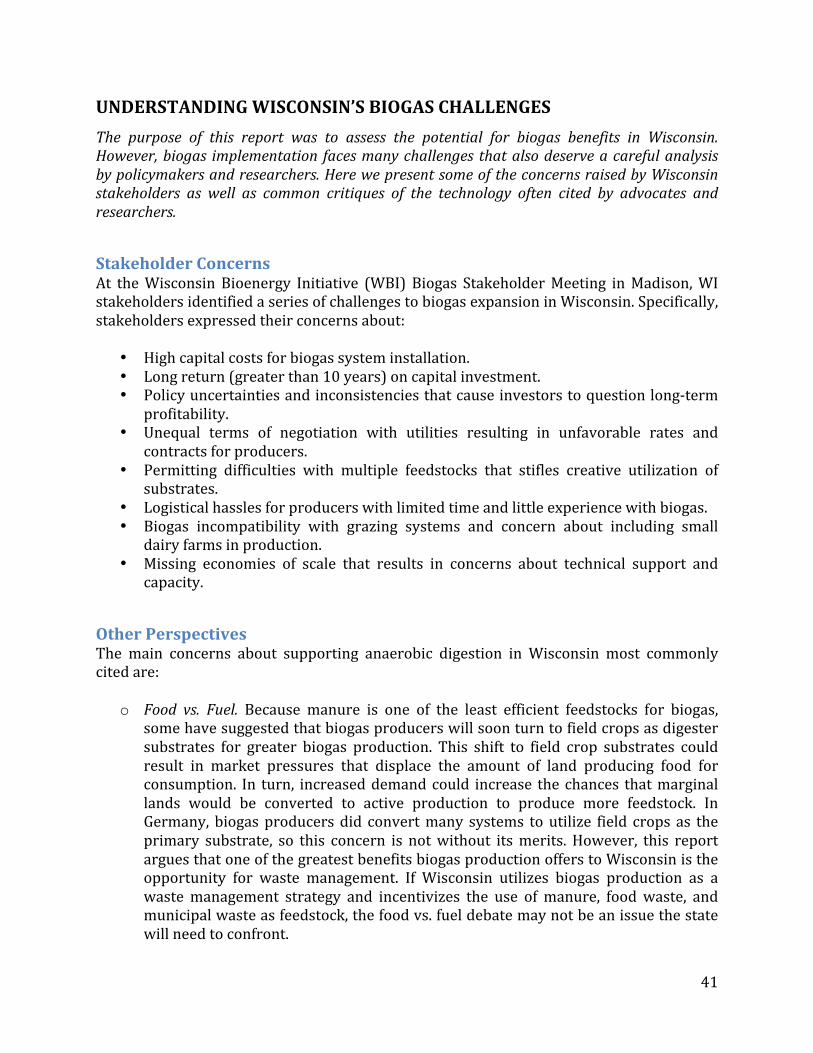
41
UNDERSTANDINGWISCONSIN’SBIOGASCHALLENGES
The purpose of this report was to assess the potential for biogas benefits in Wisconsin.However,biogas implementation facesmanychallenges thatalsodeserveacarefulanalysisbypolicymakersandresearchers.HerewepresentsomeoftheconcernsraisedbyWisconsinstakeholders as well as common critiques of the technology often cited by advocates andresearchers.
StakeholderConcernsAt theWisconsinBioenergy Initiative (WBI) Biogas StakeholderMeeting inMadison,WIstakeholdersidentifiedaseriesofchallengestobiogasexpansioninWisconsin.Specifically,stakeholdersexpressedtheirconcernsabout:
• Highcapitalcostsforbiogassysteminstallation.• Longreturn(greaterthan10years)oncapitalinvestment.• Policyuncertaintiesandinconsistenciesthatcauseinvestorstoquestionlong‐term
profitability.• Unequal terms of negotiation with utilities resulting in unfavorable rates and
contractsforproducers.• Permitting difficulties with multiple feedstocks that stifles creative utilization of
substrates.• Logisticalhasslesforproducerswithlimitedtimeandlittleexperiencewithbiogas.• Biogas incompatibility with grazing systems and concern about including small
dairyfarmsinproduction.• Missing economies of scale that results in concerns about technical support and
capacity.
OtherPerspectivesThe main concerns about supporting anaerobic digestion in Wisconsin most commonlycitedare:
o Food vs. Fuel. Because manure is one of the least efficient feedstocks for biogas,somehavesuggestedthatbiogasproducerswillsoonturntofieldcropsasdigestersubstrates for greater biogas production. This shift to field crop substrates couldresult in market pressures that displace the amount of land producing food forconsumption. In turn, increaseddemandcould increase thechances thatmarginallands would be converted to active production to produce more feedstock. InGermany, biogasproducersdid convertmany systems toutilize field crops as theprimary substrate, so this concern is notwithout itsmerits.However, this reportarguesthatoneofthegreatestbenefitsbiogasproductionofferstoWisconsinistheopportunity for waste management. If Wisconsin utilizes biogas production as awastemanagement strategy and incentivizes the use ofmanure, foodwaste, andmunicipalwasteasfeedstock,thefoodvs.fueldebatemaynotbeanissuethestatewillneedtoconfront.

42
o SupportingCAFOproductionsystemsattheexpenseofgrazersandsmallfarms
Currently all the biogas systems in Wisconsin are on large farms classified asconcentrated animal feeding operations. Some advocates for small farms andgrazing systemshavewarned that policies that subsidizebiogas systemson largefarmsincentivizeindustrialagricultureattheexpenseofsmallfamilyfarms.Giventhe recent trends towardconsolidated farms, this issue isparticularly sensitive inWisconsin.InGermany,biogassystemscanbefoundondairyfarmswithlessthan100headofmilkcows—theaveragesizefarminWisconsin—suggestingthatsmallscalesystemsarepossible.

43
CONCLUSIONS
Anaerobicdigestionhas thepotential tooffer thestateofWisconsina suiteofeconomic,social, and environmental benefits beyond its obvious utility as a source of clean,renewableenergy. Publicandprivatedecisionmakers should recognizeandvalue thesebenefitswhenassessingwhetherbiogasisanappropriatepublicorprivateinvestment.Specifically, anaerobic digestion can help to improvewaste management for livestockoperations and food processors. In some cases, thiswastemanagementwith anaerobicdigestion results in direct savings for private interests. For example, reduced odoremissions resulting from the implementation of anaerobic digestion in rural areas couldincrease rural property values by over $100million dollars. Likewise, privately ownedfood processors could potentially save $500,000 in sewer charges each year. In othercases, the benefits of anaerobic digestion offer more indirect or secondary wastemanagement benefits to the state. Reduced agricultural run‐off means cleaner publicdrinking, recreational, and irrigation waters. These cleaner waters could translate intoreduced healthcare costs from food‐borne & waterborne illnesses as well as increasedrevenue for Wisconsin’s state parks due to fewer beach closures. Employing on‐siteanaerobic digestion for food processing wastewater reduces the strain on Wisconsin’sagingmunicipalwastewatertreatmentsystems,conservingthestate’slimitedresourcesbyextendingthelifeofthesesystems.Anaerobic digestion also offers opportunities for promoting energy independence inWisconsin.Currently,Wisconsinsendsabout$18.6billionperyearoutofthestatetomeetitsfossilfuelenergyneeds.Existingon‐farmbiogassystemsalreadyhavethepotentialtooffset$2.2millionof coal forelectricityor, ifupgraded to createpipelinequalitynaturalgas,nearly$15millioninnaturalgas.IfallthemanureinWisconsinwasusedtogeneratenaturalgas,Wisconsincouldoffset4.4%ofitsannualnaturalgasusage.Thissuggeststhatratherthanviewingthe23milliontonsofmanuregeneratedeachyearinthestateasa$48milliondollarmanagementheadache,Wisconsincouldviewitsmanureasa$185millionunderutilizedeconomicopportunity.Ahostofothereconomicopportunitiesalsoaccompanyanaerobicdigestion.Specifically,biogas could generatenewgreen jobs and stimulate the growthof anew industrywhileofferingastablesourceofon‐farmincomenotsubjecttocommoditypricefluctuations.InGermany,over11,000peopleareemployedbythebiogasindustry. Dairyproducersmayalso benefit fromnew revenue streams createdby the co‐products of biogas generation.Specifically,digestatemaybeusedasbeddingorfertilizer.Theseproductscanbeusedon‐farm,creatingaclosedloopsystem,orsoldoff‐farmasavalue‐addedproduct. Finally, ifregional or national carbon markets materialize, dairy producers stand to reap greatbenefits for methane reductions. At current EU carbon prices, a 100 head farm couldqualifyforasmuchas$10,000eachyear.Greenhouse gas emission reductions are another under‐appreciated benefit of biogasproductioninWisconsin. Anaerobicdigestionreducesgreenhousegasemissionsinthree

44
ways:(1)reducesdirectemissionsofmethaneandnitrousoxidefrommanure,(2)offsetsnitrous oxide emissions from synthetic fertilizers by utilizing digested manure as afertilizer, and (3) offsets CO2 emissions from carbon‐intensive fossil fuel combustionthroughbiogasenergyproduction.ReducinggreenhousegasemissionsinWisconsinhelpsto prevent climate change, ensuring the preservation of a sustainable future forgenerationsofWisconsinites.AfulleconomicassessmentofWisconsin’sbiogaspotentialshouldbuildonthequalitativeand quantitative analysis of the four categories of benefits presented here. Despite thedemonstrated magnitude of these benefits, biogas production is not without its costs.Public and private decision‐makers should carefully weigh the challenges to biogasproduction identified by the state’s stakeholders. In addition, decision‐makers shouldcarefully consider thepotentialbenefitsanddrawbacksofusingnon‐waste substrates indigestion. Finally, although examples such as Germany demonstrate that anaerobicdigestion can be profitable on small farms (<100 head), biogas production inWisconsindoeshavethepotentialtoincentivizeindustrialanimalproductionattheexpenseofsmallfarms.Thesechallenges,whilepotentiallysignificant,canbeovercomeifbiogasisproperlypromotedandregulated.

45
REFERENCES
QuantitativeSourceDataandAssumptionsConcentratedAnimalFeedingOperations(CAFO)TheCAFOcalculationsareconsideredthebusiness‐as‐usualscenarioasallofWisconsin’s31 on‐farm digesters have a herd size greater than 825 (thereby meeting the USEPAcategorizationasaCAFO).Alldatausedindevelopmentofthisscenarioaretakenfromthe2009WisconsinAgriculturalBiogasCasebook.23
• HerdSize:n=21o 825–4600(Median=1400)
• TemperatureProfile‐Digester:n=30o 27mesophilic(3thermophilic)
• TypeMixing‐Digester:n=30o 19mixed‐plugflow(11completemixed)
• BiogasUse:n=21o 20farmsusethebiogasforcombinedheatandpower(electricity)
• ManureVolumes:n=21o 20K–160Kgallons(Median=55Kgallons)
• Substrates:n=21o 11farmsaremanureonlyo Industrialwasteaddedat6farms(typically10%)–thisvolumerangeis4K
gallonsto8Kgallons• EnergyGeneration:n=16
o Installedcapacity(kW):140‐1200(Median=600)o Productionsoldtoutility(kWh):1,120,100–15,912,086
(Median=4,518,330).• DigestedSolids
o 8farmsuseon‐farmasbeddingorsoilamendmento 12farmsselldigestedsolidsoff‐farmo Medianpriceis$20/ton
TypicalDairyOperationAccording to the 2007 Department of Agriculture, Trade and Consumer Protection(DATCP) and Wisconsin Agricultural Statistics Service (WASS) data, 82% of the state’s12,500registeredherdsare100milkcowsorless.2,90TypicalvaluesassociatedwithherdoperationsofthissizewerecourtesyofProfessorEmeritusJamesConverse(UniversityofWisconsin,Madison).
• 100headofcows• 35gpd/cow(manureandstraw)• 25dayretentiontime• 87,500gallons=11,700cubicfeet• Assumea15foottankdepth;needasurfaceareaof780squarefeet• Assumeacirculartank;diameter=16feet• 46cubicfeetmethaneperdaypercow(300m3methaneperanimalunit(1000
poundssoacow=1.5AU))
46
• 4600cubicfeetofmethaneperdayIndustrial–FoodProcessingWisconsinishometoover1000foodprocessingfirmsencompassingthedairy,meat,andproduce industries.90 Currently, the Energy Center ofWisconsin is conducting a detailedstudy to categorize the role of anaerobic digestion in treating waste streams from foodprocessingfirms.However,intheabsenceofthiscomprehensivereview,typicalpublishedvaluesforthefoodprocessingindustryhavebeenused.5,63
• Assumeflowof8,706m3/dayandBODof2,000mg/L• Assumewastestabilizationat90%• Methanegenerationis5,485m3CH4perday(assumes0.35m3CH4/kgBOD)
Otherassumptionsandinputsusedinourquantitativeassessments
• Solidscontentofmanure=11.6‐12.5%• Methanepercowperday=46cubicfeet(1.31cubicmeters)• Electricityexportrate=5centsperkWh• Engineefficiency=70%• ATTRAcostestimatesofAD• Interestrate=6%• Inflation=3%• Lifetime=30years
WorksCited1. DairyBusinessAssociation.EconomicImpactofWisconsin'sDairyIndustry.In:DBA,ed.GreenBay,WI;2010.2. DATCP.WisconsinAgriculturalStatisticsService.Availableat:http://datcp.state.wi.us/core/agriculture/agriculture.jsp.AccessedNovember272010.3. PAFFA.ManureProductionandValueTable.Availableat:http://www.paffa.state.pa.us/paffa2/files/specialrecords/manuretable.pdf.AccessedDecember92010.4. Forward‐Wisconsin.FoodProductsandProcessing.Availableat:www.forwardwi.com.AccessedDecember92010.5. HansenC,CheongD.AgriculturalWasteManagementinFoodProcessing.In:KutzM,ed.HandbookofFarm,Dairy,andFoodMachinery.Norwich,NY:WilliamAndrewPublishing;2007.6. MattesonG,JenkinsB.FoodProcessingResiduesinCalifornia:ResourceAssessmentandPotentialforPowerGeneration.BioResourceTechnology2007;98(16):3098‐3105.7. TotzkeD.2010AnaerobicTreatmentTechnologyOverview.In:AppliedTechnologiesI,ed.;2010.8. SorannoP,HublerS,CarpenterS,LathropR.Phosphorousloadstosurfacewaters:Asimplemodeltoaccountforspatialpatternsoflanduse.EcologicalApplications1996;6:865‐878.

47
9. BoyceA.PhosphorousRulesRevisions.Availableat:http://dnr.wi.gov/org/water/wm/wqs/phosphorus/.AccessedDecember92010.10. WIDNR.FishandWildlifeAnnualReport.In:WisconsinDepartmentofNaturalResources;2006‐2007.11. NRCS.NutrientManagement.Availableat:http://www.wi.nrcs.usda.gov/.AccessedDecember82010.12. NowakP,CabotP.Thehumandimensionofresourcemanagementprograms.JournalofSoilandWaterConservation2004;59:128‐135.13. PowellJ,JacksonD,McCroryD,SaamH,MariolaM.NutrientManagementBehavioronWisconsinDairyFarms.2007.14. SaamH,PowellJ,Jackson‐SmithD,BlandW,PosnerJ.UseofanimaldensitytoestimatemanurenutrientrecyclingabilityofWisconsindairyfarms.AgriculturalSystems2005;84:843‐857.15. ShortleJ,AblerD,RibaudoM.Agricultureandwaterquality:TheIssues.In:EnvironmentalPoliciesforAgriculturalPollutionCOntrol.NewYork:CABIPublishing;2001.16. LudwigD,CarpenterS,BrockW.Optimalphosphorousloadingforapotentiallyeutropiclake.EcologiclApplications2003;13:1135‐1152.17. CarpenterS,BensonB,BiggsR,etal.UnderstandingRegionalChange:Comparisonoftwolakedistricts.BioScience2007;57:323‐335.18. BlakeL.APollutantReducitonOptimizationAnalysisfortheLowerFoxRiverBasinandGreenBayAreaofConcern.In:EPAU,ed.IntegratedWatershedApproachDemonstratonProject;2010.19. WrightP.OverviewofUSExperienceswithFarmScaleBiogasPlants.Availableat:http://www.harvestcleanenergy.org/enews/enews_1204/Wright_on_AD.pdf.AccessedDecember82010.20. GungorK,KarthikeyanK.Phosphorousformsandextractabilityindairymanure:AcasestudyforWisconsinon‐farmanaerobicdigesters.BioresourceTechnology2006;99(2):425‐436.21. GoochC,ProntoJ.CapitalizingonEnergyOpportunitiesonNewYorkDairyFarms.In:DairyICfU,ed.DairyPowerNewYorkSummit;2009.22. MollerK,StinnerW.Effectsoforganicwastedigestionforbiogasproductiononmineralnutrientavailabilityofbiogaseffluents.NutrientCycleAgroecosystem2010;87:395‐413.23. Kramer,J.WisconsinAgriculturalBiogasCasebook.In:PublicServiceCommission,FocusonEnergyRenewablesProgram;2009.24. EricsonB.StruviteHarvestingatMadisonMSD.Availableat:http://www.ati‐ae.com/resources/tech‐talk/187‐partnering‐on‐ad‐and‐chp‐projects.html.AccessedDecember82010.25. Rossman,T.andHadden,D.MadisonMetropolitanSeweragedistrictandOstarapartnertoinstallcommercialnutrientrecoveryfacility.In:Ostara;2010.26. SchmalzriedH,FallonL.Large‐ScaleDairyOperations:AssessingConcernsAboutQuality‐of‐LifeIssues.JournalofDairyScience2007;90:2047‐2051.27. HadrichJ,WolfC.CitizenComplaintandEnvironmentalRegulationofMichiganLivestockOperations.JournalofAnimalScience2010.
48
28. DairyDoingMore.Pagel'sPonderosaDairy,LLC.Availableat:http://www.dairydoingmore.org/Family.aspx?articleId=151.AccessedNovember17,20102010.29. WPS.MethaneDigesterProducesEnoughElectricitytoLight800Homes.In:WisconsinPublicServiceFarmnews.Chicago,IL:IntegrysEnergyGroup,Inc.;2009.30. Wisconsin‐Focus‐On‐Energy.TurningWastewaterIntoEnergy:FactSheet.In:EnergyWFo,ed.REN20010602.Madison,WI;2002.31. KramerJ,CantwellJ.AnaerobicDigestionandBiogasUseinFoodProcessing‐GreatLakesRegion.In:EnergyCenterofWisconsinBioenergySeriesWebinar.Madison,WI;2010.32. DATCP.Wisconsin'sDairyandLivestockOdorandAirEmissionProject.In.Madison,WI;2009.33. JacobsonL,SchmidtD,WoodS.OFFSET:OdorFromFeedlotsSetbackEstimationTool.In.Minneapolis,MN:UniversityofMinnesotaExtension;2002.34. MillaK,ThomasM,AnsineW.EvaluatingtheEffectofProximitytoHogFarmsonResidentialPropertyValues:AGIS‐BasedHedonicPriceModelApproach.URISAJournal2005;17(1).35. AikenJ.PropertyValuationMayBeReducedByProximityToLivestockOperation.In:ReportNS,ed.Lincoln,NE:UniversityofNebraska‐Lincoln;2004.36. ParkD,SeidlA,DaviesS.TheEffectofLivestockInductryLocationOnRuralResidentialPropertyValues.In:ExtensionCSUC,ed.FortCollins,CO:ColoradostateUniversity;2004.37. SarapatkaB,HolubM,LhotskaM.THEEFFECTOFFARMYARDMANUREANAEROBICTREATMENTONWEEDSEEDVIABILITY.BiologicalAgriculture&Horticulture1993;10(1):1‐8.38. BurtonCT,C.Anaerobictreatmentoptionsforanimalmanures.In:J.A.F.BeckJM,W.Martens,O.Pahl,S.PiccininiandI.Svoboda,,ed.ManureManagement–treatmentStrategiesforSustainableAgriculture.WrestPark,Silsoe,Bedford,UKSilsoeResearchInstitute;2003:pp.273–320.39. YiridoeE,GordonR,BrownB.Nonmarketcobenefitsandeconomicfeasibilityofon‐farmbiogasenergyproduction.EnergyPolicy2009.40. CookAR,PosnerJL,BaldockJO.EffectsofdairymanureandweedmanagementonweedcommunitiesincornonWisconsincash‐grainfarms.WeedTechnology2007;21(2):389‐395.41. MartensW,BohmR.Overviewoftheabilityofdifferenttreatmentmethodsforliquidandsolidmanuretoinactivatepathogens.BioresourceTechnology2009;100(22):5374‐5378.42. MartinezJ,DabertP,BarringtonS,BurtonC.Livestockwastetreatmentsystemsforenvironmentalquality,foodsafety,andsustainability.BioresourceTechnology2009;100(22):5527‐5536.43. FebrianiY,LevalloisP,GingrasS,GosselinP,MajowiczSE,FleuryMD.Theassociationbetweenfarmingactivities,precipitation,andtheriskofacutegastrointestinalillnessinruralmunicipalitiesofQuebec,Canada:across‐sectionalstudy.BmcPublicHealth2010;10.44. FebrianiY,LevalloisP,LebelG,GingrasS.Associationbetweenindicatorsoflivestockfarmingintensityandhospitalizationrateforacutegastroenteritis.EpidemiologyandInfection2009;137(8):1073‐1085.

49
45. FrankC,KapfhammerS,WerberD,StarkK,HeldL.CattleDensityandShigaToxin‐ProducingEscherichiacoliInfectioninGermany:IncreasedRiskforMostbutNotAllSerogroups.VectorBorneandZoonoticDiseases2008;8(5):635‐643.46. O'ConnorAM,AuvermannB,Bickett‐WeddleD,etal.TheAssociationbetweenProximitytoAnimalFeedingOperationsandCommunityHealth:ASystematicReview.PlosOne2010;5(3).47. St‐PierreC,LevalloisP,GingrasS,PaymentP,GignacM.Riskofdiarrheawithadultresidentsofmunicipalitieswithsignificantlivestockproductionactivities.JournalofPublicHealth2009;31(2):278‐285.48. ValcourJE,MichelP,McEwenSA,WilsonJB.AssociationsbetweenindicatorsoflivestockfarmingintensityandincidenceofhumanShigatoxin‐producingEscherichiacoliinfection.EmergingInfectiousDiseases2002;8(3):252‐257.49. BowmanD.ManurePathogens:ManureManagement,Regulations,andWaterQualityProtection.In:WEFPress,ed.Alexandria,VA;2009.50. HoranN,FletcherL,BetmalS,WillksS,KeevilC.Die‐offofenetricbacterialpathogensduringmesophilicanaerobicdigestion.WaterResearch2004;38(5):1113‐1120.51. HainesJ,StaleyL.RiskManagementEvaluationforConcentratedAnimalFeedingOperations.In:USEPA,ed.Cincinnati,OH:USEPA;2004.52. WongK,OnanB,XagorarakiI.QuantificationofEntericViruses,PathogenIndicators,andSalmonellaBacteriainClassBAnaerobicallyDigestedbiosolidsbyCultureandMolecularMethods.AppliedandEnvironmentalMicrobiology2010;76(19):6441‐6448.53. SkillmanLC,BajsaO,HoL,SanthanamB,KumarM,HoG.Influenceofhighgasproductionduringthermophilicanaerobicdigestioninpilot‐scaleandlab‐scalereactorsonsurvivalofthethermotolerantpathogensClostridiumperfringensandCampylobacterjejuniinpiggerywastewater.WaterResearch2009;43(13):3281‐3291.54. MartinJH.ANEVALUATIONOFAMESOPHILIC,MODIFIEDPLUGFLOWANAEROBICDIGESTERFORDAIRYCATTLEMANURE.In.Morrisville,NC:AgSTARProgramandUSEnivironmentalProtectionAgency;2005.55. FoodborneandWaterborneDiseaseOutbreakInvestigationManual.In:ServicesWDoHaF,ed.:WisconsinDivisionofPublicHealth:BureauofCommunicableDiseasesandPreparedness;2005.56. USEPA.DrinkingWaterInfrastructureNeedsSurveyandAssessment.In:USEPA,ed.;2009.57. Chase,S.Wisconsin'sGreatLakesBeachMonitoringandNotificaitonProgramAnnualReport.In:BureauofWatershedManagementWisconsinDepartmentofNaturalResources;2008.58. LiuY,MillerS,SaffermanS.ScreeningCo‐DigestonofFoodWastewaterwithManureforBiogasProduction.BioFuels,BioProducts,andBioRefining2009;3(1):11‐19.59. Wisconsin‐Department‐of‐Natural‐Resources.WastewaterWisconsinPollutantDischargeEliminationSystem(WPDES)PermitProgram.Availableat:http://www.dnr.state.wi.us/org/water/wm/ww/.AccessedDecember12010.60. MayerJ.LaCrosseSanitarySewerUtility:2010,2011,&2012ProposedSewer'UserCharge'Rates.In;2009.61. GomezA,ZubizarretaJ,RodriguesM,DopazoC,FueyoN.Anestimationoftheenergypotentialofagro‐industrialresiduesinSpain.Resources,Conservation,andRecycling2010;54(11):972‐984.

50
62. Wisconsin‐Department‐of‐Natural‐Resources.Wisconsin'sWasteImportsandExports.Availableat:http://dnr.wi.gov/org/aw/wm/solid/landfill/outofstate.htm.AccessedDecember12010.63. RittmannB,McCartyP.EnvironmentalBiotechnology:PrinciplesandApplications;2001.64. TagliaP.Biogas:RethinkingtheMidwest'sPotential.In:CleanWisconsin,Inc.;2010.65. 40CFRPart503:StandardsfortheUseandDisposalofSewageSludge.In:UnitedStatesFederalRegister;1993:9248‐9404.66. Jones‐LeppT,StevensR.PharamceuticalsandPersonalCareProductsinBiosolids/SewageSludge‐TheInterfacebetweenAnalyticalChemistryandRegulation.AnalsofBioanalyticalChemistry2006.67. BehmD.Milorganiteproductionrestarts.In:JournalSentinel.Milwaukee,WI;2007.68. RhindS,SmithA,KyleC,etal.Phthalateandalkylphenolconentrationsinsoilfollowingapplicationsofinorganicfertilizerorsewagesludgetopastureandpotentialratesofingestionbygrazingruminants.JournalofEnvironmentalMonitoring2002;4:142‐148.69. U.S.EnergyInformationAdministration.StateEnergyProfile:Wisconsin.Availableat:http://www.eia.gov/state/state_energy_profiles.cfm?sid=WI.AccessedNovember232010.70. ZiewacsJ.WisconsinEnergyStatistics.In:WIOfficeofEnergyIndependence,ed.;2009.71. KramerJ.WisconsinAgriculturalBiogasCasebook.In:FocusonEnergy;PublicServiceCommissionofWisconsin;2009.72. WIOfficeofEnergyIndependence.EconomicAssessmentofCleanEnergyJobsAct.In;2010.73. GermanAgencyforRenewableResources(FNRe.V.)Biogas‐AnIntroduction.Gulzow,Germany;2009.74. WhiteSW,Jason.CleanerPathways:JobsandWorkforceDevelopmentintheCleanEnergyEconomy.In:StrategyCoW,ed.;2008.75. SurveyNAS.WisconsinDairyProducerSurvey.In:WIDATCP,ed.:UnitedStatesDepartmentofAgriculture;;2010.76. O’SullivanEDOM,LehrU.GrossEmploymentfromRenewableenergyinGermanyintheYear2008..2008.77. HarrisonE,BonhotalJ,SchwarzM.Usingmanuresolidsfordairybarnbedding.In:WasteManagementInstitute.Ithaca,NY:CornellUniversity;2010.78. LiedlBE,BombardiereJ,ChatfieldJM.Fertilizerpotentialofliquidandsolideffluentfromthermophilicanaerobicdigestionofpoultrywaste.WaterScience&Technology2006;53(8):69.79. PenningtonJ,VanDevenderK,JenningsJ.NutrientandFertilizerValueofDairyManure.In:U.ofArkansasCooperativeExtensionService,ed.LittleRock,AR;2008.80. MuhlenkampAaB,R.USDANationalAgriculturalStatisticsServiceWisconsin‐PricesPaid.In.Madison:USDANationalAgriculturalStatisticsService;2010.81. Crave.BeddingCostsontheCraveBrothersFarm.PersonalcommunicationwithMcCordAI,ed.Madison,WI;2010.82. LarsenJ,DamassaT.WisconsinGreenhouseGasEmissionsInventoryandProjections.In;2007.

51
83. USEPA.InventoryofUSGreenhouseEmissionsandSinks:1990‐2008.In:USEPA,ed.;2010.84. ClemensJ,TrimbornM,WeilandP,AmonB.Mitigationofgreenhousegasemissionsbyanaerobicdigestionofcattleslurry.Agriculture,Ecosystems&Environment2006;112(2‐3):171‐177.85. MontenyG,BanninkA,ChadwickD.Greenhousegasabatementstrategiesforanimalhusbandry.Agriculture,Ecosystems&Environment2006;112(2‐3):163‐170.86. GTFGW.Wisconsin'sStrategyforReducingGlobalWarming.In:GTFGWed.Madison,WI;2008.87. MollerJ,BoldrinA,ChristensenTH.Anaerobicdigestionanddigestateuse:accountingofgreenhousegasesandglobalwarmingcontribution.WasteManagement&Research2009;27(8):813‐824.88. CuéllarAD,WebberME.Cowpower:theenergyandemissionsbenefitsofconvertingmanuretobiogas.EnvironmentalResearchLetters2008;3(3):034002.89. ZeemanG,GerbensS.CH4EmissionsfromAnimalManure.In:IPCC,ed.GoodPracticeGuidanceandUncertaintyManagementinNationalGreenhouseGasInventories;2000.90. GuntherK.CharacterizingWiscon'sFoodSystemsfromProductiontoConsumption:AReferenceDocument.In.Madison,WI:WIDATCP;2007.