Embed Size (px)
Citation preview
GOMB 2015 Water Study
GOMB 2015 Water Study 1
Summary
As a necessity of life, water is a precious resource. Because of its high importance and limited supply, as well as an entire set of unique issues related to water, water policy discussions can be challenging. Given these challenges, some basic context is helpful in formulating appropriate, sustainable water policies for the State of Utah. This report aims to provide some of that context. In addition, the report references other materials that may also be useful in understanding the background of water policy in Utah. The Main Issues Related to Water and Future Growth
A key starting point for examining the issue of Utah’s water future is how the issue is framed. Solutions will be restricted or new options opened up depending upon how narrowly or broadly the underlying issue is defined. GOMB’s working definition of the future growth issue is as follows: Given current projections of Utah’s population doubling over the next 45 years, if current per capita usage levels remain as‐is or only minor additional conservation occurs, the projected demand for municipal and industrial (M&I) water in the state exceeds the projected future supply from current M&I water sources. GOMB recommends that policymakers consider each aspect of this definition when considering policies to guide Utah’s water future. Is balancing water demand and supply an economic issue? An issue of free market exchanges between existing water uses? A new water supply issue? An engineering issue? An issue of reducing water waste? A water pricing issue? Or all of the above? Or more generally, how can the State of Utah enact water policy that ensures a sufficient supply to meet appropriate water usage levels while creating the proper incentives to judiciously and efficiently use Utah’s limited water resources?
In 2015, Governor Herbert issued an Executive Order on water, including a requirement for the Governor’s Office of Management and Budget (GOMB) to examine water issues. This report summarizes the detailed comprehensive water study that GOMB conducted in 2015 pursuant to that Executive Order, examining (a) water demand and pricing, (b) water use, (c) water supply, and (d) paying for water.
Water Demand and Pricing
A detailed discussion of demand should be an essential element of any conversation around Utah’s water situation. However, the demand for developed water is sometimes taken as a given. For example, some estimates of future demand simply take current per capita demand and multiply it by the projected future population, sometimes with very minor conservation that effectively stops in the near future. However, actual future demand is very likely to be influenced by a large number of factors in addition to population growth, including future water prices, changes in lot sizes and landscaping practices, and technological improvements that lead to more efficient water use. Policymakers should take the time to explore in detail various concepts around demand to ensure that feasible alternatives related to the demand for water are appropriately considered as Utah examines alternatives to its current and future water situation. The Law of Demand
In economics, the Law of Demand states that, when all else is equal, as the price of a good increases the quantity demanded will decrease, and as the price of a good decreases the quantity demanded will increase. In other words, although this is often unstated, demand only has true meaning relative to price. This very basic premise of economics is intuitive. If something costs less, people tend to buy more

GOMB 2015 Water Study 2
of it. If something costs more, people tend to buy less of it. Utah’s Water Rates Comparatively Low
As Figure 1 shows, Utah tends to have comparatively low prices charged to water users. Part of this low water cost relates to the favorable geographic conditions Utah enjoys. Although Utah as a whole is one of the driest states, the state’s major population centers are located near mountains that receive much higher levels of precipitation. Precipitation in the form of snowfall provides a clean and annually‐renewed water source, with gravity doing much of the work in delivering the water
to population centers. Another reason for comparatively low water user rates is that many water rates have not been set to fund repair and replacement costs. Another reason for the low costs to water users actually isn’t related to low costs of providing the water itself. Rather, it is that taxpayers in general pay for a portion of water costs rather than water users. A key feature of this water funding approach is that it does not directly impact water use in the way that a direct charge for water does. In other words, tax subsidies for water will tend to work against the goal of water conservation because taxes will not directly impact water usage like a user charge does.
Figure 1 ‐ Water Rates at Different Usage Levels in U.S. Cities
Source: © Kaye LaFond / Circle of Blue (circleofblue.org), used with permission

GOMB 2015 Water Study 3
Figure 2 –Monthly Water Charges by Usage Level in Selected Utah Locations
15K gallons
30K gallons
50k gallons
Orem $23 $32 $43
Layton $22 $39 $62
Spanish Fork $27 $44 $67
Lehi $29 $45 $89
Murray $26 $46 $71
Provo $29 $47 $71
St George $33 $50 $89
Taylorsville-Bennion $30 $56 $90
Granger-Hunter $34 $56 $85
Magna $31 $57 $97
Bountiful $33 $58 $91
Logan $34 $58 $90
Price $33 $60 $95
Centerville $38 $61 $92
West Jordan $40 $62 $92
Salt Lake $37 $77 $139
Sandy $43 $79 $131
Vernal $53 $86 $130
South Jordan $59 $86 $126
Syracuse $32 $87 $169
Farmington $45 $90 $151
Kearns $46 $94 $180
Kaysville $35 $95 $215
Ogden $56 $107 $175
Draper $62 $113 $183
Pleasant Grove $45 $113 $204
Riverton $61 $120 $198
Saratoga Springs $59 $121 $202
American Fork $59 $129 $222
Park City $166 $305 $606
Source: GOMB calculations based on water rates reported on local government websites, using summer rates if seasonal rates exist
Figure 2 shows water rates in different Utah locations at different water usage levels. As the table shows, water rates vary dramatically throughout the state, in particular with some rapidly growing cities having much higher water rates.
Price Elasticity of Demand
Closely related to the Law of Demand is the concept of price elasticity of demand, which measures how responsive the change in quantity demanded of a good is to a change in

GOMB 2015 Water Study 4
price of that good, all else being equal. An important feature of price elasticity is that it is not constant along a demand curve. For example, at survival levels of water use, the demand for water is likely nearly perfectly inelastic (that is, nearly perfectly unresponsive to changes in price). Similarly, the demand for water needed for very basic hygienic needs is also likely very highly inelastic. However, as the quantity of water consumed increases and the use of water becomes more discretionary, there is likely much more responsiveness to price than at sustenance levels of use. Fortunately, a half century’s worth of economic studies has produced a rich economic literature on the price elasticity of demand for water (see Appendix C). Although estimates vary, most studies find the overall price elasticity of demand for developed water to be between ‐0.25 to ‐0.75.1 That is, all else equal, a 10% increase in price would reduce water consumption by between 2.5% and 7.5%. This range of estimates falls in the price inelastic range (that is, less than 1), meaning the percent reduction in quantity is less than the percentage increase in price. However, the term inelastic should not be confused to mean non‐responsive to price. The economic literature also suggests that although a sizable portion of the change in water use from a price change may occur quickly, it may take several years for price changes to be fully reflected in consumption levels and that prices are more effective at changing water usage levels than water conservation advertising. Another interesting issue concerns whether water consumers respond more to average prices (i.e., their total water bill) than marginal prices (the price of the next unit of water used). Consumers rarely know precisely how much water they are using until well after the fact, when the water bill appears. To make increasing block rate
1 Interestingly, some studies, including a 2009 Salt Lake City water use
study, have found summer‐time elasticities to be higher than this range.
structures more effective, consumers would likely need to have better and more real‐time information about their water usage than they currently have. Fortunately, technological improvements and smart meters are making this increasingly possible.
Utah Water Use Data
As the Utah Department of Natural Resources reports, Utah has some of the highest per capita water use in the United States. The U.S. Geological Survey’s (USGS) compilation of state water use data indicates that as of 2010 (the most recently‐reported data) Utah has the highest municipal and industrial (M&I) per capita use in the nation. Recognizing that this USGS comparison may be imperfect because states report water use data differently (for example, some states exclude unmetered secondary water, which Utah includes in its numbers), GOMB recommends that policymakers seriously explore alternatives to maximize the efficient use of existing water as a highly important component of any solution to Utah’s future water situation, in particular if the state assumes a major new financial role in financing water projects. GOMB also recommends that Utah continue efforts to develop better water data and data reporting internally within the state, as well as between states, so that better apples‐to‐apples comparisons of water use can be made in the future. GOMB recommends providing state funding for these key water data purposes. While improving Utah’s water data may not sound exciting, these relatively small investments are essential for making informed multi‐billion dollar decisions about how to handle Utah’s water future. New and Meaningful Water Conservation Targets Needed
As previously mentioned, some estimates of future water demand have assumed little or no future conservation after the existing 25% conservation goal is met. If recent trends continue, the 25% target is likely to be reached

GOMB 2015 Water Study 5
in the near future throughout most of the state, if the target has not already been met. This means that some long‐term demand estimates assume little or no conservation relative to current per capita usage levels. In addition to comparatively lower costs than many water supply development alternatives, there are many reasons to pursue new water conservation goals as a key strategy to deal with Utah’s water situation. One of the most basic is to reduce water waste. For example, studies indicate that Utahns still significantly overwater their lawns by very large percentages (estimates range between 30% for homes with automatic sprinklers to in some cases even twice as much as is actually healthy for the lawn).2 That is, even for existing landscaping, no benefit comes from the excessive water use and, conversely, overwatering creates actual harm to the vegetation. Given that an estimated 65% of residential water use (and roughly 45% of total publicly‐supplied M&I water use) is for outdoor watering, these numbers are not insignificant. Not surprisingly, unmetered water makes it easy to overwater. Moving toward universal metering of water that is currently unmetered (an estimated 43% all outdoor residential water diversions are unmetered) will also help to reduce water use. Simply metering water and reporting water use for previously unmetered connections has led to significant reductions in water use in the Weber Basin Water Conservancy District area, even without price changes. In addition, recent trends toward more water‐efficient landscaping that includes more native plants as well as reduced lot sizes are also very likely to positively impact the more‐efficient use of existing water. Moreover, a recently‐released legislative audit raised serious concerns with the year 2000 baseline against which the current water conservation target is set. Given both those concerns and the nearing achievement of a goal set relative to that year 2000 baseline, GOMB recommends
2 See le.utah.gov/audit/15_01rpt.pdf
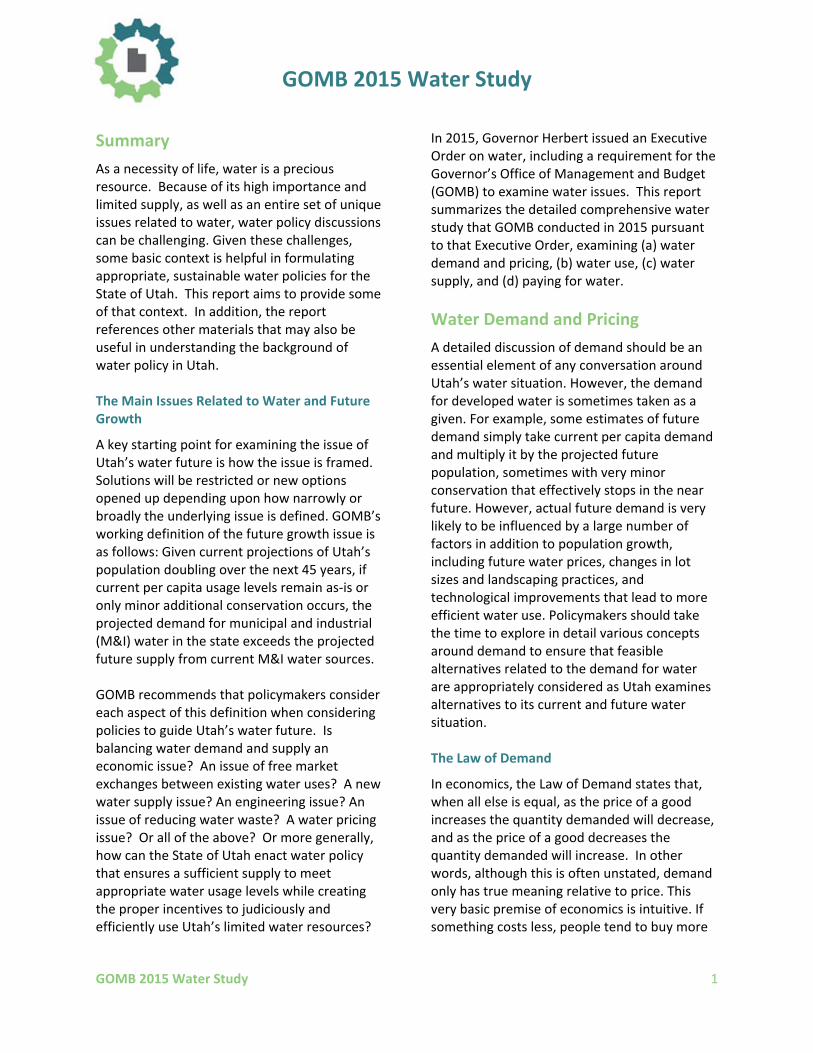
that new targets be set and that reliable, validated data be developed to measure progress toward those newly established water efficiency targets. As part of these new conservation targets, the State may wish to consider creating new conservation targets by region of the state. Sometimes when the issue of water pricing is mentioned, the specter of Utah’s communities becoming dry and barren‐looking desert is raised. However, this need not be the case. Utahns can do more to efficiently use water and still have very nice looking landscapes, both through the elimination of the water waste previously mentioned and through using more water efficient landscaping that is still aesthetically pleasing, including beautiful native plants that simply use less water. A key component of this emphasis of more efficient water use should be government and other institutional water use. As very public users of large amounts of water, institutional users should set the example for the public rather than have their own entity’s water use undermine public perception of the need to more efficiently use water. Institutional users should closely monitor their water use and publicly report on efforts to improve their efficiency in water use. Figure 3 below shows per capita Municipal and Industrial (M&I) water use in Utah by county. As the figure illustrates, water use varies by county.
Utah’s Water Supply
Utah receives its water supply from about 13 inches of annual precipitation that falls within the state, as well as from rivers for which multi‐state water use agreements exist, such as the Colorado River and Bear River Compacts. Given this context, in considering Utah’s water supply, it is important to remember that supplying developed water for use means changing the use of water, not creating more water.
GOMB 2015 Water Study 6
Figure 3 ‐ Per Capita M&I Water Use in Utah, by County
Source: Data from Utah Division of Water Resources, map created by GOMB As Figure 4 shows, Utah is part of the arid and semi‐arid western United States, which receives much less precipitation than other states. For
this reason, water comparisons are usually best made between western states rather than the United States as a whole.

GOMB 2015 Water Study 7
Figure 4 ‐ Annual Precipitation in United States
Public Domain, https://commons.wikimedia.org/w/index.php?curid=666565
GOMB 2015 Water Study 8
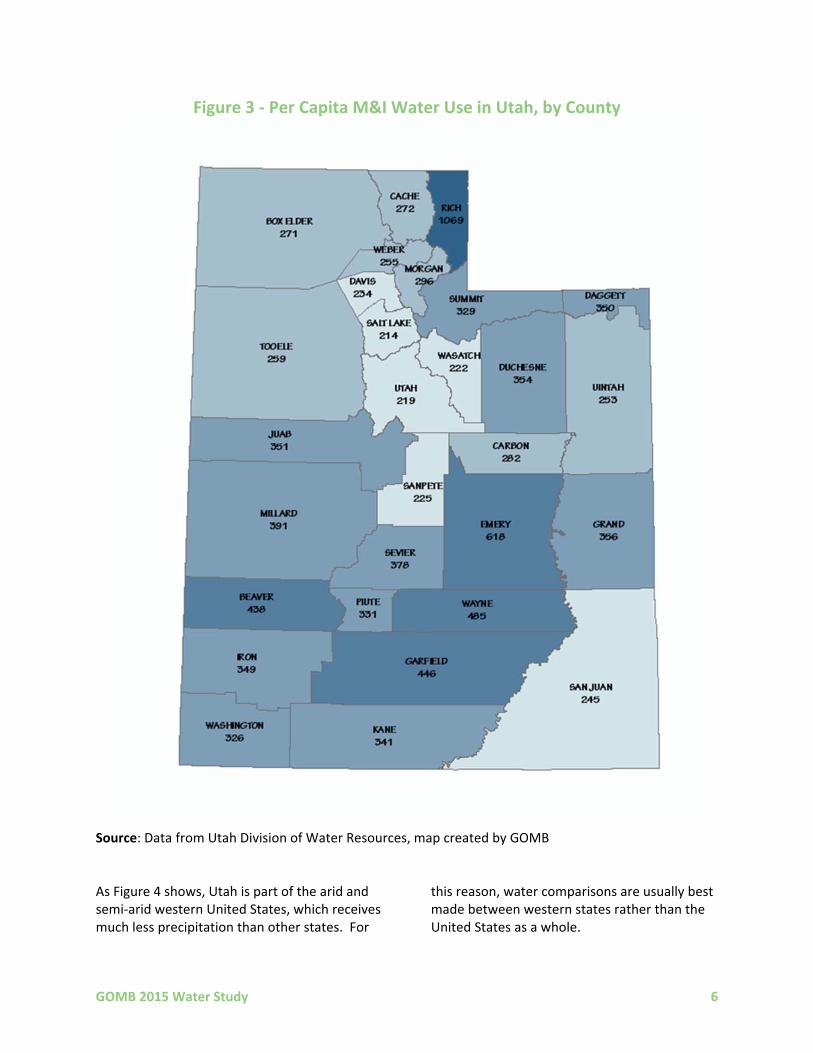
As the maps in Figure 4 illustrate, even though much of the geographic area of Utah is extremely dry, very little of Utah’s population lives in these extremely dry locations. Rather, the vast majority of Utah’s population lives close to mountainous areas that receive much higher levels of water (as shown by the green on the maps).
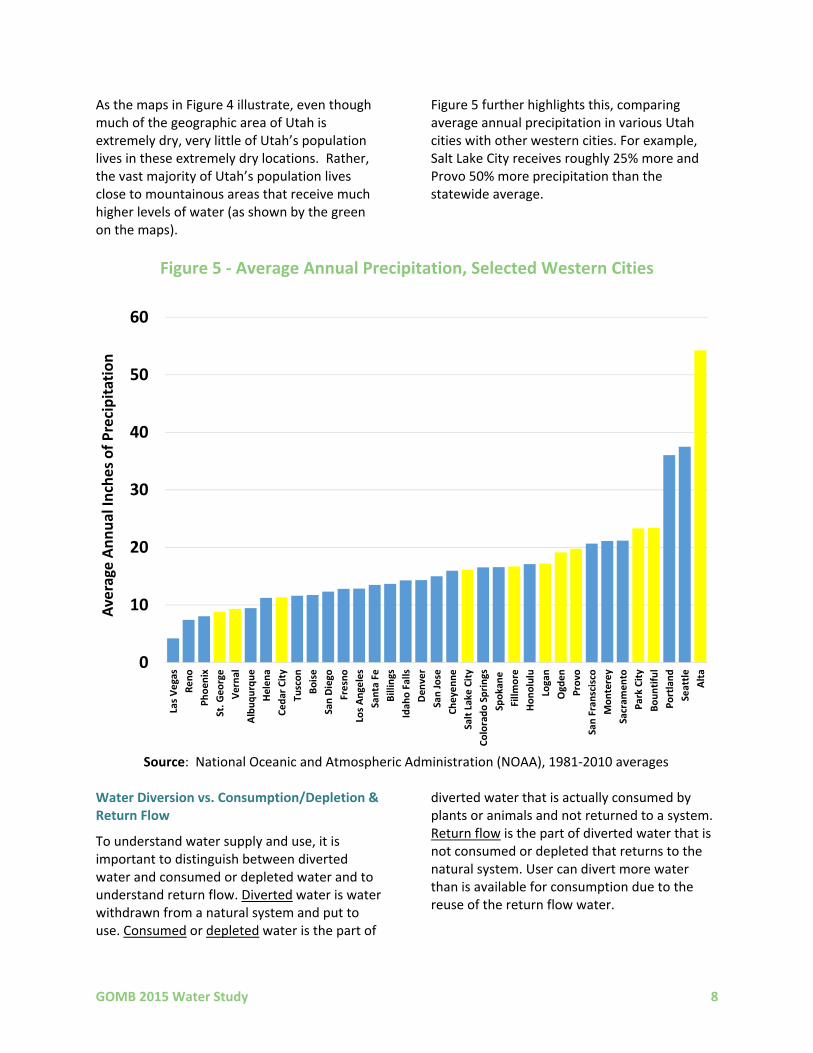
Figure 5 further highlights this, comparing average annual precipitation in various Utah cities with other western cities. For example, Salt Lake City receives roughly 25% more and Provo 50% more precipitation than the statewide average.
Figure 5 ‐ Average Annual Precipitation, Selected Western Cities
Source: National Oceanic and Atmospheric Administration (NOAA), 1981‐2010 averages
Water Diversion vs. Consumption/Depletion & Return Flow
To understand water supply and use, it is important to distinguish between diverted water and consumed or depleted water and to understand return flow. Diverted water is water withdrawn from a natural system and put to use. Consumed or depleted water is the part of
diverted water that is actually consumed by plants or animals and not returned to a system. Return flow is the part of diverted water that is not consumed or depleted that returns to the natural system. User can divert more water than is available for consumption due to the reuse of the return flow water.
0
10
20
30
40
50
60
Las Vegas
Reno
Phoen
ix
St. G
eorge
Vernal
Albuqurque
Helena
Cedar City
Tuscon
Boise
San Diego
Fresno
Los Angeles
Santa Fe
Billings
Idah
o Falls
Den
ver
San Jose
Cheyenne
Salt Lake City
Colorado Springs
Spokane
Fillm
ore
Honolulu
Logan
Ogden
Provo
San Franscisco
Monterey
Sacram
ento
Park City
Bountiful
Portland
Seattle
Alta
Average Annual In
ches of Precipitation
GOMB 2015 Water Study 9
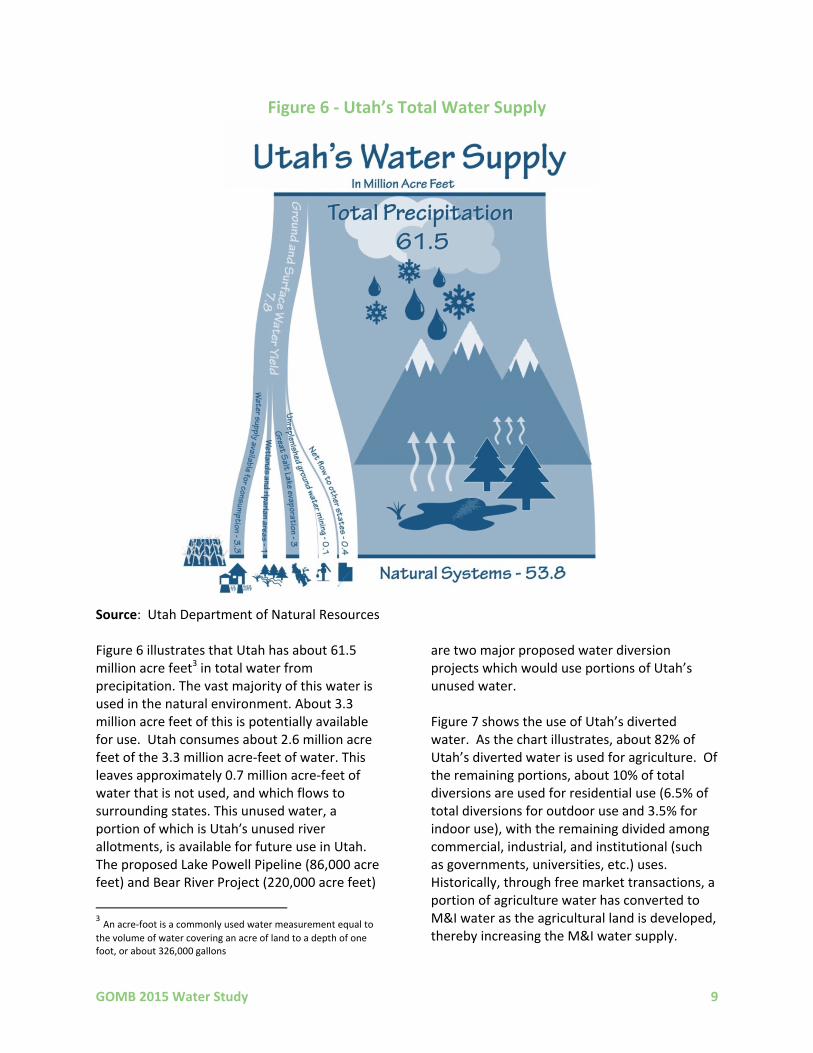
Figure 6 ‐ Utah’s Total Water Supply
Source: Utah Department of Natural Resources Figure 6 illustrates that Utah has about 61.5 million acre feet3 in total water from precipitation. The vast majority of this water is used in the natural environment. About 3.3 million acre feet of this is potentially available for use. Utah consumes about 2.6 million acre feet of the 3.3 million acre‐feet of water. This leaves approximately 0.7 million acre‐feet of water that is not used, and which flows to surrounding states. This unused water, a portion of which is Utah′s unused river allotments, is available for future use in Utah. The proposed Lake Powell Pipeline (86,000 acre feet) and Bear River Project (220,000 acre feet)
3 An acre‐foot is a commonly used water measurement equal to
the volume of water covering an acre of land to a depth of one foot, or about 326,000 gallons
are two major proposed water diversion projects which would use portions of Utah’s unused water. Figure 7 shows the use of Utah’s diverted water. As the chart illustrates, about 82% of Utah’s diverted water is used for agriculture. Of the remaining portions, about 10% of total diversions are used for residential use (6.5% of total diversions for outdoor use and 3.5% for indoor use), with the remaining divided among commercial, industrial, and institutional (such as governments, universities, etc.) uses. Historically, through free market transactions, a portion of agriculture water has converted to M&I water as the agricultural land is developed, thereby increasing the M&I water supply.

GOMB 2015 Water Study 10
Figure 7 ‐ Utah’s Use of Diverted Water
Source: Utah Department of Natural Resources Figure 8 ‐ Use of Utah’s Diverted Water for Agriculture Crops
Source: Utah Department of Natural Resources
Figure 8 provides additional detail on agricultural use, which is by far the largest use of Utah’s diverted water. As the chart illustrates, the vast majority (about 83%) of Utah’s agriculture crop acreage is used for alfalfa, pasture, and grass hay. Grain and corn are other notable agricultural crop uses, with all remaining uses at comparatively very small amounts.
Paying for Water
Water is funded in Utah through a combination of user fee mechanisms (such as regular monthly water charges and impact fees), and general taxes (such as property tax and sales tax). Historically, the state has played only a minor role in funding water infrastructure, which has historically been handled primarily at the local level. In addition to municipalities, other local government entities such as metropolitan and conservancy districts were established to keep water locally administered.

GOMB 2015 Water Study 11
The minor role that the State of Utah has historically played in water development itself is to finance relatively small water projects, subject to repayment. Currently, about $35 million in state General Fund revenue is earmarked for water purposes. In addition, various divisions of the Utah Department of Natural Resources and Department of Environmental Quality provide water‐related services and administer the state’s water laws.
The federal government historically financed many major water projects, subject to repayment provisions. Over the past several decades, the federal government has largely withdrawn from a major role in financing large new water development projects, although the federal government continues to fund water projects and issues, such as dam safety, drinking water, and water quality funding that the state receives.
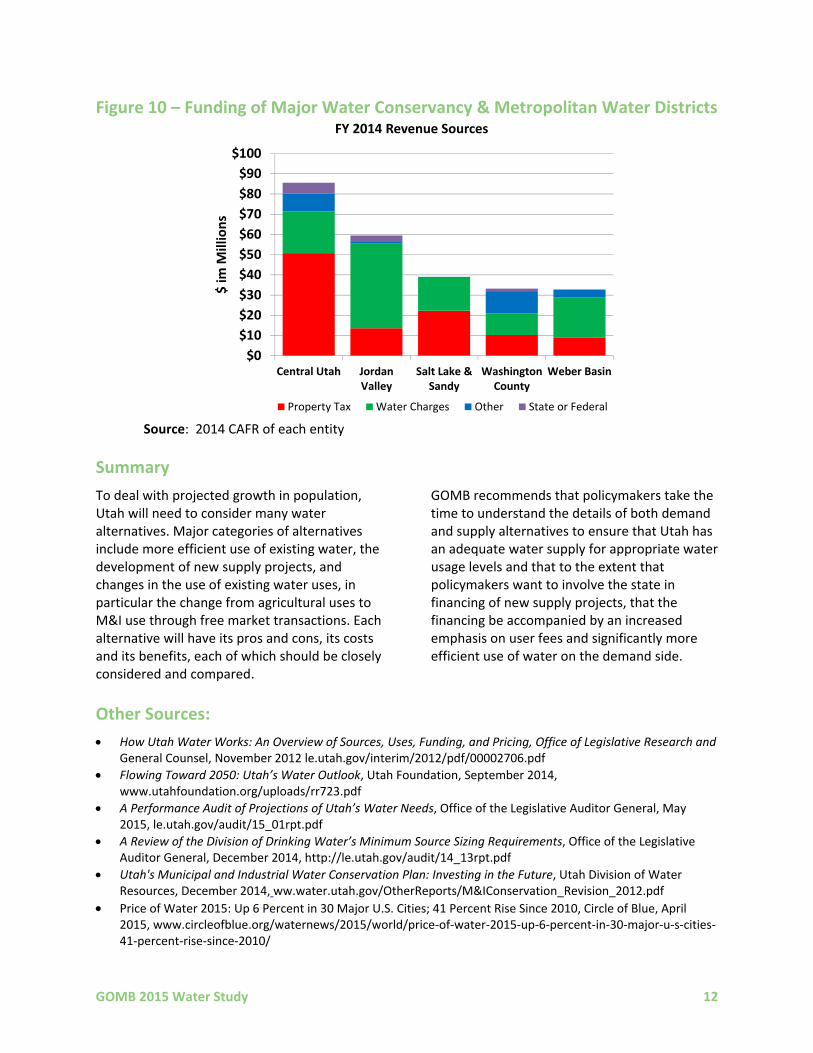
In considering alternatives for paying for water infrastructure, as well as operations and maintenance costs, different funding mechanisms will tend to create different economic outcomes. Direct charges for water will tend to encourage conservation through reduced water use as people bear the costs of the water they use. A tax that is unrelated to the amount of water used does not reduce water consumption in the way that a direct water charge would. In other words, people can change their behavior (i.e., through reduced water use) to minimize their water charges, whereas with a tax they do not have that same direct economic incentive to minimize water use, so cross‐subsidization of water use occurs. Figures 9 and 10 provide estimates of the total funding of M&I water in Utah by funding source, as well as information on the largest five entities that charge most of the property taxes for water (water conservancy districts and metropolitan districts).
Figure 9 – Total Funding Sources of M&I Water
Source: transparent.utah.gov
Retail Water Sales
Fees & Other
State Tax
Federal Tax
Property Tax
GOMB 2015 Water Study 12
Figure 10 – Funding of Major Water Conservancy & Metropolitan Water Districts
Source: 2014 CAFR of each entity
Summary
To deal with projected growth in population, Utah will need to consider many water alternatives. Major categories of alternatives include more efficient use of existing water, the development of new supply projects, and changes in the use of existing water uses, in particular the change from agricultural uses to M&I use through free market transactions. Each alternative will have its pros and cons, its costs and its benefits, each of which should be closely considered and compared.
GOMB recommends that policymakers take the time to understand the details of both demand and supply alternatives to ensure that Utah has an adequate water supply for appropriate water usage levels and that to the extent that policymakers want to involve the state in financing of new supply projects, that the financing be accompanied by an increased emphasis on user fees and significantly more efficient use of water on the demand side.
Other Sources:
How Utah Water Works: An Overview of Sources, Uses, Funding, and Pricing, Office of Legislative Research and General Counsel, November 2012 le.utah.gov/interim/2012/pdf/00002706.pdf
Flowing Toward 2050: Utah’s Water Outlook, Utah Foundation, September 2014, www.utahfoundation.org/uploads/rr723.pdf
A Performance Audit of Projections of Utah’s Water Needs, Office of the Legislative Auditor General, May 2015, le.utah.gov/audit/15_01rpt.pdf
A Review of the Division of Drinking Water’s Minimum Source Sizing Requirements, Office of the Legislative Auditor General, December 2014, http://le.utah.gov/audit/14_13rpt.pdf
Utah's Municipal and Industrial Water Conservation Plan: Investing in the Future, Utah Division of Water Resources, December 2014, ww.water.utah.gov/OtherReports/M&IConservation_Revision_2012.pdf
Price of Water 2015: Up 6 Percent in 30 Major U.S. Cities; 41 Percent Rise Since 2010, Circle of Blue, April 2015, www.circleofblue.org/waternews/2015/world/price‐of‐water‐2015‐up‐6‐percent‐in‐30‐major‐u‐s‐cities‐41‐percent‐rise‐since‐2010/
$0
$10
$20
$30
$40
$50
$60
$70
$80
$90
$100
Central Utah JordanValley
Salt Lake &Sandy
WashingtonCounty
Weber Basin
$ im
Millions
FY 2014 Revenue Sources
Property Tax Water Charges Other State or Federal

GOMB 2015 Water Study 13
Appendix A
Governor’s FY 2017 Budget Recommendations
Water Section

BUDGET & POLICY BRIEFWATER
HIGHLIGHTS
$6 million (including $4 million General Fund)
to collect data and study water use
throughout the state
$460,000 to improve water data reporting
processes
$300,000 to invest in technology to improve
state facility water conservation
$300,000 for water conservation advertising
and rebates
$523,000 for water rights
adjudication to improve water rights certainty
$800,000 to help ensure safe drinking water
$130,000 for an inventory of canals
OBJECTIVE
To develop water funding policies and
mechanisms that ensure:
the State of Utah maintains a financial role
that is fiscally prudent and sustainable;
a sufficient, safe, and reliable supply of water
meets appropriate usage levels for a growing
population and balances residential,
commercial, recreational, agricultural, and
environmental uses;
Utah’s limited water resources are wisely
being used;
an appropriate alignment exists between the
costs of water and the use of water;
the water quality of our lakes, rivers, and
streams is protected; and
policymakers make informed financial
decisions regarding water based on accurate
and reliable data.
BACKGROUND
As one of the driest states in the country, water is
always a topic of concern within Utah. Although
the state as a whole is very dry, most of Utah’s
major population centers enjoy favorable
circumstances with higher precipitation rates than
the state average and close proximity to
mountains and their even higher precipitation and
snowpack. Snowpack offers a clean, annually
renewed water source that is largely delivered
by gravity to the state’s major population centers.
Some projections suggest future changes in
weather patterns and precipitation could affect
snowpack.
WATER USE
Figure 1 shows the distribution of diverted water
in Utah. Diverted water is generally categorized
into agricultural water (estimated 82%) and
municipal and industrial (M&I) water (estimated
18%). Of the 18% of diverted water that is M&I, an
estimated 3.5% of the statewide total
is residential indoor use; 6.5% residential outdoor
use; 2.5% commercial and industrial
use; 1.5% institutional use (such as governments
and schools); and 4% public non‐community
use, which includes certain industrial uses.
Recognizing that water use data reporting among
states is imperfect and sometimes based on
inconsistent methodologies, the U.S. Geological
Survey indicates that Utah has the highest per
capita M&I water use in the nation. The State of
Utah should continue to push for better data that
provides for better water use comparisons within
Utah and among other states.
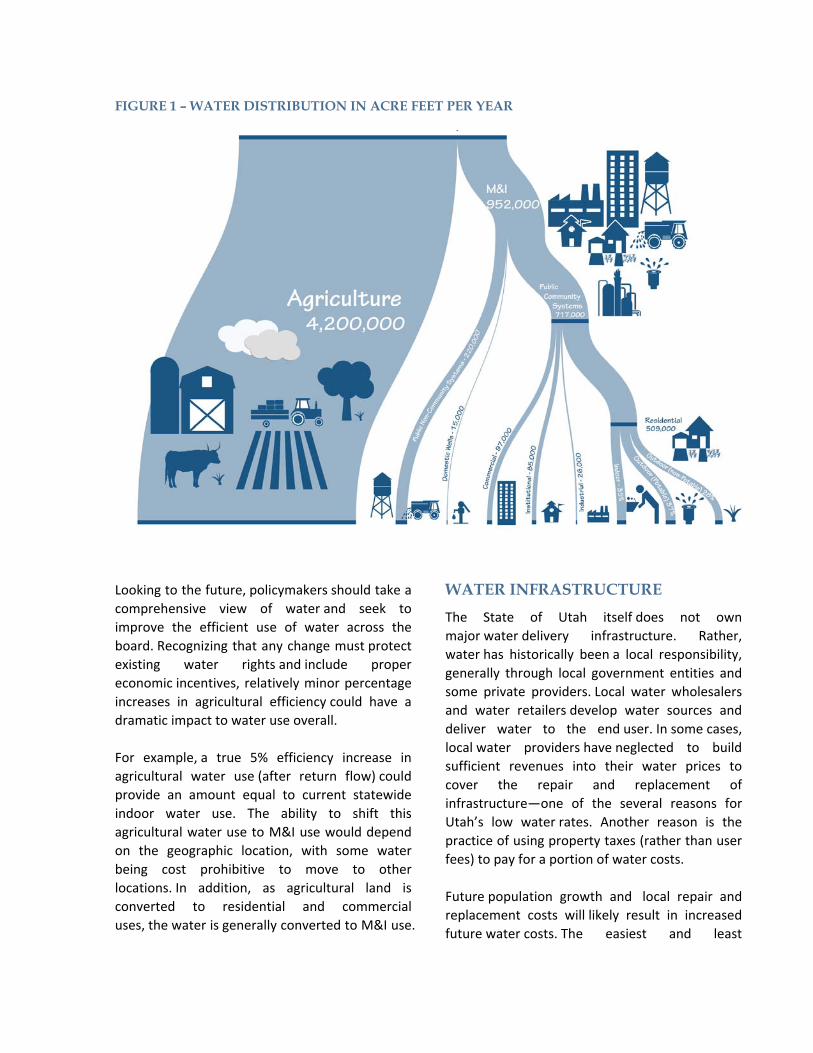
FIGURE 1 – WATER DISTRIBUTION IN ACRE FEET PER YEAR
Looking to the future, policymakers should take a
comprehensive view of water and seek to
improve the efficient use of water across the
board. Recognizing that any change must protect
existing water rights and include proper
economic incentives, relatively minor percentage
increases in agricultural efficiency could have a
dramatic impact to water use overall.
For example, a true 5% efficiency increase in
agricultural water use (after return flow) could
provide an amount equal to current statewide
indoor water use. The ability to shift this
agricultural water use to M&I use would depend
on the geographic location, with some water
being cost prohibitive to move to other
locations. In addition, as agricultural land is
converted to residential and commercial
uses, the water is generally converted to M&I use.
WATER INFRASTRUCTURE
The State of Utah itself does not own
major water delivery infrastructure. Rather,
water has historically been a local responsibility,
generally through local government entities and
some private providers. Local water wholesalers
and water retailers develop water sources and
deliver water to the end user. In some cases,
local water providers have neglected to build
sufficient revenues into their water prices to
cover the repair and replacement of
infrastructure—one of the several reasons for
Utah’s low water rates. Another reason is the
practice of using property taxes (rather than user
fees) to pay for a portion of water costs.
Future population growth and local repair and
replacement costs will likely result in increased
future water costs. The easiest and least
expensive water development projects have
already been completed. Future projects will be
very costly due to the nature of the projects
themselves, as well as increased environmental
review and permitting processes.
With Utah’s projected population growth in
mind, policymakers, water providers, and water
users must work together toward solutions that
lead to much greater conservation of existing
developed water; use existing infrastructure
more efficiently; and develop future water in
ways that are fiscally and environmentally
sustainable.
Assuming that current water usage levels
continue as‐is or only minor additional
conservation occurs, the demand for M&I water
is projected to exceed supply over the coming
decades as Utah’s population continues to grow.
Utahns have an important choice to make about
water use. The need for additional water supply
at some point is a given; however, the timing of
water system development varies dramatically
depending on changes in water usage. Increased
conservation could delay major development
projects for decades while the failure to conserve
water will lead to accelerated building schedules
and their associated increased costs sooner.
As previously mentioned, the U.S. Geological
Survey indicates that Utah has the highest per
capita M&I water use in the nation, even though
Utah’s water use has been estimated to be 18%
lower than the reported water use in a 2000
report commonly used as a benchmark. Some
existing projections assume little to no
improvement in the efficient use of water after
2025. If Utah’s water were used more
efficiently, the need for costly water
development projects could be postponed for
decades. However, if water use continues as‐is or
there are only minor additional conservation
efforts put into place, Utah will likely need to
develop costly water supply systems in the near
term.
Currently, about $36 million is earmarked from
state sales tax for water—an amount that
automatically increases with an increase in sales
tax revenues.
WATER CONSERVANCY DISTRICT FUNDING REQUEST
Considering current per‐capita usage, projected
population growth, and the condition of
infrastructure, a group representing large water
conservancy districts has identified $33 billion in
water projects they believe should be built in the
state over the next 45 years ($18 billion in repair
and replacement projects and $15 billion in new
projects). In some cases, a fair amount of
detail has been provided on the projects while in
other cases minimal detail is available. Given the
very long time period for these estimates, the
dollar amounts provided should be considered
a very rough approximation of future water
project costs.
Under the water conservancy district proposal,
existing local revenues would cover some of the
projects and new local revenues in the form
of property taxes or user fees would also be
required to cover all future water projects
identified. The proposal also suggests that state
tax revenues cover roughly $12 billion of the
estimated $33 billion.
Although the requested General Fund amount for
this year is currently at $35 million, the original
plan called for $100 million of ongoing revenue to
be allocated for these projects and it is likely
that similar large dollar amounts will be pursued
in the future.
Under the water conservancy district
proposal, the State of Utah would allocate
state General Fund tax revenues and issue
state bonds to pay for billions of dollars in major
water development projects. The State of Utah
would pay for all project costs up front, with
repayments to the state delayed to

begin from one to ten years after completion
of construction, depending on when water is
supplied. Given the state’s 20 year bonding
limit on general obligation bonds, this means
that state taxpayers would largely pay for the
bond prior to full annual repayment to the state
beginning.
The Lake Powell Pipeline Act (enacted in 2006)
and the Bear River Development Act (enacted in
1991) indicate that the projects are subject to
future funding decisions. Under the acts, once
projects are built, and repayments to the State of
Utah begin, full repayment would not be reached
for over 50 years. Repayments for 70% of the
project costs would be made within 50 years
after local entities take water that was
contracted for prior to construction. However,
the remaining 30% of project costs are
completely open‐ended, meaning no set time
period is in place for repayment to the state,
although this portion of the water must be repaid
within 50 years after the water is taken.
Repayments to the state would be made at an
indeterminate interest rate, which could be less
than the state’s borrowing costs. Under the
proposal, the State of Utah’s General Fund would
never be repaid and the ongoing allocation of tax
revenues would create a permanent sizable state
taxpayer subsidy for water development.
The request of the conservancy districts is
essentially for the State of Utah to assume the
role of financing water projects which was
previously filled by the federal government. It
should also be recognized that allocating state tax
revenues for major water development projects
constitutes a massive expansion of the state’s
role. Unlike the federal government, the State of
Utah balances its budget. This means that this
type of major funding expansion would ultimately
affect other state‐funded programs (in particular
education) or future tax levels.
Out of respect to the taxpayer, it is
recommended that the State of Utah only
allocate very scarce General Fund resources to
financing major water projects after all other
alternatives are exhausted (similar to how other
budget requests are treated) and the significant
concerns raised in the recent legislative audit on
water are resolved. Of particular concern is the
current pressure to the General Fund in meeting
core existing state government functions.
Prior to undertaking a major expansion to the
state’s role in water project funding, the
following minimum conditions should be met:
Local funding effort andincreased emphasis on user fees
BALLOTBOX
Transparency and localvoter engagement
100%
of ProjectPa
yment
Terms
Appropriate financing andrepayment terms

The details of these minimum conditions include:
Better water data and data reporting prior to
any state financing or funding,
including universal metering of water in all
areas that would receive state‐funded water
and three years of data reporting of water
usage under new state reporting standards to
be implemented in 2016.
Building upon previous efforts, the
implementation of new and meaningful
water conservation targets that strongly
emphasize improved water conservation,
including reductions of government water
use.
Independent validation, including a
comprehensive price elasticity and
repayment feasibility study, reporting of
water use data in CAFRs, and independent
validation of project costs.
Local funding effort and increased emphasis
on user fees, including local conservancy
districts paying up front for a meaningful
portion of the project itself (for example, the
federal government required a 35% local
contribution on recent projects); water rates
that reflect a local water user effort
demonstrating a strong local commitment
when compared with the water rates of other
state taxpayers that will be paying to finance
the projects and that fund needed local
repair and replacement projects; and
movement away from property taxes in favor
of user fees for water (which will enhance
economic incentives for conservation).
Transparency and local voter engagement
through public processes, including public
hearings disclosing projected water rate
increases and a local vote agreeing to the
project and associated state repayment,
including needed rate increases.
Appropriate financing and repayment terms,
including all interest capitalized into the loan;
an interest rate set in statute that reflects the
state’s borrowing costs (given the long
repayment period, either adjusting for
inflation or adjusting over time to reflect the
state’s latest borrowing rate); set
repayment period for 100% of the project
costs; payments that at least partially begin
concurrently with the state’s bond
repayment; and repayment directly to the
state General Fund rather than a revolving
loan fund so that the legislature has the
ability to prioritize each water project against
other state priorities.
Recognizing that the projects are not currently
funded and that current statutes will require
changes, ongoing discussions will be needed to
ensure appropriate terms are put in place prior to
the state allocating additional funds for these
purposes. The Governor recognizes the positive
efforts of stakeholders to date in encouraging
conservation, striving for improved water use
data, and planning for the future and welcomes
the opportunity to continue to work together to
find solutions that meet the appropriate water
needs of a growing population in a fiscally
prudent and conservative way.
GUIDING PRINCIPLES
The State of Utah should take a
comprehensive view of water
management. Policies and strategies must be
developed or better implemented to
encourage all water users (residential,
commercial, agricultural, and government) to
conserve water. Strategies include enhanced
public education, meaningful price signals,
use of emerging water‐saving technologies,
increasing wastewater reuse, encouraging
water‐wise landscaping, and the elimination
of conservation barriers in local and state
laws. Solutions should recognize the
increasing value of limited water resources as
growing demands stress existing supply and
maximize the efficient use of existing water
infrastructure and supplies.
Better data and greater transparency into
water usage and funding sources to help

policymakers and consumers make informed
decisions on how best to use and conserve
water. Better information and market price
signals such as user fees will allow market
forces to influence the use and conservation
of water.
Local governments should implement plans
to locally fund the repair and replacement of
local infrastructure, in particular when
receiving any state taxpayer funding or
financing. The State of Utah should adjust its
policies to remove any obstacles, real or
perceived, to local entities setting aside funds
to repair and replace their water
infrastructure.
Funding responsibility should increasingly
shift to end users. State involvement should
be prudent and fiscally sustainable. Further
earmarks should not be used. When state
funds are provided to assist water
development, local recipients should meet
basic criteria such as planning, maintenance,
appropriate rate structuring, and
conservation to advance the state’s overall
water goals. The state should continue to
support conservation strategies and
education.
The state water engineer must have the
administrative and legal tools sufficient to
efficiently enforce water rights law. The state
should improve its water right adjudication
process to clarify which water rights are valid
and bring more certainty and speed to water
transactions.
Increased use of private financing sources for
water development projects should be
encouraged.
BUDGET RECOMMENDATIONS
$6 million one‐time, including $4
million General Fund, to collect data and
study water use throughout the state,
including advanced metering to measure
water use in selected areas
$460,000 ($320,000 ongoing and $140,000
one‐time General Fund) to improve water
data reporting processes from local
government to state agencies so that
policymakers have better information
available to make major financial decisions
$300,000 one‐time to invest in water‐
wise technology to improve water
conservation at state facilities
$300,000 one‐time from an increase in the
water conservation earmark for water
conservation advertising campaigns and
rebates
$523,000 ($375,000 ongoing to include
$100,000 from water earmark increase and
$148,000 one‐time) for water rights
adjudication to improve certainty around
water rights
$800,000 to help ensure safe drinking water
$130,000 to finalize an inventory of canals in
the state
GOVERNOR’S OFFICE OF MANAGEMENT AND BUDGET
____________________________________________________________________________________
APPENDIX B – RECOMMENDED WATER FUNDING CONDITIONS Allocating state tax revenues for major water development projects constitutes a significant expansion of the state’s role. If undertaken, such a major expansion would ultimately affect other state-funded programs and/or future tax levels. Out of respect to the taxpayer, it is recommended that the State of Utah only allocate scarce state taxpayer resources to the financing of major water projects after other feasible alternatives have been exhausted and the significant concerns raised in the recent legislative audit are resolved.
Supporting the State’s Water Strategy Establish Criteria for Better Water Data and Data Reporting
The universal metering of all municipal and industrial (M&I) water for local governments or private entities that would receive state-financed water (including government water use) should be required prior to construction of state-financed water projects.
Uniform water data reporting standards should be developed in 2016. Using the new 2016 standards, local entities requesting state-financed water funding should be
required to provide the state (GOMB and LFA) and the general public with at least three years of detailed water use data including comparisons (by detailed type) to statewide water usage and, to the extent reliable and comparable data is available, water usage in other western states.
The Department of Natural Resources and the Department of Environmental Quality should be required to submit an annual water data report to GOMB and EAC.
Establish New Conservation Targets Based on Validated 2015 Water Use Levels
New and meaningful statewide targets should be established to achieve more efficient use of existing water. Given the near-completion of the 25% target and a recent legislative audit that raised concerns with the validity of some baseline data for the 25% target, new water efficiency targets could be created by basin as long as the new conservation targets are meaningful for all basins.
Local governments requesting state-financing of water projects should be required to show significant validated progress (80-90%) toward new conservation targets before any state funds are allocated for construction.
Conservation targets should include the requirement that local governments set the example for its citizens by reducing validated water use by the same percentage as the overall conservation target.
Continue to implement improved local landscaping ordinances that better recognize Utah’s dry climate and encourage water-efficient landscaping.
Continue to implement improved billing practices that better inform water users. Independent Verification
Once better water data reporting is in place, conduct a comprehensive pricing elasticity and repayment feasibility study for the project (competing estimates from proponents and opponents suggest an independent review is needed).
Update per capita water demand estimates from projections currently in place to a more detailed and comprehensive projection that uses the independent pricing and elasticity study and is made publicly available on state and local websites.
Ensure supply estimates incorporate all available water supply sources that local municipalities and other retailers can use (the legislative audit raised concerns with this issue).
Water Funding 2
Conduct an independent validation of projected project costs (for example, the $1 billion Lake Powell Pipeline figure has been in use for a number of years and costs will likely be higher by the time construction begins—possibly around $1.5-$2 billion).
Ensure aggregate level water data reported in local CAFRs and subject to audit and/or water data reporting submitted by someone who certifies accuracy under their professional license.
Focus on Local Efforts with Emphasis on Water Users Paying for Water According to Use
Require a 35 percent, up-front local contribution for any new projects. Ensure local effort and commitment as demonstrated through water user pricing that is among
the highest in the state (based on actual usage levels, not just the top block rate). It is difficult to justify asking those who pay high water rates (such as Ogden, Kearns, and Draper residents) to subsidize lower rates and pay for infrastructure in low rate water areas by diverting or increasing taxes statewide.
Establish water rates that fully fund sinking funds for long-term capital repair and replacement that are truly a local responsibility.
Over a reasonable period of time (possibly 20 years), implement plans to shift a reasonable portion of water district property taxes to user fees to ensure a financially viable “sweet spot” that generates sufficient revenues to meet obligations, but encourages conservation through more of a focus on user fees. For example, begin by moving O&M completely over to user fees, allow existing bonds to be repaid with property taxes, and identify new GO bonds to be paid for from user fees by using property taxes only as a guarantee, not a source, of repayment.
Transparency and Voter Engagement through Public Processes
Hold public hearings at both the local level and state level to disclose projected increases in user fees, water usage comparisons, etc., and provide ample time for public comment.
Provide the opportunity for a local vote on water projects that includes a disclosure of the expected future rate increases as detailed in an independent study. Because there are not direct elections for conservancy district boards, a vote of the people allows residents a chance to voice opinions directly on multi-generational repayment commitments.
Appropriate Financing and Repayment Terms
Ensure that state interest is capitalized into loans and that interest is charged on the state’s full costs.
Ensure that interest rates are established in statute (not by the Water Resources Board) and reflect the state’s opportunity costs. Given the long-term nature of water loans and the state’s opportunity cost of borrowing, interest rates should adjust over time to account for long-term inflation and possibly use the state’s most recent borrowing rate or an inflation index as a benchmark.
Ensure that construction does not begin until contracts are in place to repay 100% of the state loan over a fixed period of time (currently only 70% of project costs have a fixed time payment schedule—the remaining 30% are open-ended).
Establish shorter repayment periods than the +-65 years currently being considered (for example, a 30-40 year repayment schedule).
Ensure that repayments begin concurrently with the state loan repayment period—not 4 to 15 years later.
Ensure that repayments are made to the state General Fund so that future water projects can be individually prioritized by the legislature.
Ensure that any water bond authorization is prioritized against all other state bonding needs.

Summary of Elasticity Studies 1
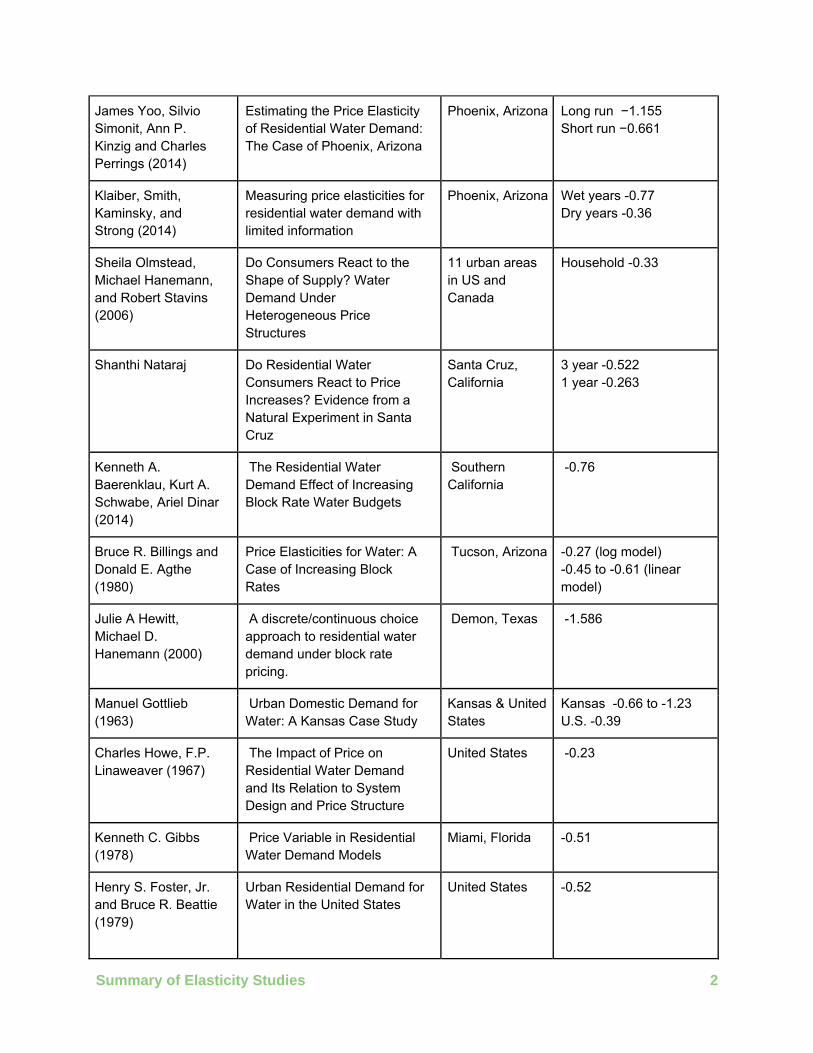
Appendix C - Summary of Elasticity Studies
Study author(s)/ Year
Title Area Studied
Price Elasticity of Demand Estimates
Eric Coleman (2009) A Comparison of Demand-Side Water Management Strategies Using Disaggregate Data
Salt Lake City, Utah
Long run −0.485Short run −0.391 Summer −1.445 Winter −0.378 Residential −0.413 Non-residential −0.665
Central Utah Water Conservancy District (1995)
Water Pricing Policy Report Utah Residential -0.592 Commercial -0.25 Industrial -0.25 Total M&I -0.50 Agricultural -0.20
Erickson (1991) The Effect of Dual Systems on Price Elasticity of Residential Water Demand
Utah -0.487 to -0.593
Hansen and Narayanan (1981)
A Monthly Time Series Model of Municipal Water Demand
Utah -0.469
Jasper M. Dalhuisen, Raymond J. G. M. Florax, Henri L. F. de Groot and Peter Nijkamp (2003)
Price and Income Elasticities of Residential Water Demand: A Meta-Analysis
Meta-analysis of many price elasticity estimates
-0.41
Epsy, Epsy, and Shaw (1997)
Price Elasticity of Residential Demand for Water: A Meta-Analysis
Meta-analysis of many price elasticity estimates
Average -0.51 Long run median -0.64 Short run median -0.38
Benedykt Dziegielewski (2003)
Strategies for Managing Water Demand
Meta-analysis of many price elasticity estimates
Total urban -0.40 Residential -0.33 Nonresidential -0.54 Commercial -0.34 Industrial -0.58 Institutional -0.47 Agricultural -0.46
Kenneth A. Baerenklau, Kurt A. Schwabe, Ariel Dinar (2014)
Do Increasing Block Rate Water Budgets Reduce Residential Water Demand? A Case Study in Southern California
Eastern Municipal Water District, California
-0.69
Summary of Elasticity Studies 2
James Yoo, Silvio Simonit, Ann P. Kinzig and Charles Perrings (2014)
Estimating the Price Elasticity of Residential Water Demand: The Case of Phoenix, Arizona
Phoenix, Arizona Long run −1.155Short run −0.661
Klaiber, Smith, Kaminsky, and Strong (2014)
Measuring price elasticities for residential water demand with limited information
Phoenix, Arizona Wet years -0.77Dry years -0.36
Sheila Olmstead, Michael Hanemann, and Robert Stavins (2006)
Do Consumers React to the Shape of Supply? Water Demand Under Heterogeneous Price Structures
11 urban areas in US and Canada
Household -0.33
Shanthi Nataraj Do Residential Water Consumers React to Price Increases? Evidence from a Natural Experiment in Santa Cruz
Santa Cruz, California
3 year -0.522 1 year -0.263
Kenneth A. Baerenklau, Kurt A. Schwabe, Ariel Dinar (2014)
The Residential Water Demand Effect of Increasing Block Rate Water Budgets
Southern California
-0.76
Bruce R. Billings and Donald E. Agthe (1980)
Price Elasticities for Water: A Case of Increasing Block Rates
Tucson, Arizona -0.27 (log model)-0.45 to -0.61 (linear model)
Julie A Hewitt, Michael D. Hanemann (2000)
A discrete/continuous choice approach to residential water demand under block rate pricing.
Demon, Texas -1.586
Manuel Gottlieb (1963)
Urban Domestic Demand for Water: A Kansas Case Study
Kansas & United States
Kansas -0.66 to -1.23 U.S. -0.39
Charles Howe, F.P. Linaweaver (1967)
The Impact of Price on Residential Water Demand and Its Relation to System Design and Price Structure
United States -0.23
Kenneth C. Gibbs (1978)
Price Variable in Residential Water Demand Models
Miami, Florida -0.51
Henry S. Foster, Jr. and Bruce R. Beattie (1979)
Urban Residential Demand for Water in the United States
United States -0.52

Summary of Elasticity Studies 3
R. Bruce Billings (1982)
Specification of Block Rate Price Variables in Demand Models.
Tucson, Arizona -0.70
J.E. Schefter and E.L. David (1985)
Estimating Residential Water Demand under Multipart Tariffs Using Aggregate Data.
Wisconsin -0.12
David L. Chicoine, Steven C. Deller, and Ganapathi Ramamurthy (1986)
Water Demand Estimation Under Block Rate Pricing: A Simultaneous Equation Approach
Illinois -0.71
David L. Chicoine and Ganapathi Ramanurthy (1986)
Evidence on the Specification of Price in the Study of Domestic Water Demand
Illinois -0.48
Michael L. Nieswiadomy and David J. Molina (1989)
Comparing Residential Water Demand Estimates under Decreasing and Increasing Block Rates Using Household Data.
Denton, Texas -0.36 to -0.86
Mary E. Renwick and Sandra O. Archibald (1997)
Demand Side Management Policies for Residential Water Use: Who Bears the Conservation Burden
California -0.33
R.G. Taylor, John R. McKean, and Robert A. Young (2004)
Alternative price specifications for estimating residential water demand with fixed fees.
Colorado -0.416
Donald E. Agathe and Bruce R. Billings (1987)
Equity, price elasticity, and household income under increasing block rates for water
Tucson, Arizona Low Income -0.565Medium Income -0.49 Upper Income -0.46 High Income -0.397