Embed Size (px)
Citation preview

Going Public: U.S. IPO ReportFirst Half 2019

Going Public: U.S. IPO ReportFirst Half 2019
2
EXECUTIVE SUMMARY
Despite some large high profile IPOs, the broader trend has been away from Mega IPOs and toward smaller cap IPOs. Although H1 2019 saw the initial public offerings of high profile issuers like Uber, Pinterest and Chewy, smaller IPOs and smaller companies dominated the H1 2019 IPO market, with approximately 65% of deals under $300 million (but above $75 million) and 83% of the issuers in our survey qualifying as “Emerging Growth Companies”, most of whom are taking advantage of the JOBS Act accommodations.
This was even more pronounced in the Healthcare industry, where over 90% of IPOs were under $300 million, and half were under $100 million.
Of Healthcare EGC issuers, approximately 70% were pre-revenue, 43% had “going concerns” in their audit reports and all went public reporting a net loss over the last few years.
Although the time through the SEC remains consistent, the SEC process continues to be streamlined with a continued low average number of comments. The average time from first submission to pricing was just over four months (131 days, with a median of 111 days). Issuers saw an average of three comment letters, with an average of 15.9 comments in the first letter.
“Cheap Stock” comments continued to be prevalent particularly among Healthcare issuers.
Industrials issuers also continued to see comments regarding segment presentation.
Technology, Media and Telecom (“TMT”) issuers had a high concentration of comments regarding revenue recogni-tion
The number of IPOs with a secondary offering continues to be low, but when there is a secondary manage-ment is typically participating. Only 20% of IPOs included a secondary offering, and no IPOs under $100 million included a secondary offering. When secondary offerings were contemplated, management was reported as a partici-pant 70% of the time.
Insiders as anchor investors in the IPO. Almost 30% of IPOs saw insiders participating in the IPO, with approxi-mately 90% of the IPOs disclosing the insider in the preliminary prospectus at the launch of the road show. The data suggests that there has been a shift to intentional participation of insiders at the outset of the IPO as a means of mar-keting instead of insiders coming into the deal closer to pricing as a means of helping a deal that may be having trouble after launch.
Overall solid pricing of IPOs in 1H 2019. Over 75% of issuers priced at or above the midpoint of the pricing range set before their road show, however notably:
Of IPOs $100 million or more, over 85% priced at the midpoint or higher.
Of IPOs under $100 million, over half priced below the midpoint.
Healthcare issuers paced below average, while almost all TMT issuers priced at the midpoint or higher.
Governance provisions continue to trend towards “entrenchment mechanisms.” Governance provisions con-tinue to trend towards what some institutional investors call “entrenchment mechanisms,” with approximately one-third of issuers adopting a multiclass voting structure, over 80% of issuers having classified boards and 40% combining the roles of Chairperson and CEO.
Trend toward issuers with multiclass voting structures that are 20:1 or 10:1, which seems to be more aggressive than the historical 3:1 and 5:1 structures. Of those issuers adopting multiclass voting structures, approximately 70% had 10:1 ratio while approximately 30% had a 20:1 ratio.
Going Public: U.S. IPO ReportFirst Half 2019
3
Shareholder enfranchisement declining—only about a third of issuers allow shareholders to act by written consent, a third allow shareholders to call special meetings, over 90% have advance notice bylaws, and over 80% are adopt-ing forum selection clauses. Majority voting is less common, with less than 15% of IPO issuers requiring majority voting in uncontested elections.
Issuers with larger IPOs (over $750 million) are a bit more shareholder friendly—over 40% allow shareholders to call special meetings; over 40% allow shareholders to act by written consent, but over 70% had multiclass voting structures (higher than market average) and over 85% had classified boards (in line with market average).
Issuers with medium sized IPOs ($300-750M) are even more shareholder friendly, with 60% allowing sharehold-ers to act by written consent and 60% allowing shareholders to call special meetings, but 60% had multiclass voting structures (higher than market average) and 80% had classified boards (in line with market average).
Smaller IPOs (those under $300M) were against the market trend—only 15% had multiclass structures, but clas-sified boards (over 80%); less likely to separate Chairperson and CEO (about half did this); with 22% allowing shareholders to act by written consent and 26% allowing shareholders to call special meetings.
Equity stock ownership programs continue to be an important and common feature of companies going public. Employee stock ownership programs—through equity compensation plans and employee stock purchase programs—are frequently adopted in a way that do not require further shareholder approval to increase the amount of shares that can be issued, thereby building in an automatic dilution of the public shares.
On average, these equity compensation plans reserve for issuance shares equal to approximately 11.5% of the outstanding post-IPO public float.
Over 70% of IPO issuers are going public with equity compensation plans that contain “evergreen” provisions that automatically increase the number of shares reserved for issuance under the plans without requiring further share-holder approval.
For IPOs of less than $300M, this number jumps closer to 80%, and 100% of Healthcare IPOs had evergreen provisions.
Almost 70% of issuers are also going public with employee stock purchase programs, most with similar “ever-green” provisions.
Foreign Private Issuers (FPIs) continue to access the U.S. IPO market. The U.S. IPO market experienced an uptick in China-based issuers, many of which were organized in the Cayman Islands, which represented 40% of all FPIs for 1H’19. Somewhat surprisingly, 80% of FPIs elected to present their financials under U.S. GAAP instead of relying on accommodations for FPIs to present under IFRS. The FPIs in our study were listing exclusively in the United States, and as such, implementing an accounting system for the first time likely meant that they did not have other foreign stock exchange considerations driving them towards adoption of IFRS.
Relatively high incidence of private placements prior to or concurrently with IPO. Approximately 51% of IPOs had a private placement within in a year prior to filing the IPO registration statement and approximately 36% of IPOs disclosed a private placement simultaneously with the IPO.
Approximately 85% of Healthcare IPOs followed private placements prior to or concurrent with IPO, as did approxi-mately 70% of IPOs under $100 million.
This trend is likely driven by the fact that many Healthcare issuers in our study were pre-revenue, and thus were relatively early in their lifecycles.
Underwriting discounts were dependent upon deal size. All IPOs of $300 million or more featured underwriting discounts less than 7% while 90% of IPOs under $100 million featured underwriting discounts at 7%. Underwriting discounts ranged from 1.30% (for high profile Uber) to 8.30%, with a median of 7.00% and an average of 6.20%.

Going Public: U.S. IPO ReportFirst Half 2019
4
SUMMARY OF METHODOLOGY
This study covers 35 issuers that priced IPOs in the first half of 2019: 31 domestic issuers and 4 foreign private issuers. Our population is reflective of the total population in the first half of 2019 based on industry and size.
The criteria for our study included:
Listing on a U.S. exchange; and
Minimum deal size of approximately $75 million in the final prospectus.
Our study excluded special purpose acquisition companies (SPACs), real estate investment trusts (REITs) and business development companies (BDCs).
For purposes of certain data relating to foreign private issuers, as noted in certain sections of the report, data reflects ten foreign private issuer IPOs in the U.S. in the first half of 2019 with a base deal size over $75 million.
Data was compiled from publicly filed (i) registration statements on Form S-1 and Form F-1; (ii) final prospectuses; and (iii) SEC comment letters.
Stock performance information was sourced from Yahoo Finance. The closing price of stock was determined as of the date the transaction closed. In the event a date fell on a day that the stock exchange was closed, the prior day’s closing price was used.
All data was complied, reviewed and analyzed by Paul Hastings capital markets attorneys, and practice intelligence and knowledge attorneys.

Going Public: U.S. IPO ReportFirst Half 2019
5
IPO Market by Base Deal Size
IPO Market by Industry Group

Going Public: U.S. IPO ReportFirst Half 2019
6
TIMING FROM FIRST SUBMISSION TO PRICING
Median Number of Days between Issuers’ Initial Submission and Pricing
Median Number of Days between Submission and Pricing (Industry Group)
IPO Timing and SEC Review
111 The market median from issuers’ first submission to eventual pricing was 3.7 months.
The Healthcare and TMT industry sectors experienced shorter timelines, outpacing the market median by as much as two weeks faster.
The Consumer Retail, Financial, and Industrials industry sectors exhibited longer timing, lagging behind market by as much as a month.
Going Public: U.S. IPO ReportFirst Half 2019
7
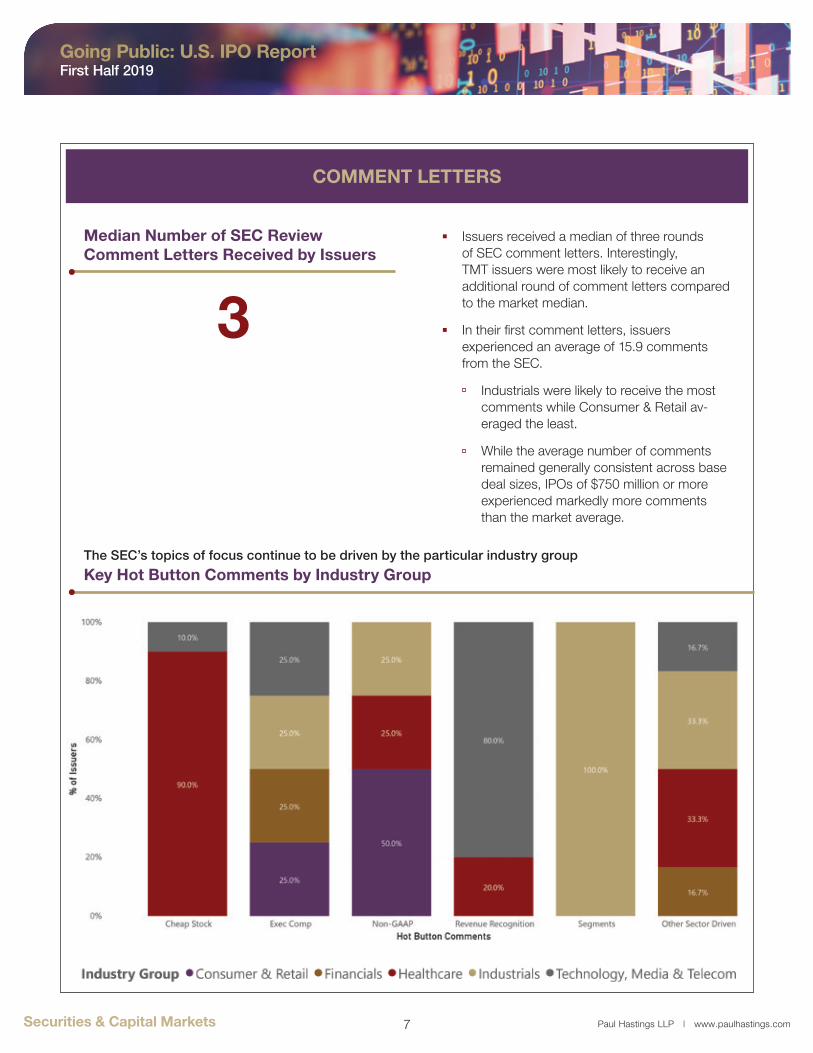
COMMENT LETTERS
3
Issuers received a median of three rounds of SEC comment letters. Interestingly, TMT issuers were most likely to receive an additional round of comment letters compared to the market median.
In their first comment letters, issuers experienced an average of 15.9 comments from the SEC.
Industrials were likely to receive the most comments while Consumer & Retail av-eraged the least.
While the average number of comments remained generally consistent across base deal sizes, IPOs of $750 million or more experienced markedly more comments than the market average.
Median Number of SEC Review Comment Letters Received by Issuers
Key Hot Button Comments by Industry GroupThe SEC’s topics of focus continue to be driven by the particular industry group

Going Public: U.S. IPO ReportFirst Half 2019
8
COMMENT LETTERS
Average No. SEC Comments First Letter (Industry Group)
Average No. SEC Comments First Letter (Base Deal Size)

Going Public: U.S. IPO ReportFirst Half 2019
9
COMMENT LETTERS
Issuers have been largely successful addressing the SEC’s first round of comments, and received an average of only 4.2 comments by the second letter, more than 10 comments fewer than the average in the first letter.
Notably, while the average number of comments in the second letter remained generally consistent across base deal sizes, IPOs of $750 million or more experienced markedly more comments than the market average.
Average Number of SEC Comments Second Letter (Industry Group)
Average Number of SEC Comments Second Letter (Industry Group)

Going Public: U.S. IPO ReportFirst Half 2019
10
Issuer Profile: Financial Background of 2019 IPO Issuers
EMERGING GROWTH COMPANIES AND JOBS ACT ACCOMMODATIONS
The market is supporting use of the JOBS Act accommodations for EGCs:
Approximately 75% of EGC issuers presented two years of audited financial statements instead of the three years required for non-EGCs.
Approximately 69% of EGC issuers are presenting two years of selected financial information instead of the five years required for non-EGCs.
A review of SEC comment letters indicates that more than half of EGC issuers are testing the waters in advance of their IPOs—a trend that will likely increase following the SEC’s recent adoption of rules that expand testing the waters to all issuers, regardless of size or reporting status.
More than half of EGC issuers are opting to defer implementation of new or revised financial accounting standards.
Historical Period of Audited Financials by EGCs
Historical Period of Selected Financial Information Disclosed by EGCs

Going Public: U.S. IPO ReportFirst Half 2019
11
FINANCIAL PRESENTATIONS
Issuers are increasingly going public with what historically were considered marketing issues relating to their financial condition, financial statements or financial systems.
Approximately 29% of IPO issuers went public with the disclosure of a material weakness in their internal control over financial reporting.
Over 20% of IPO issuers went public with a “going concern” in their audit report for the most recently completed fiscal year.
Over 40% of the healthcare issuers in our study went public with a “going concern.”
% of Issuers Disclosing a Material Weakness of Internal Control Over Financial Reporting
% of Issuers with Going Concern

Going Public: U.S. IPO ReportFirst Half 2019
12
FINANCIAL PRESENTATIONS
Almost 30% of IPO issuers in our study were pre-revenue.
These issuers were predominantly in the Healthcare sector, where almost 70% of the IPO issuers were pre-revenue.
No issuer with an IPO over $750 million was pre-revenue.
Over 70% went public with a GAAP net loss.
100% of the Healthcare issuers in our study went public with a net loss.
Over 70% of issuers with an IPO over $750 million went public with a net loss.
% of Issuers at “Pre-Revenue”
% of Issuers Presenting a Net Loss

Going Public: U.S. IPO ReportFirst Half 2019
13
% Disclosing EBITDA or Adjusted EBITDA
Accounting Addbacks to Adjusted EBITDA
“Other” included items such as other income or expenses, contingent considerations, acquisition-related costs, strategic project costs, non-cash rent, non-routine items, depletion, purchase accounting adjustments, net foreign currency losses, environmental remediation costs, and financing-related expenses.
Use of EBITDA or Adjusted EBITDA are present in over 40% of IPO prospectuses, while the SEC continues to make comments regarding presentation of non-GAAP financial measures.
In addition to adjustments for income taxes, interest expense, depreciation and amortization, issuers presenting Adjusted EBITDA are also making add-backs for stock-based compensation, impairment charges, IPO-related costs, and acquisition and disposition related costs.
Over 85% of issuers with IPOs over $750 million disclosed EBITDA or Adjusted EBITDA.

Going Public: U.S. IPO ReportFirst Half 2019
14
UNDERWRITING DISCOUNT, PRICING AND LOCK-UP
Underwriting discounts were dependent upon deal size.
All IPOs of $300 million or more featured underwriting discounts less than 7% while 90% of IPOs under $100 million featured underwriting discounts at 7% or greater.
Underwriting discounts ranged from 1.30% (for high profile Uber) to 8.30% with a median of 7.00% and an average of 6.20%.
IPO pricing was solid in the first half of 2019. Over 75% of issuers priced at or above the midpoint, however notably:
Of IPOs $100 million or more, over 85% priced at the midpoint or higher.
Of IPOs under $100 million, over half priced below the midpoint.
Healthcare issuers paced below average while almost all TMT issuers priced at the midpoint or higher.
% of Issuers Pricing Above, Below or at the Disclosed Midpoint Price
Market Trends of Underwriting Discounts

Going Public: U.S. IPO ReportFirst Half 2019
15
Issuers’ Disclosure Regarding the Amount of Pre-IPO Shares Subject to a Post-IPO Lock-Up
Issuers are not disclosing the exact percentage of their shares that are subject to IPO lock-ups – more than two-thirds of issuers disclosed that “substantially all” of their outstanding pre-IPO shares would be subject to the post-IPO lock-up, compared to less than one-third of issuers disclosing a specific percentage of their shares being subject to the lock-up.
Breakdown of Bookrunners Entitled to a Lock-Up Release

Going Public: U.S. IPO ReportFirst Half 2019
16
% with Directed Share Programs
% of IPOs Involving Purchases by Issuer’s Insiders (Excluding Directed Share Programs)
Average % of the Base Deal Size Purchased by Issuers’ Insiders
36.6%
In IPOs where insiders participated in the offering, almost all issuers disclosed such participation prior to launch of the roadshow. Notably, larger issuers have not experienced significant participation by their insiders in their offerings.
Of IPOs over $300 million, almost no insiders participated in their company’s offering.
Issuers in the TMT and Industrials sector reported no insider participation, while almost two-thirds of issuers in the Healthcare sector reported insider participation.
Insider participation comprised on average 36.6% of the base deal proceeds.
Average % of the Base Deal Size Subject to the Direct Share Program
7.4% About half of the IPOs offered directed share
programs. Direct share programs comprised on average 7.4% of the base deal proceeds.
% of IPOs with a Secondary Offering Component
Sponsors appeared less likely to exit at IPO. Only 20% of IPOs included a secondary offering, and no IPOs under $100 million included a secondary offering. When secondary offerings were contemplated, management was reported as a participant 70% of the time.
Going Public: U.S. IPO ReportFirst Half 2019
17
Structure, Governance, Voting and Anti-Takeover Provisions
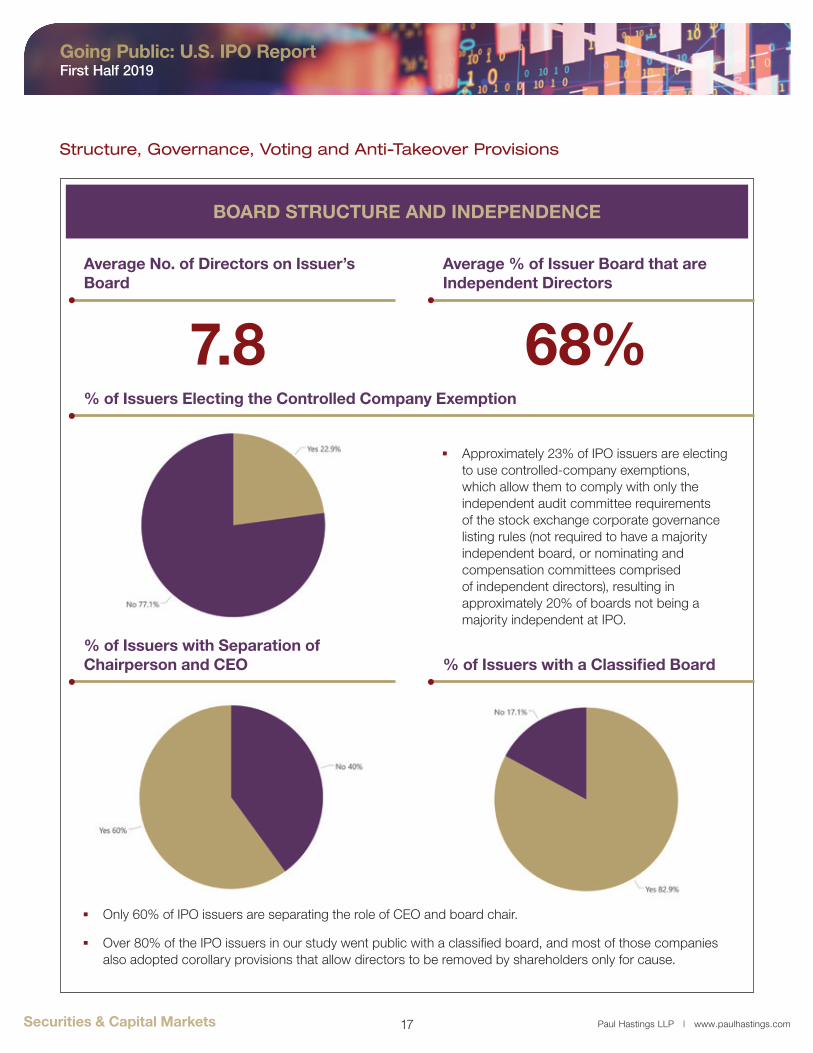
BOARD STRUCTURE AND INDEPENDENCE
Approximately 23% of IPO issuers are electing to use controlled-company exemptions, which allow them to comply with only the independent audit committee requirements of the stock exchange corporate governance listing rules (not required to have a majority independent board, or nominating and compensation committees comprised of independent directors), resulting in approximately 20% of boards not being a majority independent at IPO.
% of Issuers Electing the Controlled Company Exemption
Only 60% of IPO issuers are separating the role of CEO and board chair.
Over 80% of the IPO issuers in our study went public with a classified board, and most of those companies also adopted corollary provisions that allow directors to be removed by shareholders only for cause.
% of Issuers with Separation of Chairperson and CEO % of Issuers with a Classified Board
Average No. of Directors on Issuer’s Board
7.8
Average % of Issuer Board that are Independent Directors
68%

Going Public: U.S. IPO ReportFirst Half 2019
18
VOTING
Approximately one-third of IPO issuers are adopting dual class structures in which founders or majority shareholders retain high vote stock and issuing low vote stock to the public.
Of those issuers adopting multiclass voting structures, approximately 70% had a 10:1 voting ratio while approximately 30% had a 20:1 voting ratio. We note there has been a movement from historically lower ratios, 5:1 or 3:1 voting ratios, to the much higher ratios seen today.
Over 85% of IPO issuers are adopting bylaw provisions requiring that directors are elected by plurality vote in uncontested elections, as opposed to less than 15% requiring majority vote for uncontested elections.
Approximately 75% of IPO issuers are including provisions requiring at least one type of shareholder vote to require a supermajority vote—mostly 66 2/3% votes, but approximately 10% of the companies with a supermajority vote standard require such a vote to be 75%.
Over 90% of IPO issuers have authorized blank check preferred stock.
Issuers with Multiple v. Single Classes of Stock
Issuers Adopting Plurality v. Majority Voting for Director Elections
Issuers with 20:1 v. 10:1 Supervoting Rights
% of Issuers with Matters Requiring Supermajority Voting

Going Public: U.S. IPO ReportFirst Half 2019
19
ANTI-TAKEOVER PROVISIONS
Approximately one-third of IPO issuers are allowing shareholders to act by written consent, and only about one third of IPO issuers allow shareholders to call special meetings.
Almost 95% of IPO issuers are including advance notice bylaws (require shareholders to submit nominees and proposals for consideration at shareholder meetings in advance of the meeting).
Over 80% of issuers are including forum selection bylaw clauses (require shareholders to bring suit in a specific forum—such as Delaware corporations requiring shareholder suits to be brought in Delaware Chancery Court).
% of Issuers Allowing for Shareholder Actions by Written Consent
% of Issuers with Advance Notice Bylaws
% of Issuers Providing for Shareholder Rights to Call Special Meetings
% of Issuers Containing Forum Selection Clauses

Going Public: U.S. IPO ReportFirst Half 2019
20
EQUITY INCENTIVE PLANS
Average % of Issuers’ Outstanding Stock Reserved for Equity Incentive Plans
% of Equity Incentive Plans with an Evergreen Provision
11.5%
Employee stock ownership programs—through equity compensation plans and employee stock purchase programs—are frequently adopted in a way that do not require further shareholder approval to increase the amount of shares that can be issued, thereby building in an automatic dilution of the public shares.
On average, these equity compensation plans reserve for issuance shares equal to approximately 11.5% of the outstanding post-IPO public float.
% of Issuers Adopting an Employee Stock Purchase Plan
Over 70% of IPO issuers are going public with equity compensation plans that contain “evergreen” provisions that automatically increase the number of shares reserved for issuance under the plans without requiring further shareholder approval.
For IPOs of less than $300M, this number jumps closer to 80%, and 100% of Healthcare IPOs had evergreen provisions.
Almost 70% of issuers are also going public with employee stock purchase programs, most with similar “evergreen” provisions.
ESPPs allow employees of public companies to purchase company shares, usually at a discount to market prices.
Going Public: U.S. IPO ReportFirst Half 2019
21
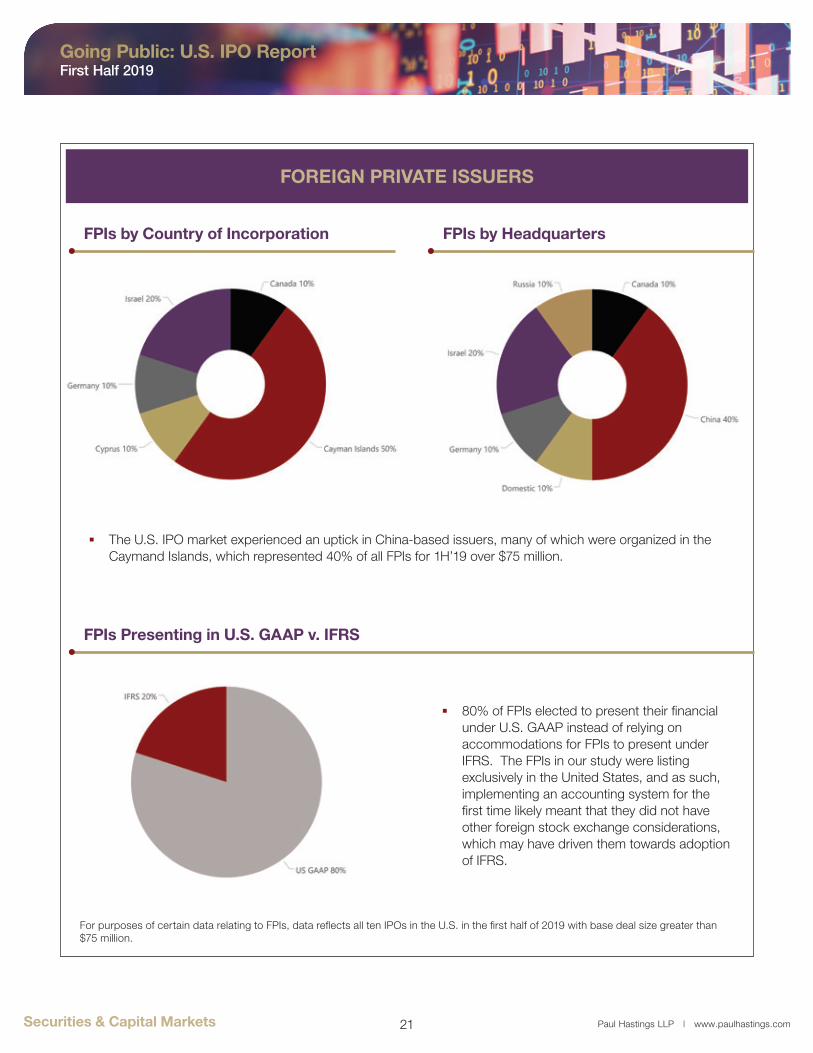
FOREIGN PRIVATE ISSUERS
FPIs by Country of Incorporation
The U.S. IPO market experienced an uptick in China-based issuers, many of which were organized in the Caymand Islands, which represented 40% of all FPIs for 1H’19 over $75 million.
FPIs Presenting in U.S. GAAP v. IFRS
80% of FPIs elected to present their financial under U.S. GAAP instead of relying on accommodations for FPIs to present under IFRS. The FPIs in our study were listing exclusively in the United States, and as such, implementing an accounting system for the first time likely meant that they did not have other foreign stock exchange considerations, which may have driven them towards adoption of IFRS.
FPIs by Headquarters
For purposes of certain data relating to FPIs, data reflects all ten IPOs in the U.S. in the first half of 2019 with base deal size greater than $75 million.

Going Public: U.S. IPO ReportFirst Half 2019
22
David FlechnerPartner, São Paulo/New York
Will BurnsPartner, Houston+1.713.860.7352
Sam EldredgePartner, Palo Alto+1.650.320.1838
Yariv KatzPartner, New York+1.212.318.6393
Teri O’BrienPartner, San Diego+1.858.458.3031
Jonathan KoPartner, Los Angeles
Frank LopezPartner, New York+1.212.318.6499
Meagan OlsenPartner, Los Angeles
Our Contacts
James SheaOf Counsel, New York
+1(212) [email protected]
Keith PisaniOf Counsel, New York
Mike ZupponePartner, New York+1.212.318.6906
To discuss this report in more detail, please contact one of the lawyers below or any member of our Securities and Capital Markets practice:

Going Public: U.S. IPO ReportFirst Half 2019
23
21 Offices1 Legal Team
Across the Americas, Asia and Europe
To integrate with the strategic goals of your business
Global Resources
The Americas
AtlantaCentury City
ChicagoHouston
Los AngelesNew York
Orange CountyPalo Alto
San DiegoSan Francisco
São PauloWashington, D.C.
Europe
BrusselsFrankfurtLondon
Paris
Asia
BeijingHong Kong
SeoulShanghai
Tokyo

Going Public: U.S. IPO ReportFirst Half 2019
24
The Americas
Atlanta1170 Peachtree Street, N.E.Suite 100Atlanta, GA 30309t: +1.404.815.2400f: +1.404.815.2424
Century City1999 Avenue of the StarsLos Angeles, CA 90067t: +1.310.620.5700f: +1.310.620.5899
Chicago71 S. Wacker DriveForty-fifth FloorChicago, IL 60606t: +1.312.499.6000f: +1.312.499.6100
Houston600 Travis StreetFifty-Eighth FloorHouston, TX 77002t: +1.713.860.7300f: +1.713.353.3100
Los Angeles515 South Flower StreetTwenty-Fifth FloorLos Angeles, CA 90071t: +1.213.683.6000f: +1.213.627.0705
New York200 Park AvenueNew York, NY 10166t: +1.212.318.6000f: +1.212.319.4090
Europe
BrusselsAvenue Louise 480-5B1050 BrusselsBelgiumt: +32.2.641.7460f: +32.2.641.7461
FrankfurtTaunusTurmTaunustor 160310 Frankfurt am MainGermanyt: +49.69.907485.0f: +49.69.907485.499
London100 BishopsgateLondon EC2N 4AGUnited Kingdomt: +44.20.3023.5100f: +44.20.3023.5109
Paris32, rue de Monceau 75008 ParisFrancet: +33.1.42.99.04.50f: +33.1.45.63.91.49
Orange County695 Town Center DriveSeventeenth FloorCosta Mesa, CA 92626t: +1.714.668.6200f: +1.714.979.1921
Palo Alto1117 S. California Ave.Palo Alto, CA 94304t: +1.650.320.1800f: +1.650.320.1900
San Diego4747 Executive DriveTwelfth Floor San Diego, CA 92121t: +1.858.458.3000f: +1.858.458.3005
San Francisco101 California StreetForty-Eighth FloorSan Francisco, CA 94111t: +1.415.856.7000f: +1.415.856.7100
São PauloAv. Presidente Juscelino Kubitschek, 2041Torre D, 21º andarSao Paulo, SP04543-011Brazilt: +55.11.3521.7109f: +1.212.230.7647 Washington, D.C.875 15th Street, N.W.Washington, D.C. 20005t: +1.202.551.1700f: +1.202.551.1705
Asia
BeijingSuite 2601, 26/F Yintai Center Office Tower 2 Jianguomenwai Avenue Chaoyang District Beijing 100022 PRCt: +86.10.8567.5300f: +86.10.8567.5400
Hong Kong21-22/F Bank of China Tower1 Garden RoadCentral Hong Kongt: +852.2867.1288f: +852.2526.2119
Seoul33/F West Tower Mirae Asset Center126, Eulji-ro 5-gil, Jung-gu Seoul, 04539, Koreat: +82.2.6321.3800f: +82.2.6321.3900
Shanghai43/F Jing An Kerry Center Tower II1539 Nanjing West RoadShanghai 200040, PRCt: +86.21.6103.2900f: +86.21.6103.2990
TokyoArk Hills Sengokuyama Mori Tower40th Floor, 1-9-10 RoppongiMinato-ku, Tokyo 106-0032Japant: +81.3.6229.6100f: +81.3.6229.7100
Our Offices