Embed Size (px)
Citation preview
GNURadio as a digital signal processingenvironment: application to acoustic wireless sensor
measurement and time & frequency analysis ofperiodic signals
J.-M FriedtSENSeOR, c/o FEMTO-ST Time & Frequency, Besancon, France
Email: [email protected]
Abstract—The flexibility, reconfigurability and stability ofsoftware defined radio yield an attractive alternative to the analogstrategy of probing acoustic transducers acting as passive sensorsprobed through a wireless link or to phase noise characterizationof oscillators. However, developing processing blocks is a timeconsuming activity, yet metrology applications require a dedicatedunderstanding of each processing step. We consider GNURadio asa means of exploiting opensource software as an optimum tradeoffbetween software re-usability yet compatible with an audit forassessing performance. This signal processing environment isdemonstrated on two practical examples, FMCW probing ofacoustic delay lines acting as sensors, and quartz tuning forkcharacterization. Both examples are considered as introductorysetups for training and teaching yet a suitable environment forresearch activities.
I. INTRODUCTION
Digital signal processing has been identified as a significantimprovement over analog signal processing for a number ofreasons [1], [2], including stability, flexibility and accuracy.Respectively, digital signal processing is not prone to com-ponent aging or drift over time; is reconfigurable in orderto update algorithms or parameters in order to perform newfunctionalities on a given hardware; and provides a pre-defined,quantitative computation accuracy given the size of the handleddatasets. Digital signal processing is nowadays ubiquitous andthe mostly infinite computational power available yields to thetrend of Software Defined Radio [3], in which general purposeradiofrequency source and sampling hardware is used for soft-ware processing of the recorded data for multiple applicationon a given experimental setup. Although processing power hasbeen increasing continuously, the extensive bandwidth neededfor radiofrequency (RF) sampling often remains beyond thegeneral purpose hardware. On the other hand, most RF signalare narrowband and do not require full bandwidth sampling,so a common trend is to use an analog frontend with anamplifier and a mixer with a local oscillator to provide a zero-intermediate frequency (IF) configuration. We consider herethe use of such a configuration in the context of time andfrequency metrology signal processing, and most significantlyconsider the software environment needed to implement theassociated processing algorithm, both from application anda teaching considerations since the skills for applying theseconcepts are mostly lacking.
II. FMCW RADAR FOR PASSIVE WIRELESS SENSORMONITORING
Acoustic transducers [4]have been demonstrated to berelevant alternatives to silicon-based radiofrequency identifi-cation tags (RFID) when harsh environments (temperaturesabove CMOS operating range) or long interrogation ranges (nothreshold on the received power in the case of piezoelectricsubstrate) are needed. By patterning electrodes on singlecrystal substrates, a delay line configuration aims at providinga simple means to convert the incoming electromagnetic signalto a mechanical wave whose propagation velocity on thesurface of the substrate is dependent on the physical propertyunder investigation [5]. Through direct piezoelectric effect, thepulse reflected on a mirror patterned on the substrate generatesa returned electromagnetic signal: the purpose of the readoutunit is to allow for a measurement of this time of flight inorder to recover the physical quantity value [6].
A classical pulsed-mode RADAR approach requires largemeasurement bandwidths B in order to achieve time resolution1/B: typical pulse widths and maximum time of flight dura-tions are respectively 100 ns and 5 µs, so that B > 10 MS/sis needed. Although the pulsed mode, wideband RADARapproach provides some significant range and measurementspeed advantages, a simpler approach has been favored inthe literature through the use of the frequency-modulatedcontinuous wave (FMCW) RADAR approach [7]. In the lattermethod, a local oscillator frequency f is linearly swept alonga bandwidth B within the bandpass function of the acousticdelay line. The time delayed returned τ signal is mixed andlow pass filtered with the local oscillator, so that a beat signal∆f(τ) = f(t) − f(t + τ) is recorded after removal of thecarrier. The resulting architecture is simple and only requireslow frequency sampling rates, but also introduces multiple freeparameters which are best tested in a software defined radioapproach. Among the parameters are the central operatingfrequency f and the sweep rate T : ∆f(τ)/τ = B/T sincethe frequency band B is swept linearly over a duration T .
Recently, a tutorial has been presented on the MIT Open-CourseWare web site [8] demonstrating a basic FMCW ap-proach: this hardware platform is used as the starting point ofthis experiment, although the linear RF oscillator sweep andrecording a no longer performed by dedicated hardware butby a personal computer sound card running GNURadio (http:
//gnuradio.org/). The recorded signals are Fourier transformedin real time in order to display the multiple echoes returnedby the acoustic delay line ∆f(τi) with i an index of the echonumber. In the case of the transducer we have experimentedwith – available from the Carithian Tech Research (CTR,Villach, Austria), i ∈ [1..8].
PA
VCO
antenna antenna
LNA
audio beat freq.
100 MHz
EZCAP
DVB receiver
output
sound card1 kHz triangle
2400−2470 MHz
delay line sensor
NCO
GNURadio
software defined radio
FFT
time
frequency
df
dt
traveltime dt dF
dT
dF
dT=df
dt
∆ f
sensor echoes
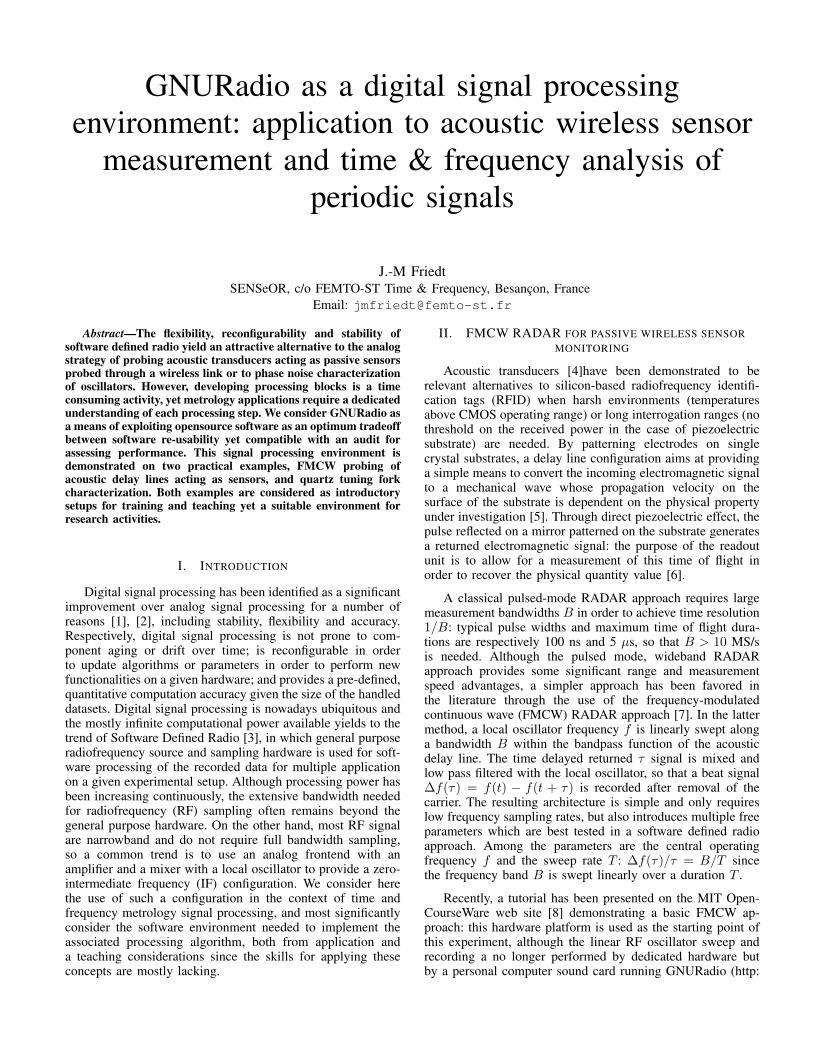
Fig. 1. Top: schematic diagram of the FMCW RADAR used to demonstrateprobing a 2.45 GHz acoustic delay line acting as passive, wireless sensor.The RF hardware is based on the MIT design [8], while the signal source(triangle-shaped Voltage Controlled Oscillator – VCO – control signal) andsink (beat frequency recording and Fourier transform) are performed usingthe GNURadio software. Since the recording by an DVB receiver requires aninput signal higher than 100 MHz, the audio beat signal is mixed with a fixedfrequency oscillator to reach the requested frequency band. Bottom: real timedisplay of the 8 echoes observed as 8 discrete frequency components of thebeat signal.
Fig. 1 exhibits a screenshot of the monitored signal, inwhich the 8 delay line echoes are well resolved as 8-discretebeat frequencies. The software defined signal source – here alinear sweep on the output sound card – provides the flexibilityto compensate for the RF oscillator non-linear frequencyoutput with respect to the control voltage: this linearity onthe whole range B is mandatory for all contributions to thebeat signal to add coherently. Lack of linearity of the RFoscillator yields a given delay τ to induce variable ∆f(τ) asthe oscillator is swept and hence a broadening of the returnedsignal beat frequency peaks. This aspect is well demonstratedwith the software defined radio as well.
For teaching purposes, the two options available to uswhen using widely available, commercial off the shelf analogto digital converters, are a sound card and a Digital VideoBroadcast (DVB) receiver, both acting as dual I and Q channel
data streams. The sound card is a high resolution analog todigital converter (typically 16 bit at least) but only provides abandwidth up to 48 kHz (96 kHz sampling rate), while internalanti-aliasing filters prevent the monitoring of higher frequencysignals. Since the CTR-delay line requires a bandwidth of atleast 30 MHz and the time delay is in the 5 µs range, thesweep rate T must be T < B×τ
∆f(min) or in this case 3.125 ms.An output frequency of 320 Hz is well within the bandpassof a soundcard output. Alternatively, higher refresh rates areachieved by sweeping the frequency source at a faster rate,hence also improving the frequency detection resolution since∆f becomes larger for a given delay τ . Since the sound cardis no longer an option at higher signal frequencies and theDVB receiver only operates above 100 MHz, a frequencytransposition strategy is used to bring the monitored signalin the 100 MHz range (mixing with a local quartz oscillator)before the DVB receiver demodulates the signal and providesthe I/Q datastream.
III. TIME & FREQUENCY METROLOGY ALGORITHMPROTOTYPING AND ASSESSING HARDWARE LIMITATIONS
Software implementation of classical analog signal pro-cessing methods are best suited for rapid prototyping [2].While frequency counting is intrinsically a digital method,its software implementation easily demonstrates the gains andinfluence on the statistics of various strategies (direct counter,reciprocal counter, sliding average functions [9], [10]). Morechallenging is the phase noise measurement [11]–[14], whichis classically performed by mixing the test oscillator with areference local oscillator and low-pass filtering the beat signal,possibly providing a feedback control signal for the localoscillator to track the measured oscillator frequency if longterm drift is compensated for (statistics on the control signalrather than on the beat signal output itself). All these blocksare implemented as software, but the influence on the phasenoise spectra as a function of the digital hardware performanceoften remains challenging to assess [15] .
Efficient processing of the narrowband signals consideredremains a challenging aspect of the data acquisition chain:under the assumption that the oscillator under investigationis stable, sampling is not needed to meet the Shannon criteriaunder the hypothesis that only a narrow band around the carrierfrequency holds the needed information. One such considera-tion yields to the fact that aliasing on purpose the measuredsignal to only meet the analyzed bandwidth – without theability to reconstruct the whole signal – is enough, yet theimpact on the noise level is still under consideration.
cossinlo(t)
Q
I
s(t) ADC
implementation
digital
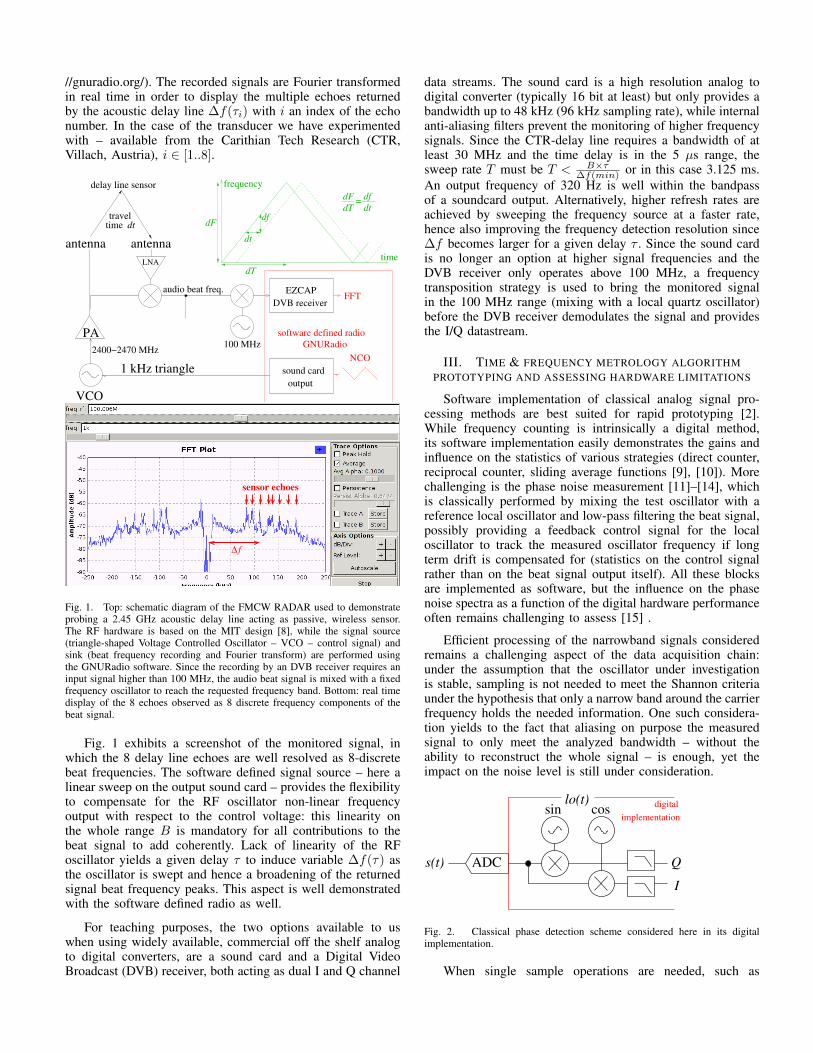
Fig. 2. Classical phase detection scheme considered here in its digitalimplementation.
When single sample operations are needed, such as
I/Q demodulation in which a local numerically controlledoscillator (NCO, described in the GNURadio source treein gnuradio-core/src/lib/general/gr_nco.h) ismixed with the incoming signal, no stream handling function-ality is needed. However, the data block size is not known anddata are transmitted from one block to another asynchronously.If a minimum number of data is needed to perform a givenprocessing step, e.g a Fourier transform, data are accumulatedin a temporary array which is processed only once filled. Thebuffer is then freed of the processed data and the remainingvalues are moved to the beginning of the buffer to be processedwith the next batch of data.
Phase noise analysis is the most basic processing tool forcharacterizing an oscillator stability. Many schemes have beendevised using analog electronics, most classically mixing theoscillator output under investigation with a local oscillatorassumed to exhibit better stability, low pass filtering the mixeroutput to get rid of the signal at the sum of the frequencies, andcontrolling the reference oscillator in order to keep the quadra-ture condition at the mixer so that sin(ϕ) ' ϕ. In order toimplement such a scheme digitally and use at best digital signalprocessing – flexibility in setting the local oscillator frequency,low pass filter characteristics and phase noise extraction – weassess the number of bits on which the computation has tobe performed to comply with the targeted resolution. Let usassume, to justify this calculation, that we aim for phase noiseresolution calculations reaching -180 dBrad2/Hz (Fig. 3).
The phase noise Sϕ defines the phase fluctuations σϕ in agiven bandwidth BW :
Sϕ = σ2ϕ/BW rad2/Hz
Considering the phase noise at carrier offset 1 to 10 MHzand 1000 points/decade, BW = 9 kHz in such conditions.Sϕ is usually expressed in dB with SdB = 10 log10(Sϕ). Theclassical scheme of mixing the sine wave translates, in termsof digital computation [16], [17], into a product of the localnumerically controlled oscillator LO and sampled signals fromthe oscillator under investigation s, followed by a low passfilter which we here consider to be a finite impulse response(FIR) filter with coefficients an:
I,Q =1
N
∑N
sk × LOk × aN−k
where I,Q are the in-phase and quadrature coefficients ob-tained from two expressions of the local oscillator phaseshifted by 90o (i.e. expressed as cos and sin). From these twosets of coefficient, the phase is classically expressed as theargument of the complex I + jQ or ϕ = arctan(Q/I).
In the low pass filter expression, the sum yields a standarddeviation rising as
√N for samples affected by an additive
gaussian noise, and the 1/N factor yields the classical decreaseof the standard deviation during averaging by 1/
√N . This
number of samples N is given by the ratio of the samplingfrequency fs to twice the maximum offset from the carrier atwhich phase noise is computed. Assuming a 500 Msamples/ssampling rate and a phase noise calculation at 10 MHz fromthe carrier, then N = 25.
The uncertainty of the I,Q calculation is given by thesum of the uncertainties of each term in the sum: dI,Q =
1N
∑N ds×LO× aN−k + dLO× s× aN−k + da×LO× s.
If only quantization noise is considered when representinginformation on M bits, then all infinitesimal terms are equalto 2−M and each quantity is assumed to have been scaled tobe around unity, so that this uncertainty on the computationof I and Q are dominated by 3× 2−M/
√N since the sum of
the independent noise source rises as√N . We then target a
given phase noise floor SdB expressed in dB, then√BW × 10SdB/10 = 3/
√N × 2−M
⇔M = − ln2
(√N ·BW × 10SdB/10
)/3
Keeping the previous assumption of B = 500 MHz anda targeted phase noise plot up to a 10 MHz offset from thecarrier hence requiring N = 25, computation on 26 bits isneeded to reach the targeted resolution of -180 dBrad2/Hz.Even at -160 dBrad2/Hz, M = 23 bits are needed to reach therequested computation resolution. The sum of three sourcesof noises rises the resolution need by 1.6 bits: if the filtercan be tuned in order to prevent resolution uncertainty on itscoefficients (da = 0) and if a square wave is used instead ofthe sine wave defining the NCO (dLO = 0), then the neededresolution becomes 25 and 21 bits respectively. However, theuse of a square wave NCO brings new challenges includingthe rejection of unwanted harmonics and its aliases after themixing step, while making sure than none of these aliases arebrought back within the band of interest [18], [19].
0
0.05
0.1
0.15
0.2
0.25
32745 32750 32755 32760 32765 32770 32775-1.5
-1
-0.5
0
0.5
1
1.5
2
magnitude (
a.u
.)
phase (
a.u
.)frequency (Hz)
resistor (20 kΩ)
tuning fork
inputaudio
audiooutput
heating
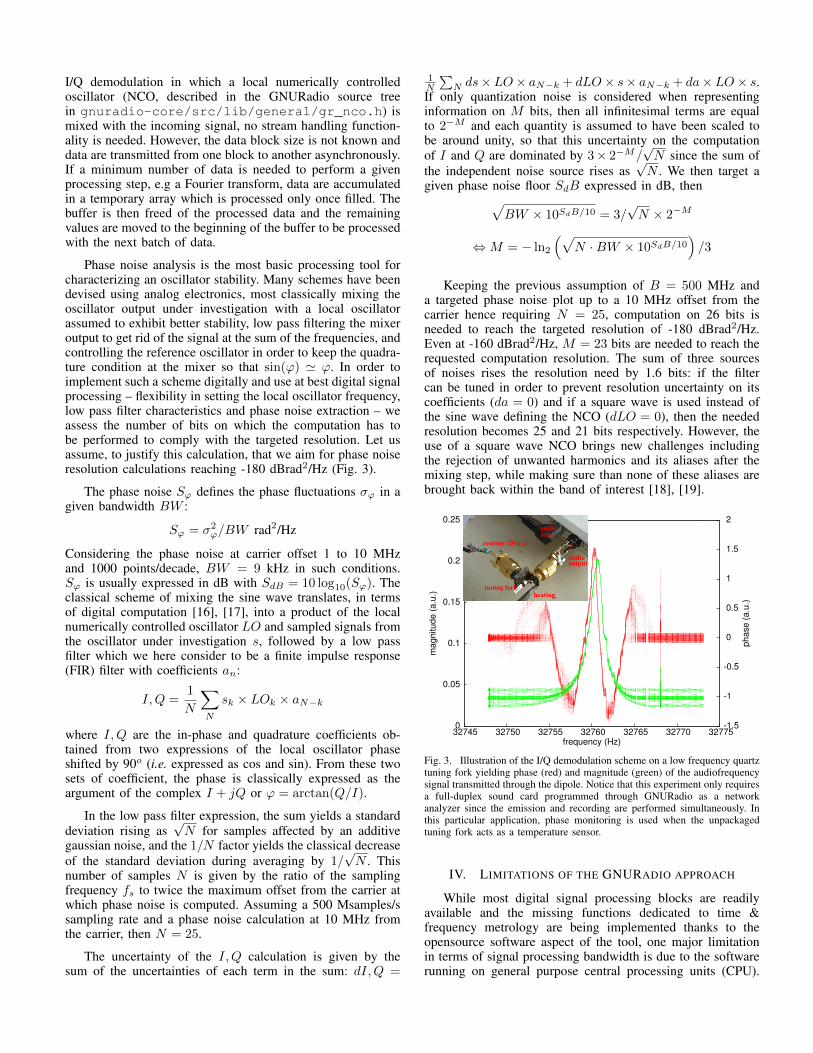
Fig. 3. Illustration of the I/Q demodulation scheme on a low frequency quartztuning fork yielding phase (red) and magnitude (green) of the audiofrequencysignal transmitted through the dipole. Notice that this experiment only requiresa full-duplex sound card programmed through GNURadio as a networkanalyzer since the emission and recording are performed simultaneously. Inthis particular application, phase monitoring is used when the unpackagedtuning fork acts as a temperature sensor.
IV. LIMITATIONS OF THE GNURADIO APPROACH
While most digital signal processing blocks are readilyavailable and the missing functions dedicated to time &frequency metrology are being implemented thanks to theopensource software aspect of the tool, one major limitationin terms of signal processing bandwidth is due to the softwarerunning on general purpose central processing units (CPU).
Although dedicated hardware provides FPGA-based data ac-quisition, the signal processing is performed on the data-flowrecovered from the FPGA and not implemented on the gatematrix itself, thus reducing the processing bandwidth to thecommunication bus bandwidth. Hence, while this environmentprovides a flexible testbench for real time prototyping ofsignal processing algorithms, it might not be suited when large(> 100 MS/s) bandwidths are considered. Alternate solutionsinclude on-purpose aliasing or stroboscopy [19], [20].
Nevertheless, we consider this environment best suited forgetting familiar with the basics of digital signal processingof RF signals, as well as for teaching purposes since thisaspect is needed to train the current and future generationof researchers interested in such a topic. The easily availablehardware (sound card, DVB receiver) and the ability to addsignal source blocks thanks to the opensource code makes thissoftware most versatile.
V. CONCLUSION
While analog implementations of most radiofrequency sig-nal processing schemes provide suitable results for RADARdetection of signals returned from acoustic sensors actingas passive sensors and for characterizing oscillator stability,the need to design new hardware for each new applicationor new frequency band is time consuming and prone to theintroduction of design errors in each new hardware setup.The flexibility of software reconfigurable processing chainsis well suited for such applications. However, the need fora detailed understanding of the methods implemented in eachprocessing block is hardly compatible with the use of closedsource software, and an opensource solution as offered by theGNURadio software suite is considered. Reaching the targetedresolution of low phase noise oscillator using a full softwareimplementation in which the RF front end is solely made of afast analog to digital converter and all further processing stepsare performed by software appears challenging with currentavailable technologies.
ACKNOWLEDGEMENTS
These activities were motivated by the Oscillator IMPLABEX grant.
REFERENCES
[1] D. Mindell, Digital Apollo: Human and Machine in Spaceflight. TheMIT Press, 2011.
[2] J. Hamkins, M. Simon, and J. Yuen, Autonomous software defined radioreceivers for deep space applications. Wiley, 2006.
[3] P. Kenington, RF and baseband techniques for software defined radio.Artech House, 2005.
[4] L. Reindl and V. Plessky, “Review on SAW RFID tags,” IEEE Trans.Ultrason. Ferroelectr. Freq. Control., vol. 57, no. 3, pp. 654–668, 2010.
[5] R. White, “Surface acoustic wave sensors,” in Proc. IEEE UltrasonicsSymposium, 1985, pp. 490–494.
[6] W.-E. Bulst, G. Fischerauer, and L. Reindl, “State of the art inwireless sensing with surface acoustic waves,” IEEE Trans. IndustrialElectronics, vol. 48, no. 2, pp. 265–271, 2001.
[7] S. Schuster, S. Scheiblhofer, L. Reindl, and A. Stelzer, “Performanceevaluation of algorithms for SAW-based temperature measurement,”IEEE Trans. Ultrason. Ferroelectr. Freq. Control., 2006.
[8] G. Charvat, A. Fenn, and B. Perry, “The MIT IAP radar course: Builda small radar system capable of sensing range, doppler, and syntheticaperture (SAR) imaging,” in IEEE Radar Conference, 2012, pp. 138–144.
[9] S. Dawkins, J. McFerran, and A. Luiten, “Considerations on the mea-surement of the stability of oscillators with frequency counters,” IEEETransactions on Ultrasonics, Ferroelectrics and Frequency Control,vol. 54, no. 5, pp. 918–925, May 2007.
[10] E. Rubiola, “On the measurement of frequency and of its samplevariance with high-resolution counters,” Rev. Sci. Instrum., vol. 76,no. 5, p. 054703, May 2005.
[11] L. Angrisani, M. D’Apuzzo, and M. D’Arco, “A digital signal-processing approach for phase noise measurement,” IEEE Transactionson instrumentation and measurement, vol. 50, no. 4, pp. 930–935,August 2001.
[12] J. Grove, J. Hein, J. Retta, P. Schweiger, W. Solbrig, and S. Stein,“Direct-digital phase-noise measurement,” in IEEE International Ultra-sonics, Ferroelectrics, and Frequency Control Joint 50th AnniversaryConference, 2004, pp. 287–291.
[13] L. Angrisani, A. Baccigalupi, M.D’Arco, and L. Ferrigno, “A newdigital signal processing method for accurate phase noise measurement,”in 11th IMEKO TC-4 Symp. – Trends in Electrical Measurement andInstrumentation, Lisbon, Portugal, September 2001, pp. 43–.
[14] V. Ivo and H. Josef, “Phase noise measurement,” in Proceedings of theRadioelektronika, 2001, pp. 131–134.
[15] L. Angrisani, M. D’Arco, C. Greenhal, and R. L. Moriello, “Real-time phase noise meter based on a digital signal processor,” in IMTC- Instrumentation and Measurement Technology Conference, Sonento,Italy, April 2006.
[16] A. Hati, D. A. Howe, F. L. Walls, and D. Walker, “Noise figure vs. PMnoise measurements: A study at microwave frequencies,” in Proc. ofthe 2003 IEEE International Frequency Control Symposium and PDAExhibition, Jointly with the 17th European Frequency and Time Forum,2003, pp. 516–520.
[17] A. Hati, D. Howe, F. Walls, and D. Walker, “Merits of PM noisemeasurement over noise figure: A study at microwave frequencies,”IEEE transactions on ultrasonics, ferroelectrics, and frequency control,vol. 53, no. 10, pp. 1889–1894, October 2006.
[18] M. Mishali and Y. Eldar, “Sub-Nyquist sampling,” IEEE Signal Pro-cessing Magazine, vol. 28, no. 6, pp. 98–124, 2011.
[19] ——, “Sub-Nyquist sampling: Bridging theory and practice,” arXiv:1106.4514v1, 2011.
[20] C. Nelson and D. Howe, “A sub-sampling digital PM/AM noisemeasurement system,” in Proc. IEEE International Frequency ControlSymposium (FCS), 2012, pp. 1–4.


![ECE-V-DIGITAL SIGNAL PROCESSING [10EC52] …vtusolution.in/.../digital-signal-processing-10ec52.pdfDigital vtusolution.in Signal Processing 10EC52 TEXT BOOK: 1. DIGITAL SIGNAL PROCESSING](https://img.dokumen.tips/doc/110x75/5afe42bb7f8b9a256b8ccd2e/ece-v-digital-signal-processing-10ec52-signal-processing-10ec52-text-book.jpg)